Variability in dissolved organic matter optical properties in surface waters in the Amerasian Basin
 Céline Guéguen
 Motoyo Itoh2
 - 1Department of Chemistry, Trent University, Peterborough, ON, Canada
- 2Research Institute for Global Change, Japan Agency for Marine-Earth Science and Technology, Yokosuka, Japan
- 3Department of Fisheries and Ocean, Institute of Ocean Sciences, Sidney, BC, Canada
Surface absorption and fluorescence measurements of Dissolved Organic Matter (DOM) were conducted along with hydrographic parameters in the Amerasian and Makarov Basins. Parallel factor analysis of DOM fluorescence identified four humic-like and one protein-like component in all 107 surface samples. Based on strong negative trends observed between the spectral slope in the 275–295 nm range and absorption at 370 nm, and four humic-like components C1–4, the DOM character was found to be basin-dependent. The Makarov Basin surface DOM was largely dominated by high molecular weight and humic-rich material whereas the Canada Basin surface DOM was more heterogeneous with a marked influence of in situ production. This study highlights that absorbing and fluorescing measurements can be used successfully to trace and differentiate DOM from diverse sources and across frontal zones, and as such can be convenient and complementary tools for the better understanding of marine biogeochemical cycling of carbon.
Introduction
Colored dissolved organic matter (CDOM) is one of the major light attenuating components of natural waters: it is responsible for much of the ultraviolet and visible light attenuation in the water column (Hansell and Carlson, 2002). CDOM also plays an important role in the solubility of essential elements such as iron and copper in natural waters (e.g., Chen et al., 2013; Heller et al., 2013; Uchida et al., 2013). The optical properties of CDOM have been previously used to discriminate between terrestrial and marine DOM sources (Blough and Del Vecchio, 2002; and references therein) and to trace the mixing of terrestrially derived DOM in oceanic waters (e.g., Amon et al., 2003; Guéguen et al., 2011; Stedmon et al., 2011; Fichot et al., 2013). For example, the absorbance properties of CDOM have been used to differentiate the surface to 300 m waters of the Canada and Eurasian Basins (Stedmon et al., 2011). More recently the application of fluorescence excitation emission matrices (EEMs) with a multivariate statistical analysis such as parallel factor analysis (PARAFAC; Stedmon and Bro, 2008) allowed us to discriminate the main fluorescing components in the fluorescing DOM (FDOM) pool and to assess their dynamics in marine waters (Ishii and Boyer, 2007; Stedmon et al., 2007; Murphy et al., 2008; Walker et al., 2009; Yamashita et al., 2010; Jørgensen et al., 2011; Guéguen et al., 2011, 2012; Dainard and Guéguen, 2013).
The Arctic Ocean basin represents ~4% of global ocean area and receives approximately 2.5 times more inflow per unit area than the world average. This disproportionate share of global river discharge into the Arctic Ocean and the high dissolved organic carbon concentrations in arctic rivers (up to 1600 μM; Stedmon et al., 2011; Amon et al., 2012) highlight the importance of freshwater and terrestrial organic matter in the biogeochemical cycles of the Arctic Ocean. However, there is a limited amount of data available on how this allochthonous DOM mixes with autochthonous marine DOM.
The general circulation in surface oceanic waters in the western Arctic Ocean is dominated by two main water masses: saline Atlantic water, entering through eastern Fram Strait and the Barents Sea, flows eastward following the Arctic continental margin where Eurasian river runoff is incorporated; and fresher Pacific-derived waters entering through Bering Strait and modified in the Chukchi Sea and Mackenzie River-influenced Beaufort shelves. The Pacific-Atlantic boundary in the Arctic Ocean delineates the extent of the Pacific-origin water, and thus where the saltier Atlantic-origin water must subduct beneath the Pacific Water. Eurasian river water has been reported in the Beaufort Gyre (Yamamoto-Kawai et al., 2009) and Pacific-origin water has recently been found in the surface layer of the North Pole (Alkire et al., 2007, 2010). Historically, this boundary lies along the Lomonosov Ridge, at the boundary between the Eurasian and Amerasian Basins of the Arctic Ocean (Jones and Anderson, 1986; Anderson et al., 1994), but recent studies have showed Atlantic character in the Makarov Basin that lies in the northern Amerasian Basin (i.e., Makarov and Canada Basins) between the Lomonosov Ridge and the Alpha-Mendeleyev Ridge (Guay et al., 1999; Nishino et al., 2008, 2013; Guéguen et al., 2012). This part of the ocean is largely under-sampled which makes difficult to assess the presence of such a a barrier that constrains transfer of heat, solutes, and plankton (Guéguen and Kowalczuk, 2013; and references therein).
Here we report spectral absorbance and fluorescence properties of surface water samples collected along transects from waters in the Amundsen Gulf across the Canada Basin to the Makarov Basin and back again. Our aim is to provide insight on sources and mixing of CDOM and FDOM in surface waters (i.e., terrestrial, marine and in-situ production) and thus improve our understanding of the biogeochemical cycling of carbon in the ocean.
Materials and Methods
Sample Collection
Surface water samples were collected from 107 sites located between the Canadian Arctic coast and the Lomonosov Ridge during August 21-September 27, 2011, on board the icebreaker Canadian Coast Guard Ship Louis S. St-Laurent (Figure 1) during the Natural Resources Canada expedition to assess sovereignty rights in the deep Arctic Ocean as required by the United Nations Convention on the Law of the Sea (UNCLOS). Samples were collected from the water intake line (depth ~10 m) every 6 h when steaming. In-situ measurements of temperature and conductivity were obtained by a Seabird electronics SBE-21 probe mounted on the sampling line inside the icebreaker. In situ fluorescence chlorophyll Chla (WETStar fluorometer) and FDOM (WETLabs ECOFLD 370 nm excitation, 460 nm emission; Guéguen et al., 2012) sensors were also mounted on the intake line. In-situ measurements were conducted every 5 s and 1-min-averaged during post-processing. Samples collected for absorbance and fluorescence analysis were immediately stored in pre-combusted amber-glass vials with little to no headspace at 4°C until the analysis is performed. All samples were measured within 6 months of collection. The preservation and storage conditions used in this study may have favored microbial activities (Spencer and Coble, 2014; and reference therein). For example, Baker et al. (2007) reported a significant decrease (mean 58%) in protein-like fluorescence when samples were not filtered. The in situ FDOM sensor was linearly correlated with a370, and humic like components C2 and C3 (described below) measured in discrete samples (r2 = 0.80, 0.66, and 0.67, respectively; n = 107). Additionally, the survey was augmented by expendable CTD (XCTD; Lockheed-Martin-Sippican) deployment.
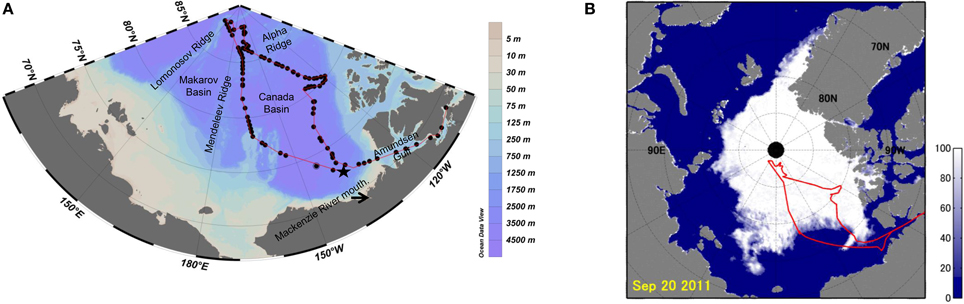
Figure 1. (A) Transect occupied by the CCGS Louis S.St-Laurent (−) and discrete sampling locations (∙). The start of the section shown in Figure 2B is represented by a star. (B) Arctic ice concentrations from Advanced Microwave Scanning Radiometer—Earth Observing System (AMSR-E) for the September 20th, 2011.
Absorbance Analysis
CDOM absorbance measurements of the collected water samples were made on a Shimadzu UV 2550 spectrophotometer over a wavelength region of 260–700 nm with a 10-cm quartz cuvette using Milli-Q water as a reference. In order to correct for instrumental drift and light scattering, an offset correction was applied by subtracting the average absorbance between 650 and 700 nm from the Milli-Q absorbance spectrum (Green and Blough, 1994; Guéguen et al., 2006, 2012). The measured absorbance at wavelength λ was converted to the absorption coefficient a (m−1) according to the relationship:
where Aλ is the absorbance and L is the path-length of the optical cell in meters (here 0.1 m). The slope parameter S, a proxy for molecular weight (Helms et al., 2008), was calculated over a range of 275–295 nm (S275−295; Helms et al., 2008) using non-linear least squares fitting procedures in Matlab. An increase in S275−295 is indicative of decreasing aromaticity and molecular weight of the CDOM (Helms et al., 2008). S calculated over the 300–650 nm range (S300−650; Stedmon and Markager, 2001; Retamal et al., 2007; Hancke et al., 2014) was used to compare previous mixing models (Stedmon and Markager, 2001; Hancke et al., 2014).
Fluorescence Analysis
Samples were warmed to room temperature and then analyzed with a Horiba Jobin-Yvon fluorometer (FluoroMax4) using a 1-cm quartz cuvette with excitation and emission slit widths each set to 5 nm. The quartz cuvette was checked for cleanliness between each sample at excitation wavelengths of 270 and 350 nm. The excitation-emission matrix (EEM) of each sample was recorded in signal-to-noise mode by collecting a series of emission wavelengths ranging from 250 to 600 nm at excitation wavelengths ranging from 300 to 450 nm, both in 5-nm increments. The post processing steps included: correction of instrument bias using the correction files provided by the manufacturer, subtraction of the EEM of Milli-Q water, and finally the fluorescence intensity was corrected to the area under the Milli-Q water Raman peak (excitation 350 nm) run daily (Lawaetz and Stedmon, 2009). No significant variation in the integral of the Raman peak was observed during the investigation (1.2%). The fluorescence intensity was reported in equivalent water Raman units (r.u.). The Raman normalization is independent of the instrument design (Nelson and Coble, 2009; and references therein), allowing comparison with other studies.
PARAFAC decomposes the complex mixtures of FDOM fluorophores into their main components (Stedmon et al., 2003). PARAFAC analysis was carried out in Matlab using the DOMFluor toolbox (Stedmon and Bro, 2008), and outlier identification was performed using the OutlierTest function included therein. No samples with extreme leverage were found, indicating no extreme, and potentially outlying, EEMs in the dataset. Determination of the most suitable number of components was achieved by the split-half analysis and random initialization (Stedmon et al., 2003) whereby both halves were successfully validated. The model was constrained to non-negative values, and no systematic residual was found in the modeled EEMs. The spectra of the cross validated PARAFAC components were compared with those reported in earlier studies through online repository of published PARAFAC components (Murphy et al., 2014). The similarity of components was statistically identified as having Tucker congruence exceeding 0.95 (Murphy et al., 2014). The percent contribution of a given component was calculated as the ratio of the given component fluorescence intensity to the total humic component fluorescence intensity [i.e., C1% = C1/(C1 + C2 + C3 + C4)].
Results and Discussion
Salinity, Temperature, In situ FDOM, and CDOM Distributions
A marked frontal zone characterized by significant changes in physical and chemical characteristics was observed at latitude around 83°N (Figures 2, 3), coinciding with the latitude of the Alpha-Mendeleev Ridge that separates the Makarov and Canada Basins. Intrusion of warm Pacific Summer Waters around 50 m and halo-stad around 50–125 m due to Pacific Summer and Winter Waters were found in the southern part of the UNCLOS area (< 83°N; Figure 2). In contrast, higher latitude waters (>83°N) were ice covered (98.9 ± 1.8%; Figure 1A), colder (< -1.5°C) and saltier (>30; Figure 2), indicative of a stronger influence of Atlantic-origin water. The front at 83°N seems to be related to boundary of Atlantic and Pacific waters.
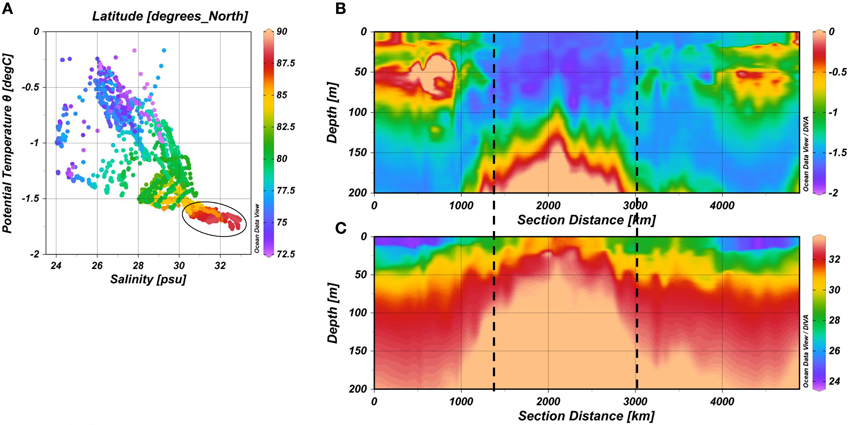
Figure 2. Potential temperature (°C) and salinity (psu) from XTCD profiles along the cruise track in the top 30 m (A) and 200 m (B,C). The dotted lines represent the frontal zone (latitude 83°N).
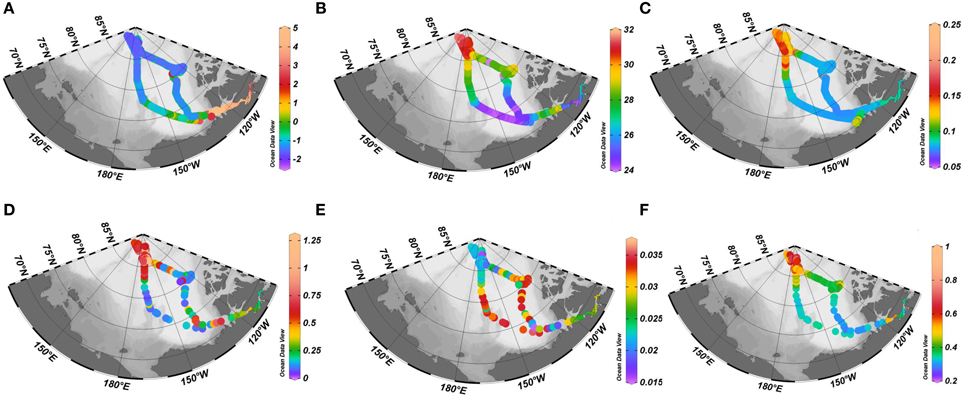
Figure 3. Surface distributions of (A) temperature (°C), (B) salinity (psu), (C) FDOMWETLabs (in volt), (D) a370 (m−1) (E) S275−295(nm−1), and (F) fluorescence Chla (mg/m3).
Surface distribution of salinity, temperature, FDOMWETLabs, a370 S275−295 and Chla (Figure 3) showed contrasting characteristics across the frontal zone. The higher salinity (30.8 ± 0.3) observed north of 83°N suggest source waters of Atlantic origin while the high FDOMWETLabs signal (0.14 ± 0.01 V), high a370 values (0.70 ± 0.15 m−1) and low S275−295 (0.0215 ± 0.001 nm−1) reflect contribution from Eurasian Arctic rivers (Guay et al., 1999). Indeed, river influenced waters are typically enriched in larger molecular weight (low S275−295; Helms et al., 2008) and humic-rich DOM (higher a370). The near freezing temperature (−0.75 ± 0.53°C) north of 83°N reflects the presence of sea ice (Figure 1B). The >83°N region was also characterized by high Chla levels (>0.5 mg/m3). Nishino et al. (2013) have reported higher Chla in the Makarov Basin than in the Canadian Basin, likely due to sea ice retreat and shallower nutricline. On the other hand, the lower salinities were observed south of 83°N in the Canada Basin and the lowest salinities (as low as 24) were found in the central Canada Basin. These low salinities reflecting the contribution of sea ice melt and river inflow (Carmack, 1990; Yamamoto-Kawai et al., 2009). The highest S275−295 values (0.025–0.034 nm−1) coupled with lower FDOMWETLabs (~0.8 V) and a370 values (0.07–0.17 m−1) were found in the central Canada Basin (latitudes 72–83°N). The presence of lower molecular weight (high S275−295) and less humified DOM is expected to primarily be the result of dilution of allochthonous CDOM (Granskog, 2012). Similar S275−295 ranges were previously measured in the Arctic Ocean (Dainard and Guéguen, 2013; Fichot et al., 2013). The warmer (>0°C) and saltier waters (Salinity ~28) encountered in Amundsen Gulf were also characterized by low FDOMWETLabs values, medium to high a370 values and low S275−295. These values are indicative of river influence, but this will not be the Mackenzie River in 2011 as winds were easterly for the entire summer and fall which pushes the Mackenzie River water toward the west and offshore into the central Canada Basin (Yamamoto-Kawai et al., 2010).
FDOM Characterization and Distribution
Based on the PARAFAC modeling of EEM, five independent fluorescent components (C1–C5) were successfully validated. Their spectral characteristics were similar to components identified in previous studies (Figure 4; Figure S1). Components C1–C4 were characterized as humic-like, as they displayed an emission maximum around and above 400 nm. Components C1 and C4 showed an intensive peak at 285–305 nm excitation and 390–415 nm emission which was similar to the marine humic-like peak M traditionally defined (Coble, 1996). In recent studies, peak M has also been shown to be evident in DOM that has been altered by microbial reprocessing (Stedmon and Markager, 2005; Yamashita et al., 2008). Similar components were found in coastal and marine waters (Søndergaard et al., 2003; Yamashita et al., 2011; Dainard et al., 2015; Figure S1). The spectral features of C2 were similar to a component reported as humic-like peak A + M (Coble, 1996). Component C3 was assigned as the traditional humic-like peak A + C (Coble, 1996) which is usually considered to be representative of fluorophores in terrestrial environments (Ishii and Boyer, 2007) and found in ocean waters (Søndergaard et al., 2003; Stedmon and Markager, 2005; Murphy et al., 2006, 2008; Stedmon et al., 2007; Walker et al., 2009; Kowalczuk et al., 2013; Brym et al., 2014). Component C5 was classified as protein-like since it displayed an emission maximum below 400 nm. This component was similar to those of a tyrosine-like component found in previous PARAFAC studies (Stedmon et al., 2007; Walker et al., 2009; Osburn and Stedmon, 2011; Cawley et al., 2012; Yamashita et al., 2013; Bianchi et al., 2014; Dainard et al., 2015; Figure S1). As the samples were unfiltered, microbes could have altered the protein-like fluorescence via consumption of the original labile DOM and/or production of new protein-like fluorescence. Therefore, only results from the humic like components (C1–C4) were used for further data analysis in this study.
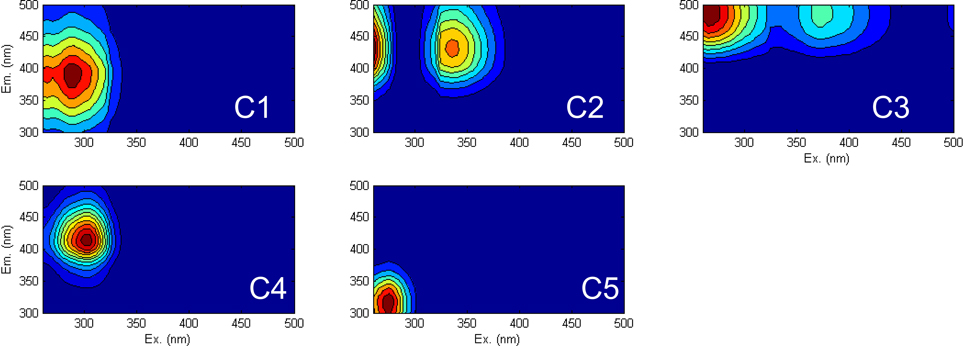
Figure 4. Spectral characteristics of 5-component model for surface arctic water dataset (N = 107). The greatest intensities are shown in red.
Strong humic-like C1–C4 signals were associated with the >83°N region (Figure 5). In terms of compositional distribution, microbially derived humic-like C1 was more abundant at intermediate latitudes in ice-edge (Figure 1B) and productive (Chla ~0.4 mg.m−3; Figure 3F) waters (75–83°N) than in the >83°N region (32.4 ± 11.3 vs. 25.4 ± 8.7%; Figure 6A). Greater abundance of microbially derived C1 agrees well with a more efficient microbial loop in the ice-edge bloom regions (Stanley et al., 2015). This contrasts with microbially derived C4 which was abundantly found in the >83°N region (15–20%; Figure 6D) and near the Mackenzie coast and in the Amundsen Gulf (>40%; Figure 6D). Unlike the >83°N region, the coastal region (i.e., Mackenzie coast and Amundsen Gulf) was however not associated with high chla (Figure 3F), suggesting that C4 was not always derived from freshly produced DOM. Humic-like C2–C3 (Figures 6B,C) showed higher abundances in the >83°N region (~15–32%;) and along the western transect (~20–32%).
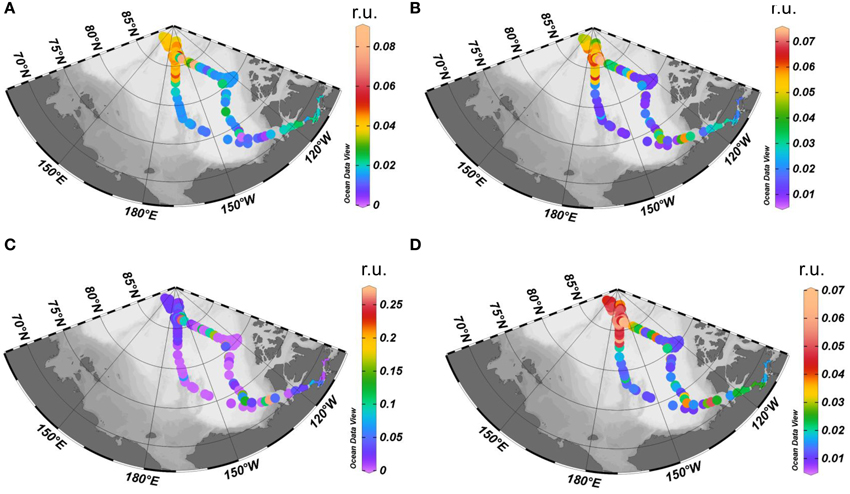
Figure 5. Spatial distributions of (A–D) humic-like C1–C4.
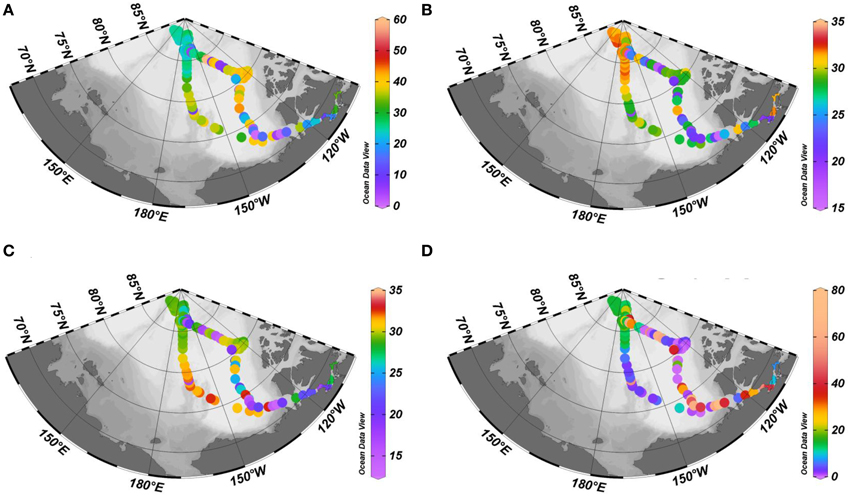
Figure 6. Relative abundance of (A–D) humic-like C1–C4.
Mixing Processes
In marine environment, autochthonous CDOM can be discriminated from allochthonous CDOM by the relationship between spectral slope parameter and absorption coefficient (Stedmon and Markager, 2001). In our study, a significant inverse relationship was apparent between S300−650 and a370 (Figure 7A), congruent with previous studies in the Arctic Ocean (>100 m of depth; Stedmon et al., 2011), the Fram Strait (Granskog et al., 2012), and the Greenland and North Seas (Stedmon and Markager, 2001; Hancke et al., 2014). This contrasts with coastal waters (i.e., high terrestrial input) where S was shown to be independent of CDOM absorption coefficient (Babin et al., 2003). The majority of the points from >83°N waters had S300−650 values around 0.019 nm−1 and deviated from the Stedmon and Markager (2001) model (thick line), likely the result of differences in DOM characteristics between Greenland/North Seas and western Arctic Ocean. S275−295 was also used instead of S300−650 as a better precision can be obtained in oceanic waters over the wavelength range 275–295 nm (Helms et al., 2008). A stronger relationship of S275−295 vs. a370 was obtained compared to S300−650 vs. a370 (r2 = 0.85 vs. 0.65, n = 107). However, this study, for the first time, reports a strong relationship between S275−295 and FDOM (i.e., C2, r2 = 0.86; C3, r2 = 0.85; Figures 7C,D), suggesting mixing processes affecting C2 and C3 intensities in surface water.
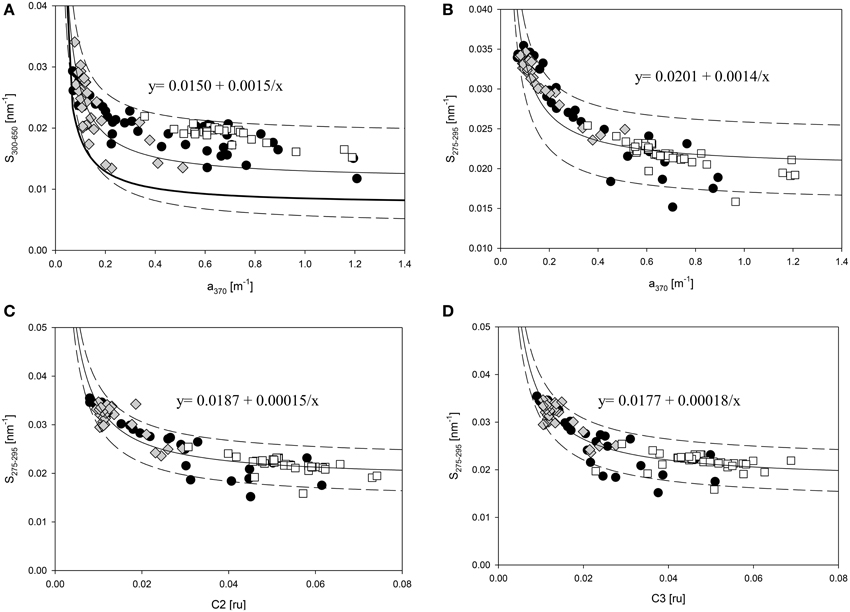
Figure 7. CDOM spectral slopes (A) S300−650 against a370, and S275−295 against (B) a370, (C) C2 and (D) C3 in surface arctic waters (□ > 83°N region, ♦75-83°N region, and ∙ < 75°N region). The bold and thin lines represent the model for Greenland and North Seas (Stedmon and Markager, 2001) and Arctic Ocean (This study), respectively. The dotted lines correspond to the 95% prediction band for the Arctic Ocean model.
The behavior of CDOM and humic-like C2 and C3 was successfully modeled. Using Figure 7, one can clearly identify two different CDOM and FDOM pools: DOM from >83°N, with an invariant S-value pool (S275−295 = 0.0216 ± 0.0017 nm−1), mixing with central Canada Basin waters (75–83°N) with mean S275−295 of 0.0312 ± 0.0031 nm−1. Together these results show that the surface waters in the Canada and Makarov Basins differ significantly in composition.
Summary
This study shows that the combination of absorbance and fluorescence spectroscopies and multivariate statistics (i.e., PARAFAC) can be used to examine the source and mixing processes of DOM in the Canada and Makarov Basins. The presence of a frontal zone at latitude ~83°N was evidenced by marked changes in S275−295 and a370 values and intensity and contribution of four humic-like PARAFAC components. High molecular weight (i.e., low S275−295) DOM, dominated by terrestrially derived humic-like material, in the Makarov Basin was replaced by lower molecular weight DOM, with a reduced terrestrial character, in the Canada Basin. The CDOM and FDOM pools were concluded to be the result of mixing of two dominant sources (i.e., Eurasian and Central Canada Basins).
Conflict of Interest Statement
The authors declare that the research was conducted in the absence of any commercial or financial relationships that could be construed as a potential conflict of interest.
Acknowledgments
Funding for this study was provided by the Canada Research Chairs program and the Natural Sciences and Engineering Research Council of Canada (CG). We would like to acknowledge Baptiste Marcere for assistance in the sample analysis. We are also grateful to the Captain, crew and scientists from the CCGS Louis S. St-Laurent during UNCLOS2011 for their help with sampling.
Supplementary Material
The Supplementary Material for this article can be found online at: https://www.frontiersin.org/article/10.3389/fmars.2015.00078
References
Alkire, M. B., Falkner, K. K., Morison, J., Collier, R. W., Guay, C. K., Desiderio, R. A., et al. (2010). Sensor-based profiles of the NO parameter in the central Arctic and southern Canada Basin: new insights regarding the cold halocline. Deep Sea Res. I, 57, 1432–1443. doi: 10.1016/j.dsr.2010.07.011
Alkire, M. B., Falkner, K. K., Rigor, I. G., Steele, M., and Morison, J. (2007). The return of Pacific waters to the upper layers of the central Arctic Ocean. Deep Sea Res. I, 54, 1509–1529. doi: 10.1016/j.dsr.2007.06.004
Amon, R. M. W., Budeus, G., and Meon, B. (2003). Dissolved organic carbon distribution and origin in the Nordic Seas: exchanges with the Arctic Ocean and the North Atlantic. J. Geophys. Res. Oceans 108, 14-1–14-17. doi: 10.1029/2002jc001594
Amon, R. M. W., Rinehart, A. J., Duan, S., Louchouarn, P., Prokushkin, A., Guggenberger, G., et al. (2012). Dissolved organic matter sources in large Arctic rivers. Geochim. Cosmo. Acta 94, 217–237. doi: 10.1016/j.gca.2012.07.015
Anderson, L. G., Bjork, G., Holby, O., Jones, E. P., Kattner, G., Koltermann, K. P., et al. (1994). Water masses and circulation in the Eurasian Basin: results from the Oden 91Expedition. J. Geophys. Res. 99, 3273–3283. doi: 10.1029/93JC02977
Babin, M., Stramski, D., Ferrari, G. M., Claustre, H., Bricaud, A., Obolensky, G., et al. (2003). Variations in the light absorption coefficients of phytoplankton, nonalgal particles, and dissolved organic matter in coastal waters around Europe. J. Geophys. Res. 108, 3211. doi: 10.1029/2001JC000882
Baker, A., Elliott, S., and Lead, J. R. (2007). Effects of filtration and pH perturbation on freshwater organic matter fluorescence. Chemosphere 67, 2035–2043. doi: 10.1016/j.chemosphere.2006.11.024
Bianchi, T. S., Osburn, C., Shields, M. R., Yvon-Lewis, S., Young, J., Guo, L., et al. (2014). Deepwater horizon oil in Gulf of Mexico Waters after 2 years: transformation into the dissolved organic matter pool. Environ. Sci. Technol. 48, 9288–9297. doi: 10.1021/es501547b
Blough, N. V., and Del Vecchio, R. (2002). “Chromophoric DOM in the coastal environment,” in Biogeochemistry of Marine Dissolved Organic Matter, eds Hansell, D., Carlson, C. (New York, NY: Academic Press), 509–546. doi: 10.1016/b978-012323841-2/50012-9
Brym, A., Paerl, H. W., Montgomery, M. T., Handsel, L. T., Ziervogel, K., and Osburn, C. L. (2014). Optical and chemical characterization of base-extracted particulate organic matter in coastal marine environments. Mar. Chem. 162, 96–113. doi: 10.1016/j.marchem.2014.03.006
Carmack, E. C. (1990). “Large scale physical oceanography of polar oceans,” in Polar Oceanography. Part A: Physical Science, ed Smith, W. O. (San Diego, CA: Academic Press), 171–222.
Cawley, K. M., Butler, K. D., Aiken, G. R. Larsen, L. G., Huntington, T. G., and McKnight, D. M. (2012). Identifying fluorescent pulp mill effluent in the Gulf of Maine and its watershed. Mar. Pollut. Bull. 64, 1678–1687. doi: 10.1016/j.marpolbul.2012.05.040
Chen, W., Smith, D. S., and Guéguen, C. (2013). Influence of water chemistry and dissolved organic matter molecular size on copper and mercury binding determined by multiresponse fluorescence quenching. Chemosphere 92, 351–359. doi: 10.1016/j.chemosphere.2012.12.075
Coble, P. G. (1996). Characterization of marine and terrestrial DOM in seawater using excitation-emission matrix spectroscopy. Mar. Chem. 51, 325–346. doi: 10.1016/0304-4203(95)00062-3
Dainard, P. G., and Guéguen, C. (2013). Distribution of PARAFAC modeled CDOM components in the North Pacific ocean, Bering, Chukchi and Beaufort seas. Mar. Chem. 157, 216–223. doi: 10.1016/j.marchem.2013.10.007
Dainard, P. G., Guéguen, C., and McDonald, N, Williams, W. (2015). Photobleaching of fluorescent dissolved organic matter in Beaufort Sea and North Atlantic Subtropical Gyre. Mar. Chem.
Fichot, C. G., Kaiser, K., Hooker, S. B., Amon, R. M. W., Babin, M., Bélanger, S., et al. (2013). Pan-Arctic distributions of continental runoff in the Arctic Ocean. Sci. Rep. 3:1053. doi: 10.1038/srep01053
Granskog, M. A. (2012). Changes in spectral slopes of dissolved organic matter absorption with mixing and removal in a terrestrially dominated marine system (Hudson Bay, Canada). Mar. Chem. 134–135, 10–17. doi: 10.1016/j.marchem.2012.02.008
Granskog, M. A., Stedmon, C. A., Dodd, P. A., Amon, R. M. W., Pavlov, A. K., de Steur, L., et al. (2012). Characteristics of colored dissolved organic matter (CDOM) in the Arctic outflow in the Fram Strait: assessing the changes and fate of terrigenous CDOM in the Arctic Ocean. J. Geophys. Res. 117, C12021. doi: 10.1029/2012jc008075
Green, S. A., and Blough, N. V. (1994). Optical absorption and fluorescence properties of chromophoric dissolved organic matter in natural waters. Limnol. Oceanogr. 39, 1903–1916. doi: 10.4319/lo.1994.39.8.1903
Guay, C. K., Klinkhammer, G. P., Falkner, K. K., Benner, R., Coble, P. G., Whitledge, T. E., et al. (1999). High-resolution measurements of dissolved organic carbon in the Arctic Ocean by in situ fiber-optic spectrometry. Geophys. Res. Lett. 26, 1007–1010. doi: 10.1029/1999GL900130
Guéguen, C., Granskog, M. A., McCullough, G., and Barber, D. G. (2011). Characterization of colored dissolved organic matter in Hudson Bay and Hudson Strait using Parallel Factor Analysis. J. Mar. Syst. 88, 423–433. doi: 10.1016/j.jmarsys.2010.12.001
Guéguen, C., Guo, L., Wang, D., Tanaka, N., and Hung, C.-C. (2006). Chemical characteristics and origin of dissolved organic matter in the Yukon River. Biogeochemistry 77, 139–155. doi: 10.1007/s10533-005-0806-1
Guéguen, C., and Kowalczuk, P. (2013). “Colored dissolved organic matter in frontal zones,” in Chemical Oceanography of Frontal Zones, ed Belkin, I. (Berlin: Springer-Verlag).
Guéguen, C., McLaughlin, F. A., Carmack, E. C., Itoh, M., Narita, H., and Nishino, S. (2012). The nature of colored dissolved organic matter in the southern Canada Basin and East Siberian Sea. Deep Sea Res. II, 81–84, 102–113. doi: 10.1016/j.dsr2.2011.05.004
Hancke, K., Hovland, E. K., Volent, Z., Pettersen, R., Johnsen, G., Moline, M., et al. (2014). Optical properties of CDOM across the Polar Front in the Barents Sea: origin, distribution and significance. J. Mar. Syst. 130, 219–227. doi: 10.1016/j.jmarsys.2012.06.006
Hansell, D. A., and Carlson, C. A. (2002). Biogeochemistry of Marine Dissolved Organic Matter. San Diego, CA: AcademicPress.
Heller, M. I., Gaiero, D. M., and Croot, P. L. (2013). Basin scale survey of marine humic fluorescence in the Atlantic: relationship to rion solubility and H2O2. Glob. Biogeochem. Cycle 27, 88–100. doi: 10.1029/2012GB004427
Helms, J. R., Stubbins, A., Ritchie, J. D., Minor, E. C., Kieber, D. J., and Mopper, K. (2008). Absorption spectral slopes and slope ratios as indicators of molecular weight, source and photobleaching of chromophoric dissolved organic matter. Limnol. Oceanogr. 53, 955–969. doi: 10.4319/lo.2008.53.3.0955
Ishii, S. K. L., and Boyer, T. H. (2007). Behavior of reoccurring PARAFAC components in fluorescent dissolved organic matter in natural and engineered systems: a critical review. Environ. Sci. Technol. 46, 2006–2017. doi: 10.1021/es2043504
Jones, E. P., and Anderson, L. G. (1986). On the origin of the chemical properties of the Arctic Ocean halocline. J. Geophys. Res. 91, 10759–10767. doi: 10.1029/JC091iC09p10759
Jørgensen, L., Stedmon, C. A., Kragh, T., Markager, S., Middleboe, M., and Sondergaard, M. (2011). Global trends in the fluorescence characteristics and distribution of marine dissolved organic matter. Mar. Chem. 126, 139–148. doi: 10.1016/j.marchem.2011.05.002
Kowalczuk, P., Tilstone, G. H., Zabłocka, M., Röttgers, R., and Thomas, R. (2013). Composition of dissolved organic matter along an Atlantic Meridional transect from fluorescence spectroscopy and parallel factor analysis. Mar. Chem. 157, 170–184. doi: 10.1016/j.marchem.2013.10.004
Lawaetz, A. J., and Stedmon, C. A. (2009). Fluorescence intensity calibration using the Raman scatter peak of water. Appl. Spectrosc. 63, 936–940. doi: 10.1366/000370209788964548
Murphy, K. R., Ruiz, G. M., Dunsmuir, W. T. M., and Waite, T. D. (2006). Optimized parameters for fluorescence-based verification of ballast water exchange by ships. Environ. Sci. Technol. 40, 2357–2362. doi: 10.1021/es0519381
Murphy, K. R., Stedmon, C. A., Waite, T. D., and Ruiz, G. M. (2008). Distinguishing between terrestrial and autochthonous organic matter sources in marine environments using fluorescence spectroscopy. Mar. Chem. 108, 40–58. doi: 10.1016/j.marchem.2007.10.003
Murphy, K. R., Stedmon, C. A., Wenig, P., and Bro, R. (2014). OpenFluor–an online spectral library of auto-fluorescence by organic compounds in the environment. Anal. Methods 6, 658–661. doi: 10.1039/C3AY41935E
Nelson, N. B., and Coble, P. G. (2009). “Optical analysis of chromophoric dissolved organic matter,” in Practical Guidelines for the Analysis of Seawater, ed Wurl, O. (Baco Raton, NJ: CRC Press), 79–96.
Nishino, S., Itoh, M., Williams, W. J., and Semiletov, I. (2013). Shoaling of the nutricline with an increase in near-freezing temperature water in the Makarov Basin. J. Geophys. Res. Oceans 118, 635–649. doi: 10.1029/2012JC008234
Nishino, S., Shimada, S., Itoh, M., Yamamoto-Kawai, M., and Chiba, S. (2008). East-west differences in water mass, nutrient, and chlorophyll a distributions in the sea ice reduction region of the western Arctic Ocean. J. Geophys. Res. 113, C00A01. doi: 10.1029/2007jc004666
Osburn, C. L., and Stedmon, C. A. (2011). Linking the chemical and optical properties of dissolved organic matter in the Baltic-North Sea transition zone to differentiate three allochthonous inputs. Mar. Chem. 126, 281–294. doi: 10.1016/j.marchem.2011.06.007
Retamal, L., Vincent, W. F., Martineau, C., and Osburn, C. L. (2007). Comparison of the optical properties of dissolved organic matter in two river-influenced coastal regions of the Canadian Arctic. Estuar. Coast. Shelf Sci. 72, 261–272. doi: 10.1016/j.ecss.2006.10.022
Søndergaard, M., Borch, N. H., and Stedmon, C. A. (2003). Fate of terrigenous dissolved organic matter (DOM) in estuaries: aggregation and bioavailability. Ophelia 57, 161–176. doi: 10.1080/00785236.2003.10409512
Spencer, R. G. M., and Coble, P. G. (2014). “Sampling design for organic matter fluorescence analysis,” in Aquatic Organic Matter Fluorescence, eds Coble, P. G., Lead, J., Reynolds, D. M., Spencer, R. G. M. (New York, NY: Cambridge Press), 125–146.
Stanley, R. H. R., Sandwith, Z. O., and Williams, W. J. (2015). Rates of summertime biological productivity in the Beaufort Gyre: a comparison between the low and record-low ice conditions of August 2011 and 2012. J. Mar. Syst. 147, 29–44. doi: 10.1016/j.jmarsys.2014.04.006
Stedmon, C. A., Amon, R. M. W., Rinehart, A. J., and Walker, S. A. (2011). The supply and characteristics of colored dissolved organic matter (CDOM) in the Arctic Ocean: Pan Arctic trends and differences. Mar. Chem. 124, 108–118. doi: 10.1016/j.marchem.2010.12.007
Stedmon, C. A., and Bro, R. (2008). Characterizing dissolved organic matter fluorescence with parallel factor analysis: a tutorial. Limnol. Oceanogr. Methods 6, 572–579. doi: 10.4319/lom.2008.6.572
Stedmon, C. A., and Markager, S. (2001). The optics of chromophoric dissolved organic matter (CDOM) in the Greenland Sea: an algorithm for differentiation between marine and terrestrially derived organic matter. Limnol. Oceanogr. 46, 2087–2093. doi: 10.4319/lo.2001.46.8.2087
Stedmon, C. A., Markager, S., and Bro, R. (2003). Tracing dissolved organic matter in aquatic environments using a new approach to fluorescence spectroscopy. Mar. Chem. 82, 239–254. doi: 10.1016/S0304-4203(03)00072-0
Stedmon, C. A., Markager, S., Tranvik, L., Kronberg, L., Slatis, T., and Martinsen, W. (2007). Photochemical production of ammonium and transformation of dissolved organic matter in the Baltic Sea. Mar. Chem. 104, 227–240. doi: 10.1016/j.marchem.2006.11.005
Stedmon, C. A., and Markager, S. (2005). Resolving the variability in dissolved organic matter fluorescence in a temperate estuary and its catchment using PARAFAC analysis. Limnol. Oceanogr. 50, 686–697. doi: 10.4319/lo.2005.50.2.0686
Uchida, R., Kuma, K., Omata, A., Ishikawa, S., Hioki, N., Ueno, H., et al. (2013). Water column iron dynamics in the subarctic North Pacific Ocean and the Bering Sea. J. Geophys. Res. 118, 1257–1271. doi: 10.1002/jgrc.20097
Walker, S. A., Amon, R. M. W., Stedmon, C., Duan, S., and Louchouarn, P. (2009). The use of PARAFAC modeling to trace terrestrial dissolved organic matter and fingerprint water masses in coastal Canadian Arctic surface waters. J. Geophys. Res. 114, G00F06. doi: 10.1029/2009JG000990
Yamamoto-Kawai, M., Carmack, E. C., McLaughlin, F. A., and Falkner, K. K. (2010). Oxygen isotope ratio, barium and salinity in waters around the North American coast from the Pacific to the Atlantic: implications for freshwater sourced to the Arctic throughflow. J. Mar. Syst. 68, 97–117. doi: 10.1357/002224010793078988
Yamamoto-Kawai, M., McLaughlin, F. A., Carmack, E. C., Nishino, S., Shimada, K., and Kurita, N. (2009). Surface freshening of the Canada Basin, 2003–2007: river runoff versus sea ice meltwater. J. Geophys. Res. Oceans 114:C00A05. doi: 10.1029/2008jc005000
Yamashita, Y., Boyer, J. N., and Jaffé, R. (2013). Evaluating the distribution of terrestrial dissolved organic matter in a complex coastal ecosystem using fluorescence spectroscopy. Cont. Shelf Res. 66, 136–144. doi: 10.1016/j.csr.2013.06.010
Yamashita, Y., Cory, R. M., Nishioka, J., Kuma, K., Tanoue, E., and Jaffé, R. (2010). Fluorescence characteristics of dissolved organic matter in the deep waters of the Okhotsk Sea and the northwestern North Pacific Ocean. Deep-Sea Res. II, 57, 1478–1485. doi: 10.1016/j.dsr2.2010.02.016
Yamashita, Y., Jaffé, R., Maie, N., and Tanoue, E. (2008). Assessing the dynamics of dissolved organic matter (DOM) in coastal environments by excitation–emission matrix fluorescence and parallel factor analysis (EEM-PARAFAC). Limnol. Oceanogr. 53, 1900–1908. doi: 10.4319/lo.2008.53.5.1900
Keywords: CDOM, FDOM, Makarov Basin, Canada Basin, frontal zone, ice cover
Citation: Guéguen C, Itoh M, Kikuchi T, Eert J and Williams WJ (2015) Variability in dissolved organic matter optical properties in surface waters in the Amerasian Basin. Front. Mar. Sci. 2:78. doi: 10.3389/fmars.2015.00078
Received: 10 July 2015; Accepted: 18 September 2015;
Published: 29 October 2015.
Edited by:
Christopher Osburn, North Carolina State University, USAReviewed by:
Mukesh Gupta, Environment Canada, CanadaMar Nieto-Cid, CSIC - Instituto de Investigaciones Marinas, Spain
Copyright © 2015 Guéguen, Itoh, Kikuchi, Eert and Williams. This is an open-access article distributed under the terms of the Creative Commons Attribution License (CC BY). The use, distribution or reproduction in other forums is permitted, provided the original author(s) or licensor are credited and that the original publication in this journal is cited, in accordance with accepted academic practice. No use, distribution or reproduction is permitted which does not comply with these terms.
*Correspondence: Céline Guéguen, Department of Chemistry, Trent University, 1600 West Bank Drive, Peterborough, ON K9J 7B8, Canada, celinegueguen@trentu.ca