Fluorescence Quantum Yields of Natural Organic Matter and Organic Compounds: Implications for the Fluorescence-based Interpretation of Organic Matter Composition
 Urban J. Wünsch
 Kathleen R. Murphy
 Colin A. Stedmon
- 1Section for Marine Ecology and Oceanography, National Institute of Aquatic Resources, Technical University of Denmark, Charlottenlund, Denmark
- 2Water Environment Technology, Chalmers University of Technology, Gothenburg, Sweden
Absorbance and fluorescence spectroscopy are economical tools for tracing the supply, turnover and fate of dissolved organic matter (DOM). The colored and fluorescent fractions of DOM (CDOM and FDOM, respectively) are linked by the apparent fluorescence quantum yield (AQY) of DOM, which reflects the likelihood that chromophores emit fluorescence after absorbing light. Compared to the number of studies investigating CDOM and FDOM, few studies have systematically investigated AQY spectra for DOM, and linked them to fluorescence quantum yields (Φ) of organic compounds. To offer a standardized approach, a MATLAB toolbox for the determination of apparent quantum yields of DOM (aquaDOM), featuring two calculation approaches, was developed and used to derive AQYs for samples from the Norwegian Sea. Φ of the organic compounds varied between 0.00079 and 0.35, whereas the average AQY for DOM samples at 350 nm was 0.011 ± 0.003. The AQY at 350 nm increased with depth, while the AQY at 250 nm showed no trend. Laboratory tests indicated that Φ of compound mixtures are additive and represent an intermediate of the constituents. Additionally, the presence of non-fluorescent chromophores greatly suppressed calculated AQYs. Similar trends in the DOM AQY at 350 nm were observed in natural samples. We therefore hypothesize that fluorescence AQYs can indicate changes in the relative abundances of CDOM and FDOM. Additionally, the optical properties of 15 potential DOM constituents were determined and compared to more than 200 modeled spectra (PARAFAC components) in the OpenFluor database. Apparent matches, based on spectral similarity, were subsequently evaluated using molar fluorescence and absorbance. Five organic compounds were potential matches with PARAFAC components from 16 studies; however, the ability to confirm matches was limited due to multiple compounds exhibiting very similar spectra. This reiterates the fact that spectral similarity alone is insufficient evidence of the presence of particular compounds, and additional evidence is required.
Introduction
As the largest pool of reduced carbon, dissolved organic matter (DOM) plays an important role in the biogeochemical processes of aquatic environments (Prairie, 2008). Furthermore, it links soil and aquatic ecosystems (Jansen et al., 2014), is a key factor for the attenuation of light in the water column (Morris et al., 1995; Williamson et al., 1999), and affects the solubility and transport of metals (Ravichandran, 2004).
DOM can be analyzed via ultraviolet and visible spectroscopy. A fraction of DOM absorbs light, and its optical properties can be characterized by absorbance and fluorescence spectroscopy. The measurement of the colored fraction of DOM (CDOM) can be considerably faster than the detailed compound-specific chemical analysis of DOM. Moreover, CDOM dynamics can be monitored across large scales using satellite remote sensing (Siegel et al., 2005). However, the link between chemical and optical properties of DOM remains poorly understood despite recent efforts to link molecular signatures with optical properties (Stubbins et al., 2014; Kellerman et al., 2015). Moreover, the relative contribution of fluorescent DOM (FDOM) to CDOM, as well as CDOM to DOM, is largely unknown (Stedmon and Nelson, 2015).
For pure fluorophores, the fluorescence quantum yield (Φ) represents the probability of a fluorophore to emit light while returning to its ground state after being excited by light of higher energy (Lakowicz, 2006). Given this definition, the absorbance and fluorescence properties of DOM are linked by Φ of FDOM (Green and Blough, 1994). However, since CDOM is a complex mixture of organic molecules, not all of which fluoresce, its fluorescence efficiency represents a combined signal. The quantum yield of CDOM is therefore referred to as the apparent fluorescence quantum yield (AQY) to emphasize the contrast to Φ, which can only be determined for pure fluorophores or mixtures of fluorophores.
Compared to the number of studies focusing on optical properties of DOM, its AQY has not been studied extensively in the past. However, studies have shown that the apparent quantum yield of DOM changes as a function of the excitation wavelength, with values generally ranging from 0.1 to 2.8%, while distinct emission bands in the ultraviolet can cause significantly higher DOM AQYs of 5–7% (Green and Blough, 1994; Del Vecchio and Blough, 2004; Andrew et al., 2013; Cawley et al., 2015). All previous studies show that the AQY is highest around 370 nm, while subsequently decreasing steadily with wavelength (Sharpless and Blough, 2014).
Several studies have revealed links between DOM AQYs and biogeochemical parameters. Ferrari et al. (1996) showed that increased algal abundance can increase DOM AQYs, presumably due to the production of highly fluorescent polyphenols. AQYs are also generally higher in deep than in shallow waters (Ferrari, 2000; Cawley et al., 2015) and increase with salinity in estuaries (Zepp et al., 2004). Moreover, an early study by Stewart and Wetzel (1980) highlighted the observation that the ratio between fluorescence and absorbance differs between molecular weight fractions of DOM by a factor of four, with the low molecular weight fraction exhibiting greater fluorescence per unit of absorbance. A recent study by Catalá et al. (2015) reported increasing AQYs for aging water masses. Together, these studies highlight the potential for DOM apparent quantum yields to indicate changing DOM characteristics as a result of microbial turnover of DOM (i.e., “humification”).
Recent efforts to link optical and chemical properties of DOM include the comparison of fluorescence excitation-emission matrices (EEMs) with ultrahigh resolution mass spectrometry using correlation analysis (Stubbins et al., 2014). However, due to analytical limitations during sample preparation and analysis (Dittmar et al., 2008; Hertkorn et al., 2008), the comparison of data originating from mass-spectrometry and fluorescence spectroscopy remains a challenge. To assess the plausibility of chemical formulae and/or structure assignments to FDOM components in this context, knowledge of fluorescence quantum yields is essential, since it reflects the likelihood of molecules to fluoresce. Nonetheless, with the exception of functional fluorophores used as probes, sensors and reporters (Würth et al., 2013), the quantum yield of many organic compounds is unknown or not available in an accessible database.
The purpose of this study is to provide an indication of the chemical structures contributing to DOM fluorescence by comparing the fluorescence characteristics of organic compounds with those of natural samples. Moreover, the aim was to introduce an open-source MATLAB toolbox to allow the comparable determination of apparent quantum yields of DOM and Φ of organic compounds. The objective was to first compare approaches for determining quantum yields, and afterwards assess the informative value of spectral data for AQYs of natural samples and Φ of pure compounds.
Materials and Methods
Samples
Natural DOM samples were collected from 25 to 28 May 2015 along a transect from Tromsø (Norway) to Hirtshals (Denmark) on the research vessel Dana. The transect consisted of 11 stations along the Norwegian coast (Figure 1A). Samples were gravity-filtered directly from Niskin bottles using a 0.2 μm flow-through filter (PALL Life Sciences). The filter was rinsed with 400 mL seawater between usages. Samples were stored at 4°C in 40 mL combusted amber glass vials (VWR International). Fluorescence and absorbance spectra were collected within 30 days of sampling. Subsamples for the determination of dissolved organic carbon (DOC) were stored at −20°C in acid-cleaned HDPE bottles (10% w/v hydrochloric acid, VWR International). A suite of 15 organic compounds was also purchased and characterized (Supplementary Table 1). All compounds were dissolved in 1 mmol L−1 phosphate buffer (Fluka Analytical) adjusted to pH 7.5. The compounds were selected as they have previously been suggested to be structures in DOM or to represent similar fluorophores (Yamashita and Tanoue, 2003; Aiken, 2014; Stedmon and Nelson, 2015).
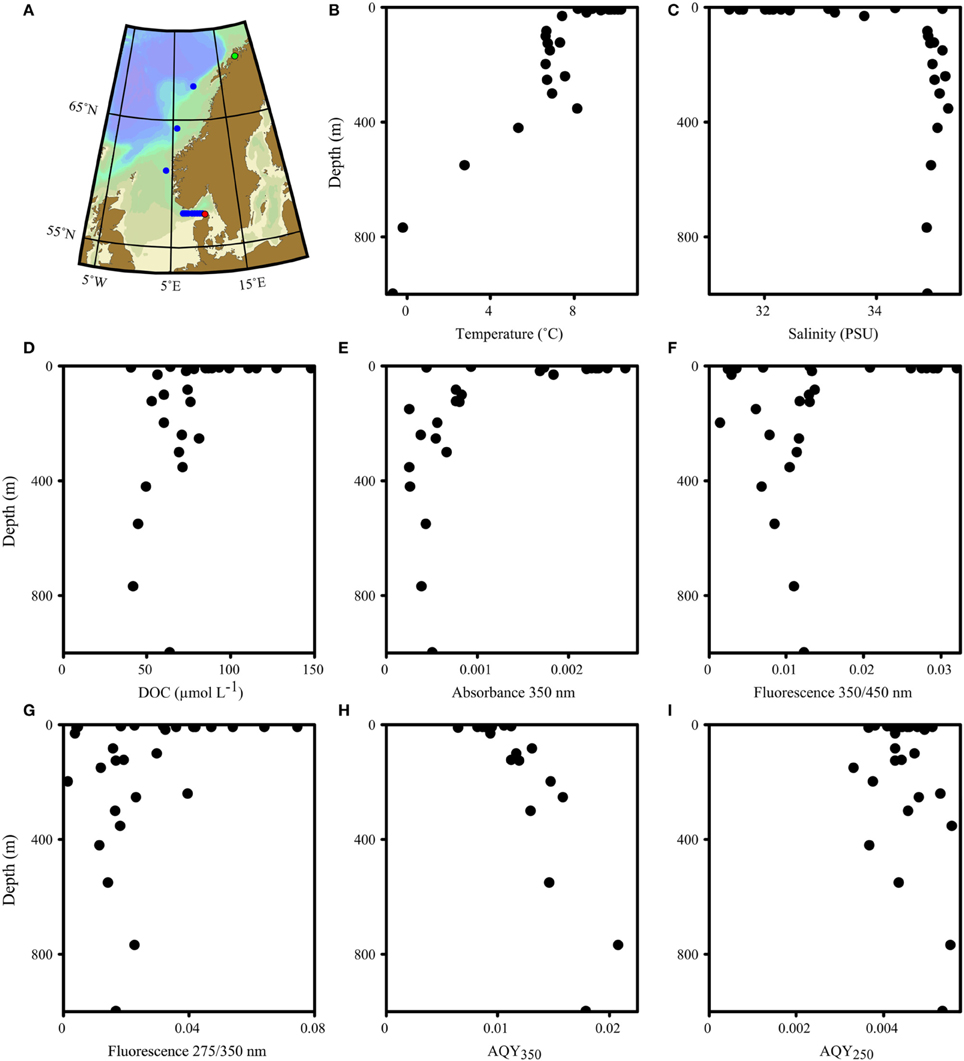
Figure 1. Map (A) and vertical profiles of various biogeochemical parameters (B–I) of the transect along the Norwegian shelf and the Skagerrak. The transect direction was north (starting in Tromsø, green dot) to south (ending in Hirtshals, red dot). A total of 11 stations were sampled. Eight stations in the Skagerrak were sampled for surface waters; three stations along the Norwegian shelf included vertical profiles.
Measurements
Absorbance measurements were carried out using a Shimadzu UV2401PC spectrophotometer in combination with a 10 cm quartz cell. The absorbance signal of ultrapure water, 1 mmol L−1 phosphate buffer (pH 7.5), and 0.1 N H2SO4 was subtracted from samples, organic compounds and quinine sulfate, respectively. Small residual baseline offsets were corrected by subtracting the average absorbance signal between 700 and 800 nm. The noise level of absorbance measurements was estimated from the range of absorbance values in the 2nd derivative spectrum between 550 and 600 nm.
Fluorescence measurements were obtained using a HORIBA Jobin Yvon AquaLog fluorometer. Calibrations for excitation monochromators and the emission detector, as well as optical immaculacy of cuvettes, were validated daily using a fixed routine (Supplementary Material). Fluorescence emission wavelengths were 240–600 nm (increment 2 nm) and excitation wavelengths 240–600 nm (increment 5 nm). The emission integration time was adjusted to account for varying FDOM concentrations between samples. The obtained fluorescence data was processed in MATLAB using the drEEM toolbox (version 0.2.0, Murphy et al., 2013). For quantum yield standards, the respective solvents (ultrapure water for salicylic acid, 0.1 N H2SO4 for quinine sulfate) were used as blanks, while ultrapure water was used as blanks for CDOM samples. Since a quantum yield standard calibration was carried out daily, no Raman normalization was performed. Instead, the EEMs were normalized to a 1 s integration time, and raw fluorescence counts were used as basis for quantum yield calculations. For organic compounds, a one-component parallel factor analysis (PARAFAC, e.g., Murphy et al., 2013) model was fitted to reduce noise and allow extrapolation of signals to scatter-affected regions of the EEM (Murphy et al., 2014b).
DOC was measured using high-temperature catalytic oxidation, whereby organic carbon was oxidized to carbon dioxide, then measured with a non-dispersive infrared detector (TOC/VCPH, Shimadzu). A 15 mL sample was poured into a combusted glass vial and acidified to pH 2 using hydrochloric acid. Samples were subsequently sparged with CO2-free air to remove inorganic carbon. Acidified samples were injected onto the catalyst (heated to 680°C) and DOC concentrations were averaged over the best three of up to seven repeated injections. The instrument was calibrated using acetanilide (Cauwet, 1999). For quality control of measured DOC concentrations, a deep-sea reference (Hansell laboratory, Miami) was used.
(Apparent) Quantum Yield Calculation
A MATLAB® toolbox for the calculation of apparent quantum yields of DOM (aquaDOM) was developed and utilized in this study (available in the Supplementary Material). Since the calculation of Φ of pure compounds and DOM AQYs do not differ, this section explains the calculations exemplarily for DOM AQYs. The determination of the DOM AQYs of a sample, X, was based the relative approach using a quantum yield standard, St, as follows (Parker and Rees, 1960):
where AQY is the apparent fluorescence quantum yield, ∫ F (λ)∕A(λ) represents the ratio of the integral of the fluorescence emission F and the absorbance A at excitation wavelength λ, and η is the refractive index. Since the refractive index of water across the salinity range of seawater varies by only 0.5% at 404 nm (Austin and Halikas, 1976), the last term of Equation (1) can be omitted and Equation (1) simplifies to:
To determine AQYs, two variations of the relative approach were tested. In the first approach, a single absorbance and fluorescence measurement was carried out to determine ∫ FX(λ)∕AX(λ) experimentally. This approach forces the intercept of the single point regression through zero (hereafter called “zero-intercept approach”). The precision of determined AQYs was estimated (only for selected samples) for every excitation wavelength using the standard error propagation approach as follows:
where σAQY is the precision estimate, σ ∫ F and σA represent the range of absorbance and fluorescence observations in five repeated measurements, and and represent the average fluorescence integral and average absorbance level of five repeated measurements. In the second approach, a five-point dilution series of standards and samples was measured to determine ∫ FX(λ)∕AX(λ) by robust linear regression, allowing non-zero intercepts to account for instrument-specific differences in fluorescence and absorbance detection limits (hereafter called “variable-intercept approach”). The precision of AQYs in this approach were determined using the 95% confidence interval of the slope estimate. AQYs were only reported if the signal-to-noise ratio (S/N) for absorbance measurements exceeded 25 for both approaches (if not otherwise stated), since this ratio-filter excluded visibly erroneous AQYs. Additionally, in the variable-intercept approach, linear fits with R2 < 0.95 were discarded (if not otherwise stated).
To confirm the accuracy of the obtained AQYs, cross-calibrations with reference materials were performed daily. Five-point dilution series (in the case of the variable-intercept approach), or five replicate measurements (in the case of the zero-intercept approach) of quinine sulfate (NIST standard reference material 936a dissolved in 0.05 M H2SO4,Φ = 0.51 at 350 nm, Melhuish, 1961; Velapoldi and Tønnesen, 2004), and salicylic acid (dissolved in ultrapure water, Φ = 0.36 at 296 nm, Pozdnyakov et al., 2009) were measured. Cross-calibrations were performed by treating one reference material as a sample while the second reference material was used to estimate Φ (and vice versa). Further sample measurements were conducted only if the cross calibration resulted in deviations of <10% from the literature values. Since quinine sulfate is a widely recognized standard in luminescence spectroscopy (Brouwer, 2011), its properties were always used as the basis for the AQY determination of CDOM samples, while salicylic acid was used to confirm its validity.
To calculate the Stokes shift of organic compounds, wavelength dependent intensities Iλ in the EEMs were converted to wavenumber intensities () as follows (Lakowicz, 2006):
was used to calculate the Stokes shift as the difference between the position of the fluorescence emission peak and the highest excitation peak. This result was converted from cm−1 to eV to express the Stokes shift as an energy difference.
Spectral Matching
Purchased organic compounds were compared to more than 200 modeled spectra available in the OpenFluor database1 (Murphy et al., 2014c). The database assesses spectral similarity using the Tucker congruence coefficient (Tucker, 1951). Spectral matches were restricted to Tucker congruence coefficients of >0.9 in emission and excitation, while the combined Tucker congruence coefficient was restricted to >0.81.
Results
Optical Properties of Samples and Organic Compounds
The waters sampled along the Norwegian shelf reflected three groups: comparatively warm and less-saline surface water with high DOC (>80 μM) influenced by continental run off; intermediate waters with depths of 100–400 m, essentially representing Atlantic water; and Norwegian Sea bottom water with sub-zero temperatures (Figure 1). The fluorescence characteristics resembled those expected for shelf waters (Blough and Del Vecchio, 2002; Stedmon and Nelson, 2015) with a broad fluorescence peak at visible wavelengths, and a pronounced UVA peak (Figure 2).
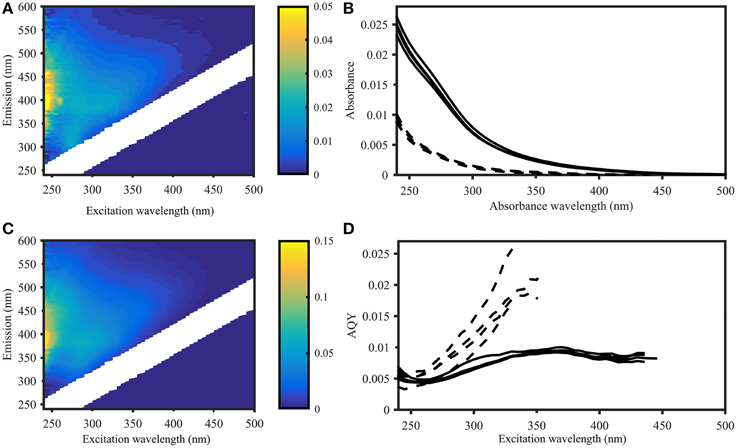
Figure 2. Apparent quantum yield and fluorescence in samples from the Norwegian Sea (Station 2, deep sea) and Skagerrak (Station 14, surface water). Left panel: EEMs of deep (A) and surface (C) samples in Raman units (different scales as indicated by colorbar). Right panel: CDOM absorbance (B) and CDOM apparent fluorescence quantum yields (D) of four deep sea samples (dashed lines) and four surface water samples (solid lines), showing deep sea AQYs consistently higher than in surface waters. AQYs at wavelengths where signal to noise ratios were below 25 are missing values.
The fluorescence properties of the purchased organic compounds are shown in Figure 3, and described in Table 1. The molar absorptivity ranged from 153 (phenylalanine) to 15,791 L mol−1 cm−1 (caffeine). Peaks in absorbance spectra extended from 256 (phenylalanine) to 295 nm (salicylic acid), while absorbance was measureable up to a maximum of 550 nm (ferulic acid). The molar fluorescence varied between 0.03 (benzoic acid) and 38.50 Raman units L μmol−1 (indole). Stokes shifts extended from 0.32 (benzoic acid) to 1.38 eV (ferulic acid). Organic compounds seemingly fell into two groups; the first group with Stokes shifts ranging from 0.32 to 0.57 eV and emission maxima from 281 to 339 nm, and the second group with Stokes shifts of 0.97–1.38 eV with emission maxima from 333 to 413 nm. In some cases (e.g., coumarin or coniferyl alcohol), absorbance spectra did not match the fluorescence excitation loadings (Figure 3), although these should theoretically be identical for pure compounds. However, for other compounds (e.g., phenylalanine, tyrosine, and tryptophan), absorbance and fluorescence excitation spectra were a close match. Compounds with identical fluorophore groups had similar optical properties. For example, the two phenols p-Cresol and Tyrosine were characterized by relatively similar molar absorptivity maxima (1928 and 1206, respectively), similar quantum yields (0.11 and 0.13, respectively) and similar stokes shifts (0.45 and 0.49 eV, respectively). However, other structurally related compounds such as tryptophan and indole showed noticeably differing Φ (0.15 and 0.28, respectively), although other optical properties were highly similar (Table 1). The excitation and emission spectra of all purchased organic compounds have been uploaded to the OpenFluor database (Murphy et al., 2014c).
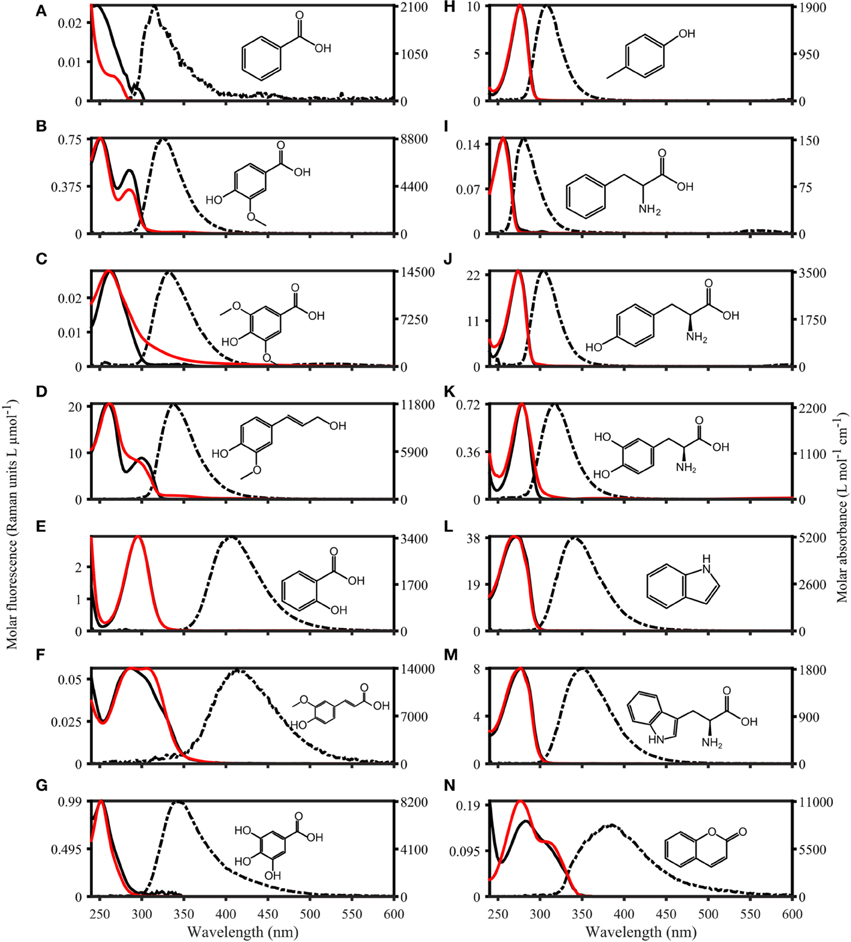
Figure 3. Absorbance and Fluorescence spectra of organic compounds dissolved in water with 1 mmol L−1 PO4buffer (pH 7.5). The molar absorptivity is shown as a solid red line, excitation loadings are solid black lines, and emission loadings are dashed black lines. (A–G) Benzoic acid, vanillic acid, syringic acid, coniferyl alcohol, salicylic acid, ferulic acid, gallic acid. (H–N) p-Cresol, phenylalanine, tyrosine, dihydroxyphenylalanine, indole, tryptophan, coumarin.
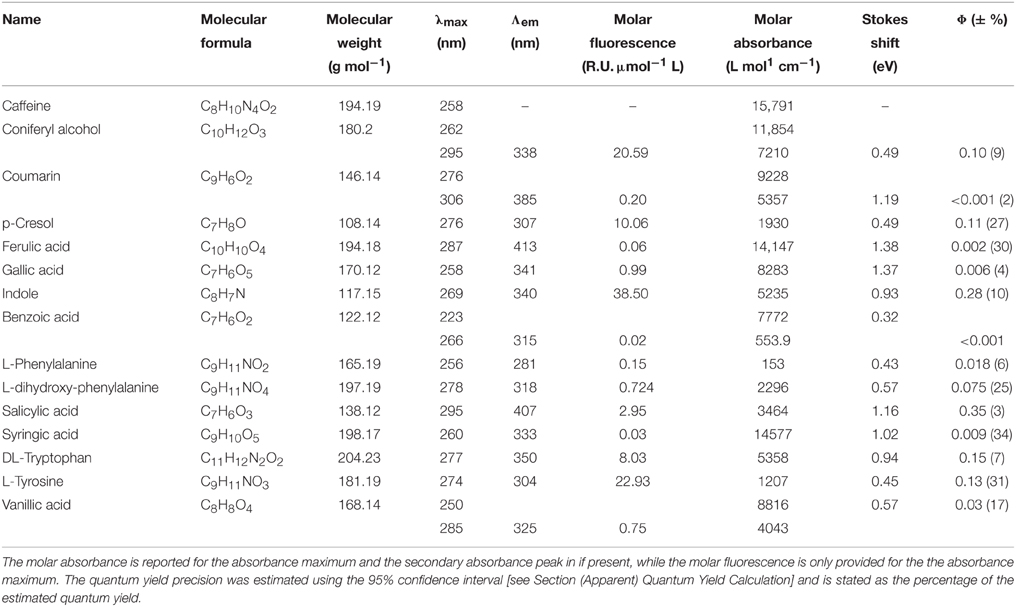
Table 1. Optical properties of organic compounds dissolved in 1 mmol L−1 phosphate buffer (pH 7.5).
Organic compounds with identical fluorophores were characterized by highly similar fluorescence emission peaks, while absorbance spectra differed in peak positions and shapes (e.g., benzoic acid derivatives, Figures 3A–C). Furthermore, the two phenols (p-cresol and tyrosine, Figures 3H,J), as well as the two indols (Figures 3L,M), had highly similar peak positions and shapes for both absorbance and fluorescence emission peaks. Organic compounds with the highest degree of conjugation (coumarin, ferulic acid, salicylic acid, Figures 3E,F,N) exhibited the broadest emission peaks, compared to narrow emission peaks of organic compounds with a lower degree of conjugation (e.g., p-cresol, and phenylalanine, Figures 3H,I).
Method Comparison: Apparent Quantum Yield Calculations
To compare the two AQY calculation approaches (variable-intercept vs. zero-intercept approach), results were compared for three Norwegian Sea samples and a Suwannee River XAD-8 fulvic acid extract (Figure 4). For both approaches, the AQY accuracy typically varied between 0.1 and 6% (all data not shown). Calculated AQYs, as well as the overall spectral shape were highly similar between approaches. However, the spectral range of viable AQYs differed; for the majority of samples, the variable-intercept method consistently yielded a narrower wavelength range of viable AQYs (i.e., exceeding the signal to noise threshold of 25). For example, for Suwannee River fulvic acid, the zero-intercept approach yielded AQYs up to an excitation wavelength of 565 nm, while the variable intercept approach yielded AQYs only up to 515 nm (Figure 4D). In addition, the two approaches provided different precision estimates. Across the whole AQY spectrum, the zero-intercept approach resulted in higher precision (e.g., for the AQYat 350 nm, precision estimates were ±2.4% and ±1.3% using the variable- and zero-intercept approach, respectively).
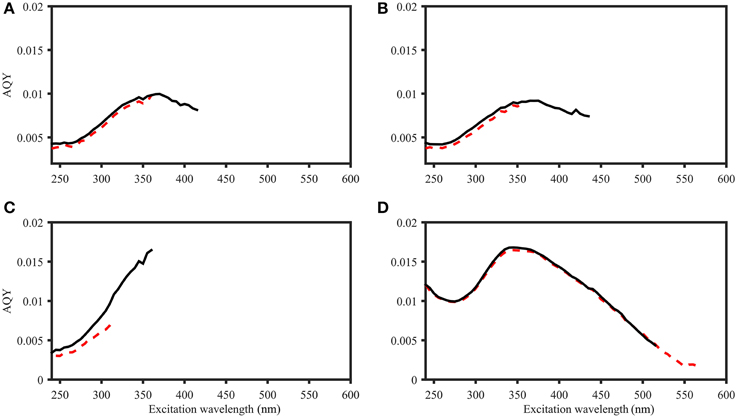
Figure 4. Comparison of AQY calculations for four samples. Black line: Zero-intercept approach. Red dashed line: Variable-intercept approach. (A–C) Norwegian shelf DOM, water depth: 30, 10, and 200 m (A–C, respectively). (D) 2.5 mg L−1 Suwannee River XAD-8 fulvic acid extract. Figures do not include error bars for ease of viewing, but in all cases, AQY values of the two calculation approaches were within the precision estimates (e.g., +∕− 0.22*10−4 and 0.61*10−4 for zero- and variable-intercept approach in (D), respectively).
Apparent Quantum Yields of CDOM and Φ of Organic Compounds
The AQY spectra of the 28 samples from the Norwegian shelf transect were very similar (Figures 2D, 4), with minima around 250 nm increasing to maxima between 340 and 380 nm. For samples with low organic matter concentrations (predominantly deep sea samples, DOC < 60 μM), the AQYs could not be determined for wavelengths >~350 nm due to low signal-to-noise ratios in both absorbance and fluorescence measurements at longer wavelengths.
AQYs at 350 nm (AQY350) ranged from 0.006 to 0.021, with AQYs in surface waters (< 10 m, n = 12, average 0.009 ± 0.001) significantly lower than in deep-sea waters (>100 m, n = 8, average 0.014 ± 0.003, one-tailed student t-test p < 0.001, Figures 1H,2D). In contrast, AQYs at 250 nm (AQY250) were less variable (average 0.004 ± 0.0006) and exhibited no observable trends with depth or latitude (Figure 1I).
To identify the key parameter responsible for the vertical AQY350 variability, absorbance at 350 nm (A350) and fluorescence at 350/450 nm (F350∕450) were normalized to the maximum for each station. The ratio of the normalized F350∕450 and A350 was then used to investigate the vertical change in absorbance and fluorescence (Figure 5A). Surface waters were dominated by ratios < 1, indicating a relative lack of DOM fluorescence or an excess of CDOM absorbance. In contrast, [with the exception of two samples that showed unusually low fluorescence and high absorbance (samples at 197 m and 548 m, respectively)] subsurface waters showed ratios >1, indicating excess DOM fluorescence or a lack of CDOM absorbance. Moreover, AQY350 was significantly correlated to absorbance levels at 350 nm (Figure 5B).
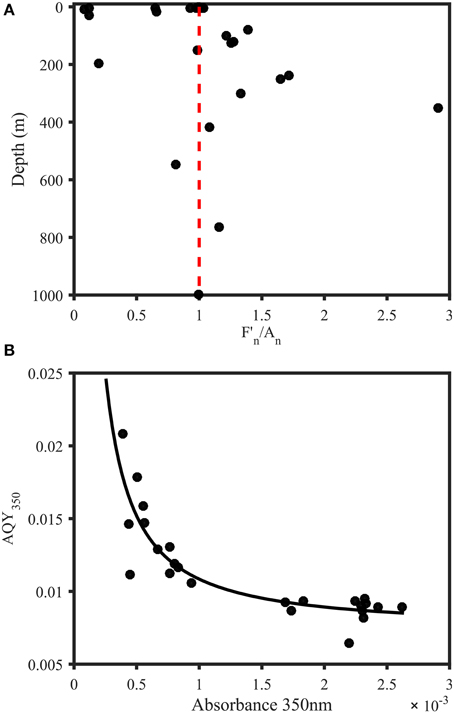
Figure 5. Trends in AQYs of natural samples from the Norwegian shelf and Skagerrak. (A) Depth profile of F350∕450 divided by A350 (both normalized to station maximum) for samples from 11 stations in the Norwegian Sea and Skagerrak (n = 28). Red line indicates a ratio of 1 and represents equal relative contribution of fluorescence and absorbance. Subsurface waters were characterized by a strong fluorescence contribution, with the exception of two samples with abnormally low fluorescence (197 m) and abnormally high absorbance (548 m). Surface waters either showed equal FDOM and CDOM levels or dominant CDOM absorbance contribution. (B) AQY vs. absorbance at 350 nm. The black line represents a power fit (, a = 9.821 × 10⁻⁶, b = −1.181, c = 0.0074, R2 = 0.75).
Φ of organic compounds at their respective absorbance peak varied from 0.00079 for benzoic acid to 0.35 for salicylic acid (Table 1), and were spectrally featureless for many compounds (e.g., phenylalanine, vanillic acid, gallic acid, Figure 6A). However, for other compounds (e.g., salicylic acid, coniferyl alcohol, and indole) Φ did vary with wavelength. Spectral structure was observed in various scenarios. Firstly, Φ was often unstable at wavelengths where the molar absorptivity was low, whereby the direction of the variability for a given compound varied on a daily basis. Particularly for salicylic acid, Φ increased in some measurement runs and decreased in others (Supplementary Figure 1). Secondly, spectral structure in Φ for organic compounds was found in regions with high molar absorptivity. For example, Φ of salicylic acid consistently dropped from 0.35 at 295 nm to 0.15 at 250 nm. Another example of spectral dependence of Φ was coniferyl alcohol, which showed a distinct minimum of 0.06 at 300 nm, and two maxima at 250 nm and 315 nm (0.11 and 0.16, respectively). The comparison of absorbance and fluorescence excitation spectra for these organic compounds revealed distinct differences. Therefore, spectral dependence of Φ might originate from the presents of impurities.
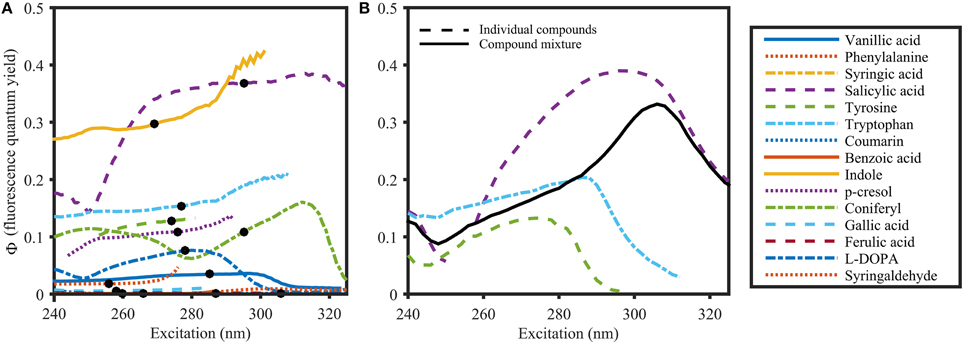
Figure 6. Φ of organic compounds (A) and a compound mixture (B) dissolved in 1 mmol L−1 Phosphate buffer (pH 7.5). The solid black line in (B) represents Φ of the compound mixture. Dots in (A) represent the absorbance maximum of the respective compound. Φ was calculated using the variable-intercept approach (R2 > 0.95 and S/N > 50).
To investigate the behavior of Φ for mixtures of organic compounds, Φ was determined for an equimolar mixture of tyrosine, tryptophan and salicylic acid. Φ of the mixture (Figure 6B) exhibited optical properties that were intermediate to the isolated constituents. However, at wavelengths where there was no overlapping absorbance, Φ of the mixture resembled that of the specific compound. This is particularly clear at wavelengths above 310 nm, where only salicylic acid absorbed (Figure 3). Therefore, Φ of a mixture of i fluorescing organic compounds is determined as follows:
Spectral Matching of Organic Compounds with PARAFAC Spectra
The OpenFluor fluorescence database contains excitation and emission spectra for more than 200 PARAFAC components, mathematically extracted from fluorescence EEMs of NOM mixtures. The database was searched for matches with the 14 fluorescing organic compounds in this study. Potential spectral matches were found for p-cresol, tryptophan, indole, L-dihydroxyphenylalanine, tyrosine, coumarin, salicylic acid, ferulic acid, and benzoic acid (in order of frequency, see Table 2 for complete list, and Figure 7 for examples). Numerous matches for the emission spectrum of ferulic acid were found; however, the excitation spectrum of ferulic acid was often blue-shifted compared to the PARAFAC spectra. The spectra of p-cresol and tryptophan, as well as indole and tyrosine, were very similar and each pair yielded hits for the same PARAFAC components (Figure 8). Therefore, unambiguous matching of PARAFAC component with organic compounds was impossible for these fluorophores.
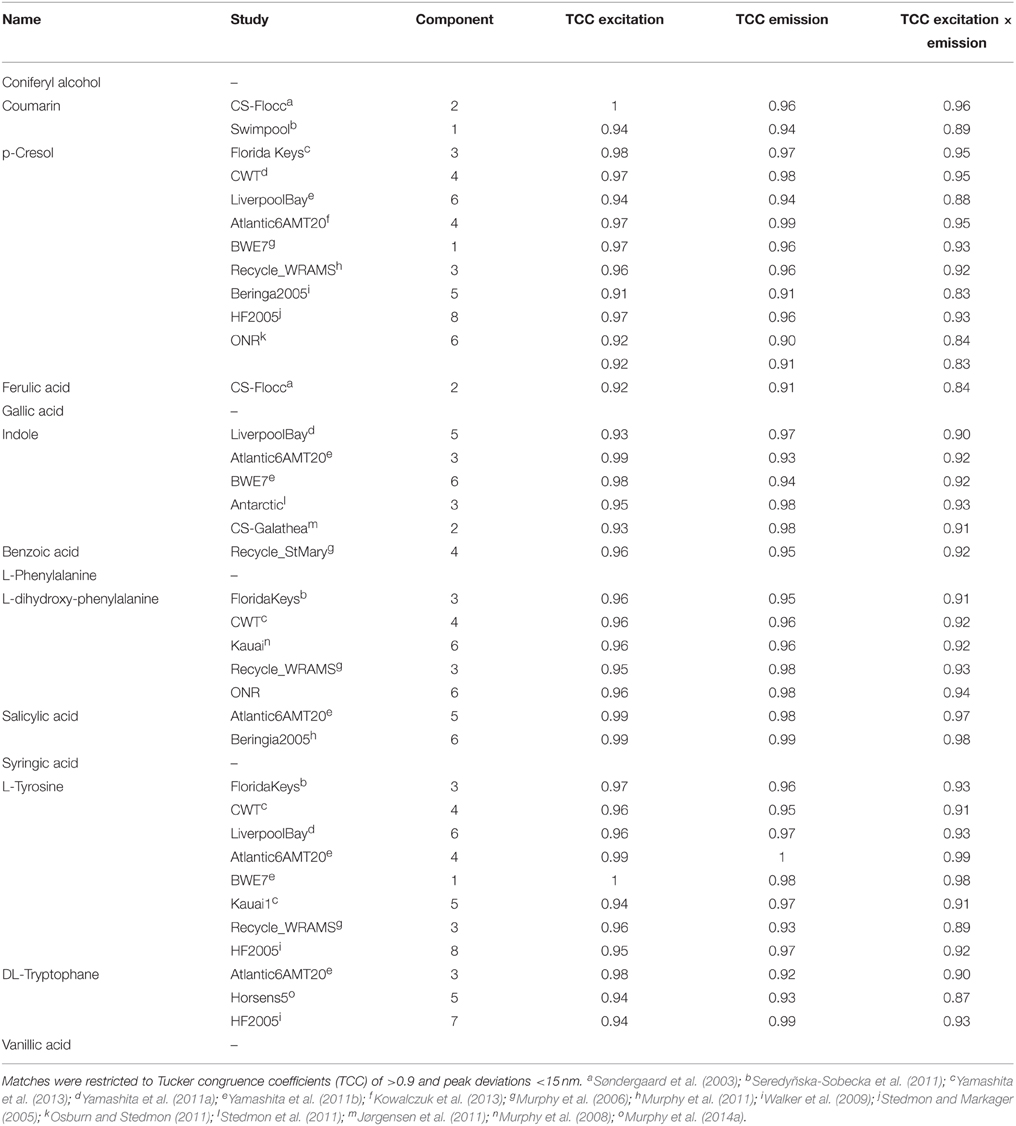
Table 2. Similarities between fluorescence spectra of PARAFAC components in the OpenFluor database and the spectra of organic compounds.
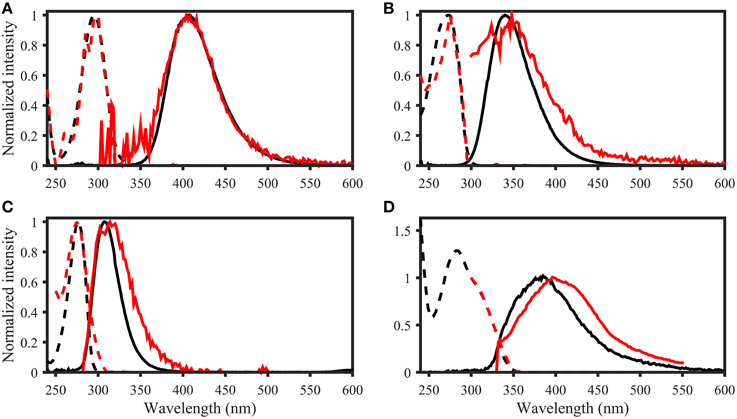
Figure 7. Examples of spectral matching between PARAFAC components in the OpenFluor database with organic compounds. Dashed lines represent excitation loadings, solid lines show emission loadings. Organic compounds are shown in black, PARAFAC components in red. (A) Salicylic acid against component 5 from Kowalczuk et al. (2013), (B) Indole against component 3 from Kowalczuk et al. (2013), (C) p-cresol against component 3 from Murphy et al. (2011), (D) Coumarin against component 2 from Søndergaard et al. (2003).
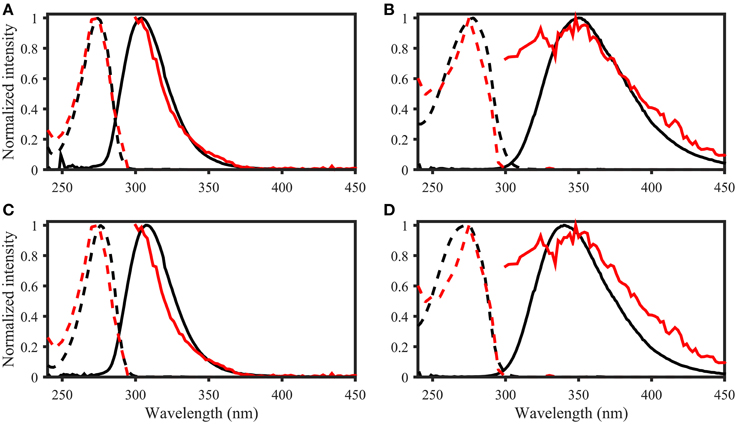
Figure 8. OpenFluor matches of (A) tyrosine, (B) tryptophan, (C) p-cresol, and (D) indole (all in black) with PARAFAC components (all in red) from Kowalczuk et al. (2013). Dashed lines represent excitation loadings, solid lines show emission loadings. Tryptophan and indole, as well as tyrosine and p-cresol yield matches with the same PARAFAC component.
Discussion
DOM Apparent Fluorescence Quantum Yields
With typical values ranging from 0.001 to 0.02, the apparent fluorescence quantum yields of FDOM are regarded as very low (Sharpless and Blough, 2014). This is particularly evident in comparison to Φ of organic compounds (up to 0.35, Figure 6A). However, Φ of mixtures of fluorescing organic compounds is dependent on the relative contribution of each fluorophore (Figure 6B, Equation 5). Moreover, DOM consists of FDOM, as well as non-fluorescent CDOM, which is the reason why DOM quantum yields can only be reported as “apparent” quantum yields. The implications of this fact can be demonstrated with simple mixtures of organic compounds using Equation (5): Φ of salicylic acid in 1 mmol L−1 phosphate buffer at 258 nm was determined to be 0.24 in this study (Figure 6). At the same wavelength, the apparent quantum yield of an equimolar mixture of salicylic acid and the non-fluorescent compound caffeine would drop to 0.0046 since (apparent) quantum yields assume intermediate values of the individual components as demonstrated above (Figure 6). Similarly, the AQYs of a mixture of 1 mol L−1 salicylic acid and 0.01–1 mol L−1 caffeine drop from 0.15 to 0.0046 (Figure 9, see Supplementary Material for detailed calculation). However, since caffeine does not absorb above 310 nm, the AQY resumes a value of 0.35 at wavelengths exceeding 310 nm, and becomes a true quantum yield again. Similarly, in relative terms, the gradual increase of FDOM AQYs from 240 to 350 nm suggests that CDOM absorbance dominates between 240 and 300 nm while DOM fluorescence prevails over DOM absorbance from 300 to 380 nm. Moreover, all studies thus far report similar spectral shapes for AQY, indicating a stable spectral CDOM to FDOM relationship (Green and Blough, 1994; Del Vecchio and Blough, 2004; Andrew et al., 2013; Cawley et al., 2015). The fact that the effect of the addition of non-fluorescent material (Figure 9) closely resembles the observations made in natural samples (Figure 5B) suggests that AQYs can be used to systematically observe changes in the ratio of FDOM to CDOM. However, to further investigate this hypothesis, knowledge about a greater number of the optically active DOM constituents, as well as the behavior of DOM AQYs of a larger number of aquatic systems, is needed.
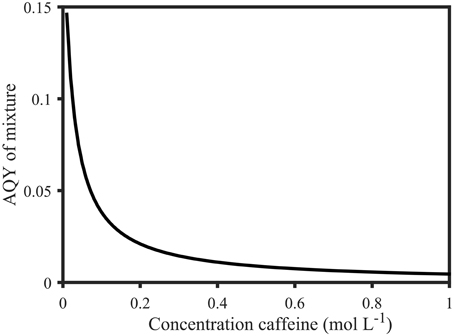
Figure 9. Calculated apparent quantum yields of a mixture of 1 mol L−1 salicylic acid solution with variable molar parts of caffeine (0.01–1 mol L−1) at 258 nm. The apparent quantum yield decreases from 0.15 (0.01 mol L−1 caffeine) to 0.0046 (1 mol L−1 caffeine). Calculations were based on Equation (5) and are explained in the Supplementary Material.
The range, as well as the spectral distribution of AQYs for FDOM samples from the Norwegian Sea and the Skagerrak (0.011 ± 0.003 at 350 nm) was similar to previous studies (e.g., Green and Blough, 1994; Andrew et al., 2013). Romera-Castillo et al. (2011) also reported similar trends in the vertical distribution of AQY350 for the Ria de Vigo (Spain) as those reported here for the Norwegian shelf, with high AQY350 in deep waters and low AQY in surface waters. With our data, Fn/An was derived to distinguish between CDOM and FDOM to elucidate this significant vertical variability. Our observation of Fn/An > 1 for subsurface waters suggests a proportionally greater production of FDOM relative to CDOM at depth in association with the remineralization of organic matter. At UVA wavelengths, both CDOM and FDOM are known to increase with depth in the global ocean (Stedmon and Nelson, 2015), which might suggest a constant AQY. In the waters sampled in this study, the trend of low AQY at the surface appears to be driven by the presence of high-CDOM waters (Figure 1), which represent terrestrial DOM from the Baltic and German Bight (Osburn and Stedmon, 2011). The fact that the ratio increases in association with the organic matter remineralization horizon indicates that there is a proportionally greater increase in FDOM relative to CDOM in association with microbial turnover of detrital organic matter (although no clear trend was apparent with oxygen utilization for this relatively limited dataset).
For wavelengths > 380 nm, AQYs have previously been described as monotonously decreasing (Sharpless and Blough, 2014 and references therein). However, one should bear in mind that fluorescence EEMs are affected by a diagonal region of Rayleigh and Raman scatter. This diagonal scatter also represents the physical limit of the fluorescence phenomenon, since emission of fluorescence always occurs at wavelengths greater than the applied excitation wavelength. Since EEMs are generally recorded over a fixed emission range (e.g., 240 to 600 nm), the number of data points capturing relevant fluorescence emission therefore decreases linearly with increasing excitation wavelength due to the incision made by the scatter region. In a theoretical scenario, the fluorescence intensity of a mixture of organic compounds affected by these limitations would therefore have to increase in order to exhibit spectrally flat AQYs (assuming a constant absorbance of the mixture). For DOM however, due to the near-exponential decrease of absorbance with wavelength, such an increase in fluorescence intensity is not plausible. It is therefore likely that the gradual decrease in AQYs at wavelengths >400 nm (Figure 4D) can in part be attributed to the methodological and physical constraints of fluorescence spectroscopy, rather than specific electronic phenomena.
Method Comparison: Quantum Yield Calculations
Both approaches for the calculation of AQYs of DOM samples yielded comparable results with regards to accuracy of AQY estimates. However, the variable-intercept approach yielded less precise estimates compared to the zero-intercept approach. The variable intercept approach also generally provided AQYs for a smaller spectral range since a multiple-point dilution is required to obtain AQYs with confidence. This results in absorption measurements in particular falling below the detection limit, and therefore hinders the determination of sensible AQYs. Since the zero-intercept approach only requires a sample to be measured once, it is the less time-consuming approach. We therefore conclude that, since both approaches provide comparable estimates (Figure 4), the zero-intercept approach is most suitable for the routine determination of AQYs of DOM samples.
Conversely, for the complete spectral characterization of specific organic compounds, the variable-intercept approach offers advantages. Especially at low S/N levels, instrumental noise and baseline offsets can cause the absorbance and fluorescence of organic compounds to vary independently. The variable-intercept approach provides quantum yields via the slope of linear fits, whereby the intercept is allowed to vary, thus accounting for wavelength-dependent instrument noise. Unlike for CDOM samples, the signal intensity for organic compounds is generally high, and the variable-intercept approach can produce stable quantum yields over a wide spectral range. In addition, the approach provides more appropriate means (compared to a single measurement method) to estimate the molar fluorescence and absorptivity of organic compounds due to increased confidence of measurements obtained in a dilution series.
Since Φ represents a physical property of an individual chemical compound, it should be spectrally constant, and thus is typically reported at a single wavelength (the absorbance maximum, e.g., Pozdnyakov et al., 2009). However, Φ of the organic compounds in our study did not appear spectrally flat. Unstable Φ in areas with low molar absorptivity represent an analytical challenge that can be addressed to some extent with an adequate pathlength for absorbance measurements, and appropriate data processing. For example, baseline offset correction is a crucial step during data processing; it mitigates monotonic Φ trends in areas with low fluorescence or absorbance, as well as spurious Φ offsets. Moreover, for the determination of Φ, the chemical purity of compounds is important for the spectral stability and overall accuracy. For example, spectral instability of Φ (along with mismatching absorbance and excitation spectra) was repeatedly seen in salicylic acid at short wavelengths, and across the spectrum of coniferyl alcohol (Figure 6A). These observations are consistent with the presence of impurities affecting a small part of the spectrum in the case of salicylic acid, and large portions of the spectrum for coniferyl alcohol, benzoic acid, and coumarin. Moreover, impurities probably lowered Φ of chemicals with mismatching absorbance and fluorescence excitation spectra, and also affected the reported molar absorptivity and fluorescence. Therefore, some compounds should be purified prior to determining Φ.
The optical properties of organic compounds generally matched those of previous studies. For example, in the case of salicylic acid, the excitation and emission peak position was within 1 nm of values reported in Pozdnyakov et al. (2009), while molar absorbance, Φ, and Stokes shift differed by 1.3, 2.9, and 0.4%, respectively. Similarly, for ferulic acid, fluorescence spectra shown in Meyer et al. (2003) indicate a close match in peak positions. Moreover, Φ of tyrosine and tryptophan was similar to previously published values (Chen, 1967). However, Φ of phenylalanine was 25% lower compared to values reported in Chen (1967). One explanation of this discrepancy is the presence of impurities, as those would likely lower Φ. This supports the conclusion that some compounds should be purified before measurements, as stated above.
As previously observed (Cawley et al., 2015), the determination of sensible AQYs for wavelengths > 450 nm is analytically challenging due to overall low signal intensities in this spectral region, particularly for oceanic samples (as observed in this study). Since absorbance is the less sensitive measurement, it represents the limiting factor in AQY determinations; even when using a pathlength of 10 cm. We therefore recommend reporting either AQY values for specific wavelengths (e.g., 350 nm), or the spectral maximum AQY, since such values can usually be obtained with confidence.
Linking Optical and Chemical Properties
Current efforts to link optical and chemical properties of DOM include the combined characterization of DOM by means of ultrahigh-resolution mass spectrometry, PARAFAC of EEMs, as well as absorbance spectroscopy and subsequent comparison using correlation analysis (Stubbins et al., 2014; Kellerman et al., 2015). An additional approach is to compare the growing database of natural DOM fluorescence spectra obtained by PARAFAC analysis (Murphy et al., 2014c) to the spectra of organic compounds. Besides comparing excitation and emission spectra, additional optical information, such as molar absorptivity and fluorescence, represent valuable Supplementary Data since they can be used to dismiss otherwise reasonable spectral matches between organic compounds and modeled FDOM spectra. Specific organic compounds in marine waters can reach concentration on the order nanomoles per liter (e.g., amino acids, Yamashita and Tanoue, 2003). The plausibility of the presence of the organic compounds investigated in this study can be assessed by comparing the information on molar absorptivity and fluorescence (Table 2) with absorbance and fluorescence levels observed in natural samples. Absorption coefficients of CDOM in the ocean typically range between 0 and 0.1 m−1, depending on wavelength, geographical location, and season, while fluorescence typically ranges from 0 to 0.02 Raman units (Stedmon and Nelson, 2015). The molar absorptivity and fluorescence of an equivalent of 1 nmol L−1 yields 35 × 10−5 to 0.0036 m−1 for absorbance, and 25 × 10−5 to 0.038 Raman units for fluorescence for the organic compounds investigated in this study. Since these values are within the range of observed signals in natural samples, it is plausible to assume that they can be constituents of CDOM/FDOM.
On the basis of molar absorptivity and fluorescence, spectral matches with the OpenFluor database for indole, tyrosine, p-cresol, salicylic acid, and L-dihydroxyphenylalanine are reasonable. However, the ability to match chemical compounds with PARAFAC components is limited by the resolving power of fluorescence spectroscopy, which is defined by the instrument or chosen by the user in form of excitation increments. As is clear from Figure 3, subtle changes in chemical structure influence the absorption properties to a large extent. However, the fluorescence emission spectra are less variable, and the position and peak width is particularly influenced by double-bond conjugation. These observations are especially apparent for indole and tryptophan, as well as p-cresol and tyrosine, as they could not be unambiguously distinguished using spectral matching. Therefore, rather than representing chemical compounds, it is more likely that PARAFAC components resemble fluorophores (i.e., for example benzoic acid, phenol, or indole), and are comprised of a number of organic compounds [as proposed earlier in Stedmon and Bro (2008)]. The individual compounds within these fluorophore groups are possibly characterized by drastically different molar fluorescence and absorbance levels. Therefore, PARAFAC components should only be assigned to specific organic compounds if spectral matches with very high Tucker congruence coefficients (>0.99) are obtained in both excitation and emission spectra, and measured concentrations appear plausible on the basis of the molar fluorescence for the assigned organic compound.
The organic compounds investigated in this study only exhibited significant quantum yields from 240 to 325 nm. However, a considerable amount of fluorescence in EEMs occurs at excitation wavelengths above 325 nm. It is therefore necessary to characterize additional organic compounds, and obtain further spectral matches between organic compounds and PARAFAC components in order to proceed in linking optical and chemical properties of DOM. The results shown here indicate that compounds with extended conjugation will likely result in visible humic-like fluorescence. However, the ability to match spectra of organic compounds with humic-like fluorescence is challenging, since such molecules likely contain multiple fluorophores that are profoundly affected in their fluorescence emission maximum and efficiency by neighboring moieties. For example, this is a known factor in tryptophan fluorescence of proteins (Vivian and Callis, 2001). An exact match would likely only be found if such a molecule could be obtained and characterized in its pure form. Moreover, some factors influencing spectral matching might also be particularly challenging to recreate in vitro, considering the large number of possible individual molecules in DOM (as evident my ultrahigh-resolution mass spectrometry, e.g., Hertkorn et al., 2013). For example, large, humic-like molecules with multiple fluorophores are likely to be particularly influenced by changes in their matrix with regards to e.g., pH, and ionic strength (Gao et al., 2015). Moreover, recent studies suggest that humic-like fluorophores are significantly influenced by charge-transfer interactions (Sharpless and Blough, 2014). Therefore, the investigation of the importance of these factors for the fluorescence of individual organic compounds needs to be subject of further studies.
Conclusions
In an effort to link optical and chemical properties of DOM, matching of fluorescence spectra of organic compounds with modeled spectra of natural samples provided valuable insights. In addition, the comprehensive characterization of potential DOM constituents is vital to assessing their plausibility. However, the capability to distinguish between organic compounds using spectral matching is limited, as many organic compounds show highly similar spectral properties. This reinforces the fact that spectral similarity alone is insufficient evidence for the presence of a particular compound, and PARAFAC components represent fluorophores, rather than specific compounds. The presented open-source MATLAB toolbox is a reliable tool for the systematic investigation of DOM AQYs, as well as Φ of organic compounds and paves the way for a more systematic cross-system analysis of apparent quantum yields. By investigating simple mixtures of organic compounds, the additive behavior of Φ was demonstrated, and the influence of non-fluorescent compounds on suppressing AQYs was illustrated. In connection with these findings, the vertical trends in AQYs of marine DOM were driven by changes in absorbance levels. Therefore, DOM AQYs mainly represent an interference of CDOM absorbance, and indicate changes in the ratio of CDOM to FDOM.
Conflict of Interest Statement
The Guest Associate Editor Dr. Christopher Osburn declares that, despite co-authoring a paper with author Dr. Colin A. Stedmon, the review process was handled objectively and no conflict of interest exists. The authors declare that the research was conducted in the absence of any commercial or financial relationships that could be construed as a potential conflict of interest.
Acknowledgments
This work is supported by Technical University of Denmark and Chalmers Technical University Nordic5Tech collaboration. CS would like to acknowledge the Danish Research Council for Independent Research (DFF 1323- 00336), and KM acknowledges funding by the Swedish Research Council for Environment, Agricultural Sciences and Spatial Planning (FORMAS grant 2013–1214). UW would like to acknowledge the assistance of Joseph Needoba during the setup of the daily startup routine for the spectrofluorometer. We thank Stephen Fortuna for the proofreading of this manuscript.
Supplementary Material
The Supplementary Material for this article can be found online at: https://www.frontiersin.org/article/10.3389/fmars.2015.00098
Footnotes
References
Aiken, G. (2014). “Fluorescence and dissolved organic matter: a chemist's perspective,” in Aquatic Organic Matter Fluorescence, eds P. Coble, J. Lead, A. Baker, D. Reynolds, and R. G. M. Spencer (New York, NY: Cambridge University Press), 35–74. doi: 10.1017/cbo9781139045452.005
Andrew, A. A., Del Vecchio, R., Subramaniam, A., and Blough, N. V. (2013). Chromophoric dissolved organic matter (CDOM) in the equatorial atlantic ocean: optical properties and their relation to CDOM structure and source. Mar. Chem. 148, 33–43. doi: 10.1016/j.marchem.2012.11.001
Austin, R. W., and Halikas, G. (1976). The Index of Refraction of Seawater. La Jolla, CA: University of California.
Blough, N. V., and Del Vecchio, R. (2002). “Chromophoric DOM in the coastal environment,” in Biogeochemistry of Marine Dissolved Organic Matter, eds D. A. Hansell and C. A. Carlson (San Diego, CA: Elsevier Inc.), 502–546.
Brouwer, A. M. (2011). Standards for photoluminescence quantum yield measurements in solution (IUPAC Technical Report). Pure Appl. Chem. 83, 2213–2228. doi: 10.1351/PAC-REP-10-09-31
Catalá, T. S., Reche, I., Álvarez, M., Khatiwala, S., Guallart, E. F., Benítez-Barrios, V. M., et al. (2015). Water mass age and aging driving chromophoric dissolved organic matter in the dark global ocean. Global Biogeochem. Cycles 29, 917–934. doi: 10.1002/2014GB005048
Cauwet, G. (1999). “Determination of dissolved organic carbon and nitrogen by high temperature combustion,” in Methods of Seawater Analysis, eds K. Grasshoff, K. Kremling, and M. Ehrhardt (Weinheim: Wiley-VCH), 407–420.
Cawley, K. M., Korak, J. A., and Rosario-Ortiz, F. L. (2015). Quantum yields for the formation of reactive intermediates from dissolved organic matter samples from the Suwannee River. Environ. Eng. Sci. 32, 31–37. doi: 10.1089/ees.2014.0280
Chen, R. F. (1967). Fluorescence quantum yields of tryptophan and tyrosine. Anal. Lett. 1, 35–42. doi: 10.1080/00032716708051097
Del Vecchio, R., and Blough, N. V. (2004). On the origin of the optical properties of humic substances. Environ. Sci. Technol. 38, 3885–3891. doi: 10.1021/es049912h
Dittmar, T., Koch, B., Hertkorn, N., and Kattner, G. (2008). A simple and efficient method for the solid-phase extraction of dissolved organic matter (SPE-DOM) from seawater. Limnol. Ocean. Methods 6, 230–235. doi: 10.4319/lom.2008.6.230
Ferrari, G. M. (2000). The relationship between chromophoric dissolved organic matter and dissolved organic carbon in the European atlantic coastal area and in the West Mediterranean Sea (Gulf of Lions). Mar. Chem. 70, 339–357. doi: 10.1016/S0304-4203(00)00036-0
Ferrari, G. M., Dowell, M. D., Grossi, S., and Targa, C. (1996). Relationship between the optical properties of chromophoric dissolved organic matter and total concentration of dissolved organic carbon in the southern Baltic Sea region. Mar. Chem. 55, 299–316. doi: 10.1016/S0304-4203(96)00061-8
Gao, Y., Yan, M., and Korshin, G. V. (2015). Effects of ionic strength on the chromophores of dissolved organic matter. Environ. Sci. Technol. 49, 5905–5912. doi: 10.1021/acs.est.5b00601
Green, S. A., and Blough, N. V. (1994). Optical absorption and fluorescence properties of chromophoric dissolved organic-matter in natural-waters. Limnol. Oceanogr. 39, 1903–1916. doi: 10.4319/lo.1994.39.8.1903
Hertkorn, N., Frommberger, M., Witt, M., Koch, B. P., Schmitt-kopplin, P., and Perdue, E. M. (2008). Natural organic matter and the event horizon of mass spectrometry. Ger. Res. 80, 8908–8919. doi: 10.1021/ac800464g
Hertkorn, N., Harir, M., Koch, B. P., Michalke, B., and Schmitt-Kopplin, P. (2013). High-field NMR spectroscopy and FTICR mass spectrometry: powerful discovery tools for the molecular level characterization of marine dissolved organic matter. Biogeosciences 10, 1583–1624. doi: 10.5194/bg-10-1583-2013
Jansen, B., Kalbitz, K., and McDowellb, W. H. (2014). Dissolved organic matter: linking soils and aquatic systems. Vadose Zone J. 13, 1–4. doi: 10.2136/vzj2014.05.0051
Jørgensen, L., Stedmon, C. A., Kragh, T., Markager, S., Middelboe, M., and Søndergaard, M. (2011). Global trends in the fluorescence characteristics and distribution of marine dissolved organic matter. Mar. Chem. 126, 139–148. doi: 10.1016/j.marchem.2011.05.002
Kellerman, A. M., Kothawala, D. N., Dittmar, T., and Tranvik, L. J. (2015). Persistence of dissolved organic matter in lakes related to its molecular characteristics. Nat. Geosci. 8, 454–457. doi: 10.1038/ngeo2440
Kowalczuk, P., Tilstone, G. H., Zabłocka, M., Röttgers, R., and Thomas, R. (2013). Composition of dissolved organic matter along an Atlantic Meridional Transect from fluorescence spectroscopy and Parallel Factor Analysis. Mar. Chem. 157, 170–184. doi: 10.1016/j.marchem.2013.10.004
Lakowicz, J. R. (2006). Principles of Fluorescence Spectroscopy, 3rd Edn. New York, NY: Springer US. doi: 10.1007/978-0-387-46312-4
Melhuish, W. H. (1961). Quantum efficiencies of fluorescence of organic substances: effect of solvent and concentration of the fluorescent solute. J. Phys. Chem. 65, 229–235. doi: 10.1021/j100820a009
Meyer, S., Cartelat, A., Moya, I., and Cerovic, Z. G. (2003). UV-induced blue-green and far-red fluorescence along wheat leaves: a potential signature of leaf ageing. J. Exp. Bot. 54, 757–769. doi: 10.1093/jxb/erg063
Morris, D. P., Zagarese, H., Williamson, C. E., Balseiro, E. G., Hargreaves, B. R., Modenutti, B., et al. (1995). The attenuation of solar UV radiation in lakes and the role of dissolved organic carbon. Limnol. Oceanogr. 40, 1381–1391. doi: 10.4319/lo.1995.40.8.1381
Murphy, K. R., Bro, R., and Stedmon, C. A. (2014a). “Chemometric analysis of organic matter fluorescence,” in Aquatic Organic Matter Fluorescence, eds P. Coble, A. Baker, J. Lead, D. Reynolds, and R. Spencer (New York, NY: Cambridge University Press), 339–375.
Murphy, K. R., Hambly, A., Singh, S., Henderson, R. K., Baker, A., Stuetz, R., et al. (2011). Organic matter fluorescence in municipal water recycling schemes: toward a unified PARAFAC model. Environ. Sci. Technol. 45, 2909–2916. doi: 10.1021/es103015e
Murphy, K. R., Parcsi, G., and Stuetz, R. M. (2014b). Non-methane volatile organic compounds predict odor emitted from five tunnel ventilated broiler sheds. Chemosphere 95, 423–432. doi: 10.1016/j.chemosphere.2013.09.076
Murphy, K. R., Ruiz, G. M., Dunsmuir, W. T. M., and Waite, T. D. (2006). Optimized parameters for fluorescence-based verification of ballast water exchange by ships. Environ. Sci. Technol. 40, 2357–2362. doi: 10.1021/es0519381
Murphy, K. R., Stedmon, C. A., Graeber, D., and Bro, R. (2013). Fluorescence spectroscopy and multi-way techniques. PARAFAC. Anal. Methods 5, 6557. doi: 10.1039/c3ay41160e
Murphy, K. R., Stedmon, C. A., Waite, T. D., and Ruiz, G. M. (2008). Distinguishing between terrestrial and autochthonous organic matter sources in marine environments using fluorescence spectroscopy. Mar. Chem. 108, 40–58. doi: 10.1016/j.marchem.2007.10.003
Murphy, K. R., Stedmon, C. A., Wenig, P., and Bro, R. (2014c). OpenFluor- an online spectral library of auto-fluorescence by organic compounds in the environment. Anal. Methods 6, 658–661. doi: 10.1039/C3AY41935E
Osburn, C. L., and Stedmon, C. A. (2011). Linking the chemical and optical properties of dissolved organic matter in the Baltic-North Sea transition zone to differentiate three allochthonous inputs. Mar. Chem. 126, 281–294. doi: 10.1016/j.marchem.2011.06.007
Parker, C. A., and Rees, W. T. (1960). Correction of fluorescence spectra and measurement of fluorescence quantum efficiency. Analyst 85:587. doi: 10.1039/an9608500587
Pozdnyakov, I. P., Pigliucci, A., Tkachenko, N., Plyusnin, V. F., Vautheyb, E., and Lemmetyinen, H. (2009). The photophysics of salicylic acid derivatives in aqueous solution. J. Phys. Org. Chem. 22, 449–454. doi: 10.1002/poc.1489
Prairie, Y. T. (2008). Carbocentric limnology: looking back, looking forward. Can. J. Fish. Aquat. Sci. 65, 543–548. doi: 10.1139/f08-011
Ravichandran, M. (2004). Interactions between mercury and dissolved organic matter - A review. Chemosphere 55, 319–331. doi: 10.1016/j.chemosphere.2003.11.011
Romera-Castillo, C., Nieto-Cid, M., Castro, C. G., Marrasé, C., Largier, J., Barton, E. D., et al. (2011). Fluorescence: absorption coefficient ratio - Tracing photochemical and microbial degradation processes affecting coloured dissolved organic matter in a coastal system. Mar. Chem. 125, 26–38. doi: 10.1016/j.marchem.2011.02.001
Seredyñska-Sobecka, B., Stedmon, C. A., Boe-Hansen, R., Waul, C. K., and Arvin, E. (2011). Monitoring organic loading to swimming pools by fluorescence excitation-emission matrix with parallel factor analysis (PARAFAC). Water Res. 45, 2306–2314. doi: 10.1016/j.watres.2011.01.010
Sharpless, C. M., and Blough, N. V. (2014). The importance of charge-transfer interactions in determining chromophoric dissolved organic matter (CDOM) optical and photochemical properties. Environ. Sci. Process. Impacts 16, 654–671. doi: 10.1039/c3em00573a
Siegel, D. A., Maritorena, S., Nelson, N. B., Behrenfeld, M. J., and McClain, C. R. (2005). Colored dissolved organic matter and its influence on the satellite-based characterization of the ocean biosphere. Geophys. Res. Lett. 32, 1–4. doi: 10.1029/2005GL024310
Søndergaard, M., Stedmon, C. A., and Borch, N. H. (2003). Fate of terrigenous dissolved organic matter (DOM) in estuaries: aggregation and bioavailability. Ophelia 57, 161–176. doi: 10.1080/00785236.2003.10409512
Stedmon, C. A., and Bro, R. (2008). Characterizing dissolved organic matter fluorescence with parallel factor analysis: a tutorial. Limnol. Oceanogr. Methods 6, 572–579. doi: 10.4319/lom.2008.6.572
Stedmon, C. A., and Markager, S. (2005). Resolving the variability of dissolved organic matter fluorescence in a temperate estuary and its catchment using PARAFAC analysis. Limnol. Oceanogr. 50, 686–697. doi: 10.4319/lo.2005.50.2.0686
Stedmon, C. A., and Nelson, N. B. (2015). “The optical properties of DOM in the ocean,” in Biogeochemistry of Marine Dissolved Organic Matter, eds D. A. Hansell and C. A. Carlson (San Diego, CA: Elsevier Inc.), 481–508.
Stedmon, C. A., Thomas, D. N., Papadimitriou, S., Granskog, M. A., and Dieckmann, G. S. (2011). Using fluorescence to characterize dissolved organic matter in Antarctic sea ice brines. J. Geophys. Res. Biogeosci. 116, 1–9. doi: 10.1029/2011jg001716
Stewart, A. J., and Wetzel, R. G. (1980). Fluorescence: absorbance ratios—a molecular-weight tracer of dissolved organic matter. Limnol. Oceanogr. 25, 559–564. doi: 10.4319/lo.1980.25.3.0559
Stubbins, A., Lapierre, J.-F., Berggren, M., Prairie, Y. T., Dittmar, T., and Del Giorgio, P. A. (2014). What's in an EEM? Molecular signatures associated with dissolved organic fluorescence in Boreal Canada. Environ. Sci. Technol. 48, 10598–10606. doi: 10.1021/es502086e
Tucker, L. R. (1951). A Method for Synthesis of Factor Analysis Studies. Personell Research Section Report No. 984, Department of the Army, Washington, DC.
Velapoldi, R. A., and Tønnesen, H. H. (2004). Corrected emission spectra and quantum yields for a series of fluorescent compounds in the visible spectral region. J. Fluoresc. 14, 465–472. doi: 10.1023/B:JOFL.0000031828.96368.c1
Vivian, J. T., and Callis, P. R. (2001). Mechanisms of tryptophan fluorescence shifts in proteins. Biophys. J. 80, 2093–2109. doi: 10.1016/S0006-3495(01)76183-8
Walker, S. A., Amon, R. M. W., Stedmon, C. A., Duan, S., and Louchouarn, P. (2009). The use of PARAFAC modeling to trace terrestrial dissolved organic matter and fingerprint water masses in coastal Canadian Arctic surface waters. J. Geophys. Res. Biogeosci. 114, 1–12. doi: 10.1029/2009jg000990
Williamson, C. E., Morris, D. P., Pace, M. L., and Olson, O. G. (1999). Dissolved organic carbon and nutrients as regulators of lake ecosystems: resurrection of a more integrated paradigm. Limnol. Oceanogr. 44, 795–803. doi: 10.4319/lo.1999.44.3_part_2.0795
Würth, C., Grabolle, M., Pauli, J., Spieles, M., and Resch-Genger, U. (2013). Relative and absolute determination of fluorescence quantum yields of transparent samples. Nat. Protoc. 8, 1535–1550. doi: 10.1038/nprot.2013.087
Yamashita, Y., Boyer, J. N., and Jaffé, R. (2013). Evaluating the distribution of terrestrial dissolved organic matter in a complex coastal ecosystem using fluorescence spectroscopy. Cont. Shelf Res. 66, 136–144. doi: 10.1016/j.csr.2013.06.010
Yamashita, Y., Kloeppel, B. D., Knoepp, J., Zausen, G. L., and Jaffé, R. (2011a). Effects of watershed history on dissolved organic matter characteristics in headwater streams. Ecosystems 14, 1110–1122. doi: 10.1007/s10021-011-9469-z
Yamashita, Y., Panton, A., Mahaffey, C., and Jaffé, R. (2011b). Assessing the spatial and temporal variability of dissolved organic matter in Liverpool Bay using excitation-emission matrix fluorescence and parallel factor analysis. Ocean Dyn. 61, 569–579. doi: 10.1007/s10236-010-0365-4
Yamashita, Y., and Tanoue, E. (2003). Chemical characterization of protein-like fluorophores in DOM in relation to aromatic amino acids. Mar. Chem. 82, 255–271. doi: 10.1016/S0304-4203(03)00073-2
Keywords: aquaDOM, OpenFluor, PARAFAC, spectral matching, EEM, FDOM, CDOM
Citation: Wünsch UJ, Murphy KR and Stedmon CA (2015) Fluorescence Quantum Yields of Natural Organic Matter and Organic Compounds: Implications for the Fluorescence-based Interpretation of Organic Matter Composition. Front. Mar. Sci. 2:98. doi: 10.3389/fmars.2015.00098
Received: 21 August 2015; Accepted: 02 November 2015;
Published: 13 November 2015.
Edited by:
Christopher Osburn, North Carolina State University, USACopyright © 2015 Wünsch, Murphy and Stedmon. This is an open-access article distributed under the terms of the Creative Commons Attribution License (CC BY). The use, distribution or reproduction in other forums is permitted, provided the original author(s) or licensor are credited and that the original publication in this journal is cited, in accordance with accepted academic practice. No use, distribution or reproduction is permitted which does not comply with these terms.
*Correspondence: Urban J. Wünsch, urbw@aqua.dtu.dk