Influence of Major Storm Events on the Quantity and Composition of Particulate Organic Matter and the Phytoplankton Community in a Subtropical Estuary, Texas
 Nicolas E. Reyna
 Amber K. Hardison
 Zhanfei Liu
- Marine Science Institute, University of Texas at Austin, Port Aransas, TX, USA
Variations in the freshwater inflow regimes of estuaries due to perturbations, such as storm events, alter the source, and composition of particulate organic matter (POM) and the phytoplankton community which are key links in estuarine carbon and nitrogen cycling. To evaluate the impact of varying freshwater discharge on POM quantity and composition and the phytoplankton community, monthly samples of surface water were collected at four long-term monitoring stations from 2012–2015 in a subtropical estuarine system, the Mission-Aransas Estuary, Texas (USA). This system is characterized by a semiarid climate, drought, and sporadic precipitation events. We analyzed organic carbon and nitrogen content, carbon and nitrogen stable isotopes, and chlorophyll a and accessory pigments of the POM samples. Following a prolonged dry spell (2012–2015), consecutive major storm events in spring 2015 led to a dramatic freshening of the entire estuary. Large increases in particulate organic carbon (POC) concentrations and decreases in δ13C values of POC over several weeks following the storms suggest an increase in in-situ production at lower salinities as a result of increased freshwater inflow. These changes in bulk POM coincided with an increase in chlorophyll a concentration, further indicating a significant contribution by phytoplankton to the elevated POM. Concurrently, pigment biomarkers revealed a significant (10-fold) increase in the cyanobacterial pigment, zeaxanthin, and further 16S rRNA analysis showed that Cyanobium spp. was responsible for the observed bloom. The combination of environment conditions, including freshening, high temperature, and high nutrients, likely contributed to the cyanobacteria bloom. These results show that episodic rain events can substantially affect estuarine phytoplankton community composition, which impacts the available energy resources for secondary production and thus may have ecosystem-wide implications on productivity.
Introduction
Estuaries provide a valuable link between terrestrial and oceanic environments through the transport, regeneration, and production of particulate organic matter (POM). POM includes both living and non-living organic matter and is the base of the food web in estuarine systems. Although concentrations of POM in estuaries are typically higher than those in the open ocean, POM in both environments consists of both labile and refractory compounds (Canuel et al., 1995; Harvey and Mannino, 2001). Autochthonous POM sources, such as estuarine phytoplankton, contain a higher relative fraction of labile POM than allochthonous sources, making them a preferable food source for primary consumers (Monbet, 1992; Canuel, 2001; Volkman et al., 2008). This fraction of the POM pool is more readily assimilated by consumers and therefore has a greater impact on the metabolism of the system than the typically more refractory terrestrially-derived organic matter (Day et al., 1989; Canuel et al., 1995; Volkman et al., 2008), although in some cases terrestrial organic matter can be biologically or photochemically labile in estuaries (Hernes and Benner, 2003; Ward et al., 2012, 2013). Estuaries are characterized by strong gradients in physical, chemical, and biological forces such as salinity and nutrient cycling which produce spatiotemporally heterogeneous conditions for phytoplankton growth and affect the availability of this nutritious, labile source of POM (Harding, 1994).
Due to their fast growth rates and importance to aquatic food webs, phytoplankton communities can rapidly respond to a range of environmental perturbations such as storm events, making them a sensitive and crucial indicator for detecting ecological change in estuaries (Peierls et al., 2003; Cloern and Dufford, 2005; Paerl et al., 2010). This has led to extensive characterization of phytoplankton communities in temperate estuaries such as San Francisco and Chesapeake Bays (e.g., Cloern and Dufford, 2005; Adolf et al., 2006; Harding et al., 2015). These systems typically experience high freshwater discharge in the spring as a result of snowmelt and rainfall. Riverine export of nutrients and warming temperatures often lead to a seasonal spring diatom bloom (Cloern and Dufford, 2005; Adolf et al., 2006; Harding et al., 2015). Phytoplankton community composition has been studied extensively in temperate estuaries with high freshwater inflows, but estuaries with low inflow and salinities that vary broadly over time have been less studied (Murrell et al., 2007). Phytoplankton community composition in temperate estuaries is commonly regulated by nutrients, flushing time, temperature, and light availability, whereas environmental controls in estuaries with episodic flooding events can vary drastically from year to year (Bianchi et al., 1997; Pinckney et al., 1998; Paerl et al., 2010; Dorado et al., 2015). Increases in terrestrially derived inorganic nutrients transported by freshwater inflows often cause a shift toward larger-celled phytoplankton, such as diatoms, which have relatively faster growth rates and reduced consumption by grazers (Cloern and Dufford, 2005; Reynolds, 2006). However, this is not always the case, as high levels of nutrients and high temperatures can lead to blooms of small-celled phytoplankton, such as cyanobacteria (Juhl and Murrell, 2005; Ren et al., 2009; Riekenberg et al., 2015).
As intensity and frequency of episodic events are projected to increase (Huntington, 2006), it is important to understand how storms impact biogeochemical processes in estuaries. As an ideal model for subtropical regions, the microtidal Mission-Aransas Estuary (MAE) is located on the western edge of the Gulf of Mexico in south Texas, with a strong episodic nature of precipitation and resulting freshwater inflow events (Mooney and McClelland, 2012; Bruesewitz et al., 2013; Lebreton et al., 2016). Compared to more “traditional” estuarine models, the MAE is often nutrient limited due to the lack of inorganic nutrient influx related to low runoff and river discharge (Mooney and McClelland, 2012; Bruesewitz et al., 2013). Episodic high freshwater inflows to the MAE significantly impact POM source and concentration (Mooney and McClelland, 2012; Lebreton et al., 2016), yet it remains unclear how storm events affect phytoplankton communities in the MAE. Phytoplankton communities in the MAE have not been systematically characterized, but in this region, chromophytes, haptophytes, pelagophytes, and dinoflagellates generally are the dominant species (Qian et al., 1996).
The objective of this study was to elucidate the impact of storm events on temporal and spatial patterns of POM and phytoplankton communities in the MAE. Previous work in the MAE determined that large storm events lead to elevated POM concentrations and depleted δ13C values of particulate organic carbon (POC) (Mooney and McClelland, 2012). Specifically, we hypothesized that high salinity drought conditions would have low POM concentrations, relatively enriched δ13C-POC, and smaller-celled phytoplankton (e.g., cyanobacteria). Inversely, low salinity post-flood conditions would have elevated POM concentrations, relatively depleted δ13C-POC, and larger-celled phytoplankton (e.g., diatoms). Phytoplankton community structure was determined using established algorithms of accessory pigments, including fucoxanthin, which is mainly produced by diatoms, and zeaxanthin, which represents cyanobacteria (Qian et al., 2003).
Materials and Methods
Site Description
The MAE is a shallow, bar-built estuary spanning approximately 200,000 acres with an average depth of 2 m (Diener, 1975; Armstrong, 1982). The system receives low base freshwater inflow and sporadic pulses from the Mission and Aransas rivers which discharge into Copano Bay (Figure 1). These two rivers have similar drainage areas (2,000–2,700 km2), but the Aransas River is impacted by cultivated crops and wastewater treatment plants while the Mission River is relatively pristine (Mooney and McClelland, 2012).
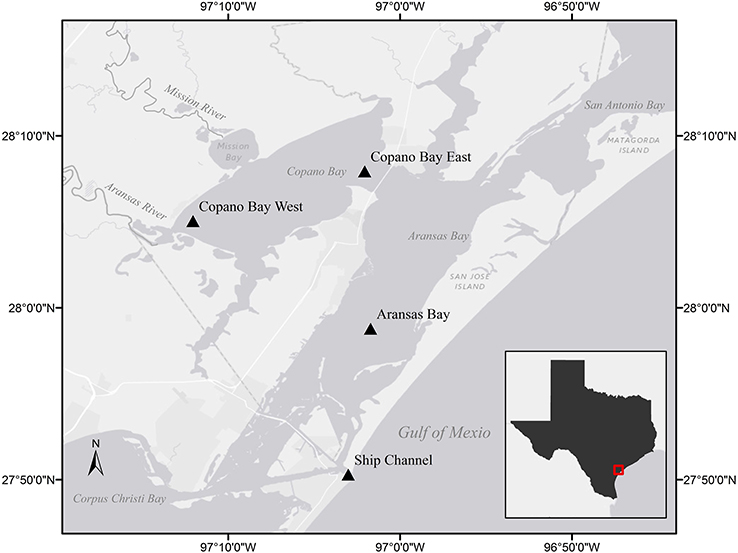
Figure 1. Stations sampled in the Mission-Aransas Estuary (MAE) identified by station name and triangle. Light gray shading indicates land while dark gray indicates water. The inset shows the study area (in red) in relation to the Texas Gulf coast.
Compounded with limited exchange with the Gulf of Mexico via the tidal inlet at the Port Aransas Shipping Channel, calculated water replacement times within the estuary are as long as 3 years (Armstrong, 1982; Solis and Powell, 1999). Lateral exchange with San Antonio Bay to the north and Corpus Christi Bay to the south can also have an impact on estuarine water quality. For example, during large flood events, the San Antonio and Guadalupe rivers discharge freshwater into San Antonio Bay which can make its way into the estuary via Mesquite Bay and the Intracoastal Waterway (Figure 1; Armstrong, 1982; Longley, 1994).
The Mission-Aransas National Estuarine Research Reserve (MANERR) runs a system-wide monitoring program (SWMP) that continuously records water quality data and collects monthly nutrient samples at four stations along the inshore to offshore transect of our sampling region (Figure 1). Two of these stations are located in Copano Bay, a secondary bay more heavily influenced by freshwater inflow due to discharge via the adjacent Mission and Aransas rivers. The Copano Bay West station, located at the mouth of the Aransas River, represents the riverine endmember station in this system while the Copano Bay East station exchanges more openly with the adjacent Aransas Bay. The Aransas Bay station reflects the influence of freshwater inflows on the estuary with increased distance from the river endmember. The station located at the Port Aransas Shipping Channel (Ship Channel station hereafter), which is as the major tidal inlet with the Gulf of Mexico, represents the marine endmember in the MAE.
Sample Collection, Water Quality, and Nutrient Analysis
From 2012 to 2015, surface water samples (0–0.5 m) were collected twice a month from March through October, and once a month from November through February at each of the four SWMP stations. Briefly, 2–4 L of surface water were collected from each station using acid-cleaned high density polyethylene bottles, kept on ice, and transported back to the University of Texas Marine Science Institute for filtration on the day of collection. Particles were obtained by filtering 85 to 1000 mL of the water onto a pre-combusted (450°C, 5 h) glass fiber filter (0.7 μm Whatman GF/F, 47 mm diameter) using low vacuum pressure, and triplicate filters were stored at −80°C until elemental, pigment, and DNA analyses.
At each station, salinity and temperature (°C) were measured continuously every 15 min by YSI 6600 V2 sondes (Yellow Springs Instruments) mounted on sampling platforms 0.5 m above the benthos. The MANERR also collects and analyzes monthly surface water nutrient samples at each station. After collection, samples are immediately stored in the dark on ice. Inorganic nutrient (, , , and ) concentrations are determined with a QuAAtro nutrient autoanalyzer (Seal Analytical) using standard colorimetric methods (precision is ± two standard deviations for each parameter). , , and were summed together and presented as dissolved inorganic nitrogen (DIN). All National Estuarine Research Reserve (NERR) water quality data is available for download at the Centralized Data Management Office (CDMO, http://cdmo.baruch.sc.edu).
POC and PN Concentrations and Source Characterization
Half of one 47 mm filter was used per time point for carbon and nitrogen determination. The filters were acidified in a fumigation chamber with concentrated (12 N) hydrochloric (HCl) acid for 24 h to remove inorganic carbon (Hedges and Stern, 1984). Following acid fumigation, the filters were allowed to vent off excess acid for 4–6 h and then dried at 60°C for at least 24 h. POC and particulate nitrogen (PN) concentrations (μM) and stable isotope ratios (‰) were determined using an Elementar Micro Cube elemental analyzer (Elementar Analysensysteme GmbH, Hanau, Germany) interfaced to an Isoprime VisION isotope ratio mass spectrometer (Isoprime Ltd., Stockport, UK) at the UC-Davis Stable Isotope Facility (UCD-SIF). Stable isotope values were expressed in δ notation relative to carbon in Vienna PeeDee Belemnite and nitrogen in air. Precision at the UCD-SIF for C/N content is within 5%, for δ13C is ± 0.2‰, and for δ15N is ± 0.3‰. It should be noted that HCl fumigation of previously frozen filters has been shown to lead to artificially lower δ15N-PN values (0.1 ‰), but this added uncertainty was acceptable given the natural variability in environmental POM samples (Lorrain et al., 2003).
Pigment Analysis and Phytoplankton Community Composition
The second (whole, untreated) 47 mm GFF filter per time point was used for pigment analysis. Pigment extraction followed the protocol of Sun et al. (1991, 1994). Briefly, pigments on filters were extracted twice with 3 mL of 100% acetone by sonication in chilled water for 15 min in the dark. The extracts were combined and analyzed using high performance liquid chromatography (HPLC) coupled with a UV-vis detector. The pigment analysis followed the protocol of McTigue et al. (2015). Briefly, a binary gradient of 28 mM tetrabutylammonium acetate (TBA) in methanol (30%:70%, v:v; eluent A) and methanol (eluent B) was used. Eluent B was ramped from 5 to 95% in 22 min, and held for 7 min before decreasing to 5% within 2 min. A C8 HPLC column (Agilent Eclipse XDB, 3.5 μm, 4.6-mm diameter × 150-mm length) was used, and the eluted pigments were detected by visible absorbance (wavelength = 450 nm). Concentrations were determined by comparing pigment peaks of equal retention time to those of certified commercial standards (DHI, VWR, and Sigma-Aldrich). Analyzed pigments included chlorophyll a, and the accessory pigments fucoxanthin, peridinin, zeaxanthin, prasinoxanthin, 19-hex-fucoxanthin, 19-but-fucoxanthin, alloxanthin, and chlorophyll b.
Chlorophyll a is targeted as a proxy for fresh algal POM. Specific microalgal groups can be detected using the accessory pigments: Chlorophyll b for chlorophytes; fucoxanthin in diatoms; peridinin in dinoflagellates; prasinoxanthin in prasinophytes; 19-hex-fucoxanthin in haptophytes; and zeaxanthin in cyanobacteria, which includes prochlorophytes (Wright et al., 1996; Morata and Renaud, 2008; Szymczak-Zyla et al., 2008). The relative chlorophyll a contributions of different algal groups to total phytoplankton biomass were calculated using the pigment algorithms summarized by Qian et al. (2003) (Table 1), which were based on previous studies and the analysis of phytoplankton cultures (Letelier et al., 1993; Andersen et al., 1996; Mackey et al., 1996; Wright and van den Enden, 2000). Negative algal group contributions were removed and reported as zero. The sum of the calculated major phytoplankton groups in the total chlorophyll a was normalized to 100% in order to compare compositional changes of phytoplankton spatially and temporally.
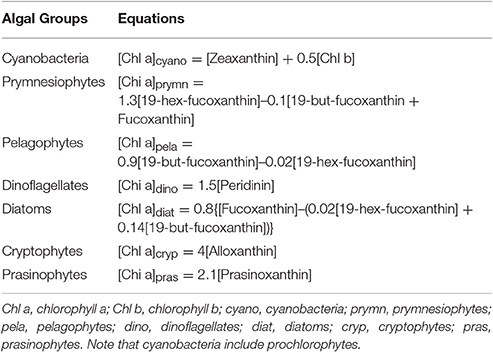
Table 1. Pigment equations used for separating chlorophyll a biomass between the major phytoplankton taxa in the MAE (Qian et al., 2003).
DNA Sequencing
To identify specific cyanobacterial species of the phytoplankton community, DNA was extracted from the GF/F filters (untreated half filter) using the PowerMag Soil DNA isolation kit (MO BIO) according to the manufacturer's instructions. The sequencing (Illumina Miseq) was performed using 28F and 519R to amplify the 500 bp region of 16S rRNA gene by the Research and Testing Laboratory (RTL) (Lubbock, Texas). The sequence data were analyzed according to the bioinformatics pipeline of RTL. Operational taxonomic unit (OTU) clustering was performed at 97% using USEARCH before classification against a 16S database derived from GenBank.
Statistics
Using R version 3.3.1 (http://www.r-project.org; R Core Team, 2013), a pairwise Pearson correlation test was performed between the POM characteristics, algal group biomass, water quality parameters, and nutrient concentrations at each station throughout the study period, with a significance cutoff of p < 0.05. Principal component analysis (PCA) was performed on data from Copano Bay West, including phytoplankton composition (%), DIN, , salinity, and temperature using MATLAB (Xue et al., 2011).
Results
River Discharge, Salinity, and Surface Water Temperature
Freshwater is delivered to Copano Bay from the Mission and Aransas rivers, so daily mean discharge data from both rivers were combined for the study period, October 30, 2012 to October 29, 2015 (Figure 2A). From October 2012 to early March 2015 (28 months) there was only one combined discharge event above 100 m3 s−1, representing a prolonged “dry period.” In contrast, from March 2015 to the end of October 2015 (4 months) there were three such events, indicating a “wet period” (gray box in Figure 2A). The average daily discharge during this wet period was 8.7 m3 s−1, more than 10 times higher than during the dry period (0.8 m3 s−1).
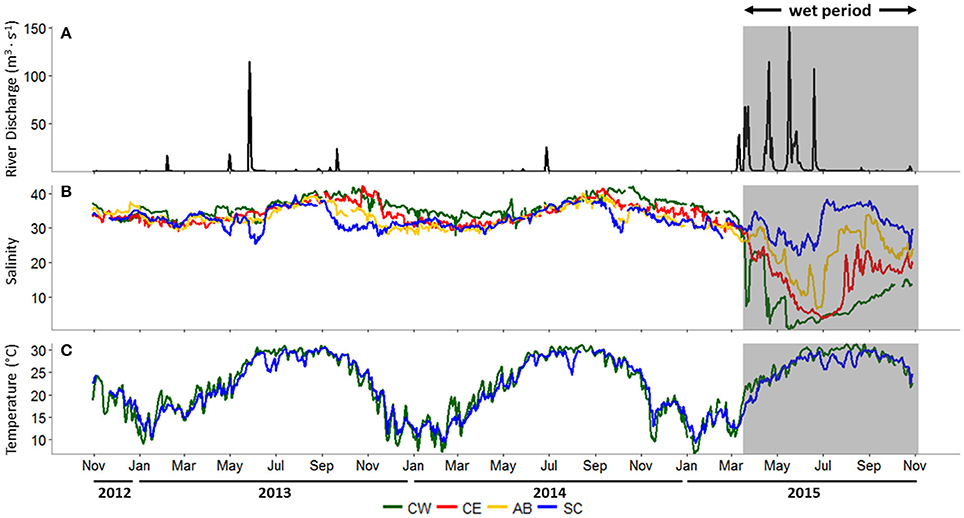
Figure 2. (A) Combined river discharge (m3 s−1) from USGS (U.S. Geological Survey) gages on the Mission and Aransas rivers, (B) salinity at all stations, (C) surface water temperature (°C) at the Copano Bay East and Ship Channel stations, October 30, 2012 to October 29, 2015. In all panels, the wet period is indicated by a shaded box. CW, Copano Bay West; CE, Copano Bay East; AB, Aransas Bay; SC, Ship Channel.
During the dry period, average daily salinity at all stations ranged from 26 to 42 (Figure 2B). Copano Bay West salinity decreased from 35 to 7 during late March 2015 due to a major storm event (Figure 2B). Over the next month, salinity at this station rose to 23 before falling to 2 in late April following a second major storm event. Over the next month, salinity at Copano Bay West rose to 10 before falling to 0 in mid-May as a consequence of a third major storm event. The recurrence of these major storm events over a period of approximately 2 months kept salinity at this station low (<10) until early September 2015. Copano Bay East salinity followed a similar pattern as Copano Bay West in response to the spring 2015 storm events, albeit with a slower, steadier decline (Figure 2B), presumably due to its more open location at the mouth of Copano Bay. From March to July 2015 salinity decreased from 32 to 4 and remained below 10 until late July 2015. Similarly, Aransas Bay salinity decreased from 31 to 7 over this 4-month period, but by late July 2015 had reached values of 30 due to its closer proximity to and flushing with the inlet with the Gulf of Mexico (Port Aransas Shipping Channel) (Figure 2B). The Ship Channel station was the least impacted by the spring 2015 storm events. However, salinity at this station did respond to these events by falling from 35 to 22 from April to late May 2015 (Figure 2B).
Average daily surface water temperatures at Copano Bay West and the Ship Channel displayed consistent annual patterns throughout the study period (Figure 2C). This is representative of surface water temperature patterns across the MAE (unpublished data, MANERR). During June temperatures typically reach ~30°C and are sustained until September, when they begin to fall until reaching annual lows of ~10°C between December and February (Figure 2C).
Spatial and Temporal Patterns of Inorganic Nutrients and Chlorophyll a
During the dry period, concentrations of DIN, dominated by (~60% of DIN, data not shown), were generally low, punctuated by episodic peaks throughout the year, ranging from 0 to 5.9 μmol-N L−1 at all stations (Figure 3A). During fall 2013, Aransas Bay and Ship Channel DIN concentrations peaked at 3.3 and 5.9 μmol-N L−1, respectively. A similar seasonal pattern was seen at both stations in 2014, along with elevated summer and fall concentrations at Copano Bay East. The major storm events during spring 2015 significantly increased DIN concentrations, most notably in Copano Bay (Figure 3A). At Copano Bay West, DIN increased from 0.2 to 23.3 μmol-N L−1 between April 10 and May 20, 2015. Concurrently, at Copano Bay East, DIN increased from 4.5 to 14.1 μmol-N L−1. These elevated concentrations were dominated by , making up 99 and 67% of DIN at Copano Bay West and East, respectively (data not shown). Values at both Copano Bay stations dropped to dry period levels by early June 2015 and remained low throughout the study period (Figure 3A).
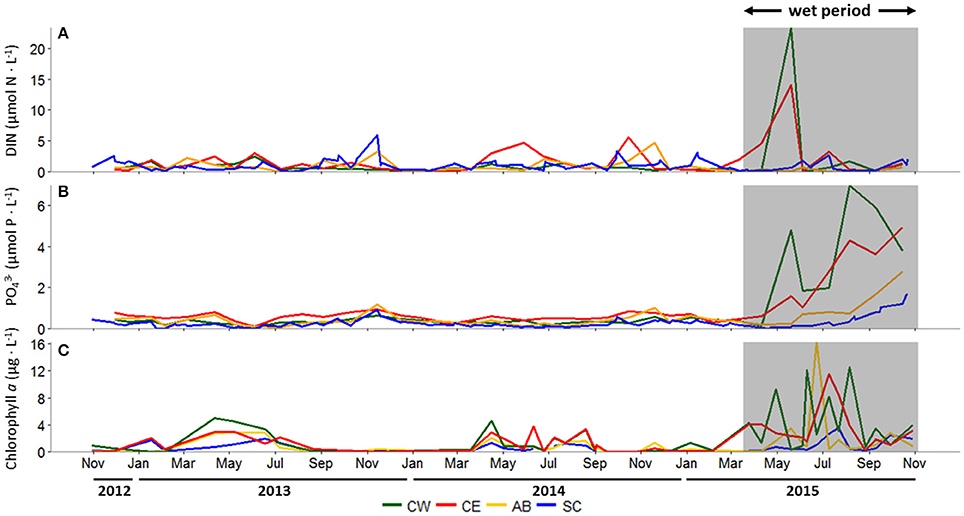
Figure 3. (A) Dissolved inorganic nitrogen (DIN; μmol N L−1), (B) phosphate (; μmol P L−1), and (C) chlorophyll a (μg L−1) concentrations at all stations, October 30, 2012 to October 29, 2015. In all panels, the wet period is indicated by a shaded box. CW, Copano Bay West; CE, Copano Bay East; AB, Aransas Bay; SC, Ship Channel.
concentrations ranged from 0 to 1.2 μmol-P L−1 at all stations throughout the dry period, remaining relatively low over time (Figure 3B). Copano Bay concentrations began to increase concurrently with DIN in late May 2015, however in contrast to DIN, which peaked briefly in May-June, concentrations continued to rise throughout the wet period. Copano Bay West peaked at 7.0 μmol-P L−1 in early August 2015 (Figure 3B). In contrast, at Copano Bay East, Aransas Bay, and the Ship Channel, maximum values were lower (4.9, 2.8, and 1.7 μmol-P L−1, respectively), and did not occur until late October 2015 (Figure 3B).
Chlorophyll a concentrations across the estuary remained <5 μg L−1 during the dry period, but showing a seasonal pattern of elevated concentrations during spring-summer (Figure 3C). Following the major storm events of spring 2015, however, chlorophyll a concentrations increased from 1 to 12 μg L−1 between June 4 and 10, 2015 at Copano Bay West (Figure 3C). Values at this station fluctuated from 3 to 13 μg L−1 for 2 months until dropping to 1 μg L−1 in late August 2015. At Copano Bay East, chlorophyll a increased from 2 to 12 μg L−1 between June 10 and July 9, 2015, showing a lag (~1 month) in response to the storm events compared to Copano Bay West (Figure 3C). Values at Copano Bay East remained > 9 μg L−1 for 2 weeks. Similarly, in Aransas Bay, chlorophyll a increased from 1 to 16 μg L−1 between June 10 and 23, 2015. Although this station had the highest overall value during the study period, chlorophyll a concentrations there remained <2 μg L−1 throughout the rest of the summer (~2 months), showing a shorter bloom than seen in Copano Bay. At the Ship Channel, chlorophyll a remained <2 μg L−1 throughout the study period, with the exception of July 2015 when it peaked at 4 μg L−1, concurrent with the summer peaks at the other stations (Figure 3C).
Spatial and Temporal Patterns in POM Concentration and Isotopic Values
During the dry period, POC concentrations at Aransas Bay, and Copano Bay West and East were elevated in spring (Figure 4A). However, during the wet period, POC concentrations in Copano Bay were the highest of the study period. From 2012 to 2015, POC concentrations ranged from 23 to 653 μmol-C L−1 at Copano Bay West, 14 to 329 μmol-C L−1 at Copano Bay East, 22 to 187 μmol-C L−1 at Aransas Bay, and 10 to 89 μmol-C L−1 at the Ship Channel station. The highest concentrations at Copano Bay West, Aransas Bay, and the Ship Channel during the dry period were 342, 187, and 89 μmol-C L−1, respectively, and peaked in March 2013. POC concentration at Copano Bay East during the dry period peaked at 152 μmol-C L−1 in early April 2014. During the wet period, POC concentrations were higher at the two Copano Bay stations (~3-fold) than the Aransas Bay and Ship Channel stations. Copano Bay West POC concentrations began to increase in late March 2015 and peaked at 653 μmol-C L−1 in early August 2015, but did not exceed 300 μmol-C L−1 until early July 2015. At Copano Bay East, POC concentrations began to increase in early June 2015 and peaked at 329 μmol-C L−1 in early July 2015.
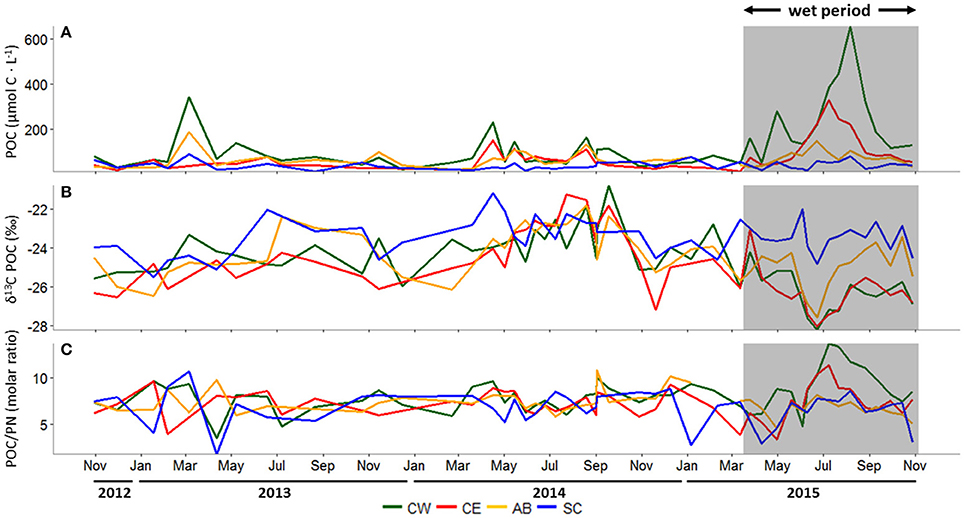
Figure 4. (A) Particulate organic carbon (POC) concentration (μmol C L−1), (B) δ13C-POC (‰), and (C) the molar ratio of POC to particulate nitrogen (PN) at all stations, October 30, 2012 to October 29, 2015. In all panels, the wet period is indicated by a shaded box. CW, Copano Bay West; CE, Copano Bay East; AB, Aransas Bay; SC, Ship Channel.
δ13C-POC in the MAE showed similar patterns at all three bay stations (Copano Bay East, Copano Bay West, Aransas Bay) during the study period; values ranged from −28.2 to −20.8‰, with a shift from relatively enriched to depleted values in June 2015 (Figure 4B). Copano Bay West displayed the greatest variation in δ13C-POC, accounting for the minimum and maximum values seen across the estuary throughout the study period. This may be due to the station's close proximity to the Aransas River mouth, making it more heavily influenced by freshwater inputs. The most enriched values at all three bay stations (excluding the Ship Channel) were recorded from July to September 2014. The more enriched δ13C-POC values correlated with higher salinities in Copano Bay (R2 = 0.70; p < 0.001) and Aransas Bay (R2 = 0.66; p < 0.001) throughout the entire study period, although no increase in δ13C was observed during summer 2013, when salinities and temperatures were nearly identical to those during summer 2014. The most depleted δ13C values at the three bay stations over the study period occurred in June 2015, showing a response to the storm-driven influx of freshwater and leading to more depleted average δ13C-POC values at Copano Bay West during the wet period (−26.3 ± 1.1‰) relative to the dry period (−24.1 ± 1.2‰).
PN and POC concentration patterns were similar (R2 = 0.59; p < 0.007), with highest concentrations detected during summer 2015, but PN was more variable than POC (Supplementary Figure 1). PN concentrations ranged from 4 to 65 μmol-N L−1at Copano Bay West, 3 to 34 μmol-N L−1 at Copano Bay East, 3 to 35 μmol-N L−1 at Aransas Bay, and 3 to 33 μmol-N L−1 at the Ship Channel station. δ15N-PN in the MAE, ranging from 3.6 to 12.7‰, showed less noticeable patterns over time than δ13C-POC (Supplementary Figure 1).
Molar C/N ratios of POM ranged from 1.7 to 13.7 across the MAE and stayed relatively constant during the dry period (Figure 4C). During the wet period, there was a shift toward higher ratios (C/N > 10) from the end of June to September 2015 at Copano Bay East and West. This C/N ratio increase occurred as POC concentrations increased, concurrent with a depletion in POC δ13C (Figure 4).
Spatial and Temporal Patterns in Phytoplankton Community Composition
The average percentage of total chlorophyll a accounted for by individual phytoplankton taxa showed that cyanobacteria and diatoms were the dominant taxa in the MAE during both the dry and the wet periods, but the community composition shifted after the major storm events of spring 2015 (Figure 5; Table 2). At Copano Bay West, both taxa displayed distinct shifts in average biomass between the dry and wet periods (Figure 5A). During the dry period, the average biomass of cyanobacteria and diatoms were 29 ± 3 and 43 ± 4%, respectively (Table 2). In contrast, during the wet period these averages were 59 ± 9 and 17± 5% for cyanobacteria and diatoms, respectively, showing a shift toward a cyanobacteria-dominated system. A similar trend was observed at the Copano Bay East and Aransas Bay stations, albeit with a more muted response in Aransas Bay (Table 2; Supplementary Figure 2). Further DNA sequencing of the Copano Bay West samples showed that the cyanobacterial community in the dry period were dominated by Prochlorococcus spp. (56–61%), followed by Cyanobium spp. (19–24%) and Synechococcus spp. (16–19%); during the wet period, Cyanobium spp. became the dominant species (75–78%) from June to August, but decreased to 35% in October 2015 (Supplementary Figure 3).
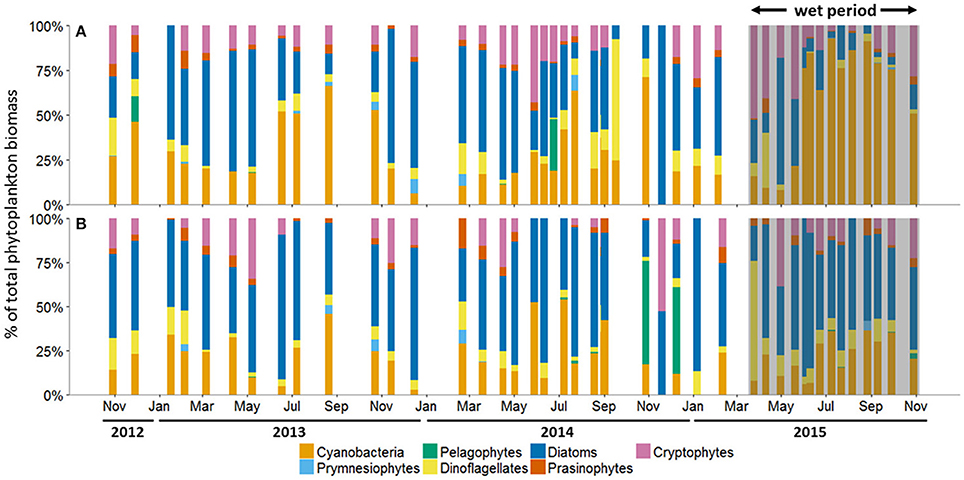
Figure 5. Phytoplankton community composition as percent (%) of total biomass at the (A) Copano Bay West and (B) Ship Channel stations, October 30, 2012 to October 29, 2015. In all panels, the wet period is indicated by a shaded box. CW, Copano Bay West; CE, Copano Bay East; AB, Aransas Bay; SC, Ship Channel.
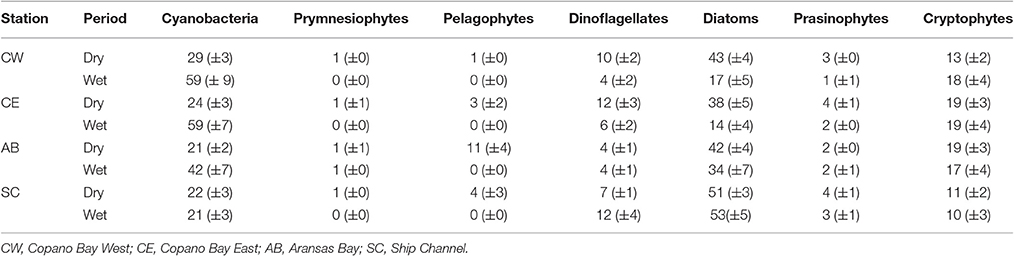
Table 2. Average biomass percentages (%) of each phytoplankton taxa at all stations in the MAE during both the dry and wet periods (all values are presented as average ± standard error).
Unlike the three bay stations, phytoplankton community composition at the Ship Channel was similar during the dry and wet periods (Figure 5B; Table 2). The average biomass of cyanobacteria and diatoms during both periods were 22 ± 4 and 52 ± 5%, respectively. Average dinoflagellate biomass increased from 7 ± 1 to 12 ± 4% during the wet period, with an accompanying decrease in average pelagophyte biomass. DNA sequencing results showed that Synechococcus spp. dominated the Ship Channel cyanobacteria community (92%) in 2013, but the community became more diverse during the wet period with contributions from Synechococcus spp. (42%), Prochlorococcus spp. (31%), and Cyanobium spp. (25%) (Supplementary Figure 3).
Discussion
POM Source Following Storm Events
Freshwater discharge into the MAE has been variable over the past decade; multi-year droughts with very low baseflows are interspersed with large storm events occurring at high frequency for many months at a time, as seen during the study period (Figure 2A) and in previous studies (Mooney and McClelland, 2012; Bruesewitz et al., 2013; Lebreton et al., 2016). These sporadic freshwater inflows significantly influence system-wide salinity, with a decreasing degree of influence along the inshore to offshore transect (Figure 2B). During summer 2015, there was a substantial peak in POC concentration in Copano Bay, surpassing any values observed during the dry period, when salinities were more stable across the estuary (Figures 2B, 4A). These results fit the pattern described previously in this system by Mooney and McClelland (2012): during 2007 (a wet year), POC concentrations in Copano Bay remained elevated for many months following major storm events in July before showing a sharp decline as salinities began to rise in spring 2008 (a dry year). The observed increase in POC during the present study can therefore be attributed to the freshening of the estuary as a result of the exponential increase in river discharge.
Sources of POC in estuaries can be inferred from the δ13C-POC values. δ13C-POC across the MAE are typically ~ −24‰ under drought conditions, but following major storm events decrease to as low as −28‰ (Figure 4B; Mooney and McClelland, 2012). The depletion in δ13C-POC is consistent with an expected depletion in dissolved inorganic carbon δ13C-DIC concurrent with decreasing salinity associated with the mixing of riverine (δ13C-DIC ~ −11‰, Fogel et al., 1992) and marine (δ13C-DIC ~ 0‰, Fogel et al., 1992) water masses, with a muted effect at the Ship Channel as a result of flushing with nearshore Gulf waters (Figure 4B; Mooney and McClelland, 2012). Riverine δ13C-DIC can drive down the estuarine δ13C-POC through uptake and fixation by estuarine phytoplankton (Figure 4B; Fogel et al., 1992). Delivery of freshwater phytoplankton from the rivers to the bay may also have contributed to the lower δ13C signal that we observed (δ13C = −31.4‰, Lebreton et al., 2016). While depleted δ13C values in river water are often attributed to C3 plant contributions from the surrounding terrestrial landscape, this is not a viable explanation in this system because POM in the Mission and Aransas rivers becomes enriched in δ13C-POC during storm flow conditions (δ13C = −22 to −20‰, Mooney and McClelland, 2012). In any case, the fact that POC concentrations and stable isotope values in the bay changed gradually over several weeks following the storms (Figures 4A,B) points to a buildup of in-situ production rather than organic matter delivered to Copano Bay via the Mission and Aransas rivers. In-situ production likely played a key role in POM dynamics throughout the wet period, as the result of initial inoculation by river-borne phytoplankton followed by increased growth of phytoplankton within the bay under relatively fresh conditions.
Following major storm events during the summer of 2015, phytoplankton biomass (chlorophyll a) at all bay stations increased, confirming enhanced in-situ production (Figure 3C). Both chlorophyll a and POC peaked first in May (Figures 3C, 4A). Then, POC reached exceptionally high levels in August, which occurred as a slow buildup of the standing stock through the summer. Chlorophyll a showed sustained high levels during the summer. These dynamics indicate two distinct peaks of phytoplankton production during the wet period. DIN concentrations also peaked in May, reflecting riverine input, then dropped precipitously, and remained low, likely supporting the initial increase in phytoplankton production (Figure 3A). Concurrent with the increased production in late summer, the C/N of Copano Bay POM increased (>10), most notably at Copano Bay West (Figure 4C). After the May phytoplankton community used the available river-derived DIN, the established phytoplankton community likely became nitrogen-limited, indicating that the rising C/N may be attributed to gradual nitrogen limitation of phytoplankton in Copano Bay (Figures 3A,C, 4C; Goldman, 1980).
Phytoplankton Community Shifts after Storm Events
Disturbances to water column hydrology, specifically drops in salinity related to hurricanes and other major storm events, have been well documented to have significant impacts on estuarine phytoplankton community composition (Qian et al., 1996; Peierls et al., 2003; Paerl et al., 2014b). For example, following the landfall of Hurricane Floyd in the fall of 1999, phytoplankton community composition in the Pamlico Sound, North Carolina, underwent numerous shifts: dinoflagellates, which typically have a strong spring bloom in the system, were rare outside of a moderate bloom the following spring, along with significant cyanobacterial blooms (exceeding pre-hurricane levels) during the subsequent two summers (Peierls et al., 2003).
In our study, phytoplankton community structure shifted dramatically after the 2015 spring storms with the estuarine-wide drop in salinity, particularly at Copano Bay West (Figure 5A). From April 30 to June 4, high percentages of diatom biomass corresponded with the initial peaks in chlorophyll a, POC, and DIN (Figures 3A,C, 4A, 5A), suggesting that the initial DIN pulse may have led to the rapid growth of diatoms. However, the continued increase in freshwater inflow associated with subsequent major storm events during the summer led to an increase and dominance by small-celled cyanobacteria, in contrast to an increase in large cell phytoplankton, as was hypothesized (Figure 5). The largest POC peak and sustained high levels of chlorophyll a during the summer reflected cyanobacterial production. Similarly, there was an increase in zeaxanthin (a cyanobacterial indicator) concentration in Aransas Bay during the summer of 1992 when salinities were depressed (<5) as the result of a large freshwater influx into the system (Qian et al., 1996). Prior to June 2015, the spring estuarine phytoplankton community was dominated by diatoms, followed by cryptophytes, dinoflagellates, and prasinophytes. However, during the wet period cyanobacteria became the dominant phytoplankton. For example, cyanobacteria accounted for 59% of total phytoplankton biomass at Copano Bay West during the wet period (Table 2; Figure 5A). Although slight increases in cyanobacterial biomass were noted during the two previous summers, this class of phytoplankton typically accounted for less than 29% (±3%) of the phytoplankton community prior to the wet period. Furthermore, cyanobacterial dominance of the phytoplankton community in Copano Bay continued until late September, when salinities rose to 13 and 18 at Copano Bay West and East, respectively (Table 2; Figure 5A; Supplementary Figure 2A). As with POM, a muted response in phytoplankton community composition occurred at Aransas Bay (Table 2; Supplementary Figure 2B). This variation in phytoplankton community response between the two bays can be explained by the flushing gradient within the system and its exchange with the Gulf of Mexico, which is further illustrated by the more rapid increase in salinity at Aransas Bay following the flood event (Figure 2B). Also, although not characterized in this study, lateral water exchange with Mesquite Bay to the north and Corpus Christi Bay to the south is expected to have had an impact on flushing in Aransas Bay (Armstrong, 1982; Longley, 1994). Estuarine and nearshore water masses are exchanged more readily in Aransas Bay due to its close proximity to the Port Aransas Shipping Channel, where community composition and salinity showed a relatively small and brief response to the storm events (Figures 2B, 5B). Most notably, this dominance of cyanobacteria (59% of phytoplankton biomass at Copano Bay West) was not seen in either of the previous two summers, when salinities were higher, and is therefore attributed to the formation of a niche for either a riverine species or an existing estuarine species with a tolerance for low salinities. Note that there is uncertainty in our calculated phytoplankton composition, since cellular content of pigments in phytoplankton cells can change with physiological state, such as nutrients and light (Qian et al., 2003). However, this should not significantly affect our results, as we analyzed more than 3 years of time-series data with the same cycling of light levels and similar nitrogen-limited conditions.
Environmental conditions may have played an important role in enhancing the growth of cyanobacteria in this system. The large pulses of freshwater, together with high surface temperatures (~30°C) from June to September, may have contributed to the cyanobacteria bloom. In the PCA biplot of relative phytoplankton biomass and various environmental parameters for Copano Bay West, cyanobacteria were particularly enriched in the samples from the wet period, well separated from the rest of the samples along PC 1 (Figure 6). From the PCA, the development of cyanobacteria appears to be related to temperature, , and water freshening (opposite of salinity). Although cyanobacteria tend to have slow growth rates compared to other phytoplankton taxa, they have been shown to respond more strongly to temperature in field and laboratory studies (Juhl and Murrell, 2005; Reynolds, 2006; Paerl et al., 2014a). Three of the major phytoplankton taxa in the MAE, diatoms, dinoflagellates, and cyanobacteria, have growth optima ranges of 15–18°, 20–23°, and 25–30°C, respectively (Paerl et al., 2014a; Dorado et al., 2015). In addition, zeaxanthin shows stronger temperature dependence than other accessory pigments in the New River Estuary, North Carolina (Hall et al., 2013). Therefore, higher temperature, together with lower salinity and high concentrations, appear to be the major factors supporting the cyanobacterial bloom after the storms events.
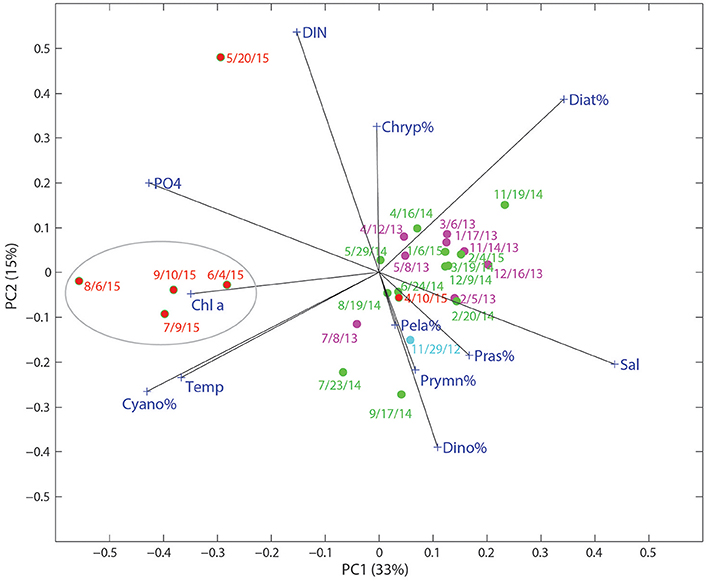
Figure 6. Score and loading results for principal component (PC) 1 and PC2 from principal component analysis (PCA) on a data matrix including phytoplankton community composition (%), nutrients (DIN and ), temperature, and salinity at the Copano Bay West station. Dates in red text correspond to the “wet period” of 2015. Circled area refers to samples taken during the period of highest phytoplankton biomass.
In addition to lowered salinity and increased temperature, DIN and concentrations were higher during the wet period and can therefore be attributed to riverine export of inorganic nutrients (Figures 3A,B, 6). Copano Bay DIN peaked in May 2015, but was drawn down quickly, as discussed previously; this DIN peak corresponded to the higher percentages of diatoms, suggesting their role in DIN uptake. The rapid disappearance of DIN may have also been due to processes such as denitrification and anammox likely occurring in sediments of this shallow water system (Bruesewitz et al., 2013). The subsequent shift toward a cyanobacteria-dominated system even though DIN concentrations remained low from June to September, suggested that cyanobacteria thrived under nitrogen-limited conditions (Figures 3C, 5A, 6). Copano Bay concentrations increased more gradually, and began reaching peak concentrations across the estuary as chlorophyll a concentrations began to drop, suggesting that was rapidly recycled following the cyanobacterial bloom; this pattern was consistent with a previous study in the system (Figures 3B,C; Mooney and McClelland, 2012). Relative to the rapid removal of DIN, concentrations of remain high throughout the wet period, indicating inefficient removal of phosphorus by the system (e.g., via microbial uptake and/or particle adorption). Cyanobacterial species that were observed in a recent study of the Breton Sound Estuary, Louisiana generally had low salinity tolerances, and it was determined that temperature, salinity, and DIN concentrations best explained annual patterns in phytoplankton community composition (Riekenberg et al., 2015). Additionally, cyanobacteria tend to be buoyant and become established in stable water columns, such as those experienced in most marine systems during the summer when the water column is stratified (Riekenberg et al., 2015). Low salinities and high temperatures created an ideal situation for the shift to a cyanobacteria-dominated phytoplankton community in the MAE during summer 2015. Additionally, it is possible that decreased filter feeding pressure contributed to the sustained increase in cyanobacterial biomass. A study on the impact of flood events on oyster populations in Copano Bay found that depressed salinities during the summer of 2007 led to reductions in oyster abundance and filtration rates (Pollack et al., 2011), which could lead to the persistence of ungrazed phytoplankton biomass in this shallow (<2 m) water column.
DNA sequencing data showed that in addition to the phytoplankton community shifting to become more cyanobacteria-dominated, the cyanobacterial community itself shifted from being dominated by Prochlorococcus spp. to Cyanobium spp. after the storm events (Table 2; Supplementary Figure 3A). Cyanobium spp. is a unicellular autotrophic coccoid picocyanobacteria (0.6–4.5 μm cell length × 0.3–1.7 μm cell width) (Komärek and Cepak, 1998; Komarek et al., 1999). Given their small size, some cells may have passed through the combusted glass fiber filter (0.7 μm pore size), leading to a potentially low estimate of Cyanobium spp. abundance. If we were actually underestimating the abundance of cyanobacteria, then this further strengthens our conclusions of cyanobacterial dominance. In a study of cyanobacterial communities in Chesapeake Bay, temperature was the most dominant environmental factor controlling picocyanobacterial populations; Cyanobium spp. occurrence was associated with lower salinities (Cai et al., 2010). In a study of cyanobacterial communities in the upper mixed layer (0–10 m) of the Baltic Sea, temperature and salinity were the potential drivers in structuring summer cyanobacterial communities (Bertos-Fortis et al., 2016). Picocyanobacteria were present in this layer year-round, and Cyanobium spp., in particular, have the ability to thrive in dynamic environments (such as the MAE) which is the reason for their year-round presence despite seasonal changes (Bertos-Fortis et al., 2016). Additionally, opportunistic picocyanobacteria occurrence was mainly explained by changes in temperature and salinity which matches the pattern seen in the present study; Cyanobium spp. dominated during the low salinity summer 2015 wet period, and Prochlorococcus spp. dominating during the high salinity summers of 2013 and 2014 (Figures 2B, 4A; Supplementary Figure 3A; Bertos-Fortis et al., 2016).
Although Cyanobium spp. are not known nitrogen fixing bacteria, DIN assimilation can be the primary fate of DIN in the MAE during drought conditions even when measured DIN concentrations are low (Figure 3A; Stal, 2009; Hou et al., 2012; Bruesewitz et al., 2015). This indicates that high DIN regeneration coupled with high uptake, along with a high surface to volume ratio due to their small size, may have allowed Cyanobium spp. to continue flourishing for several months after DIN concentrations had dropped (Figure 3A; Supplementary Figure 3A). Overall, picocyanobacteria dominated the summer cyanobacterial community in the MAE throughout the study period, but lower salinities related to consecutive major storm events led to Cyanobium spp. dominating the picocyanobacterial community during the summer of 2015.
Conclusions and Implications
POM source and concentration can indicate changes in the source of estuarine production, but this may be too coarse to elucidate fine changes in the source of production in the MAE. Using photosynthetic pigments, we determined that periods of drought favor a more diverse assemblage of phytoplankton, with relatively high diatom and dinoflagellate biomass. Major flood events led to a picocyanobacteria-dominated phytoplankton community, specifically Cyanobium spp., which was present in summer picocyanobacterial communities throughout the study period. The timing of the consecutive storm events in spring 2015 had a profound impact on the ability of this species to dominate, as rising temperatures and depressed salinities opened up a niche for this species to flourish. Changes in phytoplankton community composition can drastically affect the transfer of energy to higher trophic levels, thus having major implications for ecosystem-wide productivity (Cloern and Dufford, 2005), and is a topic for further study in this system. This study also suggests that this system is very efficient at removing the riverine-derived DIN after the storm events, but the flux of to the coastal ocean through the ship channel may be significant (Bhavya et al., 2016; Krishna et al., 2016).
In a region where recreational and commercial fishing are important to the local economy, impacts on ecosystem productivity should be carefully monitored. Given the importance of cultivated crops in the Mission-Aransas watershed, understanding the impact of freshwater inflows on the phytoplankton community in this estuary is key to the management of these vital sporadic freshwater inflows. Furthermore, cyanobacteria show extreme plasticity toward changes in environmental conditions and aquatic systems across the world, and cyanobacterial bloom frequency and duration are projected to increase in response to climate change (Paerl et al., 2014a; Bertos-Fortis et al., 2016).
Author Contributions
NR, AH, and ZL conceived, designed, and wrote the paper.
Conflict of Interest Statement
The authors declare that the research was conducted in the absence of any commercial or financial relationships that could be construed as a potential conflict of interest.
Acknowledgments
We thank J. Liu, S. Liu, K. Jackson, J. Xue, and C. Bonsell for help with pigment analyses and lab support. Thanks also to the MANERR staff: J. Tunnell, C. Hyatt, C. Croulet, and H. Samberson for help with sample collection and logistical support. We are grateful for substantive comments on previous drafts of this paper from E. Buskey, J. McClelland, and three reviewers. N. Reyna was partially supported by the University of Texas Graduate School Diversity Mentoring Fellowship. This research was partially funded by National Oceanic and Atmospheric Administration (NA15NOS4780185) and by operations grants to the Mission-Aransas National Estuarine Research Reserve from the Office of Coastal Management, National Oceanic and Atmospheric Administration. System-Wide Monitoring Program data was collected by the research staff of the Mission-Aransas NERR and hosted by the Central Data Management Office of the National Estuarine Research Reserve System. Publication supported in part by an Institutional Grant (NA14OAR4170102) to the Texas Sea Grant College Program from the National Sea Grant Office, National Oceanic and Atmospheric Administration, U.S. Department of Commerce.
Supplementary Material
The Supplementary Material for this article can be found online at: https://www.frontiersin.org/article/10.3389/fmars.2017.00043/full#supplementary-material
Supplementary Figure 1. (A) Particulate nitrogen (PN) concentration and (B) δ15N-PN (‰) at all stations, October 30, 2012 to October 29, 2015. In all panels, the wet period is indicated by a shaded box. CW, Copano Bay West; CE, Copano Bay East; AB, Aransas Bay; SC, Ship Channel.
Supplementary Figure 2. Phytoplankton community composition as percent (%) of total biomass at the (A) Copano Bay East and (B) Aransas Bay stations, October 30, 2012 to October 29, 2015. In all panels, the wet period is indicated by a shaded box.
Supplementary Figure 3. Cyanobacterial community composition as displayed by cyanobacterial operational taxonomic units (OTUs) at the (A) Copano Bay West and (B) Ship Channel stations.
References
Adolf, J. E., Yeager, C. L., Miller, W. D., Mallonee, M. E., and Harding, L. W. Jr. (2006). Environmental forcing of phytoplankton floral composition, biomass, and primary productivity in Chesapeake Bay, USA. Estuar. Coast. Shelf Sci. 67, 108–122. doi: 10.1016/j.ecss.2005.11.030
Andersen, R. A., Bidigare, R. R., Keller, M. D., and Latasa, M. (1996). A comparison of HPLC pigment signatures and electron microscopic observations for oligotrophic waters of the North Atlantic and Pacific Oceans. Deep Sea Res. II 43, 517–537.
Armstrong, N. E. (1982). “Responses of Texas estuaries to freshwater inflows,” in Estuarine Comparisons, ed V. S. Kennedy (New York, NY: Academic Press), 103–120.
Bertos-Fortis, M., Farnelid, H. M., Lindh, M. V., Casini, M., Andersson, A., Pinhassi, J., et al. (2016). Unscrambling cyanobacteria community dynamics related to environmental factors. Front. Microbiol. 7:625. doi: 10.3389/fmicb.2016.00625
Bhavya, P. S., Kumar, S., Gupta, G. V. M., Sudheesh, V., Sudharma, K. V., Varrier, D. S., et al. (2016). Nitrogen uptake dynamics in a tropical eutrophic estuary (Cochin, India) and adjacent coastal waters. Estuar. Coasts 39, 54–67. doi: 10.1007/s12237-015-9982-y
Bianchi, T. S., Baskaran, M., DeLord, J., and Ravichandran, M. (1997). Carbon cycling in a shallow turbid estuary of southeast Texas: the use of plant pigment biomarkers and water quality parameters. Estuaries 20, 404–415.
Bruesewitz, D. A., Gardner, W. S., Mooney, R. F., and Buskey, E. J. (2015). Seasonal water column NH4 + cycling along a semi-arid sub-tropical river–estuary continuum: responses to episodic events and drought conditions. Ecosystems 18, 792–812. doi: 10.1007/s10021-015-9863-z
Bruesewitz, D. A., Gardner, W. S., Mooney, R. F., Pollard, L., and Buskey, E. J. (2013). Estuarine ecosystem function response to flood and drought in a shallow, semiarid estuary: nitrogen cycling and ecosystem metabolism. Limnol. Oceanogr. 58, 2293–2309. doi: 10.4319/lo.2013.58.6.2293
Cai, H., Wang, K., Huang, S., Jiao, N., and Chen, F. (2010). Distinct patterns of picocyanobacterial communities in winter and summer in the Chesapeake Bay. Appl. Environ. Microbiol. 76, 2955–2960. doi: 10.1128/AEM.02868-09
Canuel, E. A. (2001). Relations between river flow, primary production and fatty acid composition of particulate organic matter in San Francisco and Chesapeake Bays: a multivariate approach. Org. Geochem. 32, 563–583. doi: 10.1016/S0146-6380(00)00195-9
Canuel, E. A., Cloern, J. E., Ringelberg, D. B., Guckert, J. B., and Rau, G. H. (1995). Molecular and isotopic tracers used to examine sources of organic matter and its incorporation into the food webs of San Francisco Bay. Limnol. Oceanogr. 40, 67–81.
Cloern, J. E., and Dufford, R. (2005). Phytoplankton community ecology: principles applied in San Francisco Bay. Mar. Ecol. Prog. Ser. 285, 11–28. doi: 10.3354/meps285011
Day, J. W. Jr., Hall, C. A. S., Kemp, W. M., Yanez-Arancibia, A., and Christian, R. R. (eds.). (1989). “Microbial ecology and organic detritus in estuaries,” in Estuarine Ecology (New York, NY: John Wiley & Sons), 257–308.
Diener, R. A. (1975). Cooperative Gulf of Mexico Estuarine Inventory and Study - Texas: Area Description, NOAA Technical Report NMFS CIRC-393. U.S. Dept. of Commerce, National Oceanic and Atmospheric Administration, Seattle, WA.
Dorado, S., Booe, T., Steichen, J., McInnes, A. S., Windham, R., Shepard, A., et al. (2015). Towards an understanding of the interactions between freshwater inflows and phytoplankton communities in a subtropical estuary in the Gulf of Mexico. PLoS ONE 10:e0130931. doi: 10.1371/journal.pone.0130931
Fogel, M. L., Cifuentes, L. A., Velinsky, D. J., and Sharp, J. H. (1992). Relationship of carbon availability in estuarine phytoplankton to isotopic composition. Mar. Ecol. Prog. Ser. 82, 291–300.
Goldman, J. C. (1980). “Physiological processes, nutrient availability, and the concept of relative growth rate in marine phytoplankton ecology,” in Primary Productivity in the Sea, ed P. G. Falkowski (New York, NY: Plenum Press), 179–194.
Hall, N. S., Paerl, H. W., Peierls, B. L., Whipple, A. C., and Rossignol, K. L. (2013). Effects of climatic variability on phytoplankton community structure and bloom development in the eutrophic, microtidal, New River Estuary, North Carolina, USA. Estuar. Coast. Shelf Sci. 117, 70–82. doi: 10.1016/j.ecss.2012.10.004
Harding, L. W. Jr. (1994). Long-term trends in the distribution of phytoplankton in Chesapeake Bay: roles of light, nutrients and streamflow. Mar. Ecol. Prog. Ser. 104, 267–291.
Harding, L. W. Jr., Adolf, J. E., Mallonee, M. E., Miller, W. D., Gallegos, C. L., Perry, E. S., et al. (2015). Climate effects on phytoplankton floral composition in Chesapeake Bay. Estuar. Coast. Shelf Sci. 162, 53–68. doi: 10.1016/j.ecss.2014.12.030
Harvey, H. R., and Mannino, A. (2001). The chemical composition and cycling of particulate and macromolecular dissolved organic matter in temperate estuaries as revealed by molecular organic tracers. Org. Geochem. 32, 527–542. doi: 10.1016/S0146-6380(00)00193-5
Hedges, J. I., and Stern, J. H. (1984). Carbon and nitrogen determinations of carbonate-containing solids. Limnol. Oceanogr. 29, 657–663.
Hernes, P. J., and Benner, R. (2003). Photochemical and microbial degradation of dissolved lignin phenols: implications for the fate of terrigenous dissolved organic matter in marine environments. J. Geophys. Res. 108, 3291. doi: 10.1029/2002JC001421
Hou, L., Liu, M., Carini, S. A., and Gardner, W. S. (2012). Transformation and fate of nitrate near the sediment–water interface of Copano Bay. Cont. Shelf Res. 35, 86–94. doi: 10.1016/j.csr.2012.01.004
Huntington, T. G. (2006). Evidence for intensification of the global water cycle: review and synthesis. J. Hydrol. 319, 83–95. doi: 10.1016/j.jhydrol.2005.07.003
Juhl, A. R., and Murrell, M. C. (2005). Interactions between nutrients, phytoplankton growth, and microzooplankton grazing in a Gulf of Mexico estuary. Aquat. Microb. Ecol. 38, 147–156. doi: 10.3354/ame038147
Komärek, J., and Cepak, V. (1998). Cytomorphological characters supporting the taxonomic validity of Cyanothece (Cyanoprokaryota). Plant Syst. Evol. 210, 25–39.
Komarek, J., Kopecky, J., and Cepak, V. (1999). Generic characters of the simplest cyanoprokaryotes Cyanobium, Cyanobacterium, and Synechococcus. Cryptogam. Algol. 20, 209–222. doi: 10.1016/S0181-1568(99)80015-4
Krishna, M. S., Prasad, M. H. K., Rao, D. B., Viswanadham, R., Sarma, V. V. S. S., and Reddy, N. P. C. (2016). Export of dissolved inorganic nutrients to the northern Indian Ocean from the Indian monsoonal rivers during discharge period. Geochim. Cosmochim. Acta 172, 430–443. doi: 10.1016/j.gca.2015.10.013
Lebreton, B., Pollack, J. B., Blomberg, B., Palmer, T. A., Adams, L., Guillou, G., et al. (2016). Origin, composition and quality of suspended particulate organic matter in relation to freshwater inflow in a south Texas estuary. Estuar. Coast. Shelf Sci. 170, 70–82. doi: 10.1016/j.ecss.2015.12.024
Letelier, R. M., Bidigare, R. R., Hebel, D. V., Ondrusek, M., Winn, C. D., and Karl, D. M. (1993). Temporal variability of phytoplankton community structure based on pigment analysis. Limnol. Oceanogr. 38, 1420–1437.
Longley, W. L. (1994). Freshwater Inflows to Texas Bays and Estuaries: Ecological Relationships and Methods for Determination of Needs. Austin: Texas Water Development Board and Texas Parks and Wildlife Department.
Lorrain, A., Savoye, N., Chauvaud, L., Paulet, Y., and Naulet, N. (2003). Decarbonation and preservation method for the analysis of organic C and N contents and stable isotope ratios of low-carbonated suspended particulate material. Anal. Chim. Acta 491, 125–133. doi: 10.1016/S0003-2670(03)00815-8
Mackey, M. D., Mackey, D. J., Higgins, H. W., and Wright, S. W. (1996). Chemtax—a program for estimating class abundances from chemical markers: application to HPLC measurements of phytoplankton. Mar. Ecol. Prog. Ser. 144, 265–283.
McTigue, N. D., Bucolo, P., Liu, Z., and Dunton, K. H. (2015). Pelagic-benthic coupling, food webs, and organic matter degradation in the Chukchi Sea: insights from sedimentary pigments and stable carbon isotopes. Limnol. Oceanogr. 60, 429–445. doi: 10.1002/lno.10038
Monbet, Y. (1992). Control of phytoplankton biomass in estuaries : a comparative analysis of microtidal and macrotidal estuaries. Estuaries 15, 563–571.
Mooney, R. F., and McClelland, J. W. (2012). Watershed export events and ecosystem responses in the Mission-Aransas National Estuarine Research Reserve, south Texas. Estuar. Coasts. 35, 1468–1485. doi: 10.1007/s12237-012-9537-4
Morata, N., and Renaud, P. E. (2008). Sedimentary pigments in the western Barents Sea: a reflection of pelagic-benthic coupling? Deep Sea Res. II Top. Stud. Oceanogr. 55, 2381–2389. doi: 10.1016/j.dsr2.2008.05.004
Murrell, M. C., Hagy, J. D. III, Lores, E. M., and Greene, R. M. (2007). Phytoplankton production and nutrient distributions in a subtropical estuary: importance of freshwater flow. Estuar. Coasts 30. 390–402. doi: 10.1007/BF02819386
Paerl, H. W., Hall, N. S., Peierls, B. L., and Rossignol, K. L. (2014a). Evolving paradigms and challenges in estuarine and coastal eutrophication dynamics in a culturally and climatically stressed world. Estuar. Coasts 37, 243–258. doi: 10.1007/BF02819386
Paerl, H. W., Hall, N. S., Peierls, B. L., Rossignol, K. L., and Joyner, A. R. (2014b). Hydrologic variability and its control of phytoplankton community structure and function in two shallow, coastal, lagoonal ecosystems: the Neuse and New River Estuaries, North Carolina, USA. Estuar. Coasts. 37(Suppl. 1), S31–S45. doi: 10.1007/s12237-013-9686-0
Paerl, H. W., Rossignol, K. L., Hall, S. N., Peierls, B. L., and Wetz, M. S. (2010). Phytoplankton community indicators of short- and long-term ecological change in the anthropogenically and climatically impacted Neuse River Estuary, North Carolina, USA. Estuar. Coasts 33, 485–497. doi: 10.1007/s12237-009-9137-0
Peierls, B. L., Christian, R. R., and Paerl, H. W. (2003). Water quality and phytoplankton as indicators of hurricane impacts on a large estuarine ecosystem. Estuaries 26, 1329–1343. doi: 10.1007/BF02803635
Pinckney, J. L., Paerl, H. W., Harrington, M. B., and Howe, K. E. (1998). Annual cycles of phytoplankton community-structure and bloom dynamics in the Neuse River Estuary, North Carolina. Mar. Biol. 131, 371–381.
Pollack, J. B., Kim, H., Morgan, E. K., and Montagna, P. A. (2011). Role of flood disturbance in natural oyster (Crassostrea virginica) population maintenance in an estuary in south Texas, USA. Estuar. Coasts 34, 187–197. doi: 10.1007/s12237-010-9338-6
Qian, Y., Jochens, A. E., Kennicutt, M. C., and Biggs, D. C. (2003). Spatial and temporal variability of phytoplankton biomass and community structure over the continental margin of the northeast Gulf of Mexico based on pigment analysis. Cont. Shelf Res. 23, 1–17. doi: 10.1016/S0278-4343(02)00173-5
Qian, Y., Kennicutt, M. C., Svalberg, J., Macko, S. A., Bidigare, R. R., and Walker, J. (1996). Suspended particulate organic matter (SPOM) in Gulf of Mexico estuaries: compound-specific isotope analysis and plant pigment compositions. Org. Geochem. 24, 875–888.
R Core Team (2013). R: A Language and Environment for Statistical Computing. Vienna: R Foundation for Statistical Computing. Available online at: http://www.R-project.org/
Ren, L., Rabalais, N. N., Turner, R. E., Morrison, W., and Mendenhall, W. (2009). Nutrient limitation on phytoplankton growth in the Upper Barataria Basin, Louisiana: microcosm bioassays. Estuar. Coasts 32, 958–974. doi: 10.1007/s12237-009-9174-8
Riekenberg, J., Bargu, S., and Twilley, R. (2015). Phytoplankton community shifts and harmful algae presence in a diversion influenced estuary. Estuar. Coasts 38, 2213–2226. doi: 10.1007/s12237-014-9925-z
Solis, R. S., and Powell, G. L. (1999). “Hydrography, mixing characteristics, and residence times of Gulf of Mexico estuaries,” in Biogeochemistry of Gulf of Mexico Estuaries, ed T. S. Bianchi (New York, NY: John Wiley & Sons), 29–61.
Stal, L. J. (2009). Is the distribution of nitrogen-fixing cyanobacteria in the oceans related to temperature ? Environ. Microbiol. 11, 1632–1645. doi: 10.1111/j.1758-2229.2009.00016.x
Sun, M., Aller, R. C., and Lee, C. (1991). Early diagenesis of chlorophyll-a in Long Island Sound sediments: a measure of carbon flux and particle reworking. J. Mar. Res. 49, 379–401.
Sun, M., Aller, R. C., and Lee, C. (1994). Spatial and temporal distributions of sedimentary chloropigments as indicators of benthic processes in Long Island Sound. J. Mar. Res. 52, 149–176.
Szymczak-Zyla, M., Kowalewska, G., and Louda, J. W. (2008). The influence of microorganisms on chlorophyll a degradation in the marine environment. Limnol. Oceanogr. 53, 851–862. doi: 10.4319/lo.2008.53.2.0851
Volkman, J. K., Revill, A. T., Holdsworth, D. G., and Fredericks, D. (2008). Organic matter sources in an enclosed coastal inlet assessed using lipid biomarkers and stable isotopes. Org. Geochem. 39, 689–710. doi: 10.1016/j.orggeochem.2008.02.014
Ward, N. D., Keil, R. G., Medeiros, P. M., Brito, D. C., Cunha, A. C., Dittmar, T. D., et al. (2013). Degradation of terrestrially derived macromolecules in the Amazon River. Nat. Geosci. 6, 530–533. doi: 10.1038/NGEO1817
Ward, N. D., Ricky, J. E., and Keil, R. G. (2012). Temporal variation in river nutrient and dissolved lignin phenol concentrations and the impact of storm events on nutrient loading to Hood Canal, Washington, USA. Biogeochemistry 111, 629–645. doi: 10.1007/s10533-012-9700-9
Wright, S. W., Thomas, D. P., Marchant, H. J., Higgins, H. W., Mackey, M. D., and Mackey, D. J. (1996). Analysis of phytoplankton of the Australian sector of the Southern Ocean: comparisons of microscopy and size frequency data with interpretations of pigment HPLC data using the “CHEMTAX” matrix factorisation program. Mar. Ecol. Prog. Ser. 144, 285–298.
Wright, S. W., and van den Enden, R. L. (2000). Phytoplankton community structure and stocks in the East Antarctic marginal ice zone (BROKE survey, January–March 1996) determined by CHEMTAX analysis of HPLC pigment signatures. Deep Sea Res. II 47, 2363–2400. doi: 10.1016/S0967-0645(00)00029-1
Keywords: mission aransas estuary, storms, particulate organic matter, carbon and nitrogen isotopes, accessory pigments, cyanobacteria, phytoplankton pigments, phytoplankton
Citation: Reyna NE, Hardison AK and Liu Z (2017) Influence of Major Storm Events on the Quantity and Composition of Particulate Organic Matter and the Phytoplankton Community in a Subtropical Estuary, Texas. Front. Mar. Sci. 4:43. doi: 10.3389/fmars.2017.00043
Received: 08 November 2016; Accepted: 07 February 2017;
Published: 24 February 2017.
Edited by:
Nicholas David Ward, Pacific Northwest National Laboratory (DOE), USAReviewed by:
Gupta G.V.M., Ministry of Earth Sciences, IndiaAna Rosa Arellano, University of Florida, USA
Allison Myers-Pigg, Texas A&M University, USA
Copyright © 2017 Reyna, Hardison and Liu. This is an open-access article distributed under the terms of the Creative Commons Attribution License (CC BY). The use, distribution or reproduction in other forums is permitted, provided the original author(s) or licensor are credited and that the original publication in this journal is cited, in accordance with accepted academic practice. No use, distribution or reproduction is permitted which does not comply with these terms.
*Correspondence: Amber K. Hardison, amber.hardison@utexas.edu
Zhanfei Liu, zhanfei.liu@utexas.edu