Overview of the Ocean Climatology and Its Variability in the Azores Region of the North Atlantic Including Environmental Characteristics at the Seabed
 Patrícia Amorim1*
  António D. Perán1
  Christopher K. Pham1
  Manuela Juliano2
  Frederico Cardigos1
  Fernando Tempera1
  Telmo Morato1
- 1MARE Marine and Environmental Sciences Centre and IMAR Institute of Marine Research, University of the Azores, Horta, Portugal
- 2Laboratório de Ambiente Marinho e Tecnologia-ID, University of the Azores, Praia da Vitória, Portugal
Obtaining a comprehensive knowledge of the spatial and temporal variations of the environmental factors characterizing the Azores region is essential for conservation and management purposes. Although many studies are available for the region, there is a need for a general overview of the best available information. Here, we assembled a comprehensive collection of environmental data and briefly described the ocean climatology and its variability in the Azores. Data sources used in this study included remote sensing oceanographic data for 2003–2013 (sea surface temperature, chlorophyll-a concentration, particulate inorganic carbon, and particulate organic carbon), derived oceanographic data (primary productivity and North Atlantic oscillation index) for 2003–2013, and in situ data (temperature, salinity, oxygen, phosphate, nitrate and silicate) obtained from the World Ocean Atlas 2013. We have produced 78 geographic datasets of environmental data for the Azores region that were deposited at the World Data Center Pangaea and also made available at the SIGMAR Azores website. As with previous studies, our results confirmed a high spatial, seasonal and inter-annual variability of the marine environment in the Azores region, typical of mid-latitudes. For example, lower sea surface temperature was found in the northern part of the study area coinciding with higher values for chlorophyll-a concentration, net primary production (NPP), and particulate organic and inorganic carbon. Higher values for some of these parameters were also found on island slopes and some seamounts. Compiled data on the environmental conditions at near-seabed revealed some notable variations across the study area (e.g., oxygen and nutrients) and with depth (e.g., temperature, salinity, and oxygen). Knowledge of these patterns will help improve our understanding of the distribution of many deep-sea organisms such as fish, cold-water corals, and sponges, thereby supporting the implementation of marine spatial planning and other management measures. It should be noted that the assembled datasets suffer from a number of limitations related to the accuracy of remote sensing and global bathymetry data, or to the limited and unevenly distributed collection of environmental observations. Accordingly, an effective observing system for detecting oceanic change with adequate accuracy and precision is still required.
Introduction
Effective ecosystem management is often hampered by the paucity of information on the spatial distribution of marine species and habitats that can partly be filled by statistical modeling (Guisan and Zimmermann, 2000; Guisan et al., 2002; Guisan and Thuiller, 2005). For instance, species distribution models (SDMs) have proved useful for a broad variety of applications, such as assessing the potential impacts of climate change on species distribution (Thomas et al., 2004; Gritti et al., 2006; Wiens et al., 2009; Jones et al., 2013), designing marine protected areas (Sundblad et al., 2011) or predicting the potential distribution of invasive species (Tyberghein et al., 2012). Such models essentially rely on statistical correlations between existing data on species occurrence and environmental parameters to predict distribution across selected geographical areas. Therefore, the success of these statistical models depend heavily on the availability of ocean environmental data.
Several global and regional databases with relevant oceanographic data have been used to describe general climatological patterns. The most known is probably the World Ocean Atlas 2013 (WOA13; Boyer et al., 2013), which provides data on oxygen, nutrients, temperature, and salinity at different standard depths of the ocean. Additionally, remote sensing imagery is regularly compiled by several international organizations (e.g., NASA's Ocean Color Web), which provides satellite-based oceanographic data on chlorophyll-a concentration, and sea surface temperature among others, at different resolutions.
Contrary to ocean surface layers, where many environmental conditions are well-characterized, the application of SDMs in the deep sea has been hindered by the limited amount of high-resolution data on the environmental conditions near the seafloor (Vierod et al., 2014). However, global and regional scale studies have demonstrated the potential of large-scale oceanographic data (e.g., World Ocean Atlas; Boyer et al., 2013) to create grids representative of conditions at the seafloor, permitting the development of distribution models useful for management (Davies et al., 2008; Tittensor et al., 2009; Davies and Guinotte, 2011; Yesson et al., 2012, in press; Rengstorf et al., 2013; Guinotte and Davies, 2014; Anderson et al., 2016).
The Azores is an oceanic archipelago located in the middle of the North Atlantic Ocean, characterized by a large marine territory known to host a wide variety of open-ocean and deep-sea organisms. For example, the archipelago is recognized for its key role as a transitionary habitat for large open-ocean animals such as cetaceans, sharks, pelagic fish, or sea-turtles (Silva M. A. et al., 2013; Vandeperre et al., 2014; Prieto et al., in press; Tobeña et al., 2016) and to harbor valuable deep-sea resources and ecosystems such as deep-sea fish (Menezes et al., 2006) or cold-water coral aggregations (Braga-Henriques et al., 2013; Tempera et al., 2013; Pham et al., 2015). Therefore, obtaining a comprehensive knowledge of the spatial and temporal variations of the environmental factors in the open-ocean and deep-sea of the Azores region is essential for interpreting patterns of biodiversity distribution and for an improved management and conservation of the Azores marine biodiversity (see Abecasis et al., 2015) and resources as a whole.
Several studies have focused on specific aspects of the climatology of the North Atlantic. Lozier et al. (1995) described the climatology of the North Atlantic based on the mean pressure, temperature, salinity, and oxygen parameters collected in hydrographic stations between 1904 and 1990. Nutrient flow in the region was described in detailed by Pelegrí et al. (1996). Bashmachnikov et al. (2009) examined the presence of meddies (Mediterranean Water eddies) east of the Mid-Atlantic Ridge (MAR) through in situ data and remote sensing signature (altimetry data). Recently, Bashmachnikov et al. (2015) produced new climatological maps of temperature–salinity distribution for the northeastern Atlantic with a 25 m depth interval and a 30 km of horizontal resolution (MEDTRANS dataset). The variability of chlorophyll-a and primary production in the Eastern North Atlantic Subtropical Gyre was investigated by Teira et al. (2005).
Additionally, several studies focusing on the Azores region have been undertaken in recent years based on in situ and remote sensing data. Mesoscale and local sea surface temperature variability in the Azores region was studied by Lafon et al. (2004) based on Sea Surface satellite imagery (AVHRR and SeaWiFS) and in situ conductivity-temperature-depth (CTD) samples. Martins et al. (2009) investigated the inter-annual variability of near-surface phytoplankton biomass and sea surface temperature. Also the phytoplankton variability using chlorophyll-a as a proxy of biomass has been addressed by several studies in the Azores, mainly associated with seamounts (e.g., Mendonça et al., 2012; Santos et al., 2013) or in the vicinity of Azores islands (Silva A. et al., 2013).
Although many studies are available for the region, there is a need for an overview of the best broad-scale data available aiming at facilitating the development of marine biodiversity distribution models. Therefore, this study aims to assemble and make available a comprehensive collection of surface and at the seabed environmental data of the Azores, ready for use in several interdisciplinary studies. It contributes to improve the knowledge of the Azores and support an improved management and conservation of certain species and resources in the region.
Materials and Methods
Study Area
The Azores archipelago is a group of nine volcanic islands located in the North Atlantic Ocean around the Mid-Atlantic Ridge with an Exclusive Economic Zone (EEZ) of ~1 million km2 and a mean depth of about 3000 m. Areas shallower than 600 m cover <1% of the total EEZ (Perán et al., 2016). The seafloor surrounding the islands is characterized by very narrow shelves and steep slopes with an important rocky component and a very irregular topography. Seamounts or submarine elevations are common features in the Azores and may occupy 37% of the total area of the EEZ (Morato et al., 2008, 2013). For the purpose of this study we have considered the Economic Exclusive Zone around the Azores along with the adjoining area of extended continental shelf claimed by Portugal, ranging between 28°– 40°N and 17°– 41°W (Figure 1).
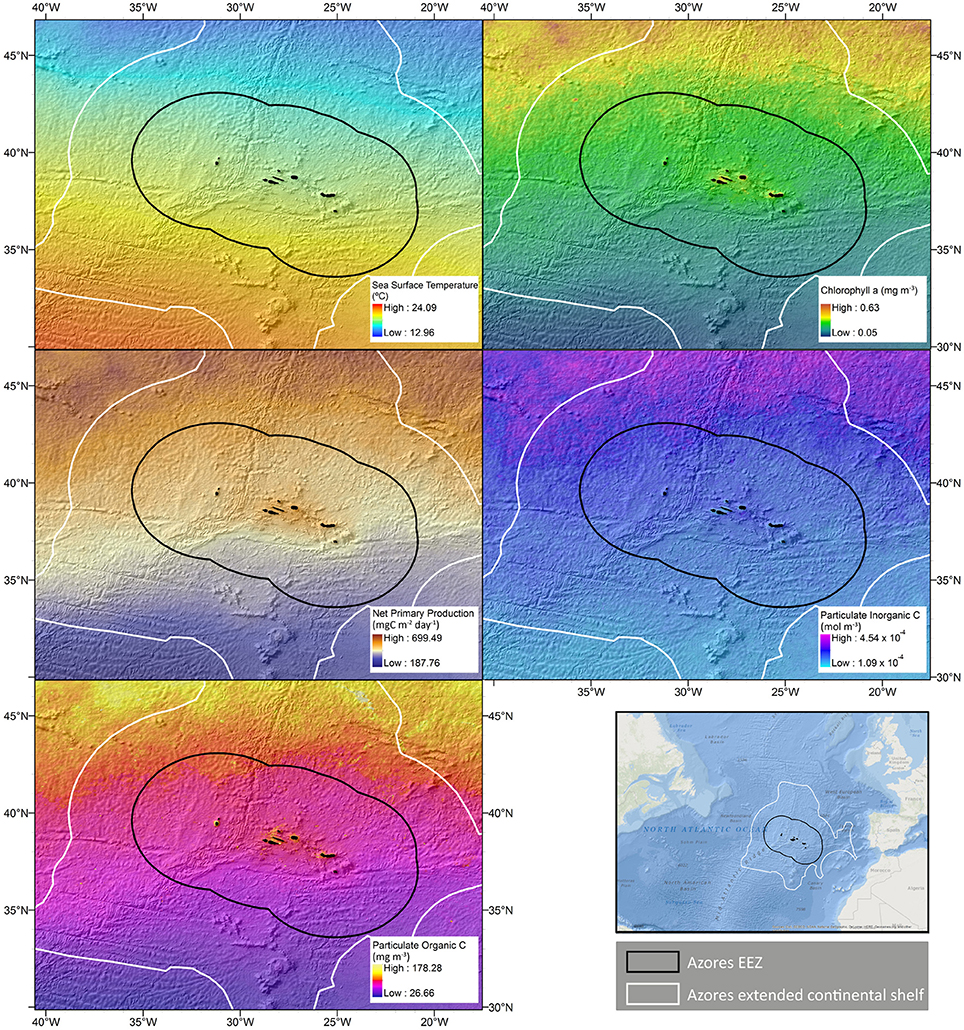
Figure 1. Overall mean of selected near surface oceanographic parameters in the Azores region obtained between 2003 and 2013 through remote sensing data. Black line represents the Portuguese Economic Exclusive Zone around the Azores and white line represents the claimed extended continental shelf. Color scale is shown as a liner stretch between minimum and maximum observed values.
The archipelago is situated in the inter-gyre region of the eastern North Atlantic between 34° and 50°N (Maillard, 1986). The region is characterized by complex ocean circulation patterns resulting from the interaction of the North Atlantic Current (in the North) and the Azores Current (in the south) with many unstable eddies and meanders (Santos et al., 1995; Alves and de Verdière, 1999; Johnson and Stevens, 2000; Bashmachnikov et al., 2009, 2015). Several water masses are present in this region: the North Atlantic Central Water until about 700 m depth; the Northern Sub-Polar Water, the Antarctic Intermediate Water, and the Mediterranean Outflow Water at intermediate depths; and the North Atlantic Deep Water below 2,000 m depth (Santos et al., 1995; Mann and Lazier, 1996; Johnson and Stevens, 2000). The eastward-flowing Azores current separates the colder Eastern North Atlantic Central waters from the warmer and more saline Subtropical waters (Martins et al., 2008) and it is considered as the northern limit of the North Atlantic Subtropical Gyre (Juliano and Alves, 2007).
In general, the Azores region experiences large scale spatial and seasonal variation of oceanographic conditions (Lafon et al., 2004). Sea surface temperature (SST) range from an average of 15°C in the winter to a maximum of 27°C in the summer (Martins et al., 2007). A deep mixed layer is present at ~150 m depth during the winter, while a seasonal thermocline usually develops between 40 and 100 m depth in the summer (Santos et al., 1995). In situ data indicated that maximum chlorophyll-a concentrations correspond to periods of lower SST, usually occurring during winter and spring (Santos et al., 2013). In contrast, minimum chlorophyll-a concentrations have been observed during the summer, when SST is typically higher (Santos et al., 2013). Although these are the general patterns, high inter-annual variability has been observed in this region (Martins et al., 2009).
Several data sources and types were used to compile the climatology characteristics of the Azores region (Table 1). Surface environmental conditions were determined with remotely-sensed data (including productivity), while conditions at the seabed were derived from the World Ocean Atlas 2013 (Boyer et al., 2013).
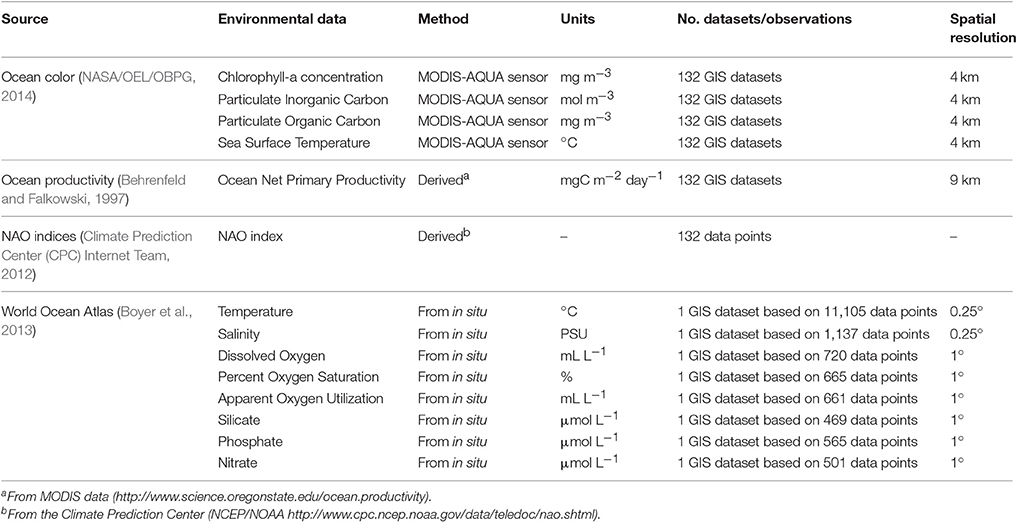
Table 1. List of the oceanographic parameters compiled and data sources used to describe the ocean climatology and its variability in the Azores region, North Atlantic.
Sea Surface Environmental Data
Monthly data products of Ocean Color (http://oceancolor.gsfc.nasa.gov/) were obtained through the MODIS sensor and compiled for the study area from 2003 to 2013 (NASA/OEL/OBPG, 2014). These included SST derived from daytime long-wave (11–12 μm) thermal radiation, as well as near-surface data on chlorophyll-a concentration, PIC, and particulate organic carbon (Table 1). Data was obtained at 4-km resolution in both latitude and longitude. High-resolution satellite imagery is a powerful tool to resolve patterns in space and time. However, sensor penetration is restricted to the near-surface layer of the ocean and could therefore produce biased estimates when applied to volumes.
A measure of primary production was obtained from the ocean net primary productivity derived from MODIS data (http://www.science.oregonstate.edu/ocean.productivity). This parameter is based on the standard algorithm for the Vertically Generalized Production Model (VGPM; Behrenfeld and Falkowski, 1997). This model is based on the chlorophyll-a concentration and it estimates the NPP using a temperature-dependent description of chlorophyll-specific photosynthetic efficiency. We used monthly data with global grid size of 1/12° (≈ 9 km) in both latitude and longitude for the period 2003–2013.
Spatially-explicit remote sensing data (SST, chlorophyll-a concentration, PIC, and particulate organic carbon) and derived oceanographic data (primary production and NAO index) were obtained for each month for the period 2003–2013, resulting in 132 geospatial datasets (a.k.a., GIS layers) for each environmental parameter. For each parameter, we then computed the minimum, maximum, range, mean, and standard deviation of each monthly-imagery for the whole period to obtain overall statistics for each month. Monthly and inter-annual variability was also assessed for all parameters. Finally, monthly anomalies were calculated for each parameter based on the difference between each monthly value and the overall mean value obtained for each month. The same approach was applied to inter-annual anomalies; the difference between each year mean value and the overall mean value obtained for all years. Pearson correlation coefficients were calculated between monthly values of all the environmental parameters to test for possible covariation (Dalgaard, 2002).
At Seabed Environmental Data
Several environmental parameters distributed from surface waters to deep layers of the ocean were obtained for our study area from the World Ocean Atlas 2013 (Boyer et al., 2013). These parameters included temperature (Locarnini et al., 2013), salinity (Zweng et al., 2013), apparent oxygen utilization, dissolved oxygen, percent oxygen saturation (Garcia et al., 2014a), phosphate, nitrate, and silicate (Garcia et al., 2014b; Table 1). Apparent oxygen utilization represents one estimate of the dissolved oxygen utilized due to biochemical processes relative to a preformed value. Oxygen saturation was estimated as the ratio of measured dissolved oxygen and the maximum amount of oxygen that will dissolve in water with the same physical and chemical properties under stable equilibrium (Garcia et al., 2014a). Apparent oxygen utilization (mL L−1) and oxygen saturation (%) are derived parameters from dissolved oxygen (mL L−1) measurement only when in situ temperature and salinity were also measured at the same geographic location, time, and depth. Thus, the total number of observations available for calculating apparent oxygen utilization and oxygen saturation is slightly smaller in number than the available number of dissolved oxygen observations (Supplementary Figure 1).
Spatial data on the overall mean at each depth strata (50 m depth strata down to 2,000 m depth and 100 m depth strata for depths of more than 2,000 m) and available periods were extracted from WOA13 for each environmental parameter. Data was available at a spatial resolutions of 0.25° of latitude and longitude for temperature and salinity, and at a spatial resolution of 1° for all other parameters (Boyer et al., 2013). For temperature and salinity, the analyses described below (see Section At Seabed Environmental Data) were based on the average of 6 decadal climatological means (calculated from 1955 to 2012). For oxygen, phosphate, silicate, and nitrate, the climatological mean used all available data regardless of time period (from the early 1900s' to the present). The resulting datasets were used to compute the distribution of environmental conditions at seafloor depth for each parameter. The spatial distribution of the number of observations are shown as Supplementary Figure 1.
In order to create continuous datasets of seafloor conditions over the entire extent of our study area, we interpolated the World Ocean Atlas 2013 (Boyer et al., 2013) data using a resolution refinement method to create climatological grids with increased spatial resolution. This method was shown to be adequate to provide environmental oceanographic data to feed predictive habitat modeling (Davies and Guinotte, 2011). Bathymetric data from “The Global Bathymetry and Elevation Data at 30 Arc Seconds Resolution” SRTM30_PLUS (Becker et al., 2009) was used to resample the WOA13 gridded data for producing continuous 30-arc second (~1 km2) grids. The resolution refinement process was initiated by extracting each parameter from every depth level into a single shapefile. We then interpolated each parameter using the inverse distance weighting algorithm at a resolution of 0.1°. Subsequently, each raster was resampled in order to obtain the same spatial extent and cell size (1 km2) as the SRTM30_PLUS bathymetry. We then overlapped each bathymetry area corresponding to the different depth levels with each resampled raster that corresponded to the same depth level. Additionally, we computed the mean and standard deviation at the seabed per depth strata across the entire study area to construct general profiles for all these parameters at different seabed depths from shallow water to 6,500 m depth.
NAO Index
We obtained monthly North Atlantic Oscillation (NAO) index from the Climate Prediction Center (NCEP/NOAA http://www.cpc.ncep.noaa.gov/data/teledoc/nao.shtml) for the period 2003–2013 (Climate Prediction Center (CPC) Internet Team, 2012). The NAO index is a climatic pattern in the North Atlantic Ocean resulting from differences on the surface sea-level atmospheric pressure between the Subtropical (Azores) High and the Subpolar (Icelandic) Low. Its value fluctuates between phases of strong and weak differences and is associated with strong effects on oceanic conditions, namely temperature and salinity, current system, and wave heights (ICES, 2014). The positive phase of the NAO reflects below-normal geopotential heights and sea-level atmospheric pressure across the high latitudes of the North Atlantic. Opposite patterns of geopotential heights and sea-level atmospheric pressure anomalies are typically observed during negative NAO phases. Monthly and inter-annual variability of the NAO was assessed.
Results
We have produced 78 geographic datasets of environmental data for the Azores region from remote sensing and in situ data (see Supplementary Table 1 for a complete list of environmental geospatial datasets available for download). These datasets, with a resolution between 1 and 9 km, were deposited at Pangaea, Data Publisher for Earth and Environmental Science (https://doi.org/10.1594/PANGAEA.872601) and also made available for download on the SIGMAR Azores website (http://sigmar.azores.gov.pt).
The summary statistics obtained for each environmental parameter (remotely-sensed data) in the study area between 2003 and 2013 are shown in Table 2. SST as measured by Ocean Color varied between 15.55 and 23.20°C while the concentration of chlorophyll-a varied between 0.09 and 0.43 mg m−3, which is characteristic of oligotrophic oceanic regions. The NAO index also showed a wide amplitude, varying between −2.5 and 2.5 during the study period (Table 2).
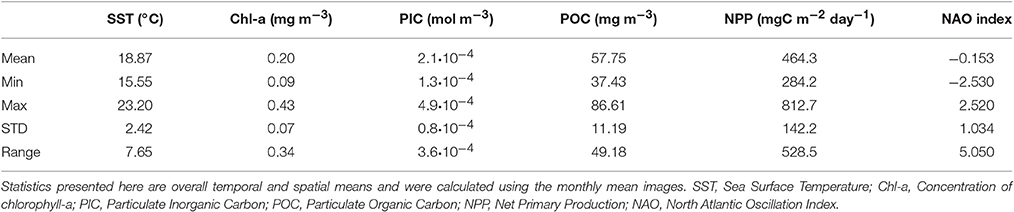
Table 2. Summary statistics for the environment parameters obtained by remote sensing data in the Azores region for the period 2003 and 2013.
Spatial Variability
The overall mean values for the five main environmental parameters as measured by Ocean Color sensor from January 2003 to December 2013 are shown in Figure 1, while the temporal-spatial variability is shown as the range of its values in Figure 2. As expected, zonal (i.e., latitudinal) trends observed in the values for environmental parameters were much greater than meridional (i.e., longitudinal) trends. Lower mean values of SST were found in the northern part of the study area coinciding with higher values for chlorophyll-a concentration, NPP, and organic and inorganic carbon (Figure 1). Additionally, higher chlorophyll-a concentration, NPP, and particulate organic carbon were observed to be associated to the slopes surrounding the islands. Particulate organic carbon was also higher on some seamounts and large banks.
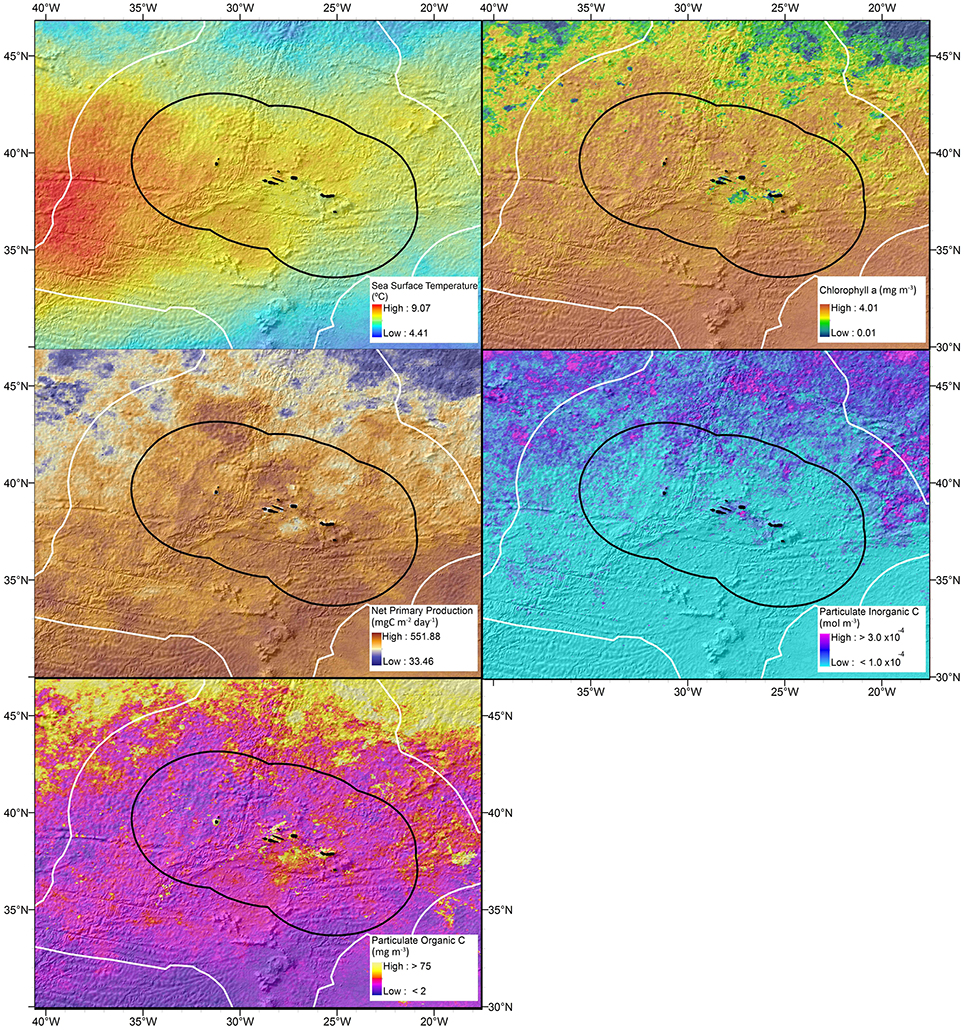
Figure 2. Range of values observed for selected near surface oceanographic parameters in the Azores region obtained between 2003 and 2013 through remote sensing data. Black line represents the Portuguese current Economic Exclusive Zone around the Azores and white line represents the claimed extended continental shelf. Color scale is shown as a liner stretch between minimum and maximum observed values.
Areas showing higher degree of variability varied between environmental parameters (Figure 2). Areas with higher variability of SST were observed on the western part of the study area at mid-latitudes. Chlorophyll-a and NPP showed higher variability in the southern part of the study area while PIC and POC showed higher variability at higher latitudes. An area between the central and the eastern group of islands displayed distinct patterns of variability when compared to neighboring zones (Figure 2). This patch showed a markedly low range of chlorophyll-a and NPP whilst variability of POC was considerably higher than adjacent areas.
Seasonal Variability
Monthly mean values for each environmental parameter in the study area between 2003 and 2013 are shown in Figure 3. SST as measured by Ocean Color varied seasonally with a well-known and defined pattern in this region with lower SST during winter months and higher SST during summer. March presented the lowest mean SST (16.1 ± 0.3°C) and August was the warmest month (22.7 ± 0.4°C). A different pattern was detected for near surface chlorophyll-a concentration and particulate organic carbon with higher values during spring and lower during summer. Highest concentrations of chlorophyll-a and POC were obtained in May (0.31 ± 0.06 mg m−3) and April (73.8 ± 6.4 mg m−3), respectively, while lowest concentrations were detected in September (0.12 ± 0.02 and 42.1 ± 2.9 mg m−3 for chlorophyll-a and POC, respectively). PIC and NPP also showed a well-defined seasonal pattern with higher values during spring and lower observed in autumn or winter. NPP showed the highest concentrations in May (704 ± 64 mgC m−2 day−1) and the lowest in December (307 ± 15 mgC m−2 day−1). On the other hand, the NAO index showed positive and negative phases in all seasons with no clear patterns (Figure 3).
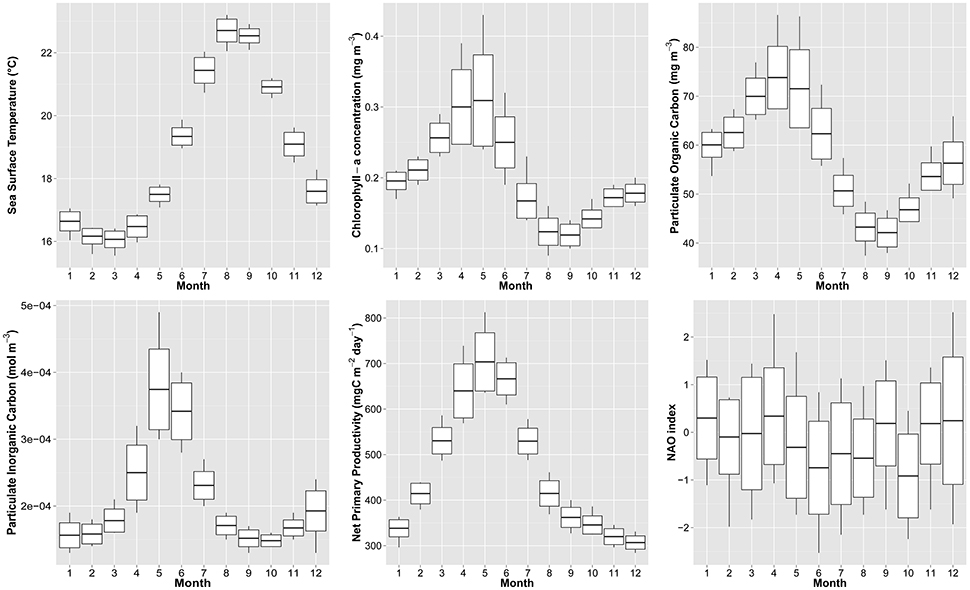
Figure 3. Boxplots of monthly values of the mean, standard deviation and range of the oceanographic parameters in the Azores region between 2003 and 2013, calculated using the means of yearly values for each month. NAO is the North Atlantic Oscillation Index.
Inter-Annual Variability
Throughout the study period, 2011 seemed to be the most unusual year, displaying the highest NAO index, resulting in the lowest temperature observed and highest variability on chlorophyll-a and PIC concentrations (Figure 4). Nevertheless, mean annual SST remained somehow stable over the study period with no pronounced pattern, ranging from a 18.6 ± 2.6°C in 2011 and 19.11 ± 2.5°C in 2008 (Figure 4). The concentration of chlorophyll-a varied between a minimum of 0.183 ± 0.060 mg m−3 in 2005 and a maximum of 0.217 ± 0.074 mg m−3 in 2003 and 0.216 ± 0.097 mg m−3 in 2011. There was a slight decrease in the concentration of chlorophyll-a between 2003 and 2007 and a small increase thereafter (Figure 4). Our anomaly analyses (Figure 5) indicated that between 2005 and the first half of 2009, SST was in general higher and chlorophyll-a lower than the overall mean (positive and negative anomalies, respectively). In contrast, the second half of 2009 until 2011 were characterized by negative SST and positive chlorophyll-a anomalies (Figure 5).
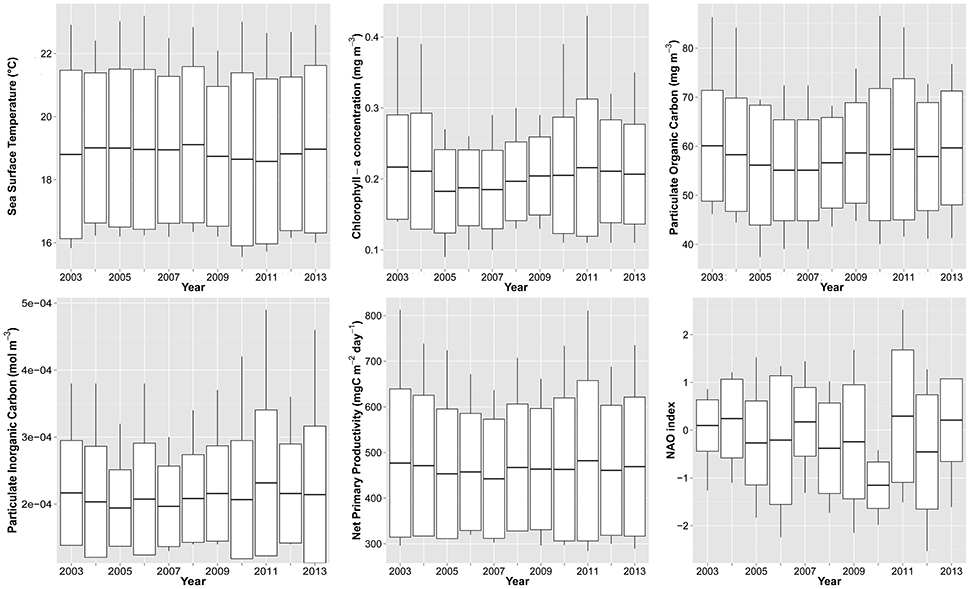
Figure 4. Boxplots of yearly values of the mean, standard deviation and range of the oceanographic parameters in the Azores region between 2003 and 2013, calculated using the means of monthly values for each year. NAO, North Atlantic Oscillation Index.
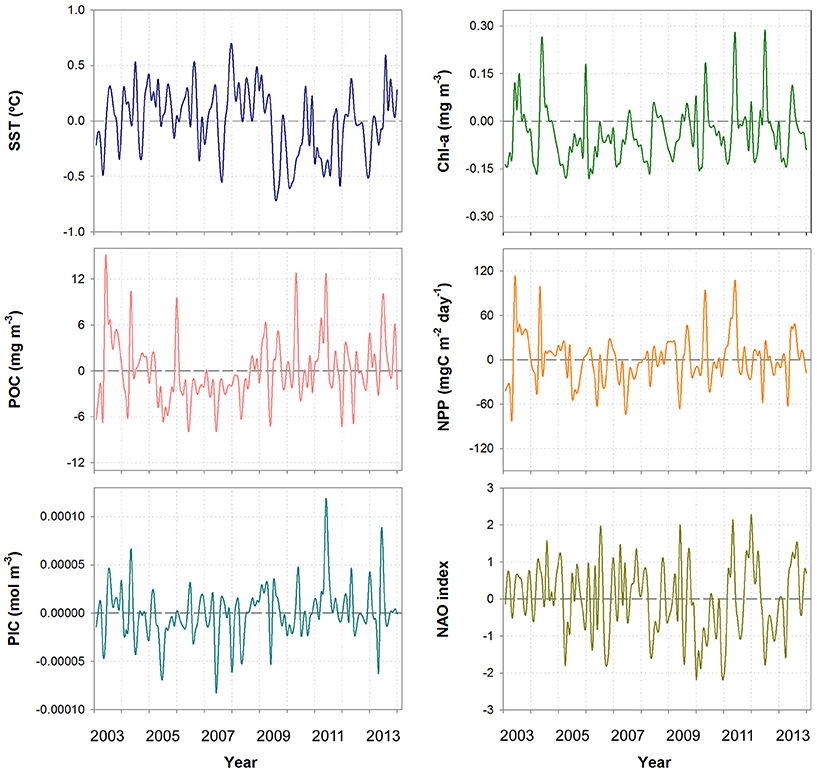
Figure 5. Monthly anomalies calculated for each environmental parameter in the Azores region between 2003 and 2013. SST, Sea Surface Temperature; Chl-a, chlorophyll-a concentration; POC, Particulate Organic Carbon; NPP, Net Primary Production; PIC, Particulate Inorganic Carbon; NAO, North Atlantic Oscillation Index.
PIC concentration ranged from a minimum of 1.94·10−4 ± 0.55·10−4 mol m−3 in 2005 to a maximum of 2.32·10−4 ± 1.11·10−4 mol m−3 in 2011 (Figure 4). POC concentration ranged from a minimum of 55.12 ± 10.29 mg m−3 in 2006 and 2007 to a maximum of 60.09 ± 11.29 mg m−3 in 2003 (Figure 4). PIC and POC anomalies showed unclear trends and patterns (Figure 5). In general PIC anomalies were positive in 2003-2004 and 2009-2013 and mostly negative in 2005-2008. POC anomalies, were mostly negative in 2004 and 2009 and thereafter alternated between positive and negative phases (Figure 5). NPP concentration ranged from 442.43 ± 130.56 mg m−3 in 2007 to a maximum of 482.04 ± 175.63 mg m−3 in 2011 (Figure 4) showing unclear anomaly patterns (Figure 5). Annual geographic datasets for these environmental parameters were also deposited at Pangaea and on the SIGMAR Azores website.
NAO index calculated for the whole studied period indicated that 2008, 2010, and 2012 presented the “higher” negative anomalies (Figure 4). Contrastingly, 2004, 2011, and 2013 presented the higher positive anomalies. Actually, NAO index for 2010 was the most negative (−1.153), being much lower than the overall mean for the entire period (−0.153). In contrast, 2011 was the year showing the highest mean NAO index (0.294). Annual geographic datasets for these environmental parameters were at Pangaea and on the SIGMAR Azores website and are presented in Supplementary Figures 2–6.
Relationship between Oceanographic Parameters
Pearson correlation coefficients calculated for all environmental parameters showed significant correlations for most parameters with the exception of the NAO index (Table 3). Comparison of monthly mean SST and POC revealed an out-of-phase seasonal response, with periods of higher temperatures associated with lower concentrations of POC, showing a significant negative correlation (r = −0.82, p < 0.01, n = 132; Table 3). Although less strong, this negative correlation is also observed between SST and chlorophyll-a concentration (r = −0.68, p < 0.01, n = 132; Table 3), which explain the high positive correlation between chlorophyll-a and POC concentrations (r = 0.96, p < 0.01, n = 132; Table 3). PIC is also positively correlated with the concentration of chlorophyll-a, although the peak seems to occur 1 month later than the peak of chlorophyll-a (Figure 5). Additionally, PIC and NPP parameters presents a positive correlation (r = 0.84, p < 0.01, n = 132; Table 3), emphasizing similar pattern of variability observed in the maps of these two environmental parameters. These results indicated that an increase of PIC leads to an increase of NPP. The NAO index did not show significant relationships with the other environment parameters analyzed in this study.
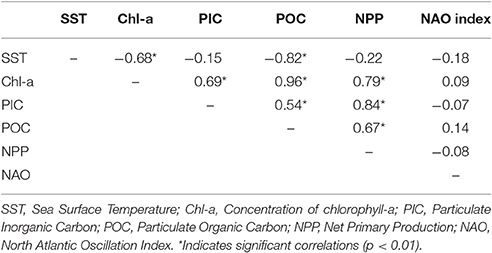
Table 3. Pearson correlation coefficients calculated between all near-surface environmental parameters.
Oceanographic Conditions on the Seabed
Spatial Variability
Environmental conditions at the seabed showed large variability across the study area. There was no clear spatial pattern in the temperature and salinity conditions along the seabed found throughout the study area. These two parameters appeared to be tightly linked to water depth (Figure 6), being higher at shallower depths around the islands, banks, and seamounts and above the MAR, and dropping sharply at abyssal depths.
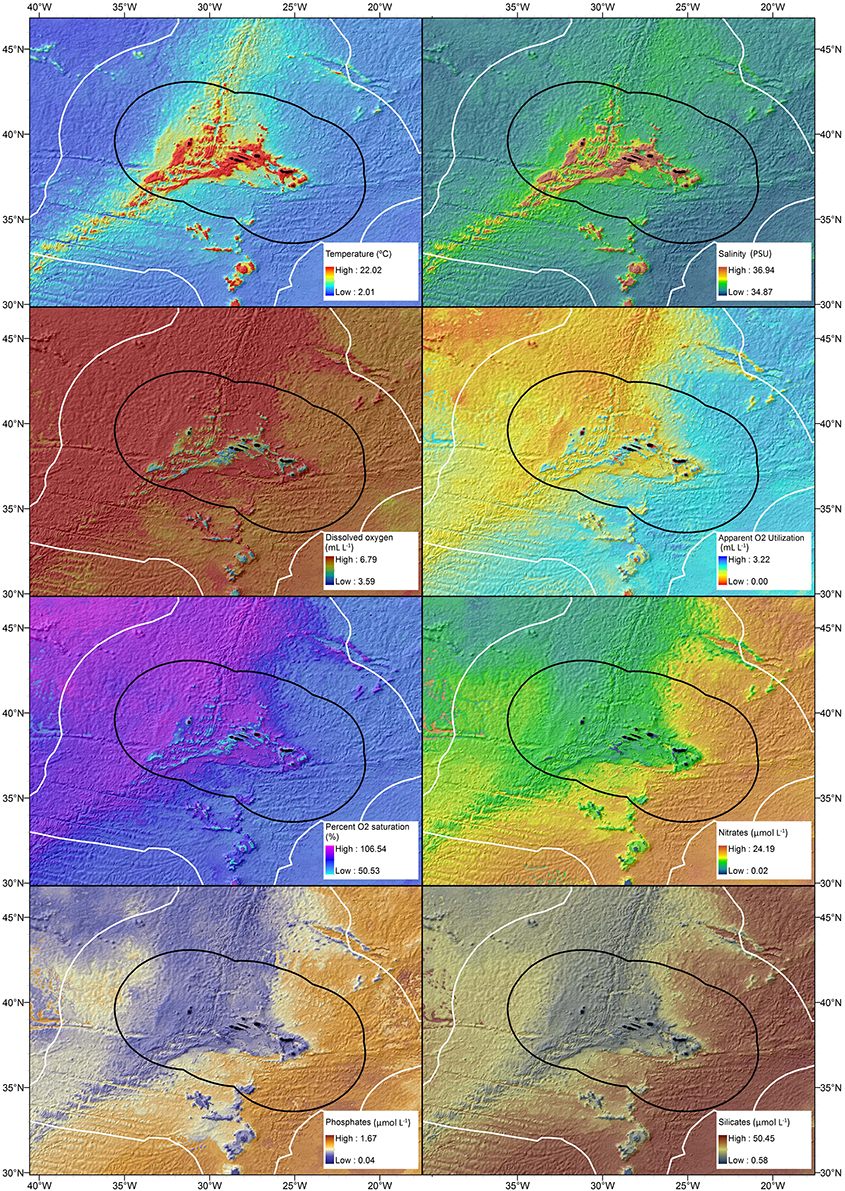
Figure 6. Mean values of different environmental parameters estimated for the seabed in the Azores region by bathymetry-based resolution refinement methodology. For temperature and salinity, the average of 6 decadal means (calculated from 1955 to 2012) are shown while for oxygen, phosphate, silicate, and nitrate, the climatological mean was computed with all available data regardless of time period (from the early 1900s' to the present). Black line represents the Portuguese current Economic Exclusive Zone around the Azores and white line represents the claimed extended continental shelf. Color scale is shown as a linear stretch between minimum and maximum observed values.
Although, a clear relationship was also evident between depth and the oxygen (dissolved oxygen, apparent oxygen utilization, and oxygen saturation) and nutrient-related parameters (nitrates, phosphates, and silicates), we identified some distinctive spatial patterns that appeared to be independent of water depth (Figure 6). Both dissolved oxygen and oxygen saturation values were higher to the west of the MAR and around the islands, whereas the eastern section of the study area presented generally lower values. Apparent oxygen utilization presented the opposite pattern, being lower at the western side of the MAR and higher on the eastern section of the study area. Additionally, the north-western tip of the area was characterized by a lower apparent oxygen utilization. The spatial pattern of nutrient concentrations on the seabed also showed an eastern-western (zonal) gradient with lower concentrations on the western side of the MAR and around the islands, and higher concentrations on the eastern section (Figure 6).
Depth Variability
Environmental conditions at the seabed revealed some notable variations with water depth. Mean values of temperature and salinity at different depths of the seabed sharply decreased from 17.38 ± 1.17°C (mean, SD) and 36.18 ± 0.25 PSU at 50 m depth to 3.72 ± 0.15°C and 34.98 ± 0.04 PSU at 2,000 m depth, respectively (Figure 7). No significant variation was detected at greater depths, reaching a mean of 2.47 ± 0.06°C and 34.89 ± 0.01 at 5,000 meters depth. For both parameters, the greatest variability was identified between the very shallow seabed down to 500 m depth.
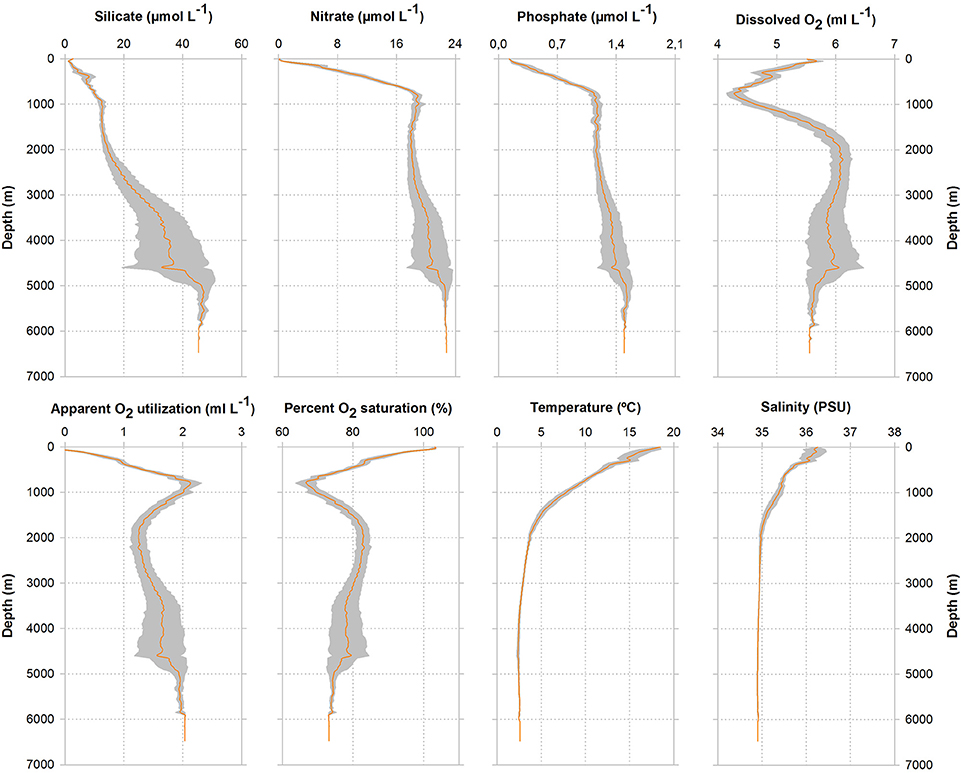
Figure 7. Depth profiles and associated standard deviation (shaded area) of different environmental parameters in the Azores region. Standard deviation represents spatial variability of values observed at each depth of the seafloor.
Dissolved oxygen and oxygen saturation on the seabed displayed a similar behavior with increasing depth; decreasing severely until 750 meters depth, reaching a minimum of 4.28 ± 0.13 mL L−1 and 67.37 ± 1.96%, respectively. However, this was followed by a net increase of both parameters (Figure 7) with maximum values attained at 2,000 m depth (6.07 ± 0.16 mL L−1 and 82.91 ± 0.82%, respectively). Thereafter, neither parameters presented significant variation, reaching values of 5.66 ± 0.12 mL L−1 and 74.60 ± 1.40% at 5,000 m depth, respectively. However, patterns maybe masked due to the high level of variability observed between 2,000 and 5,000 m depth.
Apparent oxygen utilization on the seabed presented an opposite pattern, increasing markedly until 750 m depth, reaching a maximum of 2.08 ± 0.13 mL L−1, followed by a net decrease to a mean concentration of 1.25 ± 0.13 mL L−1 at 2,000 m depth (Figure 7). At greater depths, apparent oxygen utilization displayed a small increase to a concentration of 1.93 ± 0.11 mL L−1 at 5,000 m depth.
Nutrient concentrations (silicates, nitrates, and phosphates) on the seafloor displayed a continuous increase with depth (Figure 7). Nitrates and phosphates displayed the same behavior despite their inherent differences in magnitude. Both nutrients increased from a surface concentration of 0.44 ± 0.16 and 0.16 ± 0.02 μmol L−1, up to a maximum concentration of 19.02 ± 0.93 and 1.17 ± 0.07 μmol L−1 at 1,000 m depth. In deeper waters both nutrients displayed a small increase in concentration with a higher level of variability compared to the upper layers. The pattern of increase in the concentration of silicate with increasing depth was slightly different. Silicate displayed a continuous increase in concentration from shallow waters to 5,000 m depth, where it reached a maximum average concentration of 46.36 ± 3.50 μmol L−1.
Discussion
This paper highlights some general environmental characteristics of the Azores region and delivers some useful information required for marine spatial management. It does not pretend to provide an exhaustive analysis of the oceanography dynamics occurring in the area but rather assembling a comprehensive collection of environmental data for the Azores region, including data from high-resolution satellite imagery for several parameters: SST, near-surface concentration of chlorophyll-a, particulate organic and inorganic carbon, and ocean net primary production. This information is now available for many different purposes, including to support spatial management and decision-making. The climatological geographic datasets highlighted in this paper will also serve as a foundation for improving our knowledge on the distribution of marine fauna inhabiting the Azores region and help understanding the environmental factors driving some observed variation.
The Azores represent an important habitat for a wide range of migrating marine fauna ranging from seabirds (Monteiro et al., 1996), cetaceans (Silva A. et al., 2013), elasmobranchs (Vandeperre et al., 2014), or tuna (Pham et al., 2013) whose migrations are tightly linked to environmental factors (Amorim et al., 2009; Afonso et al., 2014; Prieto et al., in press; Tobeña et al., 2016; Druon et al., 2017). All these studies found SST and primary productivity or chlorophyll-a concentrations as the main environmental factors explaining the spatial distribution of large migratory species. Additionally, geomorphologic characteristics and features such as bathymetric slope or distance to seamounts (Amorim et al., 2009; Afonso et al., 2014) have also been referred as important drivers of the distribution of large pelagic animals, highlighting the usefulness of the comprehensive review of the geomorphology of the Azores region (Perán et al., 2016).
Environmental conditions at the seabed revealed some notable variations across the study area and with water depth. It should be noticed that although not calculated in detail, temporal variability at depths shallower than a few 100's of meters would be also highly pronounced. The temperature and salinity conditions along the seabed appeared to be tightly linked to water depth being higher at shallower depths around the islands, banks and seamounts and above the MAR, and dropping sharply at abyssal depths. There was also an apparent non-linear relationship between depth and oxygen measurements (dissolved oxygen, apparent oxygen utilization, and oxygen saturation) and apparent increase with depth of the nitrates, phosphates, and silicates. Other distinctive spatial patterns were identified that were independent of water depth. Notably, dissolved oxygen and oxygen saturation were higher to the west of the MAR and around the islands, whereas the eastern section of the study area presented generally lower values. Nutrient concentrations on the seabed also showed an eastern-western gradient with lower concentrations on the western side of the MAR and around the islands, and higher concentrations on the eastern section. These longitudinal patterns appear to coincide with the presence of a topographic discontinuity created by the MAR but could also reflect an oceanographic transition zone between water masses. This has important implications for understanding trans-Atlantic deep-sea biogeography and connectivity patterns but will also help improving our understanding of the distribution of important habitat-forming organisms, such as cold-water corals and sponges, for which very little is known (Braga-Henriques et al., 2013).
Our study also contributed toward a comprehensive knowledge of the spatial and temporal near-surface variability of the environmental parameters characterizing the Azores. Similarly to previous studies, our results confirmed high spatial, seasonal and inter-annual variability of the marine environment in the Azores region, typical of mid-latitudes (Bashmachnikov et al., 2004; Lafon et al., 2004; Martins et al., 2009; Mendonca et al., 2010; Santos et al., 2013). In this study, SST as measured by Ocean Color varied between 15.55 and 23.20°C while chlorophyll-a concentration varied between 0.09 and 0.43 (mg m−3). These results are corroborated by in situ measurements on the Condor seamount (Azores; Martins et al., 2011; Santos et al., 2013). Also, the previously described summer minimum chlorophyll-a concentrations was also observed when SST is higher (Santos et al., 1995; Martins et al., 2011; Santos et al., 2013).
The North Atlantic is considered as one of the most productive marine regions on the planet (DeYoung et al., 2004). However, the Azores region is located in oligotrophic waters with areas on the northern sector being more productive than those on the south. Most of the annual production in the North Atlantic, including the Azores region as confirmed by our analysis, occurs during spring (Schiebel et al., 2011; Abell et al., 2013). The surface POC concentrations obtained in the Azores were generally in the range obtained for other areas (Allison et al., 2010). Although these are the general patterns, high inter-annual variability has been observed in this region (Martins et al., 2009) but our analyses did not identify a clear trend. Nevertheless, the period between 2004 and 2008 was characterized by warmer waters than the long-term mean (2003–2013) but was less productive than the mean.
Habitat suitability models based on reliable environmental data is the most cost-effective and timely solution for determining the location of vulnerable marine ecosystems in the Azores. Actually, such models are recognized to be fundamental when designing management plans for protecting vulnerable marine ecosystems from anthropogenic impacts such as fishing (Ardron et al., 2014). Furthermore, oxygen levels, temperature, aragonite and calcite concentrations at the seabed have been important parameter for explaining the distribution of black corals (Yesson et al., in press) and other cold-water coral species (e.g., Davies and Guinotte, 2011; Yesson et al., 2012; Bostock et al., 2015). Our compilation of the environmental conditions at the seabed will therefore, facilitate future effort to predict the potential habitat of those key structuring fauna or explain potential biogeographic patterns in the region.
Although the compilation produced here is of utmost interest for several proposes, the dataset suffers from a number of shortcomings and has the potential to be significantly improved in the future. For example, accuracy issues associated with remote sensing or global bathymetry data increase the level of uncertainty of the outputs (Mendonca et al., 2010; Moore et al., 2015; Anderson et al., 2016). Additionally, the reduced and poorly-distributed historical environmental observations required a considerable amount of interpolation to describe the environmental conditions at the seabed (Supplementary Figure 1), leading to potentially large spatial and temporal errors, mainly for the deep ocean (Wunsch, 2016). Parra et al. (in press) developed predictive distribution models for deep-sea fish in the Azores and suggested that the global nature of datasets of the environmental conditions at the seabed may not reflect the actual fine-scale variation, making difficult to specify which environmental factors are primarily responsible for the observed patterns. It has therefore been suggested that such datasets require a large amount of validation and that an effective observing system for detecting oceanic change with adequate accuracy and precision is still required (Wunsch, 2016).
Over the last two decades there have been significant advances in high-resolution remote sensing providing high resolution near-surface spatial and temporal data (Blondeau-Patissier et al., 2014; Finkl and Makowski, 2014). These new technologies will provide powerful tools for sampling marine ecosystems at finer spatial and temporal scales and produce better estimations that would never be possible with field work. However, they require a systematic in situ validation of the estimated data and lack capability of sampling the whole three-dimensional complexity of the oceans. Therefore, expanding fixed-point in situ seafloor observatories, moored oceanographic arrays, and drifting profilers are of paramount importance to measure essential ocean variables (Cristini et al., 2016).
Author Contributions
TM, CP, FC, and FT designed the study. PA, AP collected and processed most of the data through GIS software. TM, CP, PA, MJ, and AP preformed most of the analyses. PA, AP, CP, FC, FT, MJ, and TM wrote the paper.
Funding
This research received funding from Fundo Regional da Ciência, Tecnologia (FRCT), through the research project 2020-M2.1.2/I/026/2011 (Pro-Convergência), and the European Union Seventh Framework Programme (FP7/2007-2013) under the MIDAS project, grant agreement 603418. The authors also acknowledge funds provided by the Fundação para a Ciência e a Tecnologia (FCT) through the strategic project (FCT/UID/MAR/04292/2013) granted to MARE. TM is supported by Program Investigador FCT (IF/01194/2013) and IFCT Exploratory Project (IF/01194/2013/CP1199/CT0002) from the Fundação para a Ciência e Tecnologia (POPH and QREN), PA is currently supported by the Fundação para a Ciência e a Tecnologia (FCT) under a PhD fellowship (SFRH/DB/103504/2014), AP was partially supported by the Estagiar-L program from the Government of the Azores, CP was supported by the MIDAS project grant agreement 603418, and FC was supported by IMAR and the European Marine Observation and Data Network through contract IMAR/EMODnet Biology/001-2014. FT has been supported by a CORALFISH contract and a post-doctoral grant (ref. SFRH/BPD/79801/2011) from the Foundation for Science and Technology (Portugal). Data analyses were supported by projects CORALFISH (FP7ENV/2007/1/213144) and MeshAtlantic (AA-10/1218525/BF).
Conflict of Interest Statement
The authors declare that the research was conducted in the absence of any commercial or financial relationships that could be construed as a potential conflict of interest.
Acknowledgments
We thank Chris Yesson for his collaboration with the extraction of a series of oceanographic and biogeochemical parameters and with implementing resolution refinement methodologies. We acknowledge data provided by NASA Goddard Space Flight Center, Ocean Ecology Laboratory, Ocean Biology Processing Group.
Supplementary Material
The Supplementary Material for this article can be found online at: https://www.frontiersin.org/article/10.3389/fmars.2017.00056/full#supplementary-material
References
Abecasis, R. C., Afonso, P., Colaço, A., Longnecker, N., Clifton, J., Schmidt, L., et al. (2015). Marine conservation in the Azores: evaluating marine protected area development in a remote island context. Front. Mar. Sci. 2:104. doi: 10.3389/fmars.2015.00104
Abell, R. E., Brand, T., Dale, A. C., Tilstone, G. H., and Beveridge, C. (2013). Variability of particulate flux over the Mid-Atlantic Ridge. Deep Sea Res. Part II 98, 257–268. doi: 10.1016/j.dsr2.2013.10.005
Afonso, P., McGinty, N., and Machete, M. (2014). Dynamics of whale shark occurrence at their fringe oceanic habitat. PLoS ONE 9:e102060. doi: 10.1371/journal.pone.0102060
Allison, D. B., Stramski, D., and Mitchell, B. G. (2010). Seasonal and interannual variability of particulate organic carbon within the Southern Ocean from satellite ocean color observations. J. Geophys. Res. 115, 1–18. doi: 10.1029/2009jc005347
Alves, M. L. G. R., and de Verdière, A. C. (1999). Instability Dynamics of a subtropical jet and applications to the Azores front current system: Eddy-Driven Mean Flow. J. Phys. Oceanogr. 29, 837–864. doi: 10.1175/1520-0485(1999)029<0837:IDOASJ>2.0.CO;2
Amorim, P., Figueiredo, M., Machete, M., Morato, T., Martins, A., and Santos, R. S. (2009). Spatial variability of seabird distribution associated with environmental factors: a case study on marine Important Bird Areas (IBAs) in the Azores. ICES J. Mar. Sci. 66, 29–40. doi: 10.1093/icesjms/fsn175
Anderson, O. F., Guinotte, J. M., Rowden, A. A., Clark, M. R., Mormede, S., Davies, A. J., et al. (2016). Field validation of habitat suitability models for vulnerable marine ecosystems in the South Pacific Ocean: implications for the use of broad-scale models in fisheries management. Ocean Coast. Manage. 120, 110–126. doi: 10.1016/j.ocecoaman.2015.11.025
Ardron, J. A., Clark, M. R., Penney, A. J., Hourigan, T. F., Rowden, A. A., Dunstan, P. K., et al. (2014). A systematic approach towards the identification and protection of vulnerable marine ecosystems. Mar. Policy 49, 146–154. doi: 10.1016/j.marpol.2013.11.017
Bashmachnikov, I., Lafon, V., and Martins, A. (2004). Sea surface temperature distribution in the Azores region. Part II: space-time variability and underlying mechanisms. Arquipélago. Life Mar. Sci. 21A, 19–32.
Bashmachnikov, I., Machín, F., Mendonça, A., and Martins, A. (2009). In situ and remote sensing signature of meddies east of the mid-Atlantic ridge. J. Geophys. Res. 114:C05018. doi: 10.1029/2008JC005032
Bashmachnikov, I., Neves, F., Nascimento, Â., Medeiros, J., Ambar, I., Dias, J., et al. (2015). Temperature–salinity distribution in the northeastern Atlantic from ship and Argo vertical casts. Ocean Sci. 11, 215–236. doi: 10.5194/os-11-215-2015
Becker, J. J., Sandwell, D. T., Smith, W. H. F., Braud, J., Binder, B., Depner, J., et al. (2009). Global bathymetry and elevation data at 30 arc seconds resolution: SRTM30_PLUS. Mar. Geod. 32, 355–371. doi: 10.1080/01490410903297766
Behrenfeld, M. J., and Falkowski, P. G. (1997). Photosynthetic rates derived from satellite-based chlorophyll concentration. Limnol. Oceanogr. 42, 1–20. doi: 10.4319/lo.1997.42.1.0001
Blondeau-Patissier, D., Gower, J. F. R., Dekker, A. G., Phinn, S. R., and Brando, V. E. (2014). A review of ocean color remote sensing methods and statistical techniques for the detection, mapping and analysis of phytoplankton blooms in coastal and open oceans. Prog. Oceanogr. 123, 123–144. doi: 10.1016/j.pocean.2013.12.008
Bostock, H. C., Tracey, D. M., Currie, K. I., Dunbar, G. B., Handler, M. R., Mikaloff-Fletcher, S. E., et al. (2015). The carbonate mineralogy and distribution of habitat-forming deep-sea corals in the southwest pacific region. Deep Sea Res. Part I 100, 88–104. doi: 10.1016/j.dsr.2015.02.008
Boyer, T. P., Antonov, J. I., Baranova, O. K., Coleman, C., Garcia, H. E., Grodsky, A., et al. (2013). “World Ocean Database 2013,” in NOAA Atlas NESDIS 72, eds S. Levitus and A. Mishonov (Silver Spring, MD: NOAA), 209.
Braga-Henriques, A., Porteiro, F. M., Ribeiro, P. A., de Matos, V., Sampaio, Í., Ocana, O., et al. (2013). Diversity, distribution and spatial structure of the cold-water coral fauna of the Azores (NE Atlantic). Biogeosciences 10, 529–590. doi: 10.5194/bgd-10-529-2013
Climate Prediction Center (CPC) Internet Team (2012). Climate Prediction Center, North Atlantic Oscillation (NAO). NOAA (Accessed January 11, 2016).
Cristini, L., Lampitt, R. S., Cardin, V., Delory, E., Haugan, P., O'Neill, N., et al. (2016). Cost and value of multidisciplinary fixed-point ocean observatories. Mar. Policy 71, 138–146. doi: 10.1016/j.marpol.2016.05.029
Davies, A. J., and Guinotte, J. M. (2011). Global habitat suitability for framework-forming cold-water corals. PLoS ONE 6:e18483. doi: 10.1371/journal.pone.0018483
Davies, A. J., Wisshak, M., Orr, J. C., and Roberts, J. M. (2008). Predicting suitable habitat for the cold-water coral Lophelia pertusa (Scleractinia). Deep Sea Res. Part I 55, 1048–1062. doi: 10.1016/j.dsr.2008.04.010
DeYoung, B., Heath, M., Werner, F., Chai, F., Megrey, B., and Monfray, P. (2004). Challenges of modelling ocean basin ecosystems. Science 304, 1463–1466. doi: 10.1126/science.1094858
Druon, J.-N., Fromentin, J.-M., Hanke, A. R., Arrizabalaga, H., Damalas, D., Tičina, V., et al. (2017). Habitat suitability of the Atlantic bluefin tuna by size class: an ecological niche approach. Prog. Oceanogr. 142, 30–46. doi: 10.1016/j.pocean.2016.01.002
Finkl, C. W., and Makowski, C. (eds.). (2014). Remote Sensing and Modeling, Advances in Coastal and Marine Resources, Coastal Research Library, Vol. 9. Cham: Springer International Publishing.
Garcia, H. E., Locarnini, R. A., Boyer, T. P., Antonov, J. I., Baranova, O. K., Zweng, M. M., et al. (2014a). World Ocean Atlas 2013, Vol. 3, Dissolved Oxygen, Apparent Oxygen Utilization, and Oxygen Saturation. ed S. Levitus, ed A. Mishonov Technical. NOAA Atlas NESDIS 75, Silver Spring, MD.
Garcia, H. E., Locarnini, R. A., Boyer, T. P., Antonov, J. I., Baranova, O. K., Zweng, M. M., et al. (2014b). World Ocean Atlas 2013, Vol. 4, Dissolved Inorganic Nutrients (phosphate, nitrate, silicate). ed S. Levitus, ed A. Mishonov Technical. NOAA Atlas NESDIS 76, Silver Spring, MD.
Gritti, E. S., Smith, B., and Sykes, M. T. (2006). Vulnerability of Mediterranean Basin ecosystems to climate change and invasion by exotic plant species. J. Biogeogr. 33, 145–157. doi: 10.1111/j.1365-2699.2005.01377.x
Guinotte, J. M., and Davies, A. J. (2014). Predicted deep-sea coral habitat suitability for the U.S. West coast. PLoS ONE 9:e93918. doi: 10.1371/journal.pone.0093918
Guisan, A., Edwards, T. C. Jr., and Hastie, T. (2002). Generalized linear and generalized additive models in studies of species distributions: setting the scene. Ecol. Model. 157, 89–100. doi: 10.1016/S0304-3800(02)00204-1
Guisan, A., and Thuiller, W. (2005). Predicting species distribution: offering more than simple habitat models. Ecol. Lett. 8, 993–1009. doi: 10.1111/j.1461-0248.2005.00792.x
Guisan, A., and Zimmermann, N. E. (2000). Predictive habitat distribution models in ecology. Ecol. Model. 135, 147–186. doi: 10.1016/S0304-3800(00)00354-9
ICES (2014). Report of the Working Group on Widely Distributed Stocks (WGWIDE). ICES Headquarters, Copenhagen. ICES CM 2014/ACOM:15.
Johnson, J., and Stevens, I. (2000). A fine resolution model of the eastern North Atlantic between the Azores, the Canary Islands and the Gibraltar Strait. Deep Sea Res. Part I Oceanogr. Res. Pap. 47, 875–899. doi: 10.1016/S0967-0637(99)00073-4
Jones, M. C., Dye, S. R., Fernandes, J. A., Frölicher, T. L., Pinnegar, J. K., Warren, R., et al. (2013). Predicting the impact of climate change on threatened species in UK waters. PLoS ONE 8:e54216. doi: 10.1371/journal.pone.0054216
Juliano, M. F., and Alves, M. L. G. R. (2007). The Subtropical front/current systems of Azores and St. Helena. J. Phys. Oceanogr. 37, 2573–2598. doi: 10.1175/2007JPO3150.1
Lafon, V. M., Martins, A. M., Bashmachnikov, I. L., Jose, F., Melo-Rodrigues, M., Figueiredo, M. P., et al. (2004). “SST variability in the Azores region using AVHRR imagery: regional to local scale study,” in Proceedings SPIE 5569, Remote Sensing of the Ocean and Sea Ice 2004, 130, eds C. R. Bostater and R. Santoleri, 130–139.
Locarnini, R. A., Mishonov, A. V., Antonov, J. I., Boyer, T. P., Garcia, H. E., Baranova, O. K., et al. (2013). World Ocean Atlas 2013, Vol. 1, Temperature. S. Levitus, Ed., A. Mishonov Technical Ed. NOAA Atlas NESDIS 73, Silver Spring, MD, 40.
Lozier, M. S., Owens, W. B., and Curry, R. G. (1995). The climatology of the North Atlantic. Prog. Oceanogr. 36, 1–44. doi: 10.1016/0079-6611(95)00013-5
Mann, K., and Lazier, J. (1996). Dynamics of Marine Ecosystems: Biological-Physical Interactions in the Oceans, 2nd Edn. Malden, MA: Wiley.
Martins, A. M., Amorim, A. S. B., Figueiredo, M. P., Souza, R. J., Mendonça, A. P., Bashmachnikov, I. L., et al. (2007). “Sea surface temperature (AVHRR, MODIS) and ocean colour (MODIS) seasonal and interannual variability in the Macaronesian islands of Azores, Madeira, and Canaries,” in Proc. SPIE 6743, Remote Sensing of the Ocean, Sea Ice 2007, eds C. R. Bostater, S. P. Mertikas, X. Neyt, and M. Vélez-Reyes, 67430A–67430A–15.
Martins, A. M., Loureiro, C., Carvalho, A. F., Mendonça, A., Baschmachnikov, I., Figueiredo, M., et al. (2011). “Oceanographic in situ and satellite data collection on CONDOR bank (Azores, NE Atlantic): comparison with NAO indices,” in Poster Session Presented at: ESA ESA-SOLAS Conference: Earth Observation for Ocean-Atmosphere Interactions Science (Frascati).
Martins, A., Bashmachnikov, I., and Mendonça, A. (2008). Multi-sensor (SeaWiFS/MODIS/AVHRR) Surface Signature of the Azores Current. Geophysical Research Abstracts, Vol. 10. Available online at: http://meetings.copernicus.org/www.cosis.net/abstracts/EGU2008/11379/EGU2008-A-11379.pdf
Martins, A., Mendonça, A., Figueiredo, M., and Baschmachnikov, I. (2009). “Historical Ocean Colour and SST inter-annual variability for the Azores region from 2002 to 2008 - comparison with in situ data,” in Presented at the EGU General Assembly Conference EGU General Assembly 2009 (Vienna), 12519. Available online at: http://meetings.copernicus.org/egu2009
Mendonça, A., Arístegui, J., Vilas, J. C., Montero, M. F., Ojeda, A., Espino, M., et al. (2012). Is there a seamount effect on microbial community structure and biomass? The case study of Seine and Sedlo seamounts (Northeast Atlantic). PLoS ONE 7:e29526. doi: 10.1371/journal.pone.0029526
Mendonca, A., Martins, A., Figueiredo, M., Bashmachnikov, I., Couto, A., Lafon, V., et al. (2010). Evaluation of ocean color and sea surface temperature sensors algorithms using in situ data: a case study of temporal and spatial variability on two northeast Atlantic seamounts. J. Appl. Remote Sens. 4:043506. doi: 10.1117/1.3328872
Menezes, G. M., Sigler, M. F., Silva, H. M., and Pinho, M. R. (2006). Structure and zonation of demersal fish assemblages off the Azores archipelago (mid-Atlantic). Mar. Ecol. Prog. Ser. 324, 241–260. doi: 10.3354/meps324241
Monteiro, L. R., Ramos, J. A., and Furness, R. W. (1996). Past and present status and conservation of the seabirds breeding in the Azores Archipelago. Biol. Conserv. 78, 319–328. doi: 10.1016/S0006-3207(96)00037-7
Moore, T. S., Campbell, J. W., and Feng, H. (2015). Characterizing the uncertainties in spectral remote sensing reflectance for SeaWiFS and MODIS-Aqua based on global in situ matchup data sets. Remote Sens. Environ. 159, 14–27. doi: 10.1016/j.rse.2014.11.025
Morato, T., Kvile, K. Ø., Taranto, G. H., Tempera, F., Narayanaswamy, B. E., Hebbeln, D., et al. (2013). Seamount physiography and biology in the north-east Atlantic and Mediterranean Sea. Biogeosciences 10, 3039–3054. doi: 10.5194/bg-10-3039-2013
Morato, T., Machete, M., Kitchingman, A., Tempera, F., Lai, S., Menezes, G., et al. (2008). Abundance and distribution of seamounts in the Azores. Mar. Ecol. Prog. Ser. 357, 17–21. doi: 10.3354/meps07268
NASA/OEL/OBPG (2014). MODIS-Aqua Ocean Color Data. NASA Goddard Space Flight Center, Ocean Ecology Laboratory, Ocean Biology Processing Group. doi: 10.5067/AQUA/MODIS_OC.2014
Parra, H. E., Pham, C. K., Menezes, G. M., Rosa, A., Tempera, F., and Morato, T. (in press). Predictive modeling of deep-sea fish distribution in the Azores. Deep Sea Res. Part II. doi: 10.1016/j.dsr2.2016.01.004
Pelegrí, J. L., Csanady, G. T., and Martins, A. (1996). The North Atlantic nutrient stream. J. Oceanogr. 52, 275–299. doi: 10.1007/BF02235924
Perán, A. D., Pham, C. K., Amorim, P., Cardigos, F., Tempera, F., and Morato, T. (2016). Seafloor characteristics in the Azores region (North Atlantic). Front. Mar. Sci. 3:204. doi: 10.3389/fmars.2016.00204
Pham, C. K., Vandeperre, F., Menezes, G., Porteiro, F., Isidro, E., and Morato, T. (2015). The importance of deep-sea vulnerable marine ecosystems for demersal fish in the Azores. Deep Sea Res. I 96, 80–88. doi: 10.1016/j.dsr.2014.11.004
Pham, C., Canha, A., Diogo, H., Pereira, J. G., Prieto, R., and Morato, T. (2013). Total marine fisheries catch for the Azores (1950-2010). ICES J. Mar. Sci. 70, 564–577. doi: 10.1093/icesjms/fst024
Prieto, R., Tobena, M., and Silva, M. A. (in press). Habitat preferences environmental niche overlap of baleen whales in a mid-latitude migratory habitat. Deep Sea Res. Part II. doi: 10.1016/j.dsr2.2016.07.015
Rengstorf, A. M., Yesson, C., Brown, C., and Grehan, A. J. (2013). High-resolution habitat suitability modelling can improve conservation of vulnerable marine ecosystems in the deep sea. J. Biogeogr. 40:1702e1714. doi: 10.1111/jbi.12123
Santos, M., Moita, M. T., Bashmachnikov, I., Menezes, G. M., Carmo, V., Loureiro, C. M., et al. (2013). Phytoplankton variability and oceanographic conditions at Condor seamount, Azores (NE Atlantic). Deep Sea Res. Part II 98(Pt A), 52–62. doi: 10.1016/j.dsr2.2013.05.037
Santos, R. S., Hawkins, S. J., Monteiro, L. R., Alves, M., and Isidro, E. J. (1995). Marine research, resources and conservation in the Azores. Aquat. Conserv. Mar. Freshw. Ecosyst. 5, 311–354. doi: 10.1002/aqc.3270050406
Schiebel, R., Brupbacher, U., Schmidtko, S., Nausch, G., Waniek, J. J., and Thierstein, H.-R. (2011). Spring coccolithophore production and dispersion in the temperate eastern North Atlantic Ocean. J. Geophys. Res. 116:C08030. doi: 10.1029/2010JC006841
Silva, A., Brotas, V., Valente, A., Sá, C., Diniz, T., Patarra, R. F., et al. (2013). Coccolithophore species as indicators of surface oceanographic conditions in the vicinity of Azores islands. Estuar. Coast. Shelf Sci. 118, 50–59. doi: 10.1016/j.ecss.2012.12.010
Silva, M. A., Prieto, R., Jonsen, I., Baumgartner, M. F., and Santos, R. S. (2013). North Atlantic blue and fin whales suspend their spring migration to forage in middle latitudes: building up energy reserves for the journey? PLoS ONE 8:e76507. doi: 10.1371/journal.pone.0076507
Sundblad, G., Bergström, U., and Sandström, A. (2011). Ecological coherence of marine protected area networks: a spatial assessment using species distribution models. J. Appl. Ecol. 48, 112–120. doi: 10.1111/j.1365-2664.2010.01892.x
Teira, E., Mourino, B., Maranón, E., Pérez, V., Pazó, M. J., Serret, P., et al. (2005). Variability of chlorophyll-and primary production in the Eastern North Atlantic Subtropical Gyre: potential factors affecting phytoplankton activity. Deep Sea Res. Part I 52, 569–588. doi: 10.1016/j.dsr.2004.11.007
Tempera, F., Atchoi, E., Amorim, P., Gomes-Pereira, J., and Gonçalves, J. (2013). Atlantic Area Marine Habitats. Adding new Macaronesian habitat types from the Azores to the EUNIS Habitat Classification. MeshAtlantic Technical Report, 4/2013, 126. Available online at: http://www.meshatlantic.eu/assets/files/bluebox/02b_Azores_Marine_Habitats%20v1_1.pdf
Thomas, C. D., Cameron, A., Green, R. E., Bakkenes, M., Beaumont, L. J., Collingham, Y. C., et al. (2004). Extinction risk from climate change. Nature 427, 145–148. doi: 10.1038/nature02121
Tittensor, D. P., Baco, A. R., Brewin, P. E., Clark, M. R., Consalvey, M., Hall-Spencer, J., et al. (2009). Predicting global habitat suitability for stony corals on seamounts. J. Biogeogr. 36, 1111–1128. doi: 10.1111/j.1365-2699.2008.02062.x
Tobeña, M., Prieto, R., Machete, M., and Silva, M. A. (2016). Modeling the potential distribution and richness of cetaceans in the Azores from fisheries observer program data. Front. Mar. Sci. 3:202. doi: 10.3389/fmars.2016.00202
Tyberghein, L., Verbruggen, H., Pauly, K., Troupin, C., Mineur, F., et al. (2012). Bio-ORACLE: a global environmental dataset for marine species distribution modelling. Global Ecol. Biogeogr. 21, 272–281. doi: 10.1111/j.1466-8238.2011.00656.x
Vandeperre, F., Aires-da-Silva, A., Fontes, J., Santos, M., Serrão Santos, R., and Afonso, P. (2014). Movements of blue sharks (Prionace glauca) across their life history. PLoS ONE 9:e103538. doi: 10.1371/journal.pone.0103538
Vierod, A. D. T., Guinotte, J. M., and Davies, A. J. (2014). Predicting the distribution of vulnerable marine ecosystems in the deep sea using presence-background models. Deep Sea Res. Part II 99, 6–18. doi: 10.1016/j.dsr2.2013.06.010
Wiens, J. A., Stralberg, D., Jongsomjit, D., Howell, C. A., and Snyder, M. A. (2009). Niches, models, and climate change: Assessing the assumptions and uncertainties. Proc. Natl. Acad. Sci. U.S.A. 106, 19729–19736. doi: 10.1073/pnas.0901639106
Wunsch, C. (2016). Global ocean integrals and means, with trend implications. Ann. Rev. Mar. Sci. 8, 1–33. doi: 10.1146/annurev-marine-122414-034040
Yesson, C., Bedford, F., Rogers, A. D., and Taylor, M. L. (in press). The global distribution of deep-water Antipatharia habitat. Deep Sea Res. Part II. doi: 10.1016/j.dsr2.2015.12.004
Keywords: Azores, environmental parameters, seabed conditions, sea surface temperature, chlorophyll-a
Citation: Amorim P, Perán AD, Pham CK, Juliano M, Cardigos F, Tempera F and Morato T (2017) Overview of the Ocean Climatology and Its Variability in the Azores Region of the North Atlantic Including Environmental Characteristics at the Seabed. Front. Mar. Sci. 4:56. doi: 10.3389/fmars.2017.00056
Received: 22 January 2016; Accepted: 15 February 2017;
Published: 07 March 2017.
Edited by:
Anthony Grehan, National University of Ireland, Galway, IrelandReviewed by:
Andrew R. Thurber, Oregon State University, USAMyriam Lacharité, Nova Scotia Community College, Canada
Copyright © 2017 Amorim, Perán, Pham, Juliano, Cardigos, Tempera and Morato. This is an open-access article distributed under the terms of the Creative Commons Attribution License (CC BY). The use, distribution or reproduction in other forums is permitted, provided the original author(s) or licensor are credited and that the original publication in this journal is cited, in accordance with accepted academic practice. No use, distribution or reproduction is permitted which does not comply with these terms.
*Correspondence: Patrícia Amorim, patricia.amorim@mare-centre.pt