Marine Spatial Planning in a Transboundary Context: Linking Baja California with California's Network of Marine Protected Areas
 Nur Arafeh-Dalmau1,2
  Guillermo Torres-Moye1
  Georges Seingier3*
  Gabriela Montaño-Moctezuma2 Fiorenza Micheli4
- 1Marine Ecology, Conservation, and Resource Management Lab, Department of Biology, Facultad de Ciencias Marinas, Universidad Autónoma de Baja California, Ensenada, Mexico
- 2Marine Ecology, Conservation, and Resource Management Lab, Department of Biological Oceanography, Instituto de Investigaciones Oceanológicas, Universidad Autónoma de Baja California, Ensenada, Mexico
- 3Environmental Sciences, Facultad de Ciencias Marinas, Universidad Autónoma de Baja California, Ensenada, Mexico
- 4Micheli Lab, Hopkins Marine Station, Department of Biology, Stanford University, Pacific Grove, CA, United States
It is acknowledged that an effective path to globally protect marine ecosystems is through the establishment of eco-regional scale networks of MPAs spanning across national frontiers. In this work we aimed to plan for regionally feasible networks of MPAs that can be ecologically linked with an existing one in a transboundary context. We illustrate our exercise in the Ensenadian eco-region, a shared marine ecosystem between the south of California, United States of America (USA), and the north of Baja California, Mexico; where conservation actions differ across the border. In the USA, California recently established a network of MPAs through the Marine Life Protection Act (MLPA), while in Mexico: Baja California lacks a network of MPAs or a marine spatial planning effort to establish it. We generated four different scenarios with Marxan by integrating different ecological, social, and management considerations (habitat representation, opportunity costs, habitat condition, and enforcement costs). To do so, we characterized and collected biophysical and socio-economic information for Baja California and developed novel approaches to quantify and incorporate some of these considerations. We were able to design feasible networks of MPAs in Baja California that are ecologically linked with California's network (met between 78.5 and 84.4% of the MLPA guidelines) and that would represent a low cost for fishers and aquaculture investors. We found that when multiple considerations are integrated more priority areas for conservation emerge. For our region, human distribution presents a strong gradient from north to south and resulted to be an important factor for the spatial arrangement of the priority areas. This work shows how, despite the constraints of a data-poor area, the available conservation principles, mapping, and planning tools can still be used to generate spatial conservation plans in a transboundary context.
Introduction
Marine protected areas (MPAs) are spatial management tools used to protect and restore marine ecosystems, with the purpose to promote and maintain ocean ecosystem services (Allison et al., 1998; Lubchenco et al., 2003; Halpern et al., 2010). Different approaches have been used to design MPAs depending on the political and economic context of each region. Traditionally, MPAs have been implemented as a result of governmental or local community decisions (Gleason et al., 2010). However, there are recent examples of planning processes to design MPAs networks that are ecologically connected and managed as a system (Airamé et al., 2003; Fernandes et al., 2005; Lowry et al., 2009; Saarman et al., 2013; Hopkins et al., 2016).
Regional MPA network design processes are more common nowadays (e.g., Australia, California, USA, United Kingdom, among others) but mostly limited within the political boundaries of a country. However, the oceans are dynamic environments connected by water currents and animal movements; thus, neighboring countries share oceanographic processes that connect marine populations and ecosystems (Carr et al., 2003; Wilkinson et al., 2004; Torres-Moye et al., 2013). In these shared coastal environments, the actions of one country may affect the other, e.g., through the establishment of conservation measures, pollution control, or the introduction of invasive species (Mazor et al., 2013). Therefore, protection of marine ecosystems requires management at an eco-regional scale (units large enough to encompass ecological or life history processes) through the establishment of transboundary MPAs networks (Sandwith and Besançon, 2005; IUCN World Commission on Protected Areas, 2008; Guerreiro et al., 2010; Torres Moye, 2012; Giakoumi et al., 2013; Jessen et al., 2016).
Southern California (henceforth “California”), USA, and the northwest of Baja California (henceforth “Baja California”), Mexico, share the Ensenadian eco-region that extends from Santa Monica Bay, USA, to Punta Eugenia, Mexico (Blanchette et al., 2008). This transboundary eco-region represents a biogeographic area connected by the southern end of the California Current system (Di Lorenzo, 2003), a highly productive region of the northwestern Pacific Ocean (Dailey et al., 1993; Castro, 2010). Even though these two countries share the same eco-region, their social, economic, and management context differ across the border. While the south coast of California is one of the most populated regions of the world, Baja California holds a lower population density and mostly concentrated at the north, in the coasts of Tijuana and Ensenada. As for fisheries, in California, commercial fishing permits are granted to individual fishers or vessels in contrast to the concessions or permits for fisher groups or cooperatives in Baja California (Enríquez-Andrade et al., 2007). In both regions, recreational fisheries are open access by individual permits, but of greater economic importance in California. In the context of marine conservation, California recently implemented a network of MPAs, following the Marine Life Protection Act (MLPA), based on scientific principles and stakeholder involvement (Gleason et al., 2013; Kirlin et al., 2013; Saarman et al., 2013). However, Baja California still lacks a network of MPAs or a systematic conservation planning (Margules and Pressey, 2000) effort and has less biophysical information of its coastal systems compared to California.
Many considerations are used to identify areas for conservation in a spatial prioritization exercise (Moilanen et al., 2009). The design of an ecologically functional and socio-economically viable network of MPAs requires spatial information that captures the ecological and social complexity of the coastal systems (Naidoo et al., 2006; Klein et al., 2008a; Ban and Klein, 2009). Yet, very few regions around the world have detailed spatial information (Ban et al., 2009; Giakoumi et al., 2011, 2013). In many cases the distribution of habitats is used as a surrogate for species distribution, a cost-effective method to identify conservation priority areas (Ward et al., 1999; Roberts et al., 2001). On the other hand, fishing effort and/or commercial landings are used to quantify the socio-economic costs from the implementation of a network of MPAs (Naidoo et al., 2006; Klein et al., 2008a,b; Ban and Klein, 2009; Giakoumi et al., 2013; Mazor et al., 2013). Both ecological and socio-economic information are essential to identify conservation priority areas that minimize the possible socio-economic conflicts. Recently, other aspects have been included for the design of a network of MPAs. As an example, cumulative human impact maps (e.g., Halpern et al., 2008, 2009; Selkoe et al., 2009; Ban et al., 2010; Micheli et al., 2013) have been used to prioritize habitats in good condition (Klein et al., 2013), and management surrogates (Balmford et al., 2004; Naidoo et al., 2006) to quantify the enforcement costs (Davis et al., 2015).
In this study, we present a novel approach for the design of a network of MPAs in a transboundary context using multiple considerations. Our prioritization exercise aims to use the same design criteria as in California to design a regionally feasible network of MPAs for Baja California that is ecologically linked with California's network. This study shows how, even in a region with limited spatial information, the available conservation principles, mapping, and planning tools can still be used to generate spatial conservation plans.
Methods
Planning Region
The planning region extends a linear distance of 340 km, from the USA-Mex border (lat 29.741°, long −115.675°) to Punta San Antonio, BC (lat 29.741°, long −115.675°), and from the coastline out to 3 nautical miles (to mimic the same dimension as in California) (Figure 1). It was chosen because it has the status of Marine Priority Region for Conservation 1 (MPRC1) (Aguilar et al., 2008; Arriaga Cabrera et al., 2009), and belongs to the Ensenadian eco-region (Blanchette et al., 2008). To be consistent with the scale of the cumulative human impact study for the California Current (Halpern et al., 2009), we divided the region into 3,781 square planning units (PUs) of 1 km2, but their size varied at the land and the 3 nautical miles limit. To analyze the results from the prioritization exercise we decided to divide our planning region in three zones (north, center, and south).
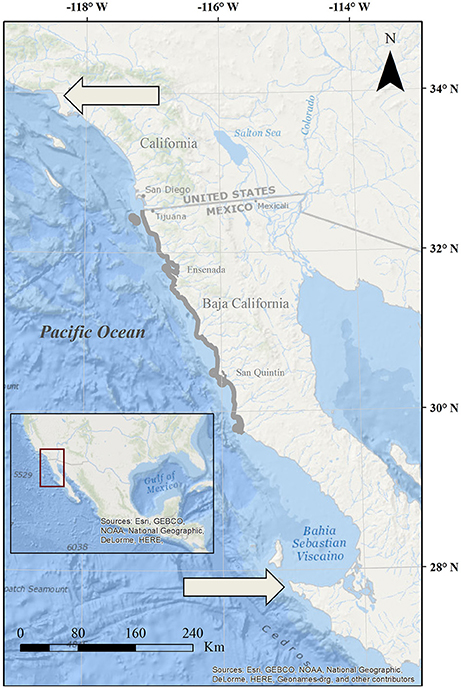
Figure 1. Location of the Marine Priority Region for Conservation 1 (gray contour) in Baja California, Mexico. The arrows indicate the geographic limits of the Ensenadian eco-region from Santa Monica Bay, USA, to Punta Eugenia, Mexico.
Conservation Objectives
We used the same four scientific guidelines (based on ecological processes) defined by the MLPA (Saarman et al., 2013), for the spatial design of a network of MPAs: habitat representation, habitat replication, size of the MPAs, and distance between MPAs (Table 1). Our conservation objectives included the key marine habitats defined by the MLPA with different conservation targets (10, 20, and 30%) according to their productivity and significance to fisheries (Table 2).
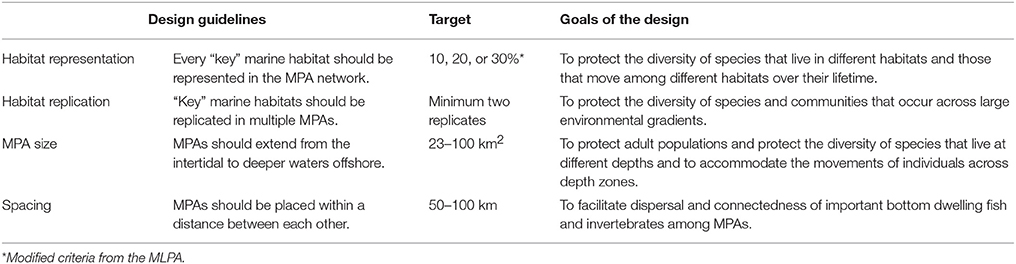
Table 1. MPA network design guidelines (modified from Saarman et al., 2013) based on the MLPA scientific criteria and the conservation targets and design goals associated with each guideline.
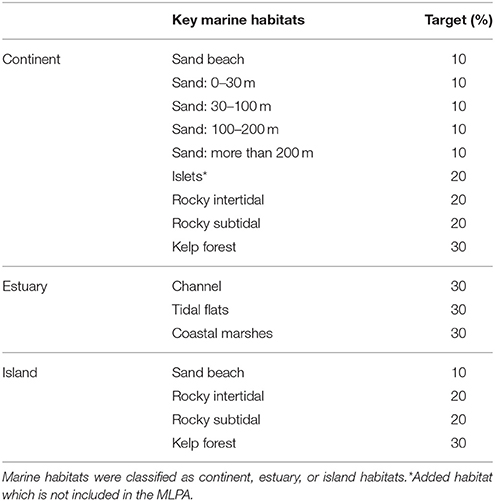
Table 2. Biophysical conservation objectives and targets based on the Marine Life Protection Act Initiative.
To differentiate between the intertidal and subtidal habitats, the coastline was digitalized using Google Earth lowest tide available historical images. Based on the General Bathymetric Chart of the Oceans (IOC, IHO, and BODC, 2003), we extracted the different depth ranges with ArcGis 10 (ESRI): from 0–30 m, 30–100 m, 100–200 m, and more than 200 m. The key marine habitats in our planning region were mapped from the intertidal to three nautical miles, by visualizing Google Earth historical images and incorporating existing data (Figure 2). We validated the data through rigorous field observations, existing knowledge (Montaño-Moctezuma et al., 2013), and expert opinion (Table 3).
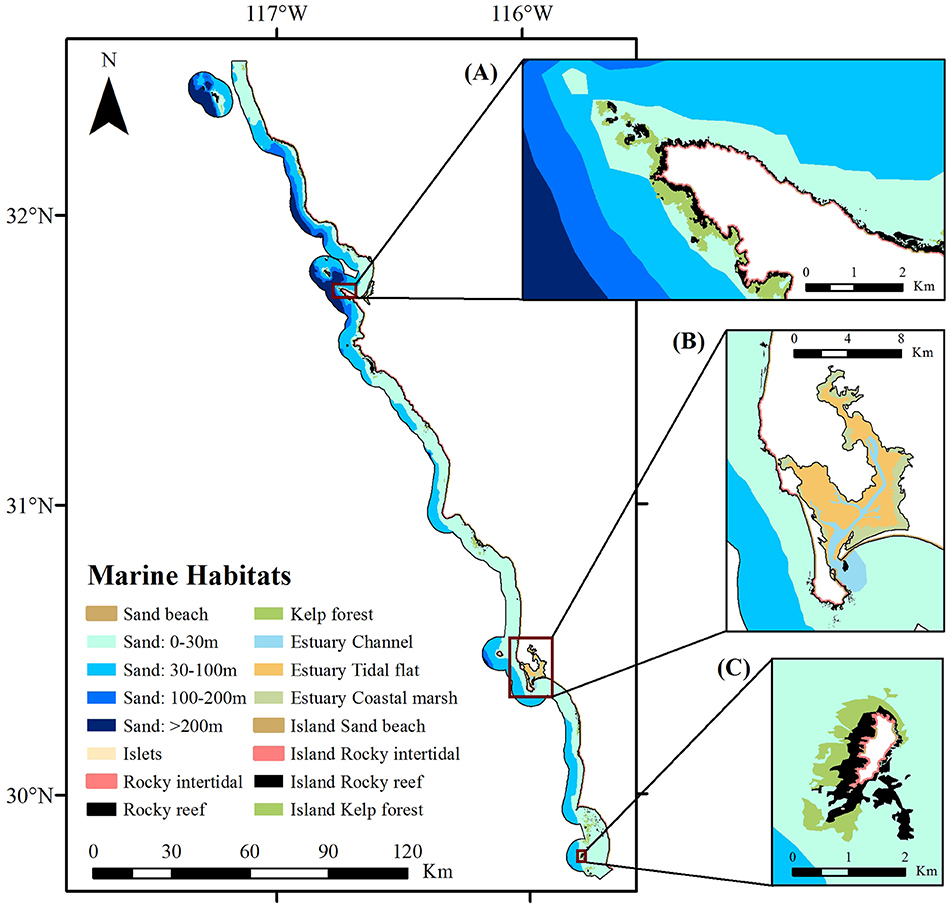
Figure 2. Marine key habitat distribution from intertidal to subtidal from the MPRC1, Baja California, Mexico. Close up images show examples of: (A) Continent, (B) Estuary, and (C) Island.
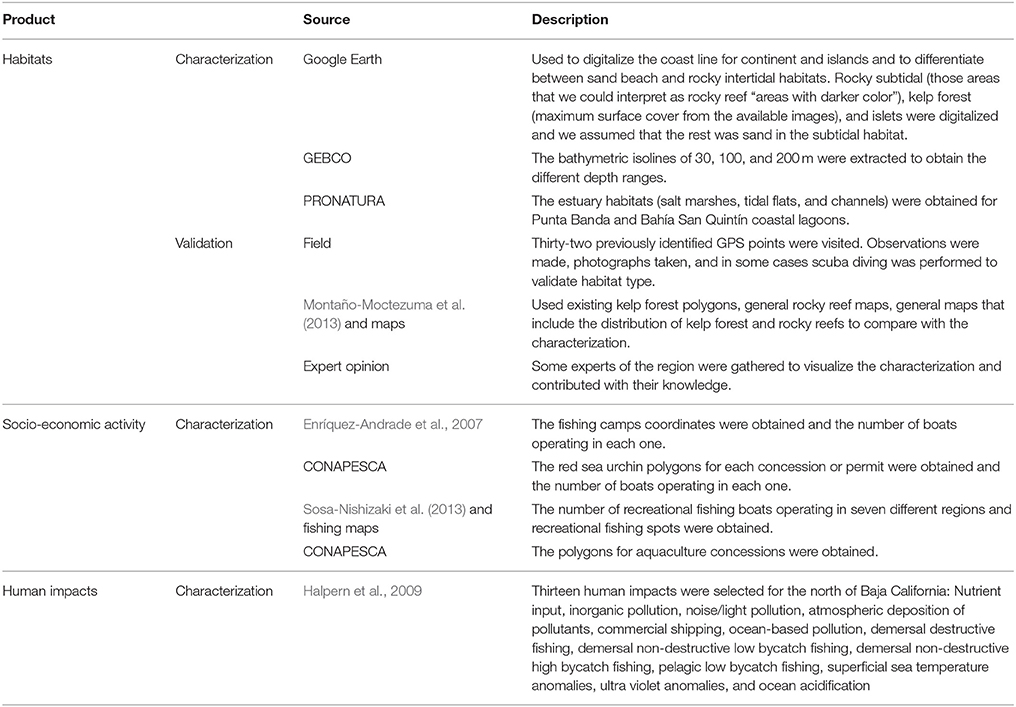
Table 3. Data sources used to characterize key marine habitats, fishing and aquaculture activities, and human impacts on marine ecosystems for the MPRC1 in Baja California, Mexico.
Socio-Economic Costs
The most important economic activities within the MPRC1 are commercial and recreational fisheries, and aquaculture. To account for the socio-economic cost resulting from the selection of a planning unit in the solution of the MPA network, we estimated the opportunity cost (Naidoo et al., 2006; Ban et al., 2009), as a weighted sum of the commercial and recreational fishing, and aquaculture activities.
Commercial Fishing
In Baja California, fishers are granted spatially-defined fishing concessions or permits (henceforth “fishing polygons”). We obtained the spatial location of each fishing camp, the red sea urchin (Mesocentrotus franciscanus) fishing polygons, and the number of boats operating in each one of them (Enríquez-Andrade et al., 2007; CONAPESCA) (Table 3). We used two approaches to quantify the opportunity cost for commercial fishing. As a general approach, we calculated the commercial fishing effort in each fishing camp relative to each planning unit (Ecami):
where b is the number of boats operating in each fishing camp, ai the area in the planning unit i, and acam the fishing area of each fishing camp.
The majority of the economically relevant fisheries in the MPRC1 are associated with rocky substrate (rocky reefs and kelp forests). To quantify these fisheries, we decided to use red sea urchin fishing polygons data, since it is a shared resource with reliable data, and one of the most economically important fisheries for the entire planning region. We calculated the fishing effort in each polygon relative to each planning unit (Epoli):
where b is the number of boats operating in each polygon, ai the area of rocky reef in the planning unit i, and arp the area of rocky reef in polygon p. Based on a weighted sum of both approaches we estimated the commercial fishing effort relative to each planning unit (Ci):
where α is a weighting parameter included to assign the relative value of each approach. We assumed that the fishing effort associated to rocky substrates is four times higher than the general effort (based on the species associated to this habitat), so we assigned α = 0.2. This method of estimating the commercial fishing effort allows us to assign a value for all planning units and a higher one to those that contain rocky substrates.
Recreational Fishing
We obtained the spatial location of recreational fishing spots and the number of boats operating in 7 distinct regions (Sosa-Nishizaki et al., 2013, FISH.n.MAP CO., Baja California North, Sportfishng Atlas Baja California Edition) (Table 3). Based on these data, we divided the planning region in seven regions (Supplementary Figure 1), and calculated the recreational fishing vessel density for the corresponding region. Due to the absence of detailed spatial information, each planning unit that overlapped with recreational fishing spots was assigned the value of fishing vessel density and thus we obtained the recreational fishing effort for each planning unit (Di):
where b is the number of boats operating in each region and ar the area of the region r.
Aquaculture
We obtained the spatial location of the aquaculture concessions (CONAPESCA) (Table 3) and estimated the percentage of concession area (Ai) relative to each planning unit:
where aci is the area of aquaculture concession c in planning unit i, and ai the area of each planning unit.
Opportunity Cost
We standardized the previous approaches and quantified the opportunity cost relative to each planning unit (Si) through a weighted sum of Ci, Di and Ai:
where φ is a weighted parameter included to assign the relative value of each socio-economic activity. Since commercial fishing generates more employment in the MPRC1 (followed by aquaculture and recreational fishing), we assigned it a value of φ = 3. Therefore, we obtained a surrogate for opportunity costs that accounts for commercial and recreational fishing and aquaculture in our planning region.
Habitat Condition
An area can fulfill the conservation goals and objectives with a low opportunity cost, but it might not be in a good condition (Evans et al., 2015; Possingham et al., 2015). Based on the cumulative human impact study (Halpern et al., 2009), we selected those impacts that had data for our entire planning region (13 impacts) (Table 3). We summed them, standardized (0–1,000), and obtained a single value of cumulative impact for each planning unit. Finally we classified the values in four equal intervals: Very good condition (C1) from 0 to 250; Good condition (C2) from 251 to 500; Regular condition (C3) from 501 to 750, and Bad condition (C4) from 751 to 1,000, and divided each of the 16 conservation objectives (habitats) in four, obtaining a total of 64 sub-habitats. We developed criteria to assign the conservation goals for each sub-habitat (Supplementary Table 1) with the objective to prioritize those in better condition, and to fulfill the conservation goals of each habitat (Mh):
where c1 is the area of the sub habitat with very good condition, px the conservation goal for each sub-habitat x (from 1 to 64), ah the area of habitat h (from 1 to 16), c2 the area of sub-habitat with good condition, c3 the area of sub-habitat with regular condition, and c4 the area of sub-habitat with bad condition (always 0).
Enforcement Cost
The enforcement capacity is an important aspect to consider in any MPA management approach; especially in places were fishermen co-manage their fishing areas. With a participative management perspective, we calculated the enforcement cost in each sea urchin polygon using three metrics (Table 4): 1. Surveillance capacity (number of boats divided by the area of rocky reef), 2. Distance from the fishing camps to the farthest rocky reefs, 3. Coast type (Bale and Minich, 1971) (different coast types might present different surveillance potential, e.g., in higher cliffs, one might have better vision for surveillance than in lower ones). We assumed that those polygons with more boats per unit area of rocky substrate, with shorter distances from the fishing camp to the farthest rocky substrate, and coasts with higher cliffs will present a better enforcement capacity and need to invest less money to improve. We classified the obtained values for each metric in four categories: very good, good, regular, and bad and gave them values of 25, 50, 75, and 100 respectively. Finally we summed the values of the three metrics for each concession and standardized them obtaining the enforcement cost in each sea urchin polygon (Ecp).
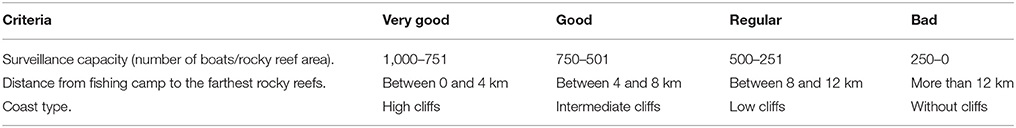
Table 4. Valuation criteria developed to calculate the enforcement capacity based on the fishing polygons of red sea urchin (Mesocentrotus franciscanus) fishing permits or concessions.
Combined Opportunity and Enforcement Cost
With the aim to obtain a metric that includes the opportunity cost (Si) and the enforcement cost (Ecp), we calculated the combined cost relative to each planning unit (Ccomi) as a weighted sum of Si and Ec:
where ρ is a weighted parameter included to assign the relative value for each approximation. Since the opportunity cost (Si) is higher than the enforcement cost, we decided to assign a value for ρ = 2.
Planning Scenarios
For the prioritization exercise we used the systematic conservation planning tool Marxan that solves the minimum set problem (Ball and Possingham, 2000; Possingham et al., 2000). Marxan is a decision-support system that uses simulated annealing algorithms to find many good near-optimal solutions of priority areas that meet the set objectives while minimizing the perimeters and costs (Ball et al., 2009).
The first objective of the planning scenarios was to generate networks of MPAs for Baja California that are ecologically linked with the existing ones in southern California (established using similar design criteria). The second objective was to evaluate the tradeoffs of incorporating different considerations in each scenario, to plan for regionally viable networks. In scenario 1 (representation), only the conservation objectives were considered and the cost was equal to the area of the planning unit. In scenario 2 (costs), we incorporated opportunity cost to minimize the costs that the network would represent for commercial and recreational fishing and aquaculture. For scenario 3 (condition), we incorporated the habitat condition to prioritize less impacted areas. Finally, scenario 4 (enforcement), included all the considerations and prioritized those sea urchin polygons that present better enforcement capacity (we substituted the opportunity cost for the combined cost) (Table 5).
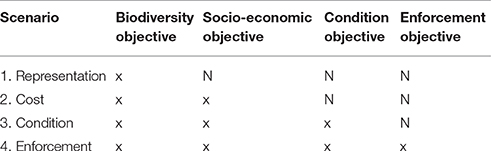
Table 5. Four scenarios of networks of MPAs for the MPRC1 in Baja California, Mexico, based on single and multiple biophysical, and socio-economic objectives (x, objective included; N, objective not included).
For each scenario, we generated 100 solutions with Marxan, each one with a different spatial configuration. We evaluated the results using the best solution (best solution of the 100 generated with Marxan) and the selection frequency (number of times a planning unit was selected in the 100 solutions).
Results
Distribution of the Planning Considerations
While all key marine habitats were present in the north and south zones of the MPRC1, there were no island or estuary habitats in the central zone (Supplementary Table 2). Overall, the north zone registered the highest opportunity cost for conservation in terms of commercial and recreational fishing and aquaculture (Figure 3) (as a sum of the cost of each planning unit, in each region, selected in the best solution divided by the total opportunity cost of the planning region), representing 44% of the total cost. The total opportunity costs for the south and central zones were very similar (27.37 and 28.65%) (Table 6). In the MPRC1, most of the planning units had a good habitat condition (65.4%), followed by regular (23.4%), very good (7.6%), and bad condition (3.5%). As expected, due to the coastal population distribution, we found a gradient from north to south of high to low cumulative impact, and hence, bad habitat condition (north) to very good condition (south) (Figure 3). As for the enforcement capacity, 6.5% of the planning units had a very good capacity, 31.9% good, 46.8% regular, and 14.8% bad. Most of the bad capacity planning units were located in the south zone, and the majority of the very good and good ones were in the central and north zones respectively (Table 6). The combined opportunity and enforcement costs (Figure 3) were higher in the south (44%) than in the north (36.5%), and the central zones (19.5%).
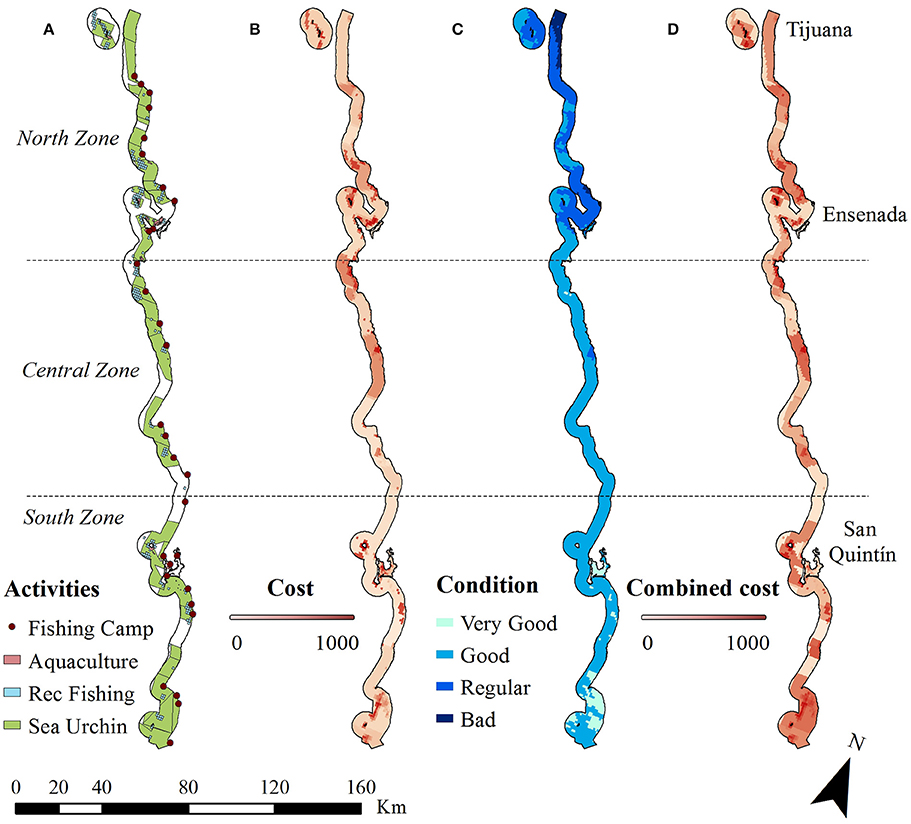
Figure 3. Distribution of (from left to right) (A) socio-economic activities of commercial fishing (fishing camps and red sea urchin polygons), recreational fishing, and aquaculture activity, (B) combined opportunity cost layer for the three activities, (C) habitat condition classification, and (D) combined opportunity and enforcement cost layer for the MPRC1, Baja California, Mexico.
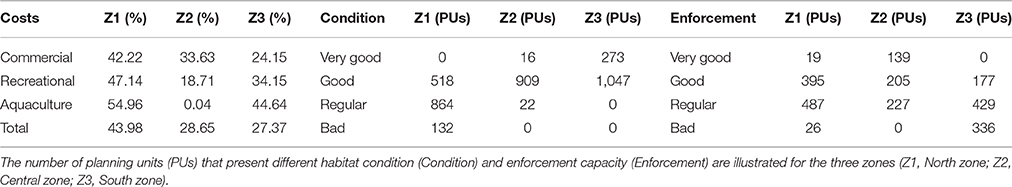
Table 6. Percentage of the opportunity cost (Costs) for commercial, recreational, and aquaculture for the three zones as a sum of the cost of each planning unit selected in the best solution divided by the total opportunity cost.
Scenarios and Priority Areas
Based on the best solution of the 100 runs with Marxan (Figure 4), we assessed the MLPA guidelines fulfilled in each MPAs network scenario, and the opportunity costs that would represent. The scenarios accomplished between 78.5 and 84.4% of the MLPA guidelines (Table 7). As we expected all scenarios met the habitat representation criteria (one of the objectives of Marxan is to fulfill the conservation targets). Overall, in the different scenarios, a high percentage of the spacing, replication and size criteria were accomplished by the MPAs networks. For the opportunity cost, when we planned using area as a cost surrogate (scenario 1), the network of MPAs represented the highest cost for the combined socio-economic activities in our planning region (14.7%). However, when the socio-economic cost was added in scenario 2–4 the opportunity cost decreased and represented 7.5, 8.4, and 11.2%, respectively.
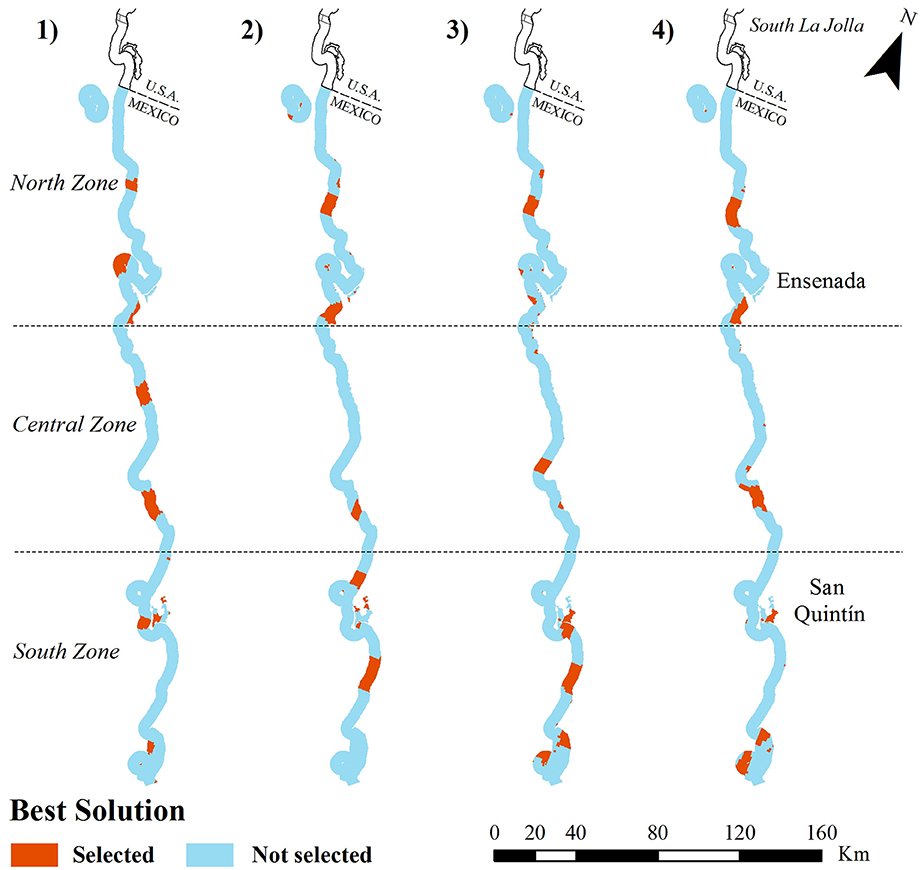
Figure 4. Best solution (network of MPAs selected in the best solution of 100 runs with Marxan) of the four scenarios: (1) Representation, (2) Cost, (3) Condition, (4) Enforcement.
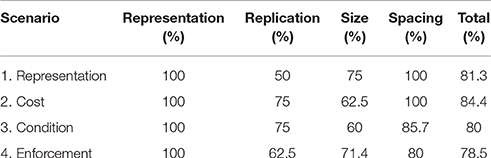
Table 7. Percentage accomplished of each MLPA criteria (habitat representation, habitat replication, size of MPAs, and spacing between MPAs) and the total criteria fulfilled in each scenario based on the best solution of 100 runs with Marxan.
Based on the selection frequency (Figure 5), we analyzed the tradeoffs resulting from the incorporation of more considerations in each scenario. As we added considerations to our scenarios (1–4) we found that the selection of priority planning units increased (>50% selection frequency) (Figures 5, 6A). If only habitat representation was considered (scenario 1), 1.7% of the planning units emerged as priority. When we added the opportunity costs (scenarios 2–4), 5.6% emerged for scenario 2 (cost), 6% for scenario 3 (condition), and 9.5% for scenario 4 (enforcement). On a regional perspective, in scenarios 2 and 3, most priority planning units were located in the south, especially for scenario 3 (condition) where almost 80% of the priority planning units were located in the south, and only 4% in the north. For the last scenario, most priority planning units were located in the north (48%), followed by the south (31.9%) (Figure 6B).
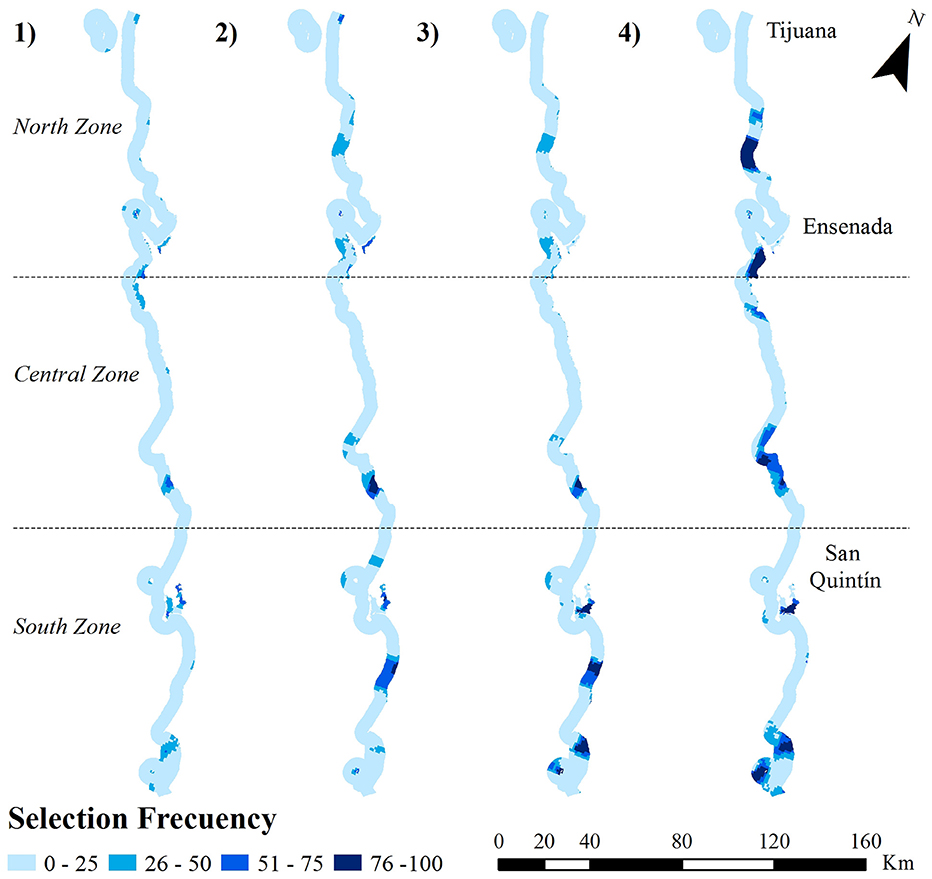
Figure 5. Selection frequency (percentage that a planning unit is selected from 100 runs with Marxan) of the four scenarios: (1) Representation, (2) Cost, (3) Condition, (4) Enforcement.
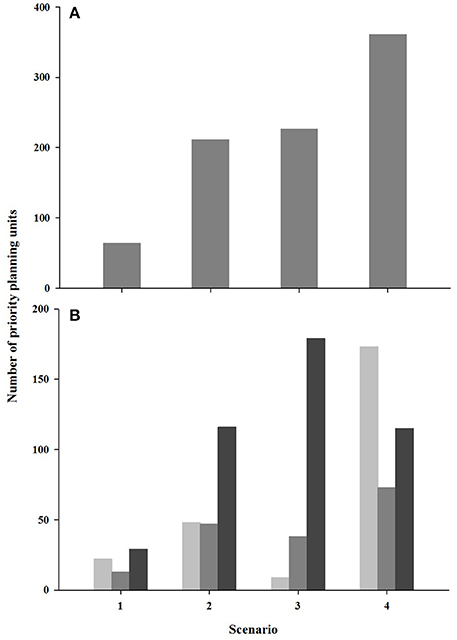
Figure 6. Comparison of the number of priority planning units (PUs) (selection frequency higher than 50%) of 100 runs with Marxan. For each scenario (A), for each scenario in each zone (B). Light gray bar represents the north, intermediate gray the central and dark gray the south zone.
Discussion
Globally, we are in a race to protect 10% of the marine ecosystems (Secretariat of the Convention on Biological Diversity, 2014) through “ecologically representative” MPAs. However, most countries are slowly reaching that target. Among other obstacles are the scarcity of spatial information (e.g., Giakoumi et al., 2013), and/or the lack of initiatives that allow nations to take decisions based on science and the minimization of socio-economic conflicts. Also, in many cases existing MPAs have inadequate designs to work as functional networks (Spalding and Hale, 2016), or were not established as eco-regional transboundary networks of MPAs (e.g., Guerreiro et al., 2010). In this study we assembled available ecological and socio-economic information and collected new data in order to identify priority zones for a future network of MPAs in Baja California, linked with the one in southern California. To achieve this we used the MLPA scientific criteria and the features that best represent the social and management context of our region. This study builds upon the existing literature on marine conservation planning in an eco-regional and transboundary context (e.g., Giakoumi et al., 2013; Mazor et al., 2013, 2014), as well as the importance of using multiple considerations in a prioritization exercise (e.g., Klein et al., 2013).
All of the MPA networks from the different scenarios met the habitat representation criteria (to conserve a target percentage of the marine habitats), and achieved a relatively high percentage of the other MLPA guidelines. In all the scenarios, including the enforcement scenario that incorporates all the considerations (Figure 4), the northernmost MPA of Baja California fulfilled the recommended size and distance from the southern MPAs of California (combined South La Jolla SMCA & SMR) and also included the 9 continent habitats; therefore, these networks could protect shared species, populations, and communities, and facilitate connectivity between both regions. A future transboundary network could be ecologically and economically beneficial for the Ensenadian eco-region and it is acknowledged that such an approach could promote the cooperation and the exchange of information and technology between both countries (UNEP-WCMC, 2008; McCallum et al., 2015).
At a regional level we were able to design networks that integrated multiple considerations (scenarios 2–4) and represent low opportunity costs for fishers and aquaculture investors. The scenario that incorporates all the ecological, social and management considerations (scenario 4) would represent an increase of only 3.8% in the socio-economic cost compared to planning without including habitat condition and enforcement capacity (scenario 2). This result supports previous recommendations to minimize conflicts by incorporating opportunity costs in marine conservation planning (Stewart and Possingham, 2005; Klein et al., 2008a, 2013; Ban et al., 2009; Mazor et al., 2014), with the aim of designing viable networks of MPAs. Planning based on multiple considerations also helped identifying priority conservation areas, since less optimal areas were found, and those that did achieve all the objectives were prioritized. This finding contributes to the existing knowledge showing that not only the costs are important in the selection of priority areas (Naidoo et al., 2006; Ban et al., 2009; Mazor et al., 2014), but also adding multiple considerations favors the selection of more priority areas.
Human population proved to be a relevant factor for the spatial arrangement of the priority planning units. The north zone, which has the highest population density, registered a higher opportunity cost and a lower habitat condition, and as a result less priority planning units emerged there, compared to the central and south zones. In contrast to Klein et al. (2013), the spatial arrangement of the priority planning units radically changed when we incorporated habitat condition data. This may be explained by the fact that in Baja California there is a higher contrast in population density between the three zones, and highlights the importance of including habitat condition in prioritization exercises for areas with demographic differences.
When the enforcement capacity was included (scenario 4), the spatial arrangement radically changed, and a more even representation was achieved. Because the north has a better enforcement capacity than the south, more priority areas emerged in this zone. These results show an indirect way to estimate enforcement costs in areas managed through fishing concessions or permits and can be applied or adapted to other similar regions; however, since enforcement capacity was an important factor, it becomes relevant the need to improve its estimation.
This study represents the first effort to generate and integrate all the available and necessary information for the systematic conservation planning of the MPRC1 in Baja California. We illustrated a practical method to map marine habitats in data-poor areas and contribute with a novel approach to quantify the opportunity and management costs in areas managed through fishing concessions or permits. However, as in most marine spatial conservation exercises, we were faced with some limitations. Although we used the same four scientific guidelines from the MLPA, other more specific design criteria were not included (e.g., minimum habitat area set). Also, the available historical Google Earth images were more abundant in the north zone making the fine marine habitat mapping more challenging for the center and south zones. And even though we lessened these constraints employing other sources of information and direct field observations, we could not map some habitats such as deep rocky reefs and seagrass beds. On the other hand, for the opportunity costs we did not include other important fisheries resources such a lobster and finfish; however, our approach for the combined opportunity cost allowed us to consider the three most important activities in the region. In previous studies, it has been found that planning based on a single sector produces higher costs for other sectors, and therefore less efficient prioritization results (Mazor et al., 2014). Since monetary data were not available for each sector, we used an indirect measure to quantify their relative importance and assumed that the commercial fishing is a source of greater economic income followed by aquaculture and sport fishing. Despite some limitations, this is one of the few marine spatial planning exercises that include multiple measures of cost (e.g., Giakoumi et al., 2013; Mazor et al., 2013).
For the habitat condition classification, we could only use 13 of the 25 human impacts from the California Current study (Halpern et al., 2009). The lack of information of some local human impacts may overestimate the habitat condition in some sites (e.g., Torres-Moye and Escofet, 2014); nevertheless, this represents one of the few works that accounts for marine habitat condition. Finally, for the enforcement capacity we used an indirect measure which might not represent the real capacity since this can vary depending on the fishermen's organization and their available technology (e.g., radars and surveillance fast boats). However, our approach combines three measures compared to other similar works that are generally based in one metric (distance) (Ban et al., 2009; Davis et al., 2015).
With an adaptive ecosystem-based management approach (Katsanevakis et al., 2011), we recognize the need to continue generating spatial data for Baja California. This exercise identified some biophysical and socio-economic information gaps that could be used to inform governmental or academic priorities for future studies (programs designed to collect these data). Any further information which might improve our biophysical or socio-economical characterization could vary the spatial arrangement of the priority areas, and better support decision making in the region.
In this study we used the scientific experience of California for the design of MPAs; however, policies related to marine conservation and fisheries management differ across the border. Therefore, a future marine conservation planning process in Baja California might be different than that used in California. Many fishermen communities completely depend on the coastal marine resources, particularly those living south of Ensenada in sparsely populated areas. Restricting fishing activities in these communities would have negative consequences for their economic and social development. However, nowadays fishermen in Baja California are aware that their resources are limited and that they face new challenges such as climate change. Some local fisherman communities are working together with NGOs and scientists to co-manage their resources (Álvarez et al., 2015) by establishing community marine reserves or restocking marine populations (Micheli et al., 2012). Recently (December 2016), the Pacific islands from the MPRC1 were included as part of a Biosphere Reserve, representing the first legally protected marine areas in this region. This trend opens a window of opportunity to initiate a dialogue between local fishing communities, NGOs, government institutions, and the scientific community toward the design of a network of MPAs that is ecologically functional and beneficial for local communities.
In this work we show how, despite the constraints of a data-poor area, we were able to identify priority areas for conservation, which are ecologically linkable to an existing network of MPAs and socio-economically viable in a regional context. This exercise contributes to advancing global initiatives to design transboundary networks of MPAs managed in an eco-regional scale (Guerreiro et al., 2010; Mackelworth, 2012, 2016; Rosen and Olsson, 2013; Jessen et al., 2016). We hope that this work will lay the foundation to guide a future process of marine conservation planning in Baja California, including the collaboration between the north of Baja California and the south of California, with the aim to jointly coordinate initiatives to understand, manage, and conserve shared resources.
Author Contributions
NA and GT designed the initial project with the final review of GS, GM, and FM. NA and GT acquired data. The analysis of the data and the interpretation was conducted by NA. NA drafted the work and was revised by all the authors. All authors approve the version to be published and agree to be accountable for all aspects of the work in ensuring that questions related to the accuracy or integrity of any part of the work are appropriately investigated and resolved.
Conflict of Interest Statement
The authors declare that the research was conducted in the absence of any commercial or financial relationships that could be construed as a potential conflict of interest.
Acknowledgments
We gratefully acknowledge the Consejo Nacional de Ciencia y Tecnología (CONACYT, Mexico) for the master fellowship to NA and the support of the US NSF (DEB-1212124) to FM.
Supplementary Material
The Supplementary Material for this article can be found online at: https://www.frontiersin.org/article/10.3389/fmars.2017.00150/full#supplementary-material
Supplementary Figure 1. Location of seven regions for recreational fishing from the MPRC1, in Baja California, Mexico.
Supplementary Table 1. Criteria used to calculate the conservation target for each sub-habitat (Msh) depending on the percentage target of each habitat. Max target represents the fixed maximum target assigned depending on the condition. C1, Very good condition; C2, Good condition; C3, Regular condition; C4, Bad condition.
Supplementary Table 2. Percentage of each key marine habitat in each of the three zones (Z1, North zone; Z2, Central zone; Z3, South zone).
References
Aguilar, V., Kolb, M., Hernández, D., Urquiza, T., and Koleff, P. (2008). Prioridades de conservación de la biodiversidad marina de México. CONABIO. Biodiversitas 79, 1–15.
Airamé, S., Dugan, J. E., Lafferty, K. D., Leslie, H., McArdle, D. A., and Warner, R. R. (2003). Applying ecological criteria to marine reserve design: a case study from the California Channel Islands. Ecol. Appl. 13, S170–S184. doi: 10.1890/1051-0761(2003)013[0170:AECTMR]2.0.CO;2
Allison, G. W. J., Lubchenco, J., and Carr, M. H. (1998). Marine reserves are necessary but not sufficient for marine conservation. Ecol. Appl. 8, 79–92. doi: 10.1890/1051-0761(1998)8[S79:MRANBN]2.0.CO;2
Álvarez, P., Seingier, G., Bocco, G., Espejel, I., and Noriega, J. (2015). Regional landscape change in fishing communities of the Mexican North Pacific. Landsc. Res. 40, 855–874. doi: 10.1080/01426397.2015.1031095
Arriaga Cabrera, L., Aguilar, V., Espinoza, J. M., Galindo, C., Herrmann, H., Santana, et al. (2009). “Regiones prioritarias y planeación para la conservación de la biodiversidad,” in Capital natural de México, Vol. II, Estado de Conservación y Tendencias de Cambio (México: Conabio), 433–457.
Bale, J. B., and Minich, J. A. (1971). Coastal and Shore Landforms of Baja California Del Norte, Mexico (No. TR-O-71-2). California univ riverside dept of geography.
Ball, I. R., and Possingham, H. P. (2000). MARXAN (V1. 8.2). Marine Reserve Design Using Spatially Explicit Annealing, a Manual.
Ball, I. R., Possingham, H. P., and Watts, M. (2009). “Marxan and relatives: software for spatial conservation prioritisation,” in Spatial Conservation Prioritisation: Quantitative Methods and Computational Tools, eds A. Moilanen, K. A. Wilson, and H. P. Possingham (Oxford: Oxford University Press), 185–195.
Balmford, A., Gravestock, P., Hockley, N., McClean, C. J., and Roberts, C. M. (2004). The worldwide costs of marine protected areas. Proc. Natl. Acad. Sci. U.S.A. 101, 9694–9697. doi: 10.1073/pnas.0403239101
Ban, N. C., Alidina, H. M., and Ardron, J. A. (2010). Cumulative impact mapping: advances, relevance and limitations to marine management and conservation, using Canada's Pacific waters as a case study. Mar. Policy 34, 876–886. doi: 10.1016/j.marpol.2010.01.010
Ban, N. C., and Klein, C. J. (2009). Spatial socioeconomic data as a cost in systematic marine conservation planning. Conserv. Lett. 2, 206–215. doi: 10.1111/j.1755-263X.2009.00071.x
Ban, N. C., Hansen, G. J., Jones, M., and Vincent, A. C. (2009). Systematic marine conservation planning in data-poor regions: socioeconomic data is essential. Mar. Policy 33, 794–800. doi: 10.1016/j.marpol.2009.02.011
Blanchette, C. A., Melissa Miner, C., Raimondi, P. T., Lohse, D., Heady, K. E., and Broitman, B. R. (2008). Biogeographical patterns of rocky intertidal communities along the Pacific coast of North America. J. Biogeogr. 35, 1593–1607. doi: 10.1111/j.1365-2699.2008.01913.x
Carr, M. H., Neigel, J. E., Estes, J. A., Andelman, S., Warner, R. R., and Largier, J. L. (2003). Comparing marine and terrestrial ecosystems: implications for the design of coastal marine reserves. Ecol. Appl. 13, S90–S107. doi: 10.1890/1051-0761(2003)013[0090:CMATEI]2.0.CO;2
Castro, G. G. (2010). Dinámica del Ecosistema Pelágico Frente a Baja California, 1997–2007. Diez años de investigaciones mexicanas de la Corriente de California; Instituto Nacional de Ecología.
Dailey, M. D., Anderson, J. W., Reish, D. J., and Gorsline, D. S. (1993). “The southern california bight: background and setting,” in Ecology of the Southern California Bight: A Synthesis and Interpretation, eds M. D. Dailey, D. J. Reish, and J. W. Anderson (Los Angeles, CA: University of California Press), 1–18.
Davis, K., Kragt, M., Gelcich, S., Schilizzi, S., and Pannell, D. (2015). Accounting for enforcement costs in the spatial allocation of marine zones. Conserv. Biol. 29, 226–237. doi: 10.1111/cobi.12358
Di Lorenzo, E. (2003). Seasonal dynamics of the surface circulation in the Southern California Current System. Deep Sea Res. II Top. Stud. Oceanogr. 50, 2371–2388. doi: 10.1016/S0967-0645(03)00125-5
Enríquez-Andrade, R., Almanza-Heredia, J. A., and Vaca-Rodríguez, J. G. (2007). Identificación de Oportunidades Para Impulsar el Desarrollo Social y Económico en Los Campos Pesqueros de Baja California. Grupo de Pesquerías de La Facultad de Ciencias Marinas de La Universidad Autónoma de Baja California; Para La Secretaría de Fomento Agropecuario Del Gobierno Del Estado de Baja California, Rep. Tec, 225.
Evans, M. C., Tulloch, A. I., Law, E. A., Raiter, K. G., Possingham, H. P., and Wilson, K. A. (2015). Clear consideration of costs, condition and conservation benefits yields better planning outcomes. Biol. Conserv. 191, 716–727. doi: 10.1016/j.biocon.2015.08.023
Fernandes, L., Day, J. O. N., Lewis, A., Slegers, S., Kerrigan, B., Breen, D. A. N., et al. (2005). Establishing representative no−take areas in the Great Barrier Reef: large−scale implementation of theory on marine protected areas. Conserv. Biol. 19, 1733–1744. doi: 10.1111/j.1523-1739.2005.00302.x
Giakoumi, S., Grantham, H. S., Kokkoris, G. D., and Possingham, H. P. (2011). Designing a network of marine reserves in the Mediterranean Sea with limited socio-economic data. Biol. Conserv. 144, 753–763. doi: 10.1016/j.biocon.2010.11.006
Giakoumi, S., Sini, M., Gerovasileiou, V., Mazor, T., Beher, J., Possingham, H. P., et al. (2013). Ecoregion-based conservation planning in the Mediterranean: dealing with large-scale heterogeneity. PLoS ONE 8:e76449. doi: 10.1371/journal.pone.0076449
Gleason, M., Fox, E., Ashcraft, S., Vasques, J., Whiteman, E., Serpa, P., et al. (2013). Designing a network of marine protected areas in California: achievements, costs, lessons learned, and challenges ahead. Ocean Coast. Manag. 74, 90–101. doi: 10.1016/j.ocecoaman.2012.08.013
Gleason, M., McCreary, S., Miller-Henson, M., Ugoretz, J., Fox, E., Merrifield, M., et al. (2010). Science-based and stakeholder-driven marine protected area network planning: a successful case study from north central California. Ocean Coast. Manag. 53, 52–68. doi: 10.1016/j.ocecoaman.2009.12.001
Guerreiro, J., Chircop, A., Grilo, C., Viras, A., Ribeiro, R., and van der Elst, R. (2010). Establishing a transboundary network of marine protected areas: diplomatic and management options for the east African context. Mar. Policy 34, 896–910. doi: 10.1016/j.marpol.2010.01.014
Halpern, B. S., Kappel, C. V., Selkoe, K. A., Micheli, F., Ebert, C. M., Kontgis, C., et al. (2009). Mapping cumulative human impacts to California Current marine ecosystems. Conserv. Lett. 2, 138–148. doi: 10.1111/j.1755-263X.2009.00058.x
Halpern, B. S., Lester, S. E., and McLeod, K. L. (2010). Placing marine protected areas onto the ecosystem-based management seascape. Proc. Natl. Acad. Sci. U.S.A. 107, 18312–18317. doi: 10.1073/pnas.0908503107
Halpern, B. S., Walbridge, S., Selkoe, K. A., Kappel, C. V., Micheli, F., D'Agrosa, C., et al. (2008). A global map of human impact on marine ecosystems. Science 319, 948–952. doi: 10.1126/science.1149345
Hopkins, C. R., Bailey, D. M., and Potts, T. (2016). Scotland's Marine Protected Area network: reviewing progress towards achieving commitments for marine conservation. Mar. Policy 71, 44–53. doi: 10.1016/j.marpol.2016.05.015
IUCN World Commission on Protected Areas, IUCN-WCP. (2008). Establishing Marine Protected Area Networks Making It Happen. Washington, DC: IUCN-WCPA; National Oceanic and Atmospheric Administration; The Nature Conservancy. 118.
IOC, IHO, and BODC. (2003). Centenary Edition of the GEBCO Digital Atlas, CD-ROM. Liverpool: British Oceanographic Data Centre.
Jessen, S., Morgan, L., and Bezaury-Creel, J. (2016). Dare to be Deep: SeaStates Report on North American's Marine Protected Areas (MPAs). Canadian Parks and Wilderness Society; Marine Conservation Institute, Ottawa; Seattle; México.
Katsanevakis, S., Stelzenmüller, V., South, A., Sørensen, T. K., Jones, P. J., Kerr, S., et al. (2011). Ecosystem-based marine spatial management: review of concepts, policies, tools, and critical issues. Ocean Coast. Manage. 54, 807–820. doi: 10.1016/j.ocecoaman.2011.09.002
Kirlin, J., Caldwell, M., Gleason, M., Weber, M., Ugoretz, J., Fox, E., et al. (2013). California's Marine Life Protection Act Initiative: supporting implementation of legislation establishing a statewide network of marine protected areas. Ocean Coast. Manage. 74, 3–13. doi: 10.1016/j.ocecoaman.2012.08.015
Klein, C. J., Chan, A., Kircher, L., Cundiff, A. J., Gardner, N., Hrovat, Y., et al. (2008a). Striking a balance between biodiversity conservation and socioeconomic viability in the design of marine protected areas. Conserv. Biol. 22, 691–700. doi: 10.1111/j.1523-1739.2008.00896.x
Klein, C. J., Steinback, C., Scholz, A. J., and Possingham, H. P. (2008b). Effectiveness of marine reserve networks in representing biodiversity and minimizing impact to fishermen: a comparison of two approaches used in California. Conserv. Lett. 1, 44–51. doi: 10.1111/j.1755-263X.2008.00005.x
Klein, C. J., Tulloch, V. J., Halpern, B. S., Selkoe, K. A., Watts, M. E., Steinback, C., et al. (2013). Tradeoffs in marine reserve design: habitat condition, representation, and socioeconomic costs. Conserv. Lett. 6, 324–332. doi: 10.1111/conl.12005
Lowry, G. K., White, A. T., and Christie, P. (2009). Scaling up to networks of marine protected areas in the Philippines: biophysical, legal, institutional, and social considerations. Coast. Manage. 37, 274–290. doi: 10.1080/08920750902851146
Lubchenco, J., Palumbi, S. R., Gaines, S. D., and Andelman, S. (2003). Plugging a hole in the ocean: the emerging science of marine reserves. Ecol. Appl. 13, S3–S7. doi: 10.1890/1051-0761(2003)013[0003:PAHITO]2.0.CO;2
Mackelworth, P. (2012). Peace parks and transboundary initiatives: implications for marine conservation and spatial planning. Conserv. Lett. 5, 90–98. doi: 10.1111/j.1755-263X.2012.00223.x
Margules, C. R., and Pressey, R. L. (2000). Systematic conservation planning. Nature 405, 243–253. doi: 10.1038/35012251
Mazor, T., Giakoumi, S., Kark, S., and Possingham, H. P. (2014). Large−scale conservation planning in a multinational marine environment: cost matters. Ecol. Appl. 24, 1115–1130. doi: 10.1890/13-1249.1
Mazor, T., Possingham, H. P., and Kark, S. (2013). Collaboration among countries in marine conservation can achieve substantial efficiencies. Divers. Distrib. 19, 1380–1393. doi: 10.1111/ddi.12095
McCallum, J. W., Vasilijeviæ, M., and Cuthill, I. (2015). Assessing the benefits of Transboundary Protected Areas: a questionnaire survey in the Americas and the Caribbean. J. Environ. Manage. 149, 245–252. doi: 10.1016/j.jenvman.2014.10.013
Micheli, F., Halpern, B. S., Walbridge, S., Ciriaco, S., Ferretti, F., Fraschetti, S., et al. (2013). Cumulative human impacts on Mediterranean and Black Sea marine ecosystems: assessing current pressures and opportunities. PLoS ONE 8:e79889. doi: 10.1371/journal.pone.0079889
Micheli, F., Saenz-Arroyo, A., Greenley, A., Vazquez, L., Montes, J. A. E., Rossetto, M., et al. (2012). Evidence that marine reserves enhance resilience to climatic impacts. PLoS ONE 7:e40832. doi: 10.1371/journal.pone.0040832
Moilanen, A., Wilson, K. A., and Possingham, H. (2009). Spatial Conservation Prioritization: Quantitative mEthods and Computational Tools. Oxford, UK: Oxford University Press.
Montaño-Moctezuma, G., Torres-Moye, G., Aguilar-Rosas, L., and Ramirez-Valdez, A. (2013). Estructura de la Comunidad de Peces, Macroinvertebrados y Macroalgas Asociada a los Bosques de Macrocystis pyrifera de la Región Ensenadense de Baja California. Información Base para una Propuesta de Monitoreo. Informe Final de Proyecto Financiado por Fondo Sectorial de Investigación Ambiental; SEMARNAT-INE-CONACYT. Rep. Tec. 46.
Naidoo, R., Balmford, A., Ferraro, P. J., Polasky, S., Ricketts, T. H., and Rouget, M. (2006). Integrating economic costs into conservation planning. Trends Ecol. Evol. 21, 681–687. doi: 10.1016/j.tree.2006.10.003
Possingham, H., Ball, I., and Andelman, S. (2000). “Mathematical methods for identifying representative reserve networks,” in Quantitative Methods for Conservation Biology (New York, NY: Springer), 291–306.
Possingham, H. P., Bode, M., and Klein, C. J. (2015). Optimal conservation outcomes require both restoration and protection. PLoS Biol. 13:e1002052. doi: 10.1371/journal.pbio.1002052
Roberts, C. M., Halpern, B., Palumbi, S. R., and Warner, R. R. (2001). Designing marine reserve networks why small, isolated protected areas are not enough. Conserv. Pract. 2, 10–17. doi: 10.1111/j.1526-4629.2001.tb00012.x
Rosen, F., and Olsson, P. (2013). Institutional entrepreneurs, global networks, and the emergence of international institutions for ecosystem-based management: the Coral Triangle Initiative. Mar. Policy 38, 195–204. doi: 10.1016/j.marpol.2012.05.036
Saarman, E., Gleason, M., Ugoretz, J., Airamé, S., Carr, M., Fox, E., et al. (2013). The role of science in supporting marine protected area network planning and design in California. Ocean Coast. Manag. 74, 45–56. doi: 10.1016/j.ocecoaman.2012.08.021
Sandwith, T., and Besançon, C. (2005). “Trade-offs among multiple goals for transboundary conservation,” in Draft Paper Presented at Environmental Change and Security Program Symposium: Parks for Peace or Peace for Parks (Cape Town).
Secretariat of the Convention on Biological Diversity (2014). Global Biodiversity Outlook 4. Montréal,QB, 155.
Selkoe, K. A., Halpern, B. S., Ebert, C. M., Franklin, E. C., Selig, E. R., Casey, K. S., et al. (2009). A map of human impacts to a “pristine” coral reef ecosystem, the Papahânaumokuâkea Marine National Monument. Coral Reefs 28, 635–650. doi: 10.1007/s00338-009-0490-z
Sosa-Nishizaki, O., Guerrero-Ávila, C., García-Rodríguez, E., Rodríguez-Medrano, M. C., Saldaña-Ruíz, L. E., Mejía-Mercado, B. E., et al. (2013). Caracterización de la Pesca Deportiva en Baja California. Centro de Investigación Científica y Educación Superior de Ensenada, Rep. Tec, 56.
Spalding, M., and Hale, L. Z. (2016). “Marine protected areas: past, present and future–a global perspective,” in Big, Bold and Blue: Lessons from Australia's Marine Protected Areas, eds J. Fitzsimons and G. Wescott (Melbourne, VIC: CSIRO Publishing), 2.
Stewart, R. R., and Possingham, H. P. (2005). Efficiency, costs and trade-offs in marine reserve system design. Environ. Model. Assess. 10, 203–213. doi: 10.1007/s10666-005-9001-y
Torres Moye, G. (2012). Mainland and Island Kelp Forests in Northern Baja California, Mexico: Subtidal Community Structure, Dynamics, and Connectivity for the Design of Marine Protected Areas. PhD dissertation, University of California, Davis, CA.
Torres-Moye, G., Edwards, M. S., and Montaño-Moctezuma, C. G. (2013). Benthic community structure in kelp forests from the Southern California Bight. Cienc. Mar. 39, 239–252. doi: 10.7773/cm.v39i3.2250
Torres-Moye, G., and Escofet, A. (2014). Land-Sea Interactions in Punta China (Baja California, México): addressing Anthropic and Natural Disturbances in a Retrospective Context. J. Environ. Prot. 5, 1520–1530. doi: 10.4236/jep.2014.516144
UNEP-WCMC (2008). National and Regional Networks of Marine Protected Areas: A Review of Progress. UNEP-WCMC, Cambridge.
Ward, T. J., Vanderklift, M. A., Nicholls, A. O., and Kenchington, R. A. (1999). Selecting marine reserves using habitats and species assemblages as surrogates for biological diversity. Ecol. Appl. 9, 691–698. doi: 10.1890/1051-0761(1999)009[0691:SMRUHA]2.0.CO;2
Wilkinson, T., Agardy, T., Perry, S., Rojas, L., Hyrenbach, D., Morgan, K., et al. (2004). “Marine species of common conservation concern: protecting species at risk across international boundaries,” in Proceedings of the Fifth International SAMPAA (Science and Management of Protected Areas) Conference. British Columbia, Vic.
Keywords: marine spatial planning, marine protected areas, eco-regional conservation, transboundary networks, data-poor areas, multiple considerations, habitat mapping, Marxan
Citation: Arafeh-Dalmau N, Torres-Moye G, Seingier G, Montaño-Moctezuma G and Micheli F (2017) Marine Spatial Planning in a Transboundary Context: Linking Baja California with California's Network of Marine Protected Areas. Front. Mar. Sci. 4:150. doi: 10.3389/fmars.2017.00150
Received: 10 February 2017; Accepted: 03 May 2017;
Published: 19 May 2017.
Edited by:
John A. Cigliano, Cedar Crest College, United StatesReviewed by:
Patricia Briones-Fourzan, National Autonomous University of Mexico, MexicoMark H. Carr, University of California, Santa Cruz, United States
Copyright © 2017 Arafeh-Dalmau, Torres-Moye, Seingier, Montaño-Moctezuma and Micheli. This is an open-access article distributed under the terms of the Creative Commons Attribution License (CC BY). The use, distribution or reproduction in other forums is permitted, provided the original author(s) or licensor are credited and that the original publication in this journal is cited, in accordance with accepted academic practice. No use, distribution or reproduction is permitted which does not comply with these terms.
*Correspondence: Georges Seingier, georges@uabc.edu.mx