Ensemble magnetic behavior of interacting CoFe nanoparticles
 Rowan C. Temple
 Andrei P. Mihai
 Dario A. Arena
 Christopher H. Marrows
- 1School of Physics and Astronomy, University of Leeds, Leeds, UK
- 2Photon Sciences, National Synchrotron Light Source, Brookhaven National Laboratory, Upton, NY, USA
Ferromagnetic nanoparticles in the 10–14 nm size range are examined for their size and interaction dependent magnetic properties. From X-ray magnetic circular dichroism the orbital-to-spin magnetic moment ratio is determined and found to decrease significantly with particle size. This is in accordance with previous complementary studies on smaller particles and highlights the difficulty of fitting to a simple core-shell model. Vibrating sample magnetometry experiments on samples with more than 1000 particles per square micron show a wide distribution of blocking temperatures from 50 to greater than 650 K. This is attributed to the dipole-dipole magnetic coupling forces between particles. The blocking temperatures show an unexpected negative correlation with increasing particle density.
1. Introduction
Almost uniquely, micro and nanoscale magnetic particles have held cross-disciplinary interest for leading physicists, chemists and biologists alike for more than half a century [1–3]. Today in physics new phenomena and applications continue to emerge; recent investigations have uncovered meta-stable ferromagnetic states measured in individual nanoparticles [4], surface mediated particle interactions and anisotropy [5–7], interactions in arrays of patterned nanoislands known as artificial spin ice [8–10] and applications related to hyperthermia-based medical treatments [11]. There remain many fascinating questions to be answered, particularly regarding particle ensembles with interaction forces present. Here we present an X-ray magnetic circular dichroism (XMCD) and vibrating sample magnetometry (VSM) study of densely packed pure Co30Fe70 nanoparticles grown by in situ gas-aggregation technique.
Several studies in recent years have considered the enhanced orbital moment predicted [12, 13] and observed [14, 15] in sub 12 nm diameter single domain particles. The enhancement of the orbital moment is highly size dependent and clearly marks the territory between magnetic atoms obeying Hund's rules, and bulk-like ferromagnetism with highly quenched orbital magnetism. For magnetic nanoparticles the orbital moment is expected to be enhanced at the surface atoms due to reduced coordination number. This compresses the d-band, enhancing spin (ms) and therefore orbital (ml) moment through the spin-orbit (SO) coupling mechanism. The small size can also lead to quantum size effects which increase SO mixing, increasing ml even when ms is saturated [16, 17]. XMCD is an element specific technique that allows the contribution of ml and ms to the total moment to be elucidated. We will consider the mechanism for enhanced orbital moments in light of the data presented in this paper.
An important industrial application of ferromagnetic nanoparticles is in permanent data storage, this has recently reached a new level with next generation designs based on nanoscale bit patterned media [18]. To realize and optimize storage media a highly detailed understanding of the particle anisotropies and interactions is vitally important. In the second part of this paper we use a superconducting quantum interference device (SQUID) VSM to investigate the anisotropies and interactions of densely packed nanoparticles. We find large in-plane anisotropies due to the dipole-dipole coupling forces between particles and a surprising negative correlation between anisotropy and particle density.
2. Particle Growth and Characterization
Co30Fe70 nanoparticles were pre-formed in vacuum using an Oxford Applied Research gas-aggregation cluster source. This instrument uses a specially modified magnetron sputtering source to super-saturate metallic vapor in an inert gas atmosphere, pre-forming particles in a 5–15nm diameter size range [15]. This source is fully integrated into a multi-target high vacuum sputtering system, allowing great flexibility of multilayer growth before and after nanoparticle deposition. The particles are deposited at energies well below 0.1 eV/atom, and are not deformed on impact with the substrate [19]. The particle size distribution is modified by the growth conditions and throw distance; further, many of these particles are charged and these have been passed through a quadrupole mass filter to refine the selection. Atomic force microscopy (AFM) calibrations show the particle diameter distribution has a FWHM of 6 nm. In this study particles are deposited onto polycrystalline sputtered MgO and capped with a 4 nm film of Al to prevent oxidation during sample transfer (Al is chosen as a material with a long electron escape depth for XMCD purposes). The samples are grown on commercially produced thermally-oxidized Si wafers.
X-ray spectroscopy was carried out on the U4B line at the NSLS VUV synchrotron source in Brookhaven National Laboratory. The samples were mounted at normal incidence to the beam and measured in total electron yield (TEY) mode through a drain current contact painted onto the sample edge. For XMCD measurements the beam was set at 70% polarized and XAS scans were taken with the nanoparticles magnetically saturated parallel and anti-parallel to the beam, at each monochromator setting, using an applied ±0.5 T field. Magnetometry measurements, on the same sample set, were carried out in Leeds on a Quantum Design SQUID-VSM.
For the precise size determination of the particles it was necessary to check each sample, ex situ, using atomic force microscopy. An example micrograph is shown in Figure 1A. Due to the capping layer the particle diameters are significantly overestimated by simple conversion from measured area, moreover the crowded particles widened the relative size distribution. The average particle size from sample to sample is retained however, and the mean size can be scaled to uncapped particles grown in the same conditions. The relative mean particle diameters between samples are therefore accurate to ±0.1 nm but there maybe an overall systematic error of ±1 nm. More information on the AFM analysis is included in the Supplementary Material. Transmission electron microscopy on similar particles shows them to form the expected bcc crystalline structure with the appropriate lattice parameter. This is shown in Figure 1B. The particles form polyhedra governed by the Wulff construction rules [20], with 〈110〉 and 〈100〉 faces energetically favored. Greater than 90% are found to rest with a 〈100〉 face parallel to the substrate, as shown in the example image inset in Figure 1B.
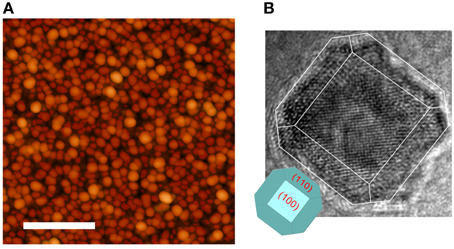
Figure 1. (A) AFM micrograph of crowded nanoparticles, the scale bar represents 400 nm. (B) TEM image of a single 10 nm diameter particle and inset a model drawing of the appropriate Wulff reconstruction.
3. Size Dependence of Orbital Moments
To test the predictions of enhanced orbital moments in large nanoparticles, six samples with various average particle diameters D were deposited as described in the previous section, and measured with XMCD spectroscopy. A typical spectrum (D = 10.4 nm sample) is shown in Figure 2, the total electron yield (TEY) signal has been normalized to the post-edge background. The L3 and L2 peaks are clear and without detectable secondary peaks for all samples, within the resolution of the instrument the nanoparticles have not oxidized either from the atmosphere or the oxide layer below.
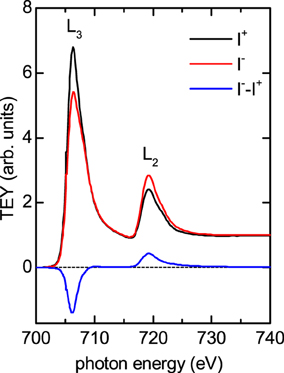
Figure 2. Showing a sample intensity and difference XMCD spectrum at the Fe edge. The large MCD signal from the densely packed clusters enables an accurate determination of the ml/ms ratio. The data has been normalized to the post-edge signal.
To translate the TEY absorption spectra into spin and orbital moments, the sum rules, as developed by Thole et al. [21] and Carra et al. [22], must be applied to the integrated L3 and L2 peak intensities. Due to the non-linear electromagnetic absorption profile and the short electron escape depth (λe = 1.7 nm in Fe [23]), asymmetric saturation effects on the two peaks are known to distort the signal and should be corrected for Nakajima et al. [23]. Saturation affects the orbital moment most strongly since this depends on the difference of the L3 and L2 integrated peak intensities, it acts to reduce the measured orbital moment. In a continuous film the correction is a relatively straight forward process, for nanoparticles the more complex geometry makes the correction more difficult and less accurate [24–27]. Not only does the saturation effect change with size, but the precise radial profile of magnetic moments within the particle governs the average moment determined and has the opposite trend to the saturation. We use a correction factor for rls of 1.15 in this study, a balance between the competing size effects [25]. The fairly small size range studied means that any errors in this will be primarily systematic.
The ratio of orbital moment ml to spin moment ms is the most robust measurement that can be taken from an XMCD spectrum, since this does not depend on details of the background correction or material band structure (here the dipole contribution mT to the spin moment is neglected, this has been measured to account for < 5% of similar structures [28]). The saturation corrected ratio rls = ml/ms has been plotted in Figure 3A for all six samples as a function of size. The error in the diameter is calculated as the standard error in the mean for the measured distribution. Although the data is somewhat scattered—probably due to the particular arrangements of particles for different size distributions—there is a negative correlation between rls and size (Pearson's r coefficient = −0.71), this tails off for the largest samples close to the bulk value for Fe [16, 31]. The ms values are known [26, 28] to be close to bulk and to vary little over this size range, therefore we attribute the drop in rls to a reduction in ml.
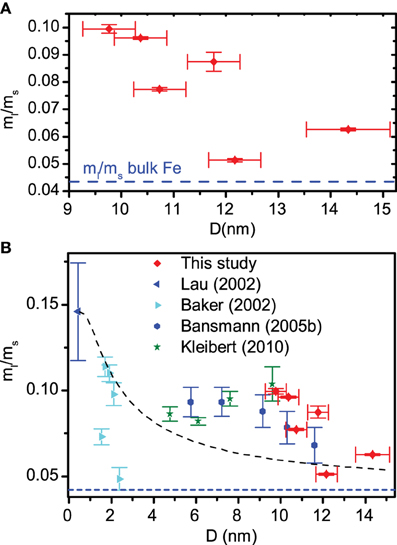
Figure 3. (A) ml/ms ratio plotted against scaled mean particle diameter as found by AFM. The bulk Fe ml/ms ratio is shown as a blue dashed line. In (B) the results of our study are combined with data from previous studies [25, 28–30]. The black dashed line is a fit using the model described in the text.
Figure 3B shows our data in the context of various other studies on supported nanoparticles. Our data extends this size range to larger particles than have been looked at before. The obvious model to fit to these data is a core-shell type structure whereby a central core of atoms have bulk-like moments (rbulkls), and a thin shell (width d) of surface atoms, with reduced coordination numbers, experience enhanced orbital moments (rsurfls). This leads to:
where D is the particle diameter (the result is the same if the particles are modeled as cubes rather than spheres). The black dashed line in Figure 3B shows a fit using Equation (1) to the data, rbulkls is fixed at 0.044 [31]. Only the outermost layer of atoms are expected to have a reduced coordination so d is fixed at an atomic width of 0.3 nm. The model is clearly flawed. For small particles the sharp decrease in surface enhancement is reasonably well predicted, for larger particles there should be very little enhancement. Moreover our data shows a very steep decrease in orbital moment; changes, if they do occur in this size range, would be expected to be quite gradual for a large range of d and rsurfls values. To fit the data correctly d would have to be in the region of 8 nm, clearly unphysical in this model. A further feature not predicted by the droplet model is the broad asymmetric peak structure in the rls data seen between 2 and 14 nm, peaking at around 8 nm. Changes on this broad scale could potentially be due to changes in the shape of the particles with size.
Edmonds et al. [14] have found that for small particles the orbital moment can be reduced if the particles are more densely packed. Here however, we find no correlation between the particle density and rls. Likewise aberrations due to crystallographic strain have previously been cited as reasons for unusual orbital moments [26, 27], in these samples on polycrystalline MgO this is not likely to be an issue.
In summary we have seen a rapid change in orbital moment at a critical size range of 10–14 nm, decreasing to close to the bulk value for the larger particles. This does not fit to a simple droplet model, a more sophisticated theoretical approach is required. The precise changes in 3d band structure for reduced coordinate atoms at this size will be critical to determine this transition. Further experiments on temperature dependent moments at this size range could also prove interesting in terms of examining degeneracies in the energy spectrum at this size.
4. Magnetometry of Interacting Nanoparticles
The same set of samples all subsequently underwent SQUID-VSM studies. This is a very sensitive technique, able to detect the magnetic moment from a few nanoparticles per square micron. Information on the anisotropy and particle size distribution can be obtained through temperature dependent studies of the magnetization.
Figure 4A presents hysteresis loops in-plane (IP) and out-of-plane (OOP) for a sample at room temperature (the loop shapes were repeated for all measured samples). The hard axis is OOP, though shows a small hysteresis, probably due to a few separated or misoriented particles. The easy axis is IP and all IP directions are found to be equivalent. The particles are polyhedra in shape and not distorted on impact, they are not expected to display significant shape anisotropy. Magnetocrystalline anisotropy in bcc Fe is along the 〈100〉 axes, therefore would be expected to orient approximately one third of the particle moments OOP (due to the aformentioned particle 〈100〉 deposition preference); this does not accord with the OOP hard axis observation. In fact, as we shall see later, the dipole-dipole magnetic interaction energy between particles has a far larger energy contribution than the magnetocrystalline term. In two dimensional arrays of magnetic nanoparticles the dipole interaction is known to preferentially align moments parallel to the plane of the distribution. This explains the rotational magnetic isotropy within the plane [32].
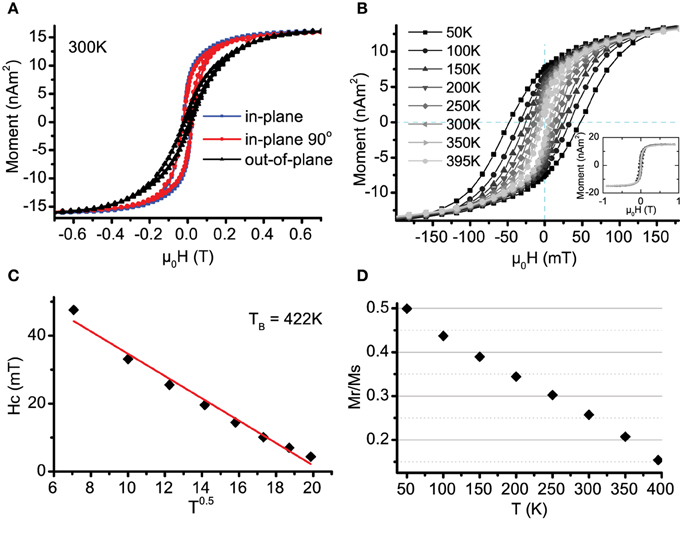
Figure 4. (A) Hysteresis loops for nanoparticles taken at 300 K. Applied field is in three perpendicular directions as indicated. The easy axes are randomly oriented in-plane. (B) Magnetic hysteresis data for representative sample for temperatures ranging from 50–395 K, the inset shows the complete loops, saturating fully at 0.9 T. (C) Derived Hc plotted against T1/2. The linear fit gives a blocking temperature TB of 420 K. (D) Mr/Ms plotted against temperature. This predicts a blocking temperature of 450 K.
To investigate the anisotropy further, temperature (T) dependent (in-plane) magnetization loops were measured on samples from 10 to 400 K, these are plotted in Figure 4B for a representative sample (with particle density 1600 μm−2). Using a simple model of non-interacting uniform particles, the coercive field Hc is expected to follow a T0.5 relationship [1]:
where TB is the particle blocking temperature, above which the particle is in the superparamagnetic state. The extracted coercivities are fitted using Equation (2) in Figure 4C. Using this method, sample blocking temperatures in the range TB = 320–500 K are derived.
This is a surprising result, the blocking temperature TB is expected to be much lower than room temperature. Using a crude estimate of TB ≈ KV/25kB (V the particle volume) with bulk magnetocrystalline anisotropy for bcc Fe of K = 3.3 μeV/atom [33], gives TB ≈ 120 K for a 12 nm diameter particle. Previous experiments on similar particles [15, 34] have given blocking temperatures in the range 50–150 K.
The simple model assumptions could mean that the blocking temperature has been badly estimated, however looking at the remanent moment data plotted in Figure 4D, it clearly does not show that the loops have fully closed. Extrapolating the trend down to a closed loop with Mr = 0 gives a blocking temperature of ≈450 K, this is close to the estimates found from the coercive fields.
Zero field cooled—field cooled (ZFC-FC) measurements were made in the same temperature range using a standard protocol [35]. The results for the 1600 particles μm−2 sample are shown in Figure 5. In the ZFC, as the sample warms, particles unblock and a small 10 mT field orients them, giving an increasing average magnetic signal. The sample is then field cooled (red) and warmed again in zero field, generating the green field warming (FW) curve. From the ZFC-FC loops it is obvious to see that the sample is not fully in the superparamagnetic state at 400 K, there is not the Curie 1/T drop in magnetization. This was true of all of the measured samples.
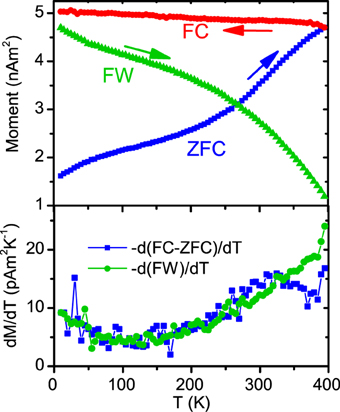
Figure 5. Top panel: ZFC-FC measurements shown for representative sample, plus field warming (FW) plotted in green (see text for details of protocol). Bottom panel: the temperature derivative of the FW and ZFC-FC as indicated, this shows a wide distribution of the particle blocking temperatures.
The differential of FC-ZFC and FW is plotted in the lower panel. At each temperature the moment drops by an amount proportional to the number of particles that transition to the SP state at that temperature, therefore −d(FW)/dT should be proportional to the number of particles with TB = T. By similar arguments −d(FC−ZFC)/dT is a similar measure, proportional to the distribution of blocking temperatures [36]. Assuming a roughly symmetric distribution shape we are evidently a small fraction of the way to unblocking all of the particles. There is obviously a very broad range of blocking temperatures present within the sample that extends well beyond 400 K. Two of the samples were measured up to 700 K and found to remain partially ferromagnetic. Again this broad distribution is surprising. The particle volumes range from roughly 1000–2700 nm3, so if bulk magnetocrystalline anisotropy is dominant then we might expect the largest blocking temperature to be a factor of ≈ 2.7 greater than the smallest. Assuming a symmetric distribution of moments our gradient data suggests a mean blocking temperature range of at least a factor 4. The anisotropy energies calculated range from <1 μeV/atom to more than 10 μeV/atom.
The answer may lie in the magnetic interactions between particles. Figure 6A plots the areal cluster density vs. the average blocking temperature extracted from the Hc vs. T fits. While there was no correlation between TB and average particle size (as found in some previous work [37]), here we see a weak negative correlation between TB and the density of particles on the sample (Pearson's r coefficient = –0.80). Plotting Mr/Ms at 395 K as a function of cluster density also yields a negative correlation, again indicating the particle anisotropy is related to the density of particles on the sample. Cluster density in these cases is determined by using the total magnetic moment of the sample divided by its area and dividing that by the calculated magnetic moment of a 12 nm particle (assuming a bulk moment of 2.4μB per atom [38]).
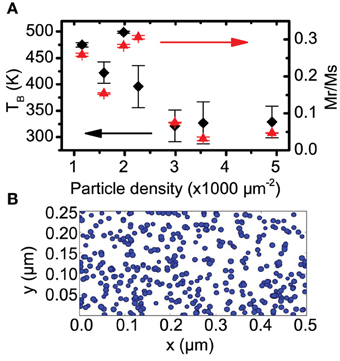
Figure 6. (A) Nanoparticle areal density plotted vs. TB (left) and Mr/Ms ratio at 395 K (right). Both are a measure of the effective anisotropy of the sample and show a negative correlation with particle density. (B) A simulated random deposition of particles onto a surface at a density of 3000 μm−2, the clusters are not quite at percolation.
Figure 6B shows a simulation of 12 nm particles randomly dispersed over a surface at a density of 3000 μm−2. The probability distribution of the nearest neighbor radius r for a given particle, follows Poisson's distribution as [39]
where NA is the areal particle density. At this density the sample is not quite at percolation, but approximately 75% of the particles are touching at least one neighbor.
Long range magnetic dipole interaction forces between particles are likely to be significant due to these close contacts. Naively one would guess that the dipole interactions would create a glass-like structure, with randomly oriented moments fixed in place by the dipole fields from the nearest neighbors. The mutual magnetic dipole potential energy between two particles is proportional to μ0m2clust/r3 where mclust is the total particle magnetic moment and r is the center-to-center distance. This energy equates to a temperature of between 300–3000 K for adjacent 12 nm particles (the high sensitivity of the calculation to r and mclust gives a high variation in the approximate calculation). This energy scale is much greater than the magnetocrystalline anisotropy energy scale at ~120 K but fits with the 300–500 K blocking temperatures derived from our Hc vs. T data. This effect has been seen in high density samples before by Fauth et al. [27], in this case the particles were deposited on a Cu(111) surface. In that work, the broad anisotropy range was attributed both to agglomerated interacting particles and substrate mediated interactions. In our case with an insulating substrate we rule out this latter effect. Ebbing et al. [40] also see blocking temperatures enhanced by a factor fivefold, in their case due to induced magnetization of a Pt cap. In our samples with an Al cap of low spin-orbit coupling this is unlikely to be the case. We therefore attribute dipole-dipole interaction forces to the origin of the large mean and standard deviation of blocking temperatures observed.
This interaction picture fits the large blocking temperatures but does not however agree with the relative densities between samples. These were seen to be negatively correlated with the blocking temperatures. This is an interesting effect and difficult to explain, it requires further investigation. The complex network of interactions could be highly dependent on the particle density and size distribution.
5. Conclusions
We have studied the magnetic properties of densely packed Co30Fe70 nanoparticles. XMCD spectroscopy combined with AFM size determination reveal the Fe orbital to spin moment ratio ml/ms decreases rapidly with increasing particle size. This is an established phenomenon but has not been carried out with such large particles before. These larger particles bring clarity to the inconsistency of recent data with a simple core-shell type model. This could be attributed to problems with the current theory for large radius particles, or could be caused by size dependent strain effects.
While the particles are not exchange coupled (since the orbital moments would be quenched), magnetometry studies indicate that they are interacting through the magnetic dipole fields. The sensitivity of the dipole-dipole interaction to the moment and nearest neighbor distance gives extremely wide distributions of effective particle anisotropies, and therefore blocking temperatures. From a physics perspective, interactions between particles is a very interesting effect that yields unpredictable results. Contrary to expectations, we find the average blocking temperatures to be negatively correlated with the particle density.
Conflict of Interest Statement
The authors declare that the research was conducted in the absence of any commercial or financial relationships that could be construed as a potential conflict of interest.
Acknowledgments
The authors acknowledge financial support from the EPSRC Doctoral Training Grant. Use of the National Synchrotron Light Source, Brookhaven National Laboratory, was supported by the US Department of Energy, Office of Science, Office of Basic Energy Sciences, under Contract No. DE-AC02-98CH10886. The authors would like to thank Dr. Mike Ward for assistance with the transmission electron microsope experiments.
Supplementary Material
The Supplementary Material for this article can be found online at: https://www.frontiersin.org/article/10.3389/fphy.2015.00052
References
2. vd Giessen A. Magnetic properties of ultra-fine iron (III) oxide-hydrate particles prepared from iron (III) oxide-hydrate gels. J Phys Chem Solids (1967) 28:343–6. doi: 10.1016/0022-3697(67)90130-8
3. Crick FHC, Hughes AFW. The phyiscal properties of cytoplasm. Exp Cell Res. (1950) 1:37–80. doi: 10.1016/0014-4827(50)90048-6
4. Balan A, Derlet PM, Rodríguez AF, Bansmann J, Yanes R, Nowak U, et al. Direct observation of magnetic metastability in individual iron nanoparticles. Phys Rev Lett. (2014) 112:107201. doi: 10.1103/PhysRevLett.112.107201
5. Fraile Rodríguez A, Kleibert A, Bansmann J, Voitkans A, Heyderman LJ, Nolting F. Size-dependent spin structures in iron nanoparticles. Phys Rev Lett. (2010) 104:127201. doi: 10.1103/PhysRevLett.104.127201
6. Pierce J, Torija M, Gai Z, Shi J, Schulthess T, Farnan G, et al. Ferromagnetic tability in Fe nanodot assemblies on Cu(111) induced by indirect coupling through the substrate. Phys Rev Lett. (2004) 92:237201. doi: 10.1103/PhysRevLett.92.237201
7. Ignatiev P, Negulyaev N, Smirnov A, Niebergall L, Saletsky A, Stepanyuk V. Magnetic ordering of nanocluster ensembles promoted by electronic substrate-mediated interaction: ab initio and kinetic Monte Carlo studies. Phys Rev B (2009) 80:165408. doi: 10.1103/PhysRevB.80.165408
8. Mengotti E, Heyderman LJ, Rodríguez AF, Nolting F, Hügli RV, Braun HB. Real-space observation of emergent magnetic monopoles and associated Dirac strings in artificial kagome spin ice. Nat Phys. (2010) 7:68–74. doi: 10.1038/nphys1794
9. Morgan JP, Stein A, Langridge S, Marrows CH. Thermal ground-state ordering and elementary excitations in artificial magnetic square ice. Nat Phys. (2010) 7:75–9. doi: 10.1038/nphys1853
10. Kapaklis V, Arnalds UB, Farhan A, Chopdekar RV, Balan A, Scholl A, et al. Thermal fluctuations in artificial spin ice. Nat Nanotechnol. (2014) 9:514–9. doi: 10.1038/nnano.2014.104
11. Lee JH, Jang JT, Choi JS, Moon SH, Noh SH, Kim JW, et al. Exchange-coupled magnetic nanoparticles for efficient heat induction. Nat Nanotechnol. (2011) 6:418–22. doi: 10.1038/nnano.2011.95
12. Nonas B, Cabria I, Zeller R, Dederichs P, Huhne T, Ebert H. Strongly enhanced orbital moments and anisotropies of adatoms on the Ag(001) surface. Phys Rev Lett. (2001) 86:2146–9. doi: 10.1103/PhysRevLett.86.2146
13. Cabria I, Nonas B, Zeller R, Dederichs P. Orbital magnetism of transition-metal adatoms and clusters on the Ag and Au(001) surfaces. Phys Rev B (2002) 65:054414. doi: 10.1103/PhysRevB.65.054414
14. Edmonds K, Binns C, Baker S, Thornton S, Norris C, Goedkoop J, et al. Doubling of the orbital magnetic moment in nanoscale Fe clusters. Phys Rev B (1999) 60:472–6. doi: 10.1103/PhysRevB.60.472
15. Binns C, Maher M, Pankhurst Q, Kechrakos D, Trohidou K. Magnetic behavior of nanostructured films assembled from preformed Fe clusters embedded in Ag. Phys Rev B (2002) 66:184413. doi: 10.1103/PhysRevB.66.184413
16. Ebert H, Battocletti M. Spin and orbital polarized relativistic multiple scattering theory-With applications to Fe, Co, Ni and FexCo1-x. Solid State Commun. (1996) 98:785–9. doi: 10.1016/0038-1098(96)00202-5
17. Guirado-López R, Dorantes-Dávila J, Pastor G. Orbital magnetism in transition-metal clusters: from hus rules to bulk quenching. Phys Rev Lett. (2003) 90:226402. doi: 10.1103/PhysRevLett.90.226402
18. Piramanayagam S, Chong T. Patterned Magnetic Recording Media: Progress and Prospects, 1st Edn. Hoboken, NJ: Wiley-IEEE Press (2012).
19. Haberland H, Insepov Z, Moseler M. Molecular-dynamics simulation of thin-film growth by energetic cluster impact. Phys Rev B (1995) 51:61–7. doi: 10.1103/PhysRevB.51.11061
20. Vystavel T, Palasantzas G, Koch SA, De Hosson JTM. Nanosized iron clusters investigated with in situ transmission electron microscopy. Appl Phys Lett. (2003) 82:197. doi: 10.1063/1.1536716
21. Thole B, Carra P, Sette F, Laan GVD. X-ray circular dichroism as a probe of orbital magnetization. Phys Rev Lett. (1992) 68:1943–6. doi: 10.1103/PhysRevLett.68.1943
22. Carra P, Thole B, Altarelli M, Wang X. X-ray circular dichroism and local magnetic fields. Phys Rev Lett. (1993) 70:694–7. doi: 10.1103/PhysRevLett.70.694
23. Nakajima R, Stöhr J, Idzerda YU. Electron-yield saturation effects in L -edge x-ray magnetic circular dichroism spectra of Fe, Co, and Ni. Phys Rev B (1999) 59:6421–9. doi: 10.1103/PhysRevB.59.6421
24. Fauth K. How well does total electron yield measure x-ray absorption in nanoparticles? Appl Phys Lett. (2004) 85:3271. doi: 10.1063/1.1804600
25. Bansmann J, Baker S, Binns C, Blackman J, Bucher J, Dorantesdavila J, et al. Magnetic and structural properties of isolated and assembled clusters. Surf Sci Rep. (2005) 56:189–275. doi: 10.1016/j.surfrep.2004.10.001
26. Kleibert A, Meiwes-Broer KH, Bansmann J. Size-dependent magnetic spin and orbital moments of Fe nanoparticles deposited onto Co/W(110). Phys Rev B (2009) 79:125423. doi: 10.1103/PhysRevB.79.125423
27. Fauth K, Ballentine GE, Praetorius C, Kleibert A, Wilken N, Voitkans A, et al. Magnetic properties of Fe nanoclusters on Cu(111) studied with X-ray magnetic circular dichroism. Phys Status Solidi (2010) 247:1170–9. doi: 10.1002/pssb.200945607
28. Baker SH, Binns C, Edmonds KW, Maher MJ, Thornton SC, Louch S, et al. Enhancements in magnetic moments of exposed and Co-coated Fe nanoclusters as a function of cluster size. J Magn Magn Mater. (2002) 247:19–25. doi: 10.1016/S0304-8853(02)00090-2
29. Lau J, Föhlisch A, Martins M, Nietubyc R, Reif M, Wurth W. Spin and orbital magnetic moments of deposited small iron clusters studied by x-ray magnetic circular dichroism spectroscopy. New J Phys. (2002) 4:98.1–98.12. doi: 10.1088/1367-2630/4/1/398
30. Kleibert A, Rosellen W, Getzlaff M, Bansmann J. Structure, morphology, and magnetic properties of Fe nanoparticles deposited onto single-crystalline surfaces. Beilstein J Nanotechnol. (2011) 2:47–56. doi: 10.3762/bjnano.2.6
31. Chen C, Idzerda Y, Lin H, Smith N. Experimental confirmation of the X-ray magnetic circular dichroism sum rules for iron and cobalt. Phys Rev Lett. (1995) 75:152–5. doi: 10.1103/PhysRevLett.75.152
32. Vedmedenko EY. Competing Interactions and Pattern Formation in the Nanoworld. Weinheim: Wiley-VCH Verlag GmbH (2007).
33. Klein H, Kneller E. Variation of magnetocrystalline anisotropy of iron with field and temperature. Phys Rev. (1966) 144:372–4. doi: 10.1103/PhysRev.144.372
34. Kleibert A, Bulut F, Gebhardt RK, Rosellen W, Sudfeld D, Passig J, et al. Correlation of shape and magnetic anisotropy of supported mass-filtered Fe and FeCo alloy nanoparticles on W(110). J Phys Condens Matter. (2008) 20:445005. doi: 10.1088/0953-8984/20/44/445005
35. Bedanta S, Kleemann W. Supermagnetism. J Phys D Appl Phys. (2009) 42:013001. doi: 10.1088/0022-3727/42/1/013001
36. Rondinone A. Superparamagnetic relaxation and magnetic anisotropy energy distribution in CoFe2O4 spinel ferrite nanocrystallites. J Phys Chem B (1999) 103:6876–80. doi: 10.1021/jp9912307
37. Peng DL, Chen Y, She H, Katoh R, Sumiyama K. Preparation and magnetic characteristics of size-monodispersed FeCo alloy cluster assemblies. J Alloys Compd. (2009) 469:276–81. doi: 10.1016/j.jallcom.2008.01.087
38. Bhatia M. Magnetic moments in the Fe–Co system. Curr Sci. (2010) 99:785–90. Available online at: http://www.currentscience.ac.in/php/toc.php?vol=099&issue=06
39. Tewari A, Gokhale AM. Nearest-neighbor distributions in thin films, sheets, and plates. Acta Mater. (2006) 54:1957–63. doi: 10.1016/j.actamat.2005.12.017
Keywords: magnetic nanoparticle, XMCD, orbital moment, dipole interactions, superparamagnetism, long range order
Citation: Temple RC, Mihai AP, Arena DA and Marrows CH (2015) Ensemble magnetic behavior of interacting CoFe nanoparticles. Front. Phys. 3:52. doi: 10.3389/fphy.2015.00052
Received: 28 April 2015; Accepted: 10 July 2015;
Published: 23 July 2015.
Edited by:
Olga Kazakova, National Physical Laboratory, UKReviewed by:
Fengqi Song, Nanjing University, ChinaAgustina Asenjo, Consejo Superior de Investigaciones Cientificas, Instituto de Ciencia de Materiales de Madrid, Spain
Copyright © 2015 Temple, Mihai, Arena and Marrows. This is an open-access article distributed under the terms of the Creative Commons Attribution License (CC BY). The use, distribution or reproduction in other forums is permitted, provided the original author(s) or licensor are credited and that the original publication in this journal is cited, in accordance with accepted academic practice. No use, distribution or reproduction is permitted which does not comply with these terms.
*Correspondence: Rowan C. Temple, School of Physics and Astronomy, University of Leeds, E. C. Stoner Building, Leeds LS2 9JT, UK, r.c.temple@leeds.ac.uk