How global sensitive is the AquaCrop model to input parameters? A case study of silage maize yield on a regional scale
 Elahe Akbari1*
  Ali Darvishi Boloorani2
  Jochem Verrelst3 Stefano Pignatti4 Najmeh Neysani Samany2 Saeid Soufizadeh5 Saeid Hamzeh2
- 1Department of Remote Sensing and Geographic Information System (GIS), Faculty of Geography and Environmental Sciences, Hakim Sabzevari University, Sabzevar, Iran
- 2Department of Remote Sensing and Geographic Information System (GIS), Faculty of Geography, University of Tehran, Tehran, Iran
- 3Image Processing Laboratory (IPL), University of Valencia, Valencia, Spain
- 4Institute of Methodologies for Environmental Analysis (CNR IMAA), Tito, Italy
- 5Department of Agroecology, Environmental Sciences Research Institute, Shahid Beheshti University, Tehran, Iran
Introduction: AquaCrop is a water-driven crop growth model that simulates aboveground biomass production in croplands. This study aimed to identify the driving parameters of the AquaCrop model for the model calibration and simplification to fill the research gap in intermediate environmental conditions between sub-tropical sub-humid and temperate sub-humid climates for silage maize.
Methods: To this end, we applied global sensitivity analysis (GSA) by combining the Morris method and the Extended Fourier Amplitude Sensitivity Test (EFAST) on crop yield output. The process involved a field sampling of soil and crop of silage maize carried out in the agricultural fields of Ghale-Nou, southern Tehran, Iran, in the summer of 2019 in order to measure certain model parameters.
Results and discussion: In compliance with the Morris method, 30 parameters were identified as the least sensitive, while results from the EFAST test showed 9 parameters as contributing to the highest sensitivities in the model. The results clearly point to the capacity of employing a combination of both methods to attain a more efficient model calibration. Particular root, soil, canopy development, and biomass production parameters were influential and merit attention during calibration. Instead, parameters describing crop responses to water stress were acting rather insensitive in this study condition. The insights gained from this study, i.e., assessing parameter ranges and distinguishing between less sensitive and more sensitive parameters based on environmental and crop conditions, have the potential to be applied to other crop growth models with caution.
1 Introduction
To address the persistent challenges in the agricultural sector, solutions are needed for monitoring agricultural products, designing sustainable agriculture models, increasing water efficiency, and reducing costs (Busetto et al., 2017). Process-based crop growth models offer a suitable solution for understanding the interactions between environmental conditions, land management, and crop growth (Kasampalis et al., 2018). One must note, however, that establishing mathematical relationships that express natural processes through model equations and their input parameters inevitably involve different assumptions and simplifications of the real world. These could thus increase uncertainty and reduce the accuracy of the model outputs (Saltelli et al., 2000; Ma et al., 2023). When the focus is on regional study areas, a solution to reduce uncertainties related to input parameters and model structure involves calibrating process-based models to the local conditions. This requires simplifying crop growth models with fewer parameters and inputs or assigning constant values to fewer effective parameters. At the same time, a key step in all process-based model applications involves identifying the key input parameters that drive the output variability. This especially holds true in cases of high uncertainty in parameter values. A more accurate model calibration calls for the identification of the least number of effective parameters for crop growth modeling, which can be conducted through sensitivity analysis (SA) (Morel et al., 2014; Silvestro et al., 2017).
SA can evaluate and quantify the effect of uncertain factors, i.e., the input parameters, on the variability of the model outputs, principally aimed at evaluating and identifying the importance of parameters in process-based models (Specka et al., 2019). To further simplify the model, constant values can be allocated to less influential parameters while identifying a list of key parameters required for a precise calibration of the model (Li et al., 2019). Another necessity of crop growth models is considering the environmental conditions of different regions, leading to a specific (condition)-wise prioritization of model calibration parameters. Correspondingly, SA results are driven by the environmental conditions (e.g., different climatic conditions, geographical areas, soil types, etc.) in which the model is implemented. Accordingly, when aiming to be generally applicable, it is vital to examine the model’s sensitivity across a range of environmental conditions (Vanuytrecht et al., 2014).
SA strategies can be categorized as either local or global (Saltelli et al., 2008). While local SA (LSA) methods assess the effect of changes in one parameter on the model output given constant values for all other parameters (Cariboni et al., 2007), global SA (GSA) methods assess the effects of simultaneously (wide-ranging) varying all involved input parameters on the model output (Saltelli et al., 2008). With respect to crop growth models, LSA methods failed to fully examine all relations in crop growth models. This is because of the complexity of such models and the significance of understanding the relationship and interaction between multiple input parameters (Cariboni et al., 2007). More generally, as claimed in fundamental studies, LSA methods are insufficient for identifying the most effective parameters of nonlinear models and are only capable of identifying the least effective parameters (Cariboni et al., 2007; Saltelli et al., 2008; Saltelli and Annoni, 2010; Vanuytrecht et al., 2014; Silvestro et al., 2017; Li et al., 2019; Ma et al., 2023). Conversely, GSA can be more effective than LSA because it can provide a more complete and realistic view of the model’s behavior and uncertainty.
GSA assessments of crop growth models have been widely studied. For instance, Confalonieri et al. (2010a, b) employed a GSA assessment of water accounting rice model (WARM) by using Morris and Sobol algorithms; Wang et al. (2013) employed extended Fourier amplitude sensitivity test (EFAST) on WOrld FOod STudies (WOFOST); Vanuytrecht et al. (2014) used Morris and EFAST on AquaCrop; Song et al. (2014) also applied Morris and EFAST on the decision support system for agrotechnology transfer (DSSAT); Xing et al. (2017) implemented EFAST on AquaCrop; Silvestro et al. (2017) adapted Morris and EFAST on AquaCrop; Guo et al. (2020) used EFAST on AquaCrop; Upreti et al. (2020) deployed Morris, EFAST, and density-based PAWN methods on AquaCrop; and Rahimikhoob et al. (2024) applied Sobol method on AquaCrop for basil. These studies have in common that the adaptation of the Morris method in combination with the Sobol/EFAST methods proved to be highly effective. The reason is due to the low computational complexity of the Morris method in denoting the less influential parameters, thereby enabling to reduce the number of parameters in the subsequent Sobol/EFAST methods.
Among variance-based sensitivity methods, literature reveals that Sobol and EFAST are mostly used for GSA assessments of a limited number of input parameters (Chen and Cournède, 2014). While both perform equally well in terms of computation time, EFAST transcends Sobol in assessing the effect of parameter relationships on the variance model (Saltelli et al., 1999; Roundy, 2009; Silvestro et al., 2017). For instance, an ensemble of the Morris and EFAST methods has been applied by (Vanuytrecht et al., 2014; Silvestro et al., 2017), in which the Morris screening method was first used to identify the less effective input parameters. This is followed by an application of EFAST to analyze the AquaCrop model’s output sensitivity based on the model parameters across a range of environmental conditions. GSA assessment of model parameters is highly dependent on environmental conditions and the crop type under study, such that no single GSA scenario can be interchangeably used for a range of climatic and environmental circumstances (Vanuytrecht et al., 2014; Zhao et al., 2014; Xing et al., 2016; Silvestro et al., 2017; Xing et al., 2017). GSA results thus vary for different environmental conditions, not only in terms of the magnitude of impact, but also in terms of the order and ranking of parameters. EFAST is more coherent compared to the Morris method, and it prioritizes and sequences parameters more stably across a range of environmental circumstances (Vanuytrecht et al., 2014; Silvestro et al., 2017). Hence, the Morris method can only be used to screen fewer sensitive parameters, and can only rank parameters qualitatively and not quantitatively (DeJonge et al., 2012; Vanuytrecht et al., 2014). It is essential to determine the correct range of variation in parameter values. The GSA results are related to corresponding environmental conditions, so inhibits the generalizability of results to other regions (Wang et al., 2013).
The AquaCrop model was developed as a process-based model by Steduto et al. (2009) with the purpose to simulate relationships between crop yield and crop transpiration in different environments. Earlier GSA studies on the AquaCrop model, including Vanuytrecht et al. (2014), Xing et al. (2016), Silvestro et al. (2017), Xing et al. (2017), Guo et al. (2020), and Upreti et al. (2020), were primarily based on the older versions of this model — with a limited number of parameters, with the exception of Upreti et al. (2020). In the 6.1 version of AquaCrop, however, the number of parameters has increased, which in turn requires parameter ranking and tuning in terms of relevance to the model. Zhao et al. (2014) and Xing et al. (2016, 2017) also noted the need for analyzing more parameters to improve research validity in model sensitivity studies. Upreti et al. (2020) stated that in addition to assessing the AquaCrop model with a higher number of parameters (with wheat as the case crop), it is necessary to generalize model results for other geographical, climatic, and crop conditions in order to achieve higher robustness for the AquaCrop model. This further highlights the significance of applying a GSA to AquaCrop models implemented across a range of environmental conditions. Overall, the above literature review revealed that there is a research gap to be filled regarding identifying the influential parameters in the AquaCrop model calibration, especially in intermediate environmental conditions between sub-tropical sub-humid and temperate sub-humid climates for silage maize. Given this background, the novelty of the present research lies in the application of GSA for another climatic condition and crop type as opposed to previous studies in the AquaCrop model. So, this research builds upon previous AquaCrop studies by applying GSA to a less studied climatic condition and crop type. Specifically, it addresses a research gap by focusing on intermediate environmental conditions between sub-tropical sub-humid and temperate sub-humid climates, using silage maize as the target crop. Therefore, we aimed to help the generalization of model results by a distinct geographical, climatic, and crop conditions in order to achieve higher robustness. Meanwhile, the conservative parameters are not supposed to require a local calibration for a well-studied crop such as wheat, but would need to be calibrated using data from multiple locations for a species new to the AquaCrop model (Silvestro et al., 2017). Since the climatic condition and crop type of this study were new to the model, we applied the sensitivity analysis on both conservative and non-conservative parameters to gain a complete picture of the sensitivity of model outputs to model parameters and also to find the optimum range for each parameter. On the other hand, the AquaCrop model’s parameters are interrelated, making it difficult to isolate the individual effects of each parameter on the model’s outputs. To address this challenge and identify the most influential parameters, we employed the variance-based sensitivity method, EFAST, which helped us quantify the interactions between these parameters.
Altogether, the objectives of this study are twofold: (i) What are the least sensitive parameters that can be considered constant without affecting the model’s accuracy? (ii) How can model uncertainty be reduced to attain a more accurately calibrated model using the least number of sensitive parameters? To answer these questions, the study employs a GSA through the combination of Morris (question i) and EFAST (question ii) methods. The data used for the GSA experiments were acquired from silage maize crop field samples gathered from agricultural fields in Ghale-Nou County, Tehran, Iran, during the growing season of silage maize from mid-June to late October 2019.
2 Materials and methods
2.1 Study area
To examine AquaCrop’s general sensitivity in terms of climate, soil, irrigation, and crop data, field experiments were conducted during the growing seasons of silage maize in the Ghale-Nou county of Tehran, Iran (51°24–51°35’ E and 35°23–35°36’ N) (Figure 1). Daily weather input data was collected from a local weather station in the study area (51°27’ E and 35° 35’ N) (Figure 1). The maximum and minimum temperatures and average annual precipitation were calculated at 42°C, −4°C, and 200 mm, respectively. The climate zone of the area is categorized as an intermediate between sub-tropical sub-humid and temperate sub-humid climates (Akbari et al., 2020b). The study area is characterized by a flat morphology, extending to 7 × 15 km, and is dominated by agricultural fields, predominantly silage maize (7,500 ha). The silage maize fields were planted from mid-June to late July 2019 and harvested from mid-September to late October 2019, with the majority of silage maize fields irrigated during the hottest month (July to September).
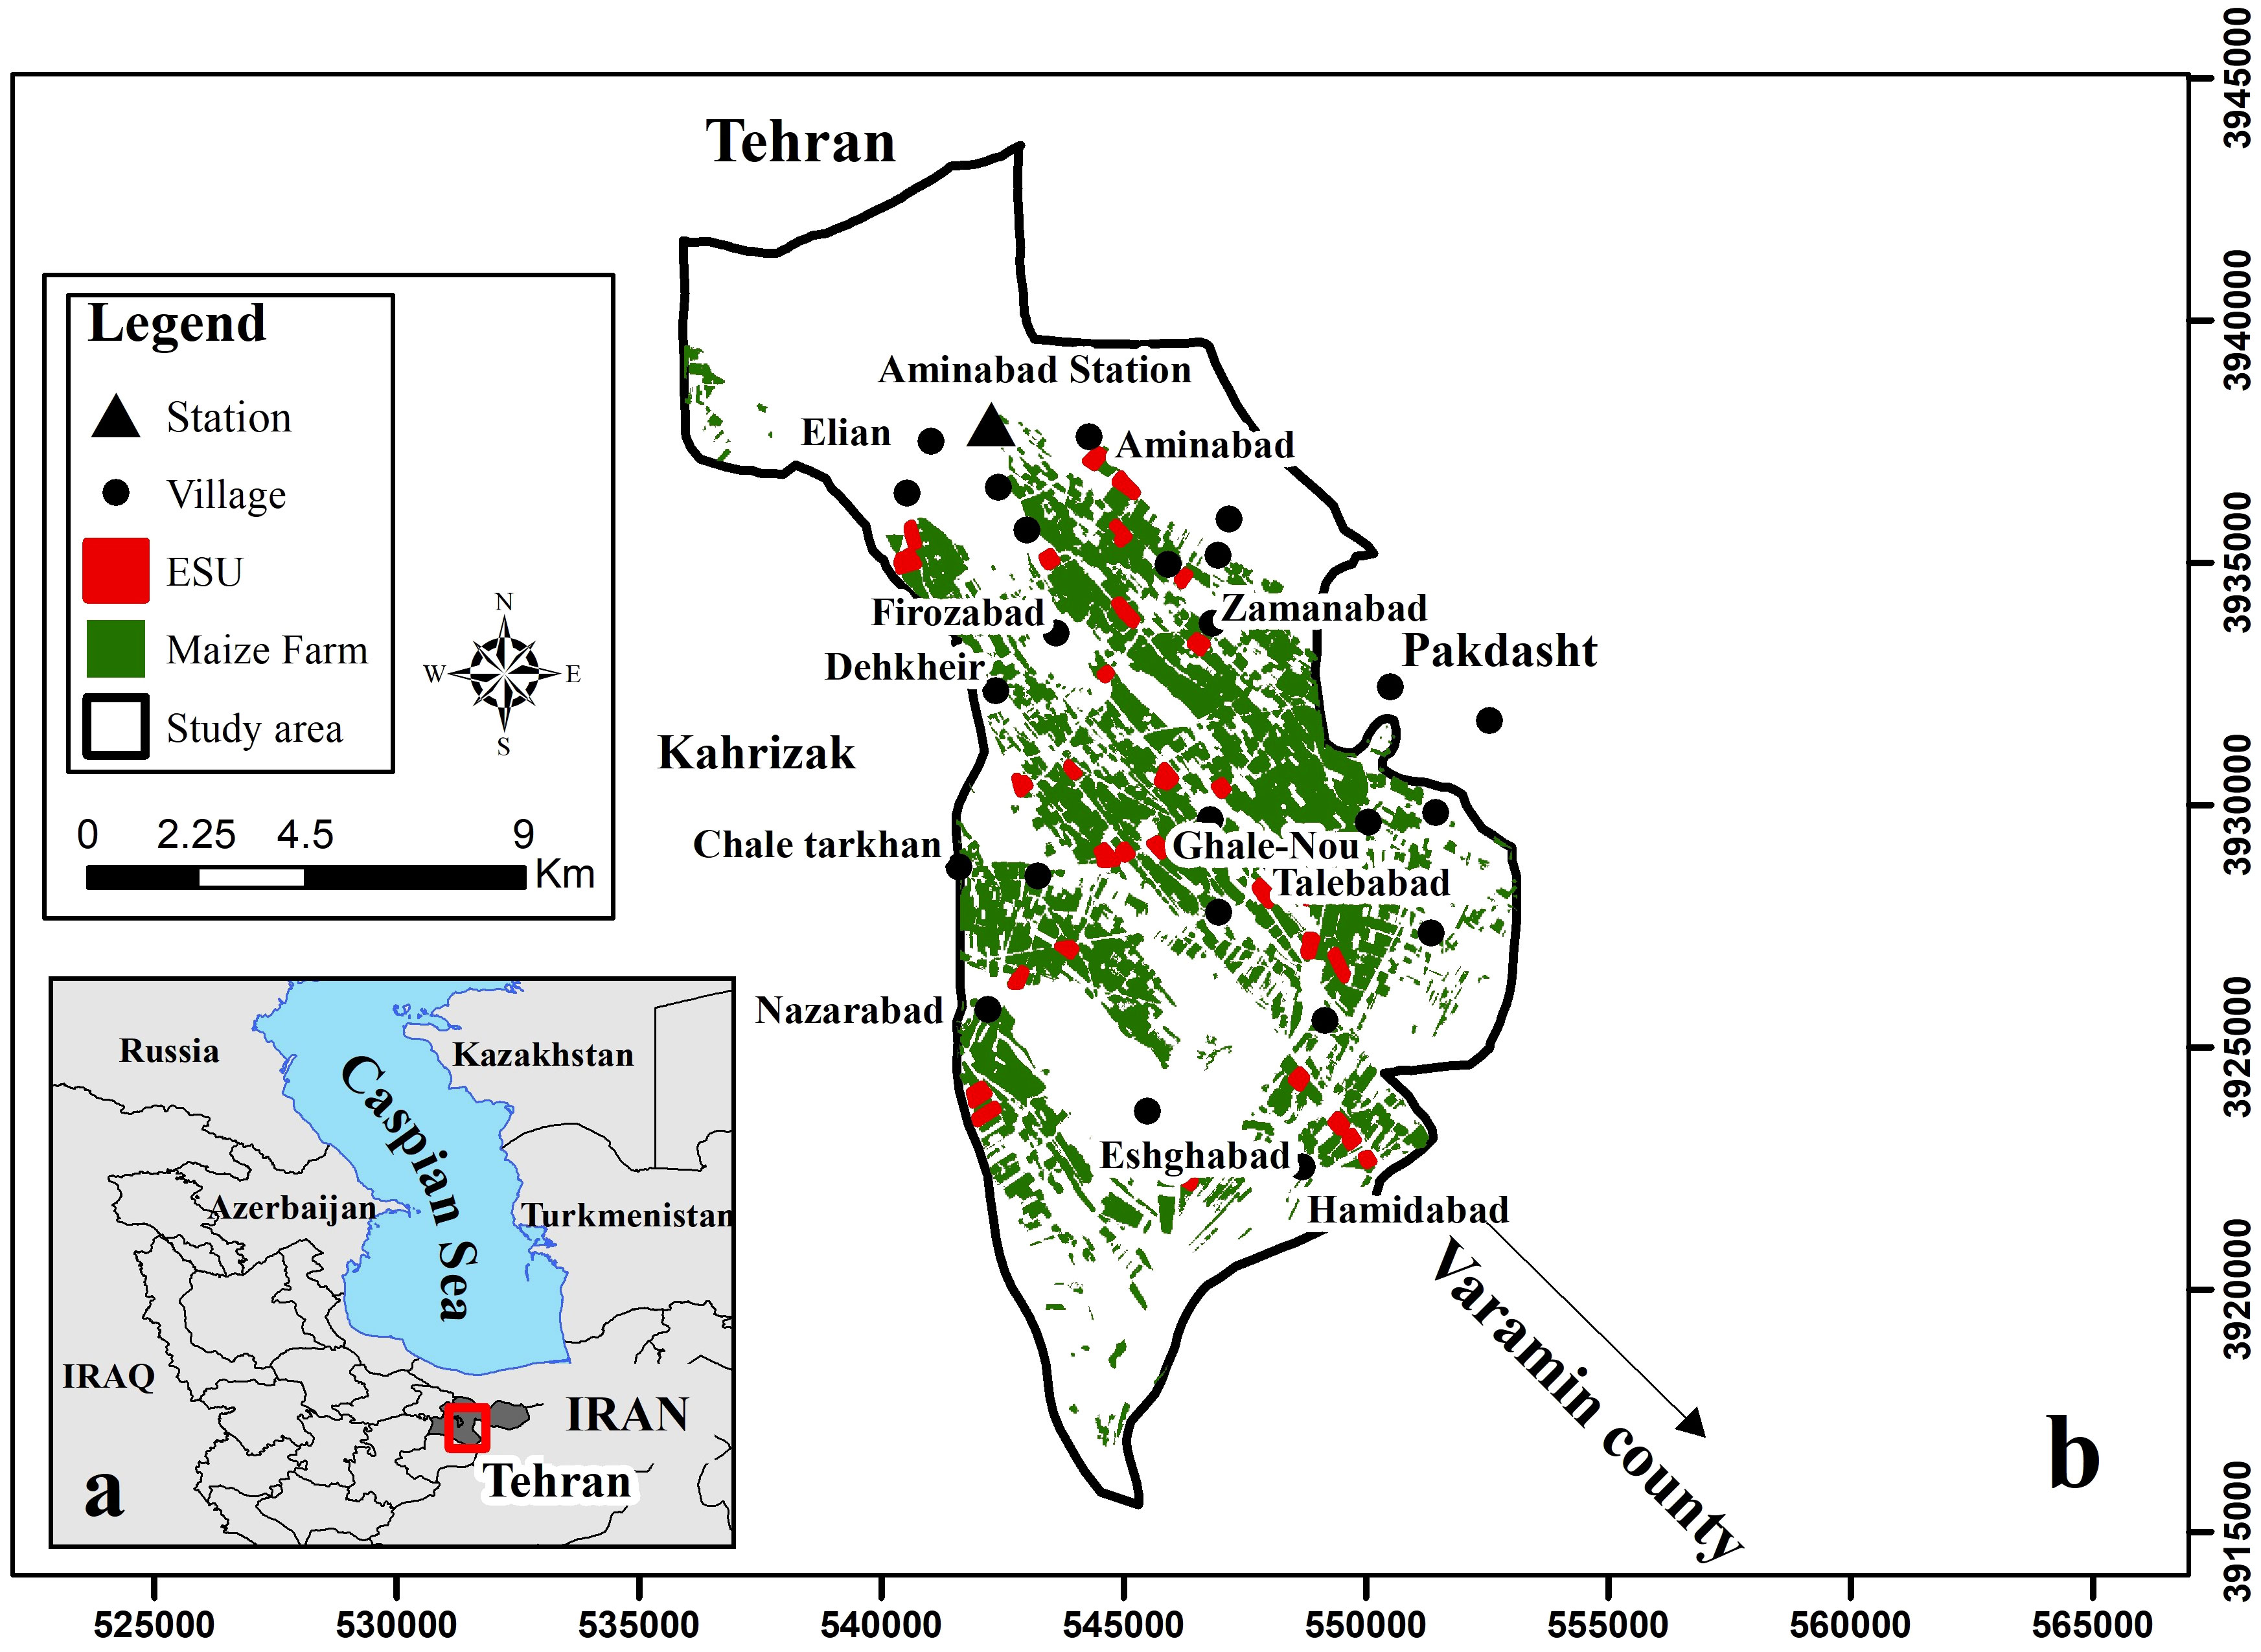
Figure 1 Study area in Iran and Tehran province (A), and location of the study area, Ghale-Nou County, weather station and the experimental data field collection plots (i.e., ESUs) (B).
One meteorological station was present in the study area, which satisfies the study due to the homogeneity of climatic condition of the region. However, the crop, soil, irrigation, management practices and other parameters that must be imported into the AquaCrop model for crop growth simulation varied in the different fields. So, experimental data field collection included 30 fields of silage maize, measured in 30 elementary sampling units (ESU) plots 20 × 20 m during the summer season. Sampling of soil before planting, leaf area index (LAI) and fCover biophysical variables, cropland information, and irrigation plan during the crop growing season were conducted in each ESUs (plots). Details of the sampling procedures for crops, soil, irrigation, etc. are explained in the following sections.
2.2 Field data collection
Data required for simulating the AquaCrop model were acquired through ESU site sampling (see Akbari et al., 2020a, c, 2023 for more details) during the growing season of silage maize from July 12 to October 10, 2019. The AquaCrop model includes four categories of input data related to crop, soil, management, and climate and three main outputs, including vegetation cover (fCover), biomass, and simulated crop yield (Raes, 2017). Meteorological data obtained for the larger range than the growing period of silage maize, i.e., late May to mid-December 2019. These data comprised maximum and minimum daily temperature values, average daily temperature, average daily precipitation, maximum, minimum, and average daily relative humidity, average daily wind speed, and daily solar radiation (sunny hours) (daily data are required by the model), all of which were collected from a meteorological Aminabad station (Table 1).
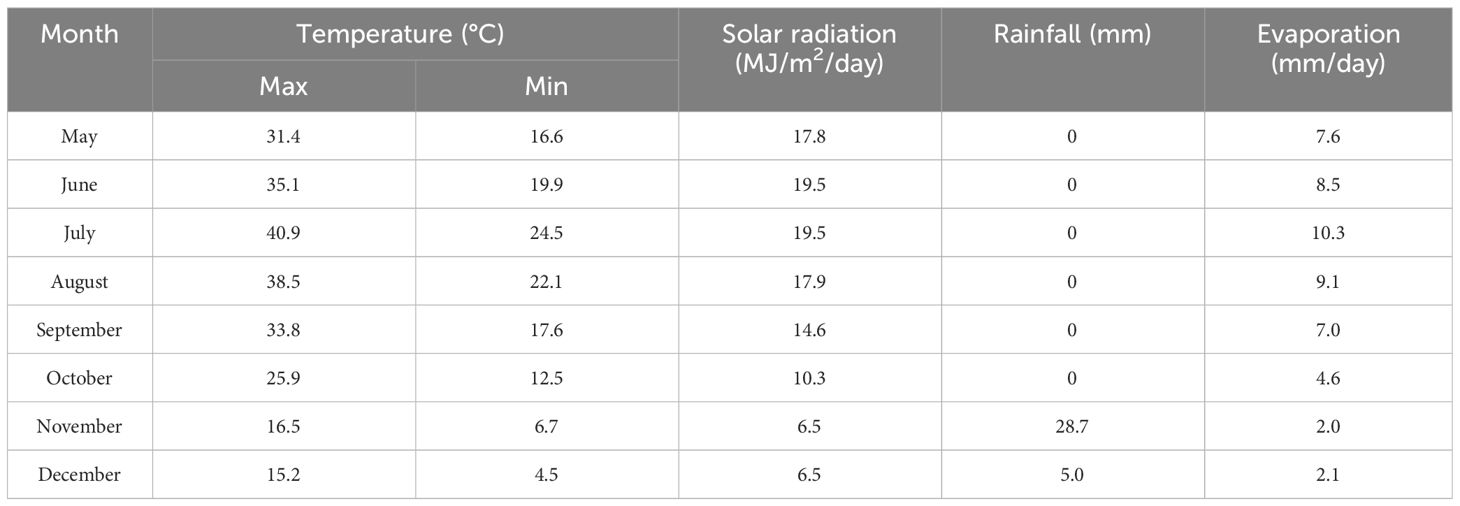
Table 1 Monthly average of maximum and minimum temperature, solar radiation, total rainfall, and evaporation of the study area over silage maize (20 May to 20 December 2019 is considered for climate data).
Among other essential data required for modeling crop growth is the average CO2 concentration, which can be accessed through the Mauna Loa database (available in the model itself). Reference evapotranspiration (ETo) was also obtained using ETo calculator (https://www.fao.org/land-water/databases-and-software/eto-calculator/en/) and climate data (minimum, maximum, and average temperature, relative humidity, wind speed and solar radiation). Solar radiation was calculated using PhotoPeriod and the solar radiation calculator with respect to the Angstrom–Prescott model (Prescott, 1940). The climate section in the AquaCrop model allows for a direct adjustment of precipitation data, ETo, minimum and maximum temperature, and CO2.
Mixed sampling of soil was also conducted for 0–60 cm depths at five points in each field surface (ESUs) (overall 30 soil samples) in the form of M or W. According to shape of M and W, four points/pits were located in the corner of the field (not near to farm border) and one point/pit was located in the center of the field in each field. Then, further laboratory measurements of soil texture (clay, silt, and sand), organic matter, soil moisture content at saturation (SAT), field capacity (FC), and permanent wilting point (PWP) have been conducted, too. The saturated hydraulic conductivity (Ksat) of soil was calculated using pedotransfer functions and soil moisture contents at SAT, FC, and PWP. These data were fed as input to the AquaCrop model’s soil section of each sampled field. Soil samples from ESU lands were classified into two texture classes (Table 2).
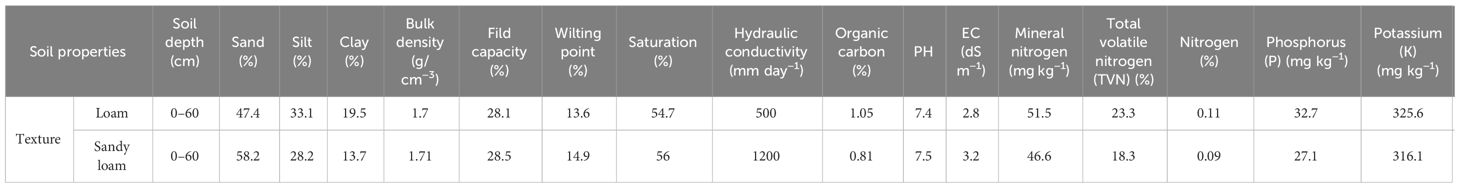
Table 2 Average of soil properties of collected samples from ESUs lands in Ghale-Nou, Iran.
Questionnaires were also filled out by farmers and incorporated into the model as the management layer. The questionnaires for each sampling field included items on the irrigation plan (date and duration of each irrigation), type of irrigation system, primary and secondary tillage equipment, seed source, type of silage maize cultivar, type (method) of cultivation, cultivation depth, the dates of planting and harvesting, length of the growing season, number of seeds used per hectare, and crop yield for 2019.
The exact distance between rows and between crops planted on each row was measured during the field campaign to calculate the destructive protocol sampling area and planting density. Further, calculations of irrigation volume and depth of each sampling field at each irrigation event were acquired by measuring the irrigation canals’ width, and the passing water’s height in the canals or water pipes. These data were also incorporated as input into the AquaCrop model for each sampling field. Apart from measuring LAI and fCover at 30 ESUs (see section 2.2.1 for more details), cropland information was also collected from the fields during each visit. This information included the number of leaves, phenological dates including emergence, flowering, duration of the flowering, grain formation and its duration, milky time, tasselling, and leaf yellowing. These data were also used as input for the crop section in the AquaCrop model in each sampled field.
2.2.1 LAI and fCover field measurement
LAI and fCover were measured in each ESU using two methods, i.e., (1) digital hemispherical photography (DHP), and (2) destructive protocols during the growing season of silage maize from July 12 to October 10, 2019. It was followed by calculations of the average of two protocols. The time interval between each measurement ranged from 10 to 15 days (6 times sampling for each ESU). It was due to account for the phenology stages of silage maize including three to four leaves (July 12 and 17), eight to nine leaves (July 27 and Aug. 1), twelve leaves (Aug. 11 and 16), flowering (Aug. 26 and 31), grain formation (Sep. 5 and 10), and the start of grain filling stages (Sep. 15, 20, 30 and Oct. 10). It merits mentioning that in certain cases, due to delays in the planting time, the field measurements of July 27, Aug. 1, Aug. 11, and Aug. 16 were carried out in the three- to four-leaf stage. Accordingly, the time of the first sampling was set to three weeks after planting on each farm. As a result, ESUs comprised different phenology stages given the asynchronous cultivation on different farms.
In the first method of measuring the LAI and fCover, i.e., DHP method, LAI and fCover values measured using DHP were acquired from a Canon 5d Mark II camera equipped with a FC-E8 fisheye lens (Figure 2). The DHP was processed using CAN-EYE V6.491 (http://www4.paca.inra.fr/can-eye), to provide estimates of the LAI and fCover.
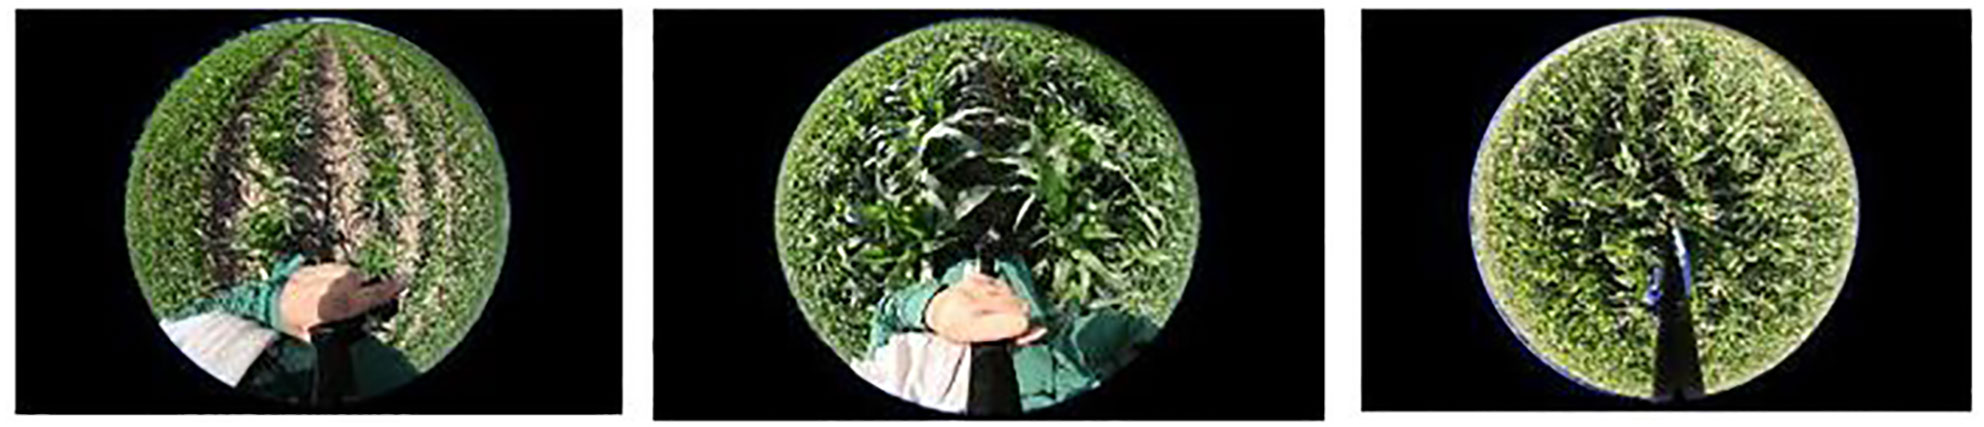
Figure 2 Samples of DHP taken in ESUs at different phenology stages of silage maize (Akbari et al., 2023).
In the second method of measuring the LAI and fCover, i.e., destructive method, four silage maize plants were destructively harvested from each ESU at every sampling stage, and the length and width of each leaf were measured manually. The area of each leaf was estimated based on the measured length and maximum width of each leaf multiplied by 0.75. LAI was estimated by dividing the total leaf area of all sampled plants in each ESU by the destructive protocol sampling area (sampling area was calculated as sample numbers multiplied by row and plant spacing) (Xia et al., 2016). fCover was derived using the Ritchie model using Equation 1 (Katerji et al., 2013).
where K is the extinction coefficient assumed to be 0.507643 for maize, based on in-situ DHP processing and the Beer–Lambert law (Liu et al., 2013).
2.3 Crop simulation model
The AquaCrop model is essentially based on the relationship between relative yield and relative evapotranspiration (Steduto et al., 2009). The simulation of crop yield in the model involves four steps: (1) canopy cover development (CC), (2) plant transpiration (Tr), (3) aboveground biomass (B), and (4) crop yield (Y) (Raes, 2017), each comprising unique computational stages and parameters along with soil, temperature, salinity, fertility, and water stress conditions (Table 3). The AquaCrop model finally simulates crop yield by defining conservative and non-conservative parameters (Appendix 1) (see http://www.fao.org/aquacrop/en/ and (Raes, 2017; Raes et al., 2017a, b) for more details).
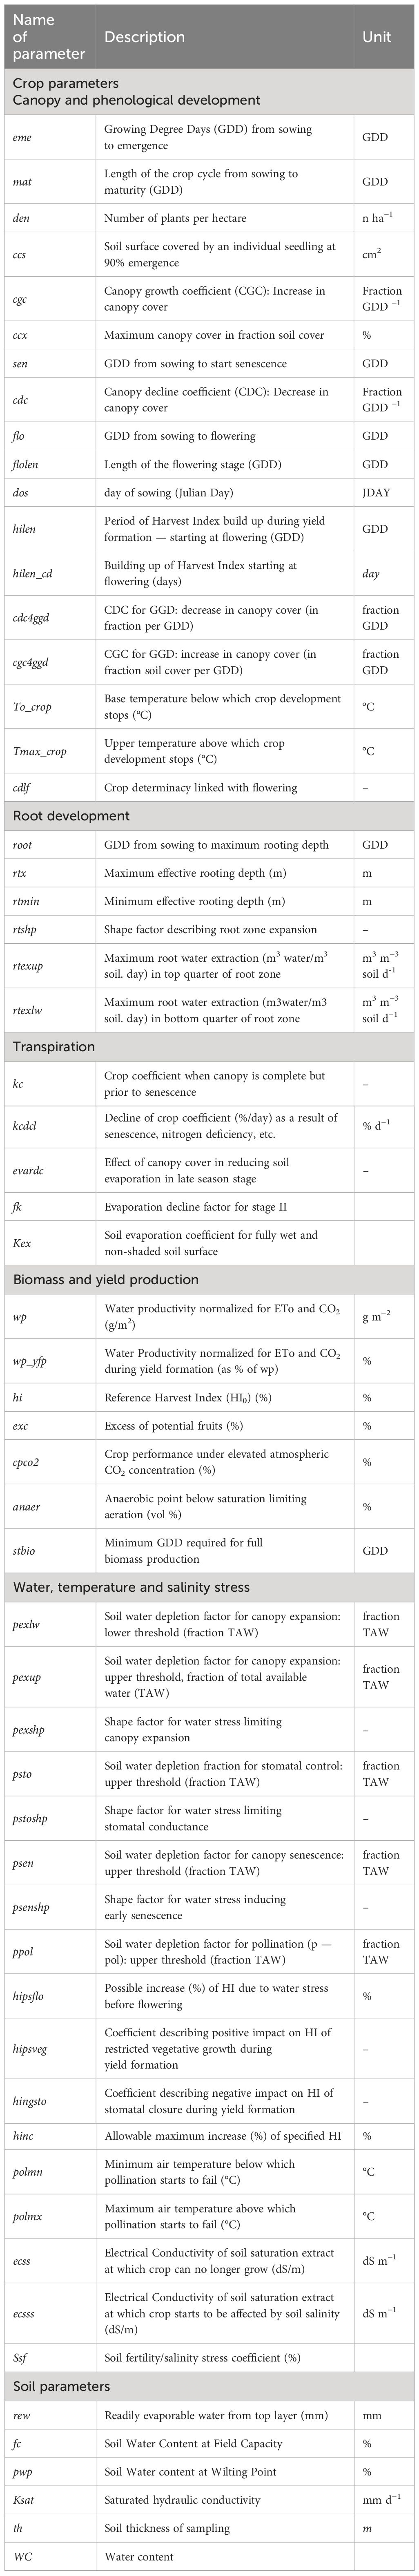
Table 3 Crop and soil parameters of the AquaCrop model considered in the SA.
2.4 AquaCrop model evaluation against actual experimental data
Before the AquaCrop model usage in sensitivity analysis, it should be tested against actual experimental data. To this aim, the farms (samples) were divided into two groups for parameterization (10 ESUs) and evaluation (20 ESUs) purposes, as they were randomly distributed. The root mean square error (RMSE) and relative RMSE (RRMSE) metrics were calculated using Equations 2 and 3:
where, Yi is the observed value, is the predicted value, μ is the average value of observations, and n is the number of samples (Richter et al., 2012).
2.5 Global sensitivity analysis
In GSA, screening methods such as the Morris method (Morris, 1991) are often used prior to applications of GSA methods like EFAST (Saltelli et al., 1999), thereby simplifying the identification of the least and most effective parameters, respectively. The least effective parameters are kept constant and are excluded from the next step, i.e., executing variance-based methods with high computational complexity (Vanuytrecht et al., 2014). The combination of Morris and EFAST methods has also proven successful in studies by Sun et al. (2012), Vanuytrecht et al. (2014), and Silvestro et al. (2017).
2.5.1 Morris method
To identify effective parameters, the Morris method calculates the elementary effect of each parameter (di) on the output variations (Equation 4):
where y(x) is the model output, X= (x1, x2, …, xk) is the k-dimensional parameters vector, Δ is a predetermined value equal to 1/(p − 1), in which p is the number of levels corresponding to the parameter distribution values. The number of model parameters in this study was set at 59 (k = 59). Absolute average values of elementary effects (µ*) represent the most effective parameters in the model (Equation 5):
where EE is the initial effect, r is the number of trajectories, and µ* and σj (sigma) are the absolute mean and standard deviation of EE values for calculating the Morris sensitivity and its uncertainty, respectively (Franczyk, 2019).
2.5.2 EFAST method
The variance-based GSA, the EFAST method, evaluates the search space of each continuous parameter nonlinearly, i.e., the search space is defined based on the search curve using a sin function. Then, after multiple iterations, combinations of parameters are created, and the output variance is calculated (Vanuytrecht et al., 2014). The Fourier transform can then be applied to the y function to calculate variance (Xing et al., 2017). A merit of this method lies in its consideration of higher-order relationships between input parameters alongside the first-order effect, so that the output variance of the model, V (Y), can be calculated using Equation 6:
where Vi = V[E(Y/xi)] is the main effect of each parameter xi with E(Y/xi), and Vij to V1…m examines the relationships between m parameters.
GSA methods often derive two sensitivity indices for each parameter: the main sensitivity index (Si) (first-order), and the total sensitivity index (STi) (higher-order effects) (Equation 7) (Saltelli et al., 1999). Si measures only the effect of a single parameter on the output variance, whereas STi also measures the interactions between parameters. Si and STi both vary between 0 and 1, with higher values representing more effective parameters:
where V−i is the sum of all variances excluding i (Pianosi et al., 2016). One must note, however, that the EFAST method requires a much longer computational time than the Morris method in calculating the sensitivity indices (Vanuytrecht et al., 2014).
2.6 GSA model implementation
The FAO-AquaCrop plug-in (ACsaV60) (available at http://www.fao.org/aquacrop/en/) was employed for analyzing model sensitivity using Morris and EFAST SAs programmed in MATLAB. By running ranging parameter values (variants) for GSA, various projects of the Aquacrop model were executed sequentially, with the consequent calculation of the Morris index and the variance (Figure 3).
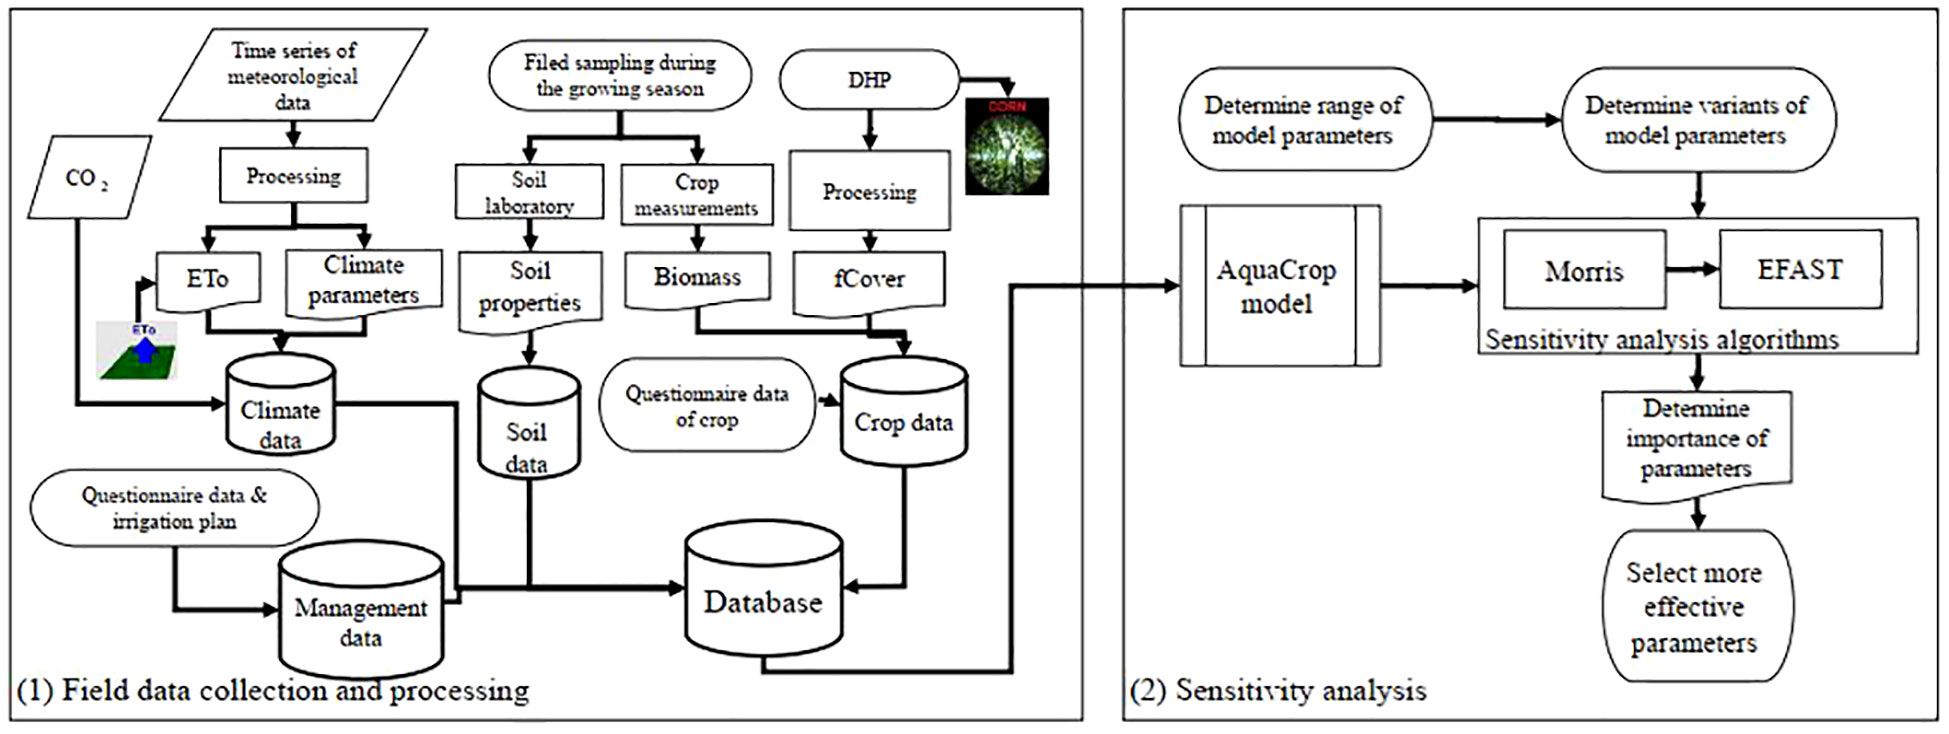
Figure 3 Work flow of the study includes field data collection and sensitivity analysis of AquaCrop model parameters.
Here, GSA was run by changing the parameter values (i.e., creating variants) and assessing their effects on the final crop yield. To create these variants based on the Morris and EFAST GSA, random sampling produced consistent with the Morris (1991) and Saltelli et al. (1999), which were generated through random sampling matrix and search curve methods, respectively. Model parameter sensitivity was analyzed in MATLAB using related codes (obtained from Silvestro et al., 2017), and those developed in the present study for the AquaCrop model matched with the GSA codes.
Relatively higher µ* values indicate more effective parameters. According to Vanuytrecht et al. (2014), the threshold µ* = 0.25 t ha−1 was applied to the Morris method for the AquaCrop model to choose the more effective parameters to be fed into the EFAST method and simplify the model in the first stage. The main advantage of the Morris method is its lower computational cost. Along this line, a total of 1,180 AquaCrop model runs with varying parameter combinations were implemented in this study for 20 different trajectories (introduced by Vanuytrecht et al., 2014 as an appropriate and balanced number for identifying the more effective parameters). By assigning constant values to the less effective parameters identified in the Morris method, the remainder of the parameters were assessed through EFAST. A total of 202,354 AquaCrop model runs with different parameter combinations were evaluated using EFAST.
Conservative/non-conservative parameters of the AquaCrop model were also included in the GSA for this study (total of 59 parameters). Several studies also suggested a small range of variation for the conservative parameters (e.g., Andarzian et al., 2011; Mkhabela and Bullock, 2012; Xiangxiang et al., 2013; Jin et al., 2014; Vanuytrecht et al., 2014; Abi Saab et al., 2015; Silvestro et al., 2017; Upreti et al., 2020). Conservative parameters are crop specific, but do not change with cultivar, time, management practices, geographic locations, or climate (Raes et al., 2017a). These parameters are not supposed to require a local calibration for a well-studied crop such as wheat, but would need to be calibrated using data from multiple locations for a species new to AquaCrop (Silvestro et al., 2017). Here, we aimed to fill the research gap regarding identifying the influential parameters in the AquaCrop model calibration, especially in intermediate environmental conditions between sub-tropical sub-humid and temperate sub-humid climates for the silage maize crop. Therefore, we considered conservative along with non-conservative parameters in the sensitivity analysis in new environmental conditions and crop species in the AquaCrop model.
Meanwhile, a key issue in GSA is identifying the range of parameter values, or alternatively, the minimum and maximum acceptable values (bounds) for each parameter (Vanuytrecht et al., 2014). Determining parameter distributions also plays a role, here a uniform distribution is taken if no specific distribution is presumed. Variations in certain parameters, such as soil parameters, phenology parameters, crop density, and maximum canopy cover in fraction soil cover (ccx), were ranged based on data collected from the study area. The remainder of the model parameters were set based on the minimum and maximum possible values specified in the available sources (see Appendix 1).
GSA with Morris and EFAST algorithms were implemented using an Intel(R) Core (TM) i7-2640M CPU at 2.80 GHz and 8 GB of RAM in MATLAB R2017a environment. The runtime of these two algorithms for the AquaCrop model lasted approximately eight and thirty hours, respectively.
3 Results
3.1 AquaCrop model evaluation against actual experimental data
Prior to the AquaCrop model usage in sensitivity analysis, it should be tested against actual experimental data. The RMSE and RRMSE metrics of CC, biomass, and yield variables were first calculated (Table 4). The comparative analysis of yield by R2 was calculated between the estimated and observed yield values (Figure 4). Based on these results, we concluded the AquaCrop model efficiency in the study against actual experimental data before such model usage in sensitivity analysis.
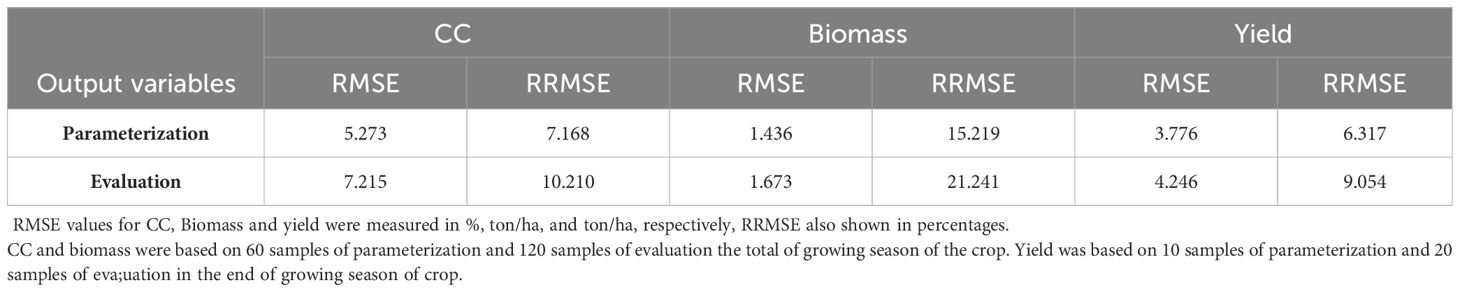
Table 4 Evaluation of AquaCrop results.
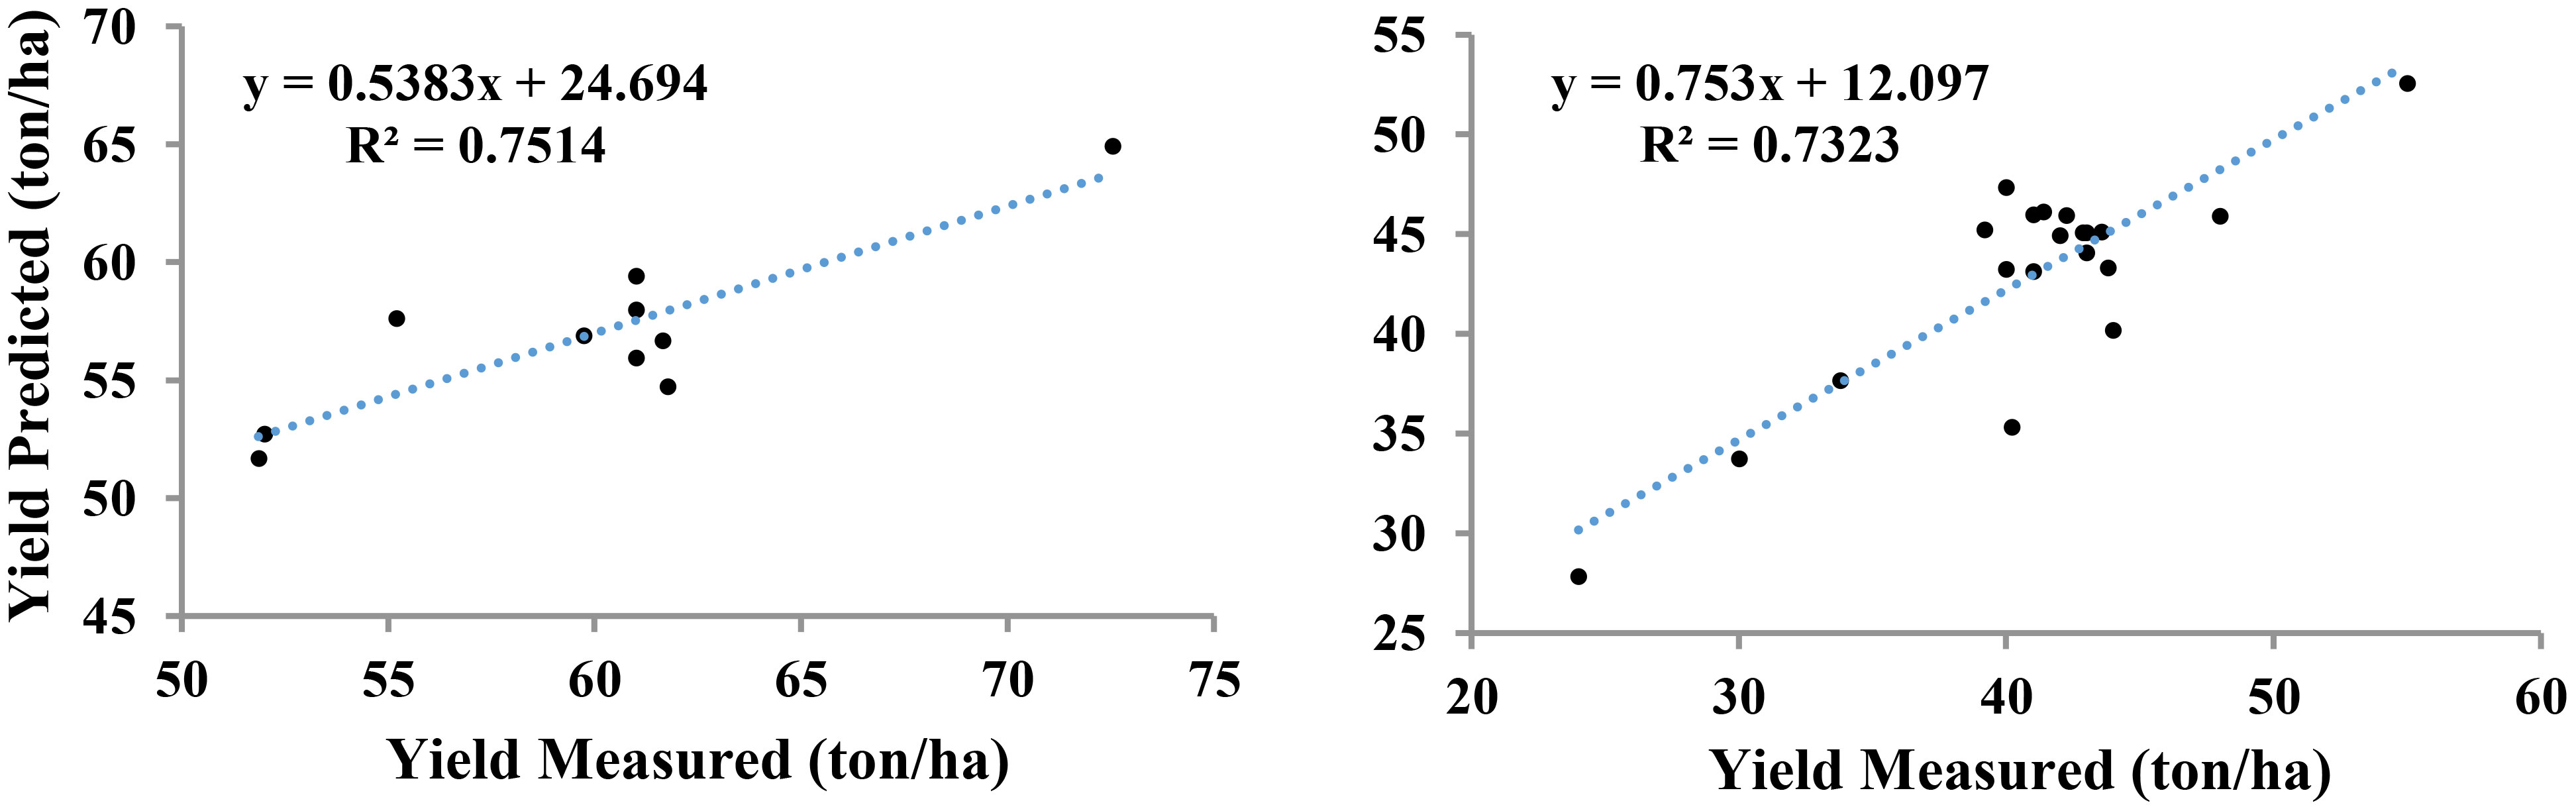
Figure 4 Comparative analysis of estimated and observed values of yield.
3.2 Morris SA results
Figure 5 shows the results of the Morris method as the variable response of the crop yield in the AquaCrop model to changes in parameters. Considering µ* values of less than 1 t ha−1, 44 parameters were identified as affected to a lesser extent (less sensitivity) by changes in different conditions. The Morris method provides an initial assessment of the more effective parameters, where parameters with µ* below 0.25 t ha−1 can be considered less effective and assigned constant values in the model (Vanuytrecht et al., 2014). Accordingly, 30 parameters were categorized as having low sensitivity (i.e., µ*<0.25), considering the negligible effect of changes in the values of said parameters on the crop yield variable as the model output. These parameters were either assigned their corresponding mean range value or measured through field data. In the intermediate climate conditions between sub-tropical, sub-humid, and temperate sub-humid of the study area for silage maize, these parameters include soil and root parameters (i.e., fc, th, Ksat, rtshp, ecss, rtexup, and rew), crop responses to water stress (i.e., ppol, psto, pexlw, pexup, pexshp, pstoshp, and hipsflo), senescence, harvest index, and maturity conditions (i.e., sen, psenshp, hinc, hilen, hingsto, and mat), temperature effects on crop (i.e., polmx and Tmax-crop), and other crop parameters (i.e., dos, ccs, exc, flo, cgc4ggd, cdc4ggd, fk, and wp_yfp). In categories of soil and root parameters and other crop parameters that found µ*<0.25, these parameters belonged to non-conservative parameters except for rtshp, ecss and wp-yff. All parameters of crop responses to water stress and temperature effects on crop categories found less than 0.25 in µ* were in conservative parameters that consider the negligible effect of changes on the crop yield of the model output. Parameters with low yet not-negligible sensitivity values (i.e., 0.25<µ*<1.0) were identified as: cdc, den, psen, polmn, ecsss, kcdcl, rtxlw, evardc, cdlf, hilen_cd, cpco2, hi, flilen, and Kex.
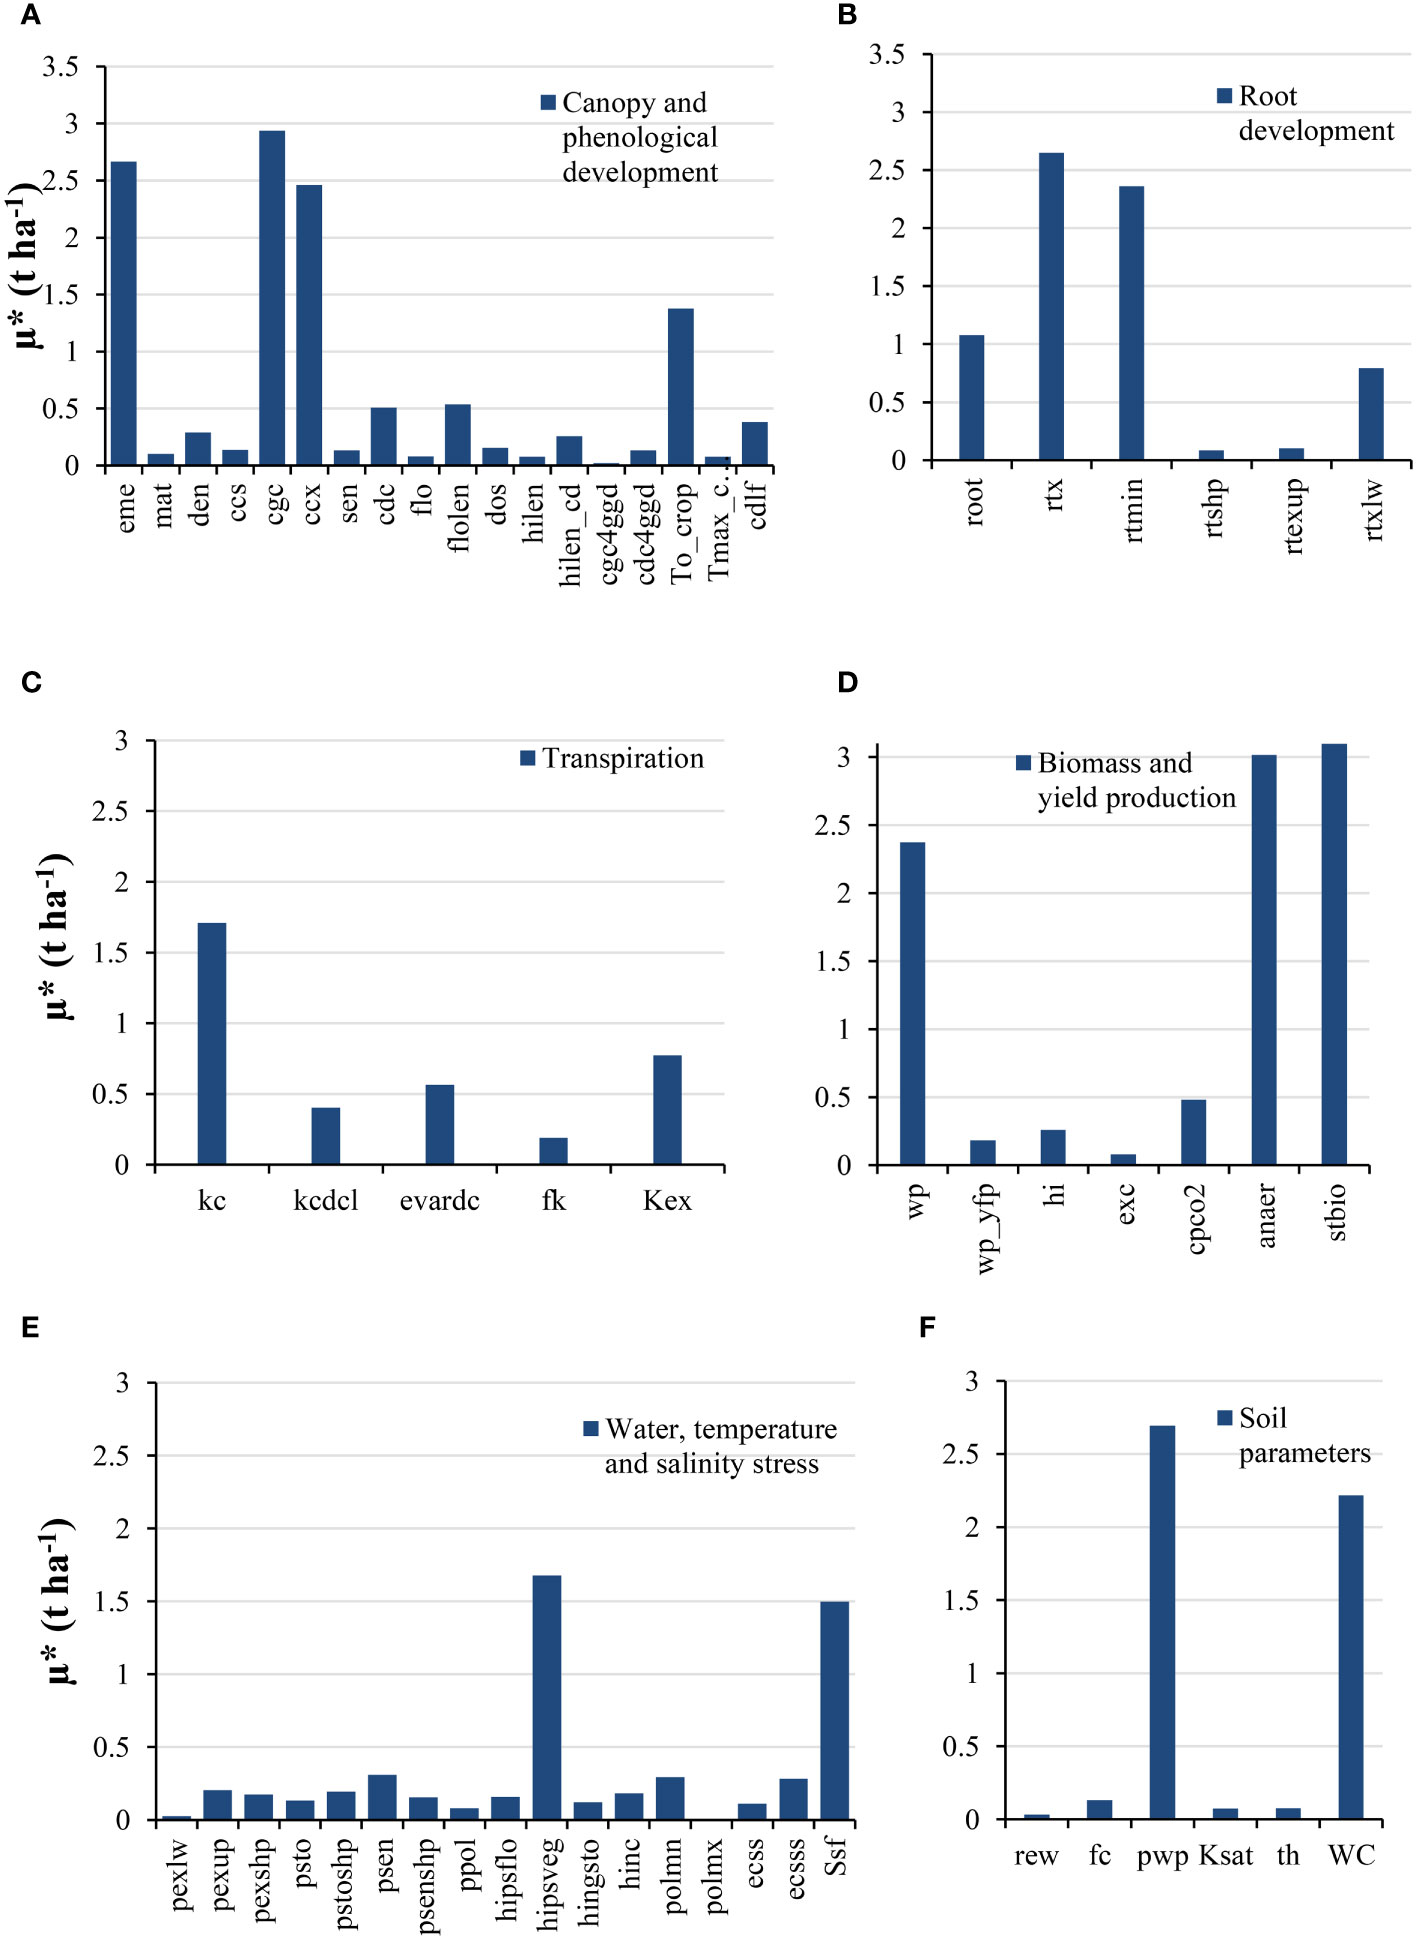
Figure 5 Morris SA values (µ*) for different AquaCrop model parameters. (A) Canopy and phenological development; (B) Root development; (C) Transpiration; (D) Biomass and yield production; (E) Water, temperature, and salinity stress; (F) Soil parameters.
3.3 EFAST SA results
The drawback of the Morris method is its inability to analyze relationships and interactions between parameters and their nonlinear effects on the model output. To resolve this, the EFAST method was implemented to examine such effects in consideration of the more influential parameters (µ* > 0.25 t ha−1) (i.e., 29 parameters).
Two indices, S (main sensitivity index or first-order effects) and ST (total sensitivity index, total effects, or higher-order effects), were obtained using the EFAST method. This method was applied to selected parameters obtained from the Morris method to determine the effectiveness of parameters (Figure 6).
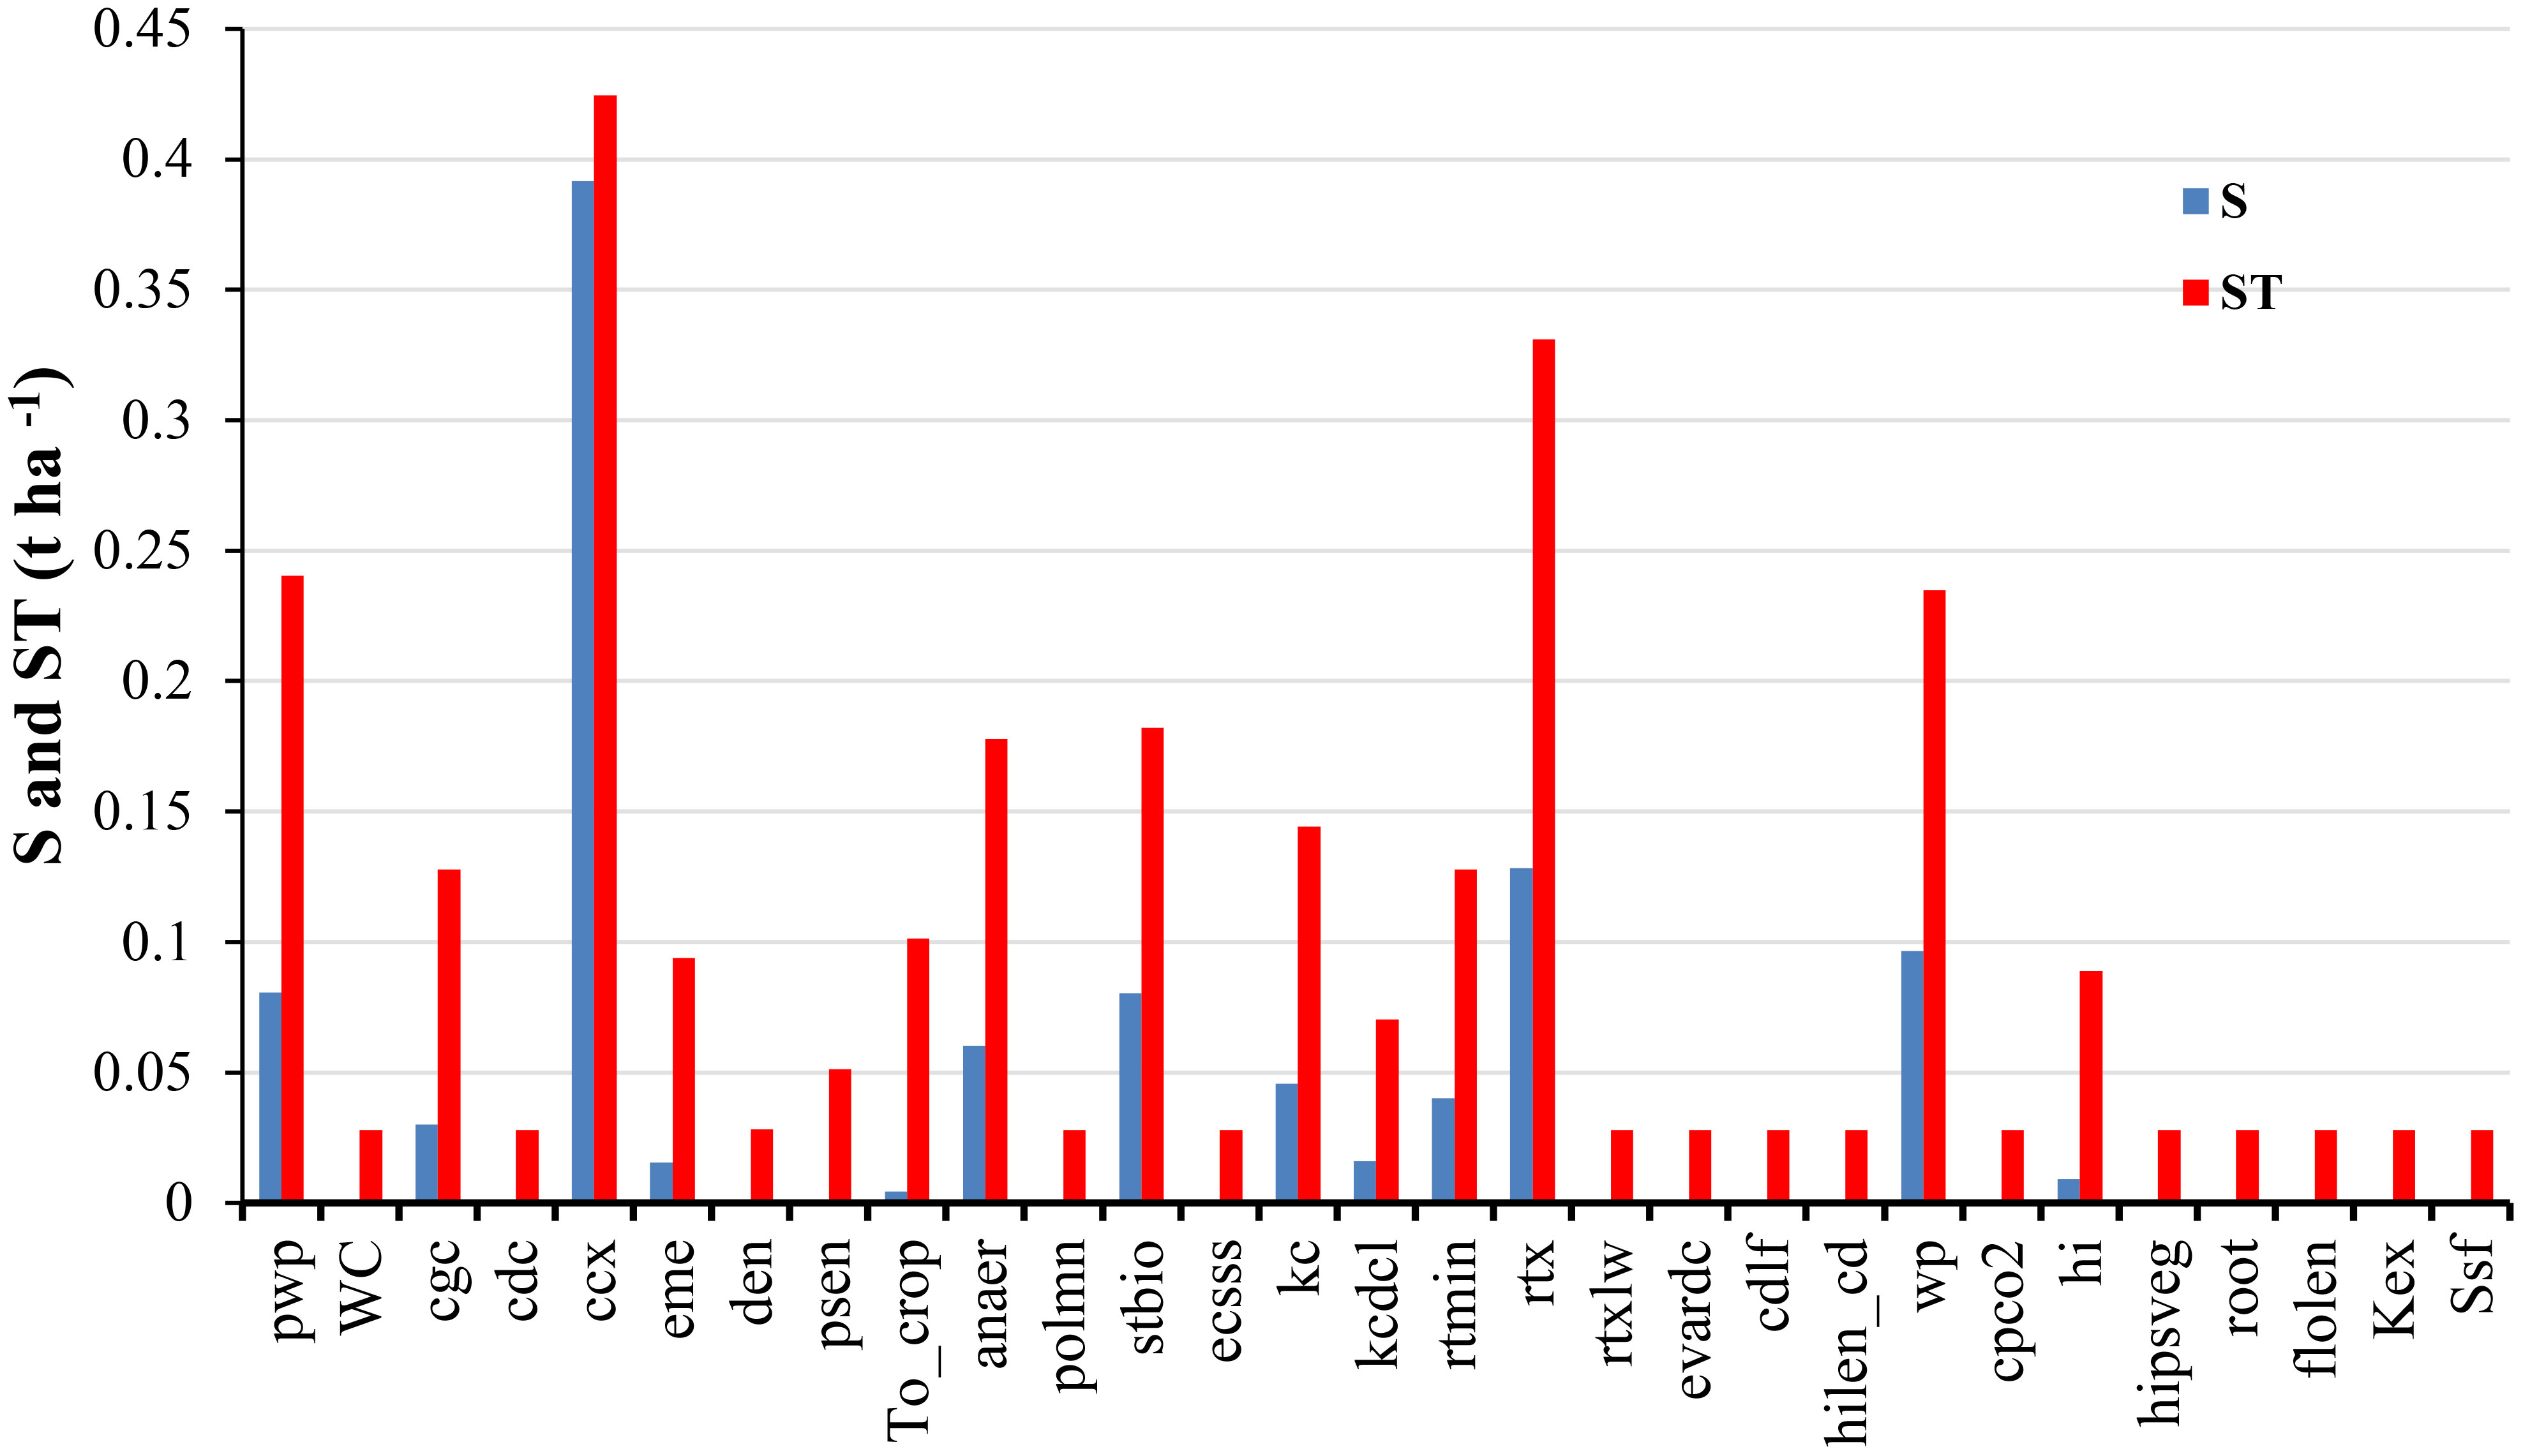
Figure 6 S and ST index values of EFAST SA for different AquaCrop model parameters.
Based on the first-order effects, only ccx, rtx, wp, pwp, stbio, anaer, kc, rtmin, cgc, kcdcl, eme, and hi showed a stronger impact, with other S index parameters identified as less effective. Therefore, the major effect of input parameters on model output is primarily caused by higher-order effects and interactions among parameters. Considering higher-order effects, parameters ccx, rtx, pwp, wp, anaer, stbio, kc, cgc, and rtmin indicated higher sensitivity in the model with STi> 0.1 t ha−1. Also, To-crop, eme, hi, kcdcl, and psen parameters ranked next in terms of high sensitivity (0.05<STi<0.1 t ha−1).
Parameters ccx, rtx, pwp, wp, anaer, stbio, kc, cgc, and rtmin were also significant in terms of first-order effects, pointing to the non-linearity of parameters and interactions therein. Meanwhile, the difference between the S and STi indices indicates the ratio of the contribution to the total output variance that rises due to the interaction of the parameter i with other parameters (Ghasemizade et al., 2017). High interactions also mean difficulties in identifying the parameters when calibrating the model. Figure 7 indicates the S and ST index values difference for identifying the parameter interactions. The more sensitive parameters, except ccx have been found based on the SA were noted the more interactions of the parameters by others.
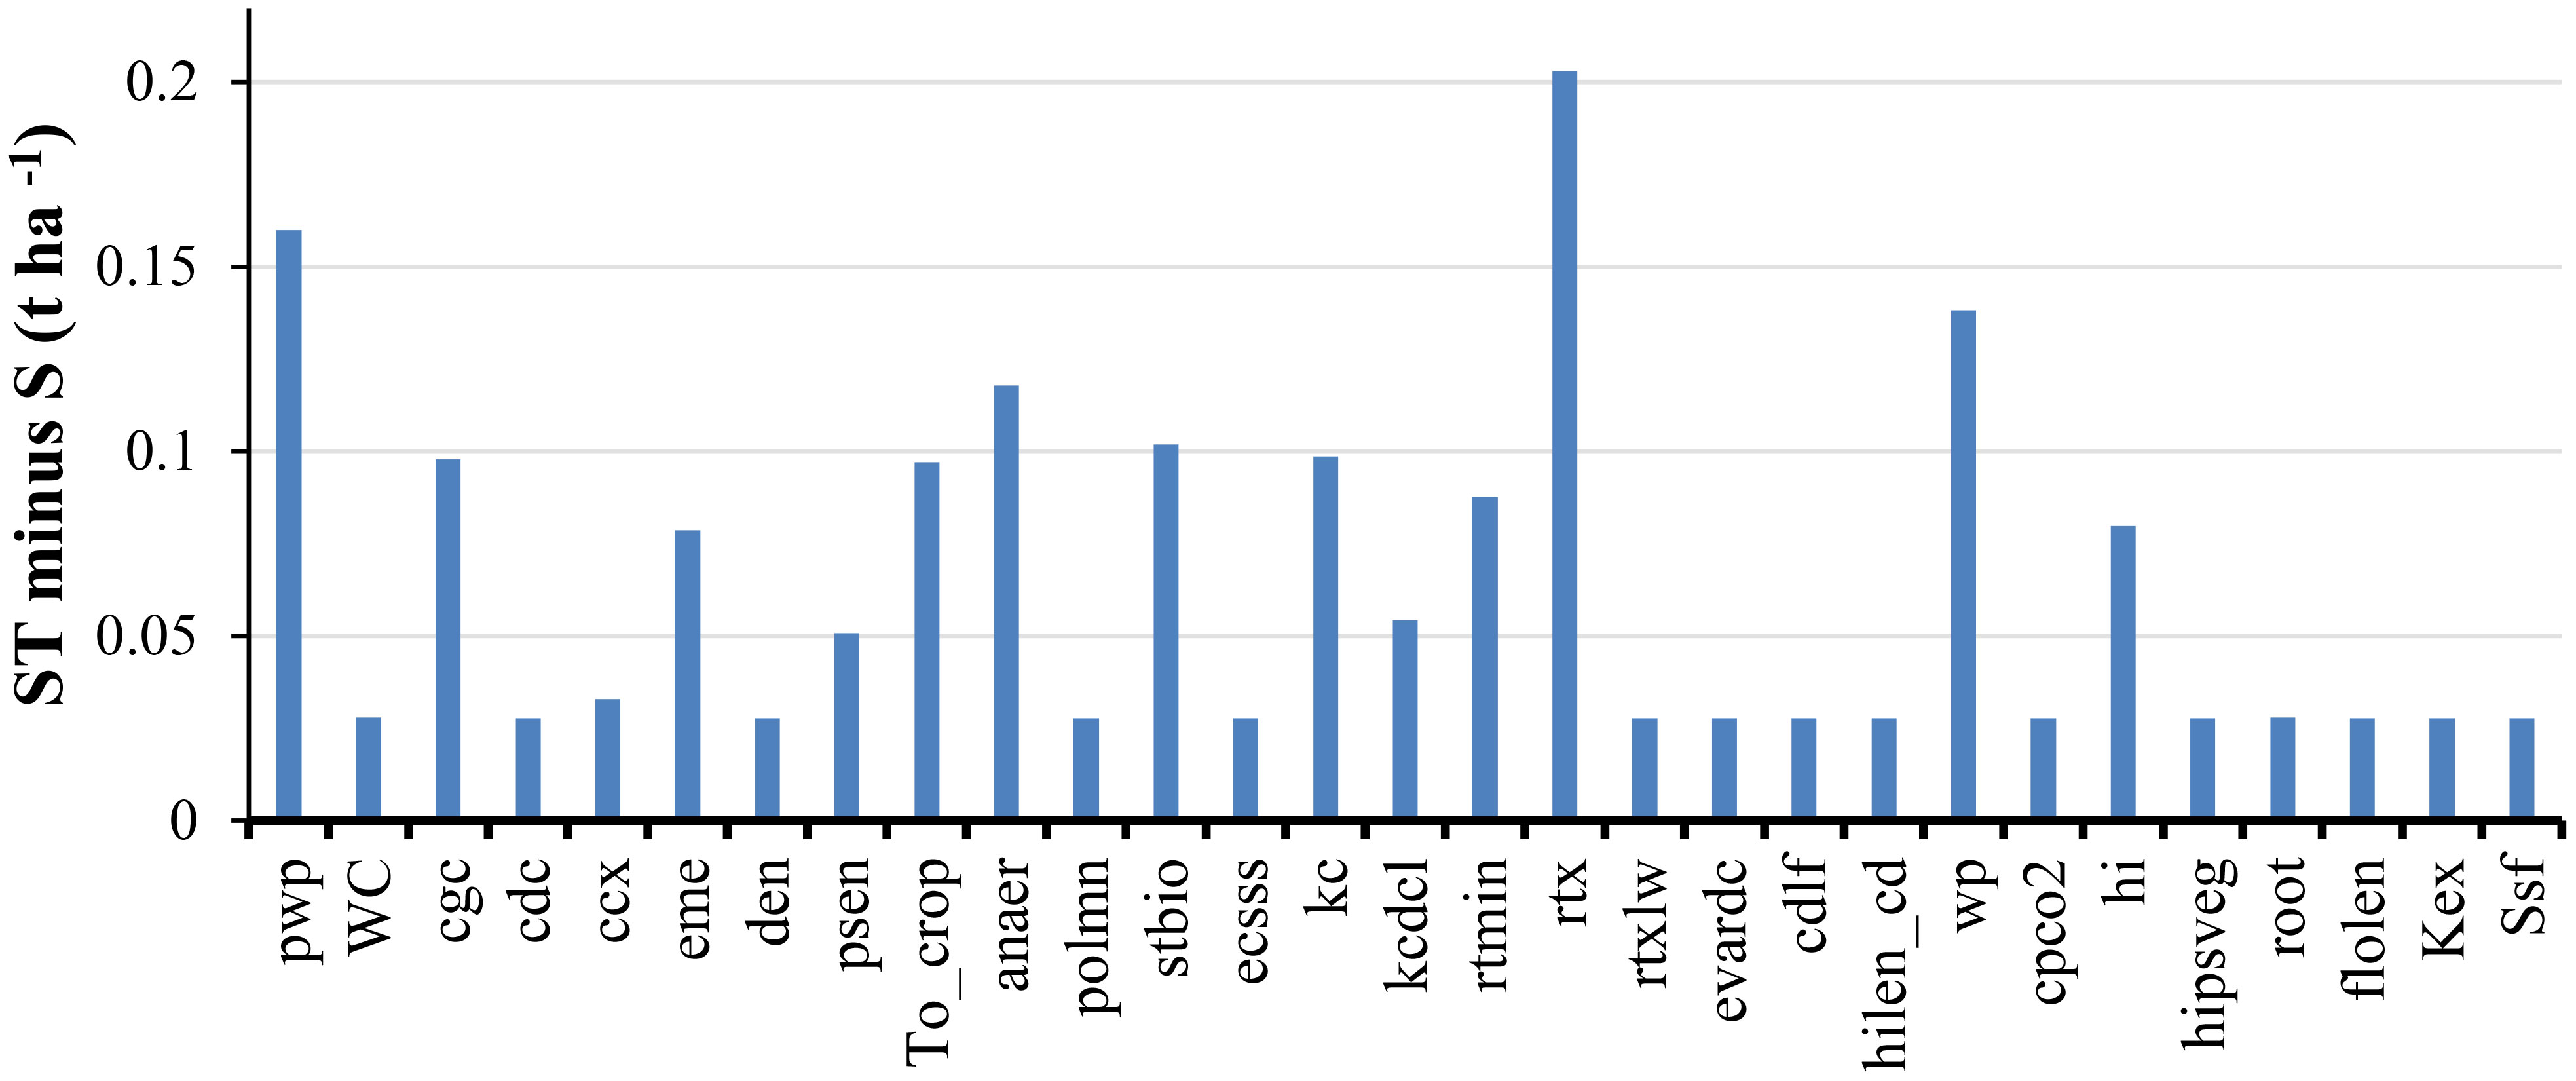
Figure 7 S and ST index values difference for identifying the parameter interactions.
According to these two indicators, pwp, cgc, ccx, anaer, stbio, rtmin, rtx, kc, and wp comprise the more effective parameters in the AquaCrop model. In addition to rtmin and rtx (root) and pwp (soil), other parameters (categories) including anaer, wp, and stbio (biomass), cgc, and ccx (canopy development), and kc (transpiration) were identified as the driving parameters in the study area. The ccx exerted the highest effect, followed by root and soil parameters.
Parameters ccx, rtx, pwp, wp, anaer, stbio, kc, cgc, and rtmin belonged to non-conservative parameters except for wp, stabio, kc and cgc. The results indicated there is no difference between conservative and non-conservative parameters when we study the crop growth model for new crop and climate conditions. So, sensitivity analysis on both conservative and non-conservative parameters has given a complete picture of the sensitivity of model outputs to model parameters and also helped to find the optimum range for each parameter. This is especially of great help to plant breeders, crop physiologists, and also agronomists to gain insight on more important traits that could influence crop performance and thus to direct their research efforts toward their optimization in practice.
3.4 Uncertainty analysis
A major issue in SA is determining the range of variation in parameters and their distribution (Vanuytrecht et al., 2014). Here, parameter distributions were considered uniform, and the range of variation was examined through field measurements in the study area and a literature review if the parameter had a physical definition. The names and features of all model parameters, their range of variation, and their source are presented in Appendix 1. Considering these two factors and their variability in each region, it is necessary to assess the extent of GSA uncertainty in the Morris method (i.e., sigma index). The obtained uncertainty values were used to examine the degree of validity and the percentage of certainty about the accuracy of the ranges of variation (Silvestro et al., 2017). Figure 8 presents the GSA uncertainty values of the AquaCrop model parameters obtained using the Morris method with respect to the crop yield variable as the model output. Of the 59 model parameters, the amounts of uncertainty for 7 and 4 parameters were, in respective order, more than 0.2 t ha−1 (psen, cdlf, hipsflo, flolen, cgc4ggd, cdc4ggd, and Kex) and 0.4 t ha−1 (psen, hipsflo, cdc4ggd, and Kex). The uncertainty for the remainder of parameters was less than 0.2 t ha−1, implying the accuracy (certainty) of their range of variation.
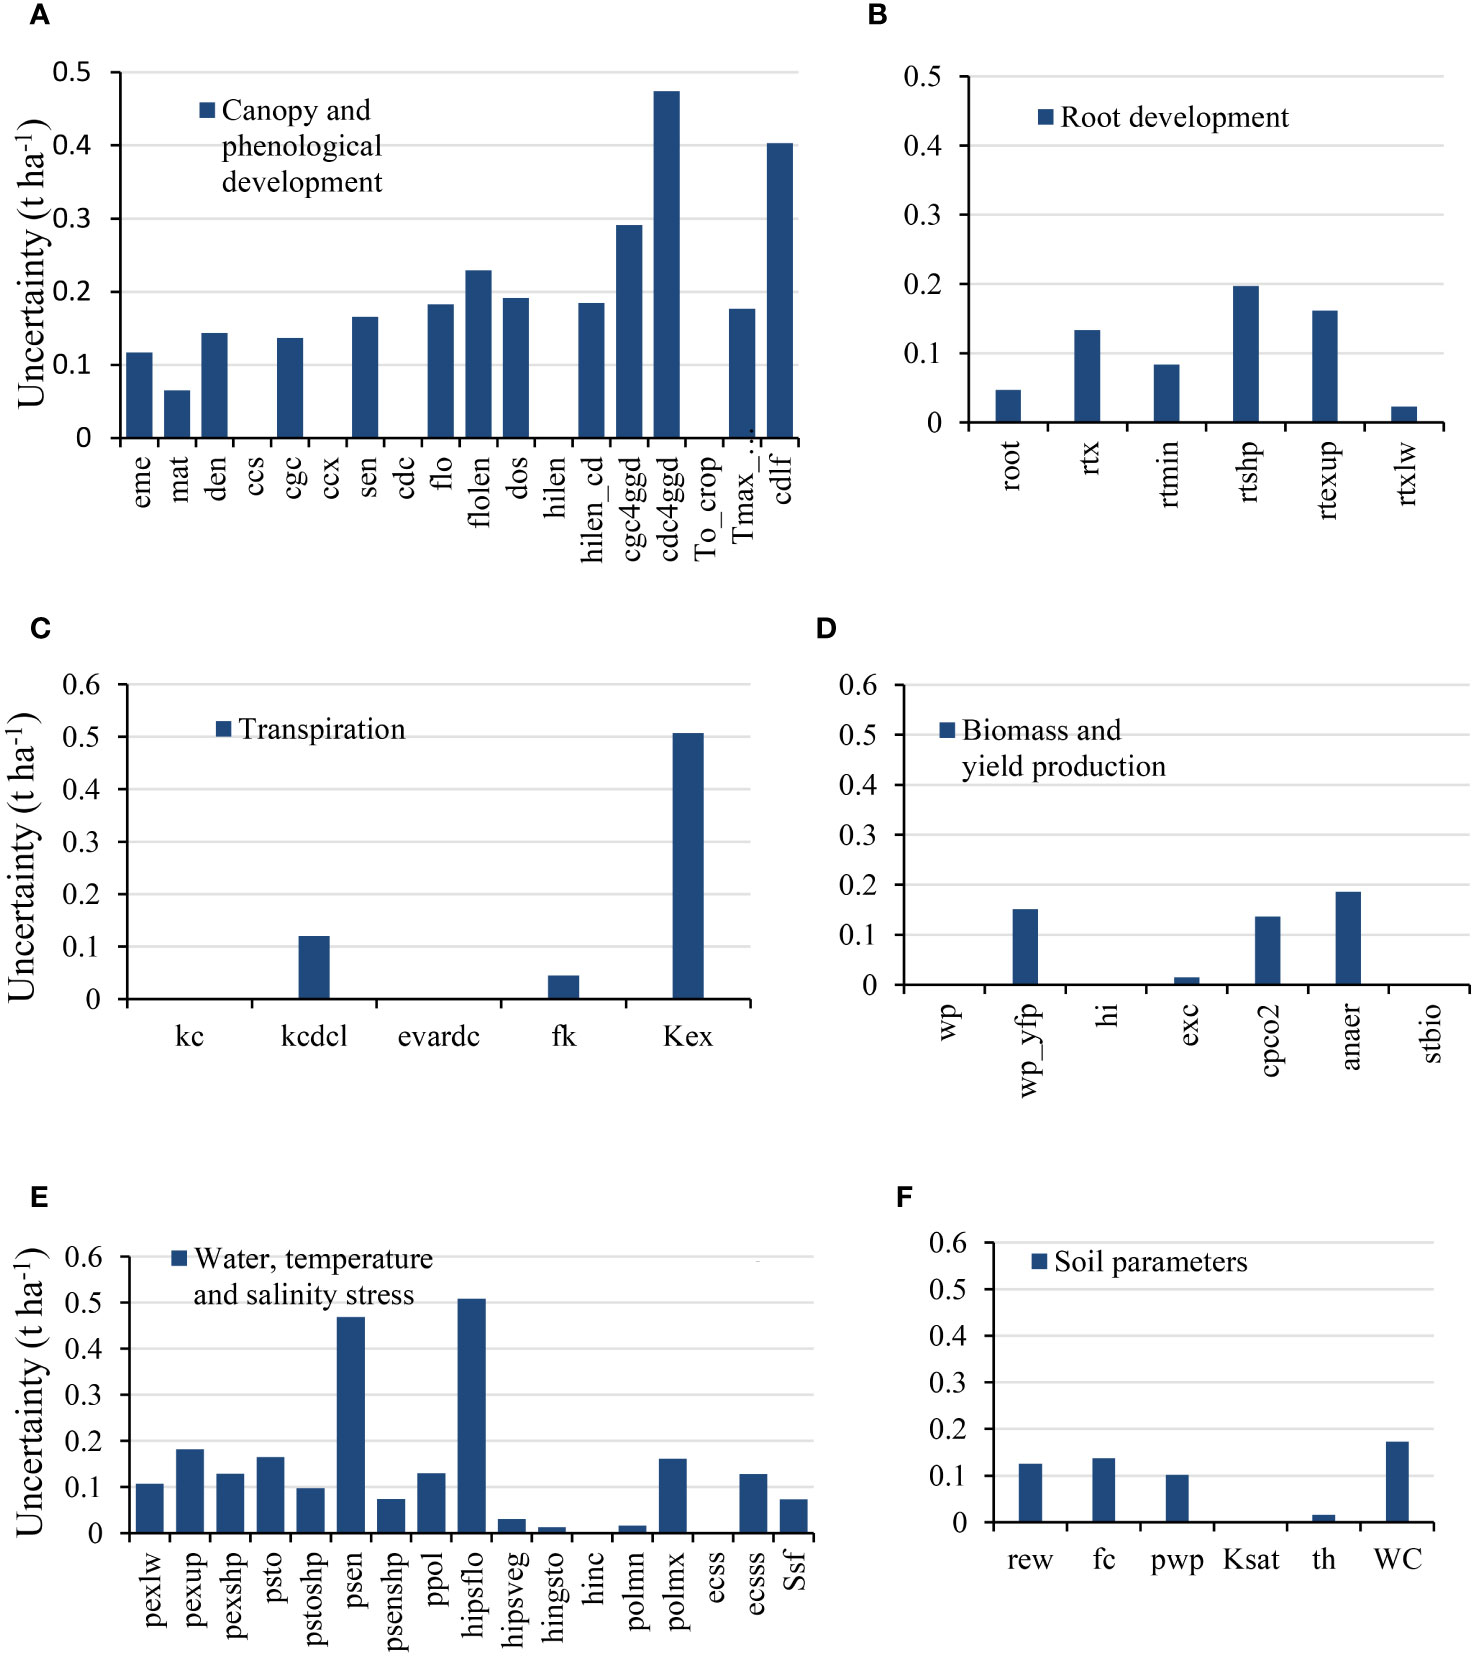
Figure 8 Morris method uncertainty values for different AquaCrop model parameters. (A) Canopy and phenological development; (B) Root development; (C) Transpiration; (D) Biomass and yield production; (E) Water, temperature, and salinity stress; (F) Soil parameters.
4 Discussion
We studied the GSA assessment of the AquaCrop model and identified the driving parameters for model calibration at the regional scale. Compared to field-based applications in crop growth models, uncertainty remains high among model parameters and input factors. Meanwhile, for data assimilation and crop model-based applications at the regional scale, there is less transparency and more complexity involved in discovering the optimized parameters. Finding these optimized parameters enables us to reduce uncertainty and increase the accuracy of the model output simulation.
The results of GSA are entirely driven by climatic and environmental conditions and the range of variation in the model parameters as well as input variables (Vanuytrecht et al., 2014). Therefore, variations in the GSA ranking based on different environmental conditions rule out any attempts to find a comprehensive list of key AquaCrop model parameters for all geographical areas to be used during calibration and parameter tuning. Accordingly, the question should divert to which climate–crop–soil–management parameters are more effective depending on the study area?
For this purpose, the present study conducted an GSA of the AquaCrop model through a combination of Morris and EFAST methods on silage maize cultivation in the climatic conditions between sub-tropical sub-humid and temperate sub-humid during summertime.
4.1 Morris results evaluation
The research findings make it possible to distinguish parameters between sensitive and less sensitive groups. In this study, 30 parameters were identified as negligible considering their minimal effect, thereby simplifying the model for silage maize given varying environmental conditions of the region. Considering this minimal effect, it is also possible to exclude such parameters from calibration, assimilation, or application of GSA in similar scenarios of plants or regions of study.
Silage maize is harvested prior to its senescence stage and at the beginning of its maturity, which explains why the sen and psenshp parameters (related to the plant senescence) and the hinc, hilen, hingsto, and mat parameters (related to the harvest index and maturity) were classified as less effective and negligible parameters. Water stress parameters concerning canopy expansion, stomatal closure, early canopy senescence, and before flowering (i.e., hipsflo, ppol, psto, pexlw, pexup, pexshp, and pstoshp), however, had little effect on growth.
The maximum temperature of the region reached 43°C in only a few days, mainly during the summer, ruling out the polmx parameter — featuring the maximum air temperature above which pollination starts to fail — as less effective given the conditions of this region. Although the temperature exceeded 30°C on most summer days, the Tmax-crop parameter — featuring the upper temperature bound, above which crop development stops — showed no significant effect on plant growth in the models’ output. Soil in the study area generally remained in normal EC ranges, determining ecss AquaCrop parameter as another less effective parameter. rtexup — featuring maximum root water extraction in the top quarter of the root zone — was also identified as a less effective parameter on silage maize since maize roots penetrate deeper into the soil. The ccs — featuring the soil surface covered by an individual seedling at 90% emergence — is another less effective parameter in this plant, closely followed by the den parameter, which signifies crop density. The effects of exc — featuring the excess of potential fruits, were also negligible since the plant under study is silage maize and not a fruit. Other parameters such as dos (day of sowing), rtshp (shape factor describing root zone expansion), rew (readily evaporable water from the top layer), and th (soil thickness of sampling) were also less effective for silage maize in the study region given the AquaCrop model.
According to Vanuytrecht et al. (2014), examinations of different environmental conditions in different regions have identified hinc, exc, pexup, ppol, polmx, rtexup, evardc, polmn, and rtxlw as parameters with negligible sensitivity (less than 0.25 t ha−1) in relation to the AquaCrop model’s output. In addition to the parameters extracted from Vanuytrecht et al. (2014), i.e., hinc, exc, pexup, ppol, polmx, and rtexup, the present study identified other less effective parameters as: fc, th, Ksat, rtshp, ecss, rew, psto, pexlw, pexshp, pstoshp, hipsflo, sen, psenshp, hilen, hingsto, mat, Tmax-crop, dos, ccs, flo, cgc4ggd, cdc4ggd, fk, and wp_yfp (Figure 5). Vanuytrecht et al. (2014) also stated that the parameters describing crop responses to water stress (pexup, pexlw, psen, hingsto, hipsflo, and hipsveg) and those related to soil water depletion levels for the induction of water stress (pexup, pexlw, psto, and psen) are rarely identified as highly effective parameters. In most areas, these parameters are less effective compared to the root and soil parameters (e.g., root, rtx, rtshp, fc, and pwp), a fact also confirmed by results obtained from the Morris method on silage maize in this study.
4.2 EFAST results evaluation
Literature revealed that the EFAST method is generally more robust than the Morris method (Cariboni et al., 2007; DeJonge et al., 2012; Silvestro et al., 2017). Also, EFAST enables us to distinguish between the first-order and higher-order effects of model parameters and identify their interaction with the model output variance.
The results of EFAST GSA revealed only a few parameters (12 out of 29) as maintaining stronger first-order effects, with the rest remaining less significant (small values). It can therefore be concluded that the effects of parameters on model output are mainly derived from the higher-order effects and the interactions between the parameters. Based on the higher-order effects, parameters with ST values less than 0.1 (less than 10% contribution to the output variance), including canopy and phenological development (cdc, eme, den, To-crop, cdlf, hilen-cd, flolen), water, temperature, and salinity stress (psen, polmn, ecsss, hipsveg, Ssf), transpiration (kcdcl, evardc, Kex), root (rtxlw, root), biomass and yield production (cpco2, hi), and soil (WC) (Figure 6) were considered as less effective parameters. These parameters can be assigned an average value, or a value in the range of variation, or the value measured during field measurement for model calibration.
The highest model sensitivity, as per the results, was observed for ccx, rtx, pwp, wp, anaer, stbio, kc, cgc, and rtmin, respectively. Considering the first- and higher-order effects in this region, in addition to the rtmin and rtx (root) and soil water content at the wilting point; pwp (soil) parameters, anaer, wp, stbio (biomass), kc (transpiration), cgc, and ccx (canopy development) parameters (category) were also identified as the most effective parameters (Figure 6). The maximum fCover (ccx) parameter exerted the highest effect, followed by root and soil parameters. This shows that in the case of silage maize in a semi-arid region with moderate to limited irrigation, the AquaCrop model is more sensitive to soil and root parameters than those concerning the crop response to water stress. Surprisingly, no water stress parameters were identified as highly effective. A related study reached a similar conclusion about the water stress parameters versus root and soil parameters by Vanuytrecht et al. (2014).
Vanuytrecht et al. (2014) acknowledged the most effective parameters for maize cultivation in sub-tropical sub-humid climatic conditions as root and soil parameters such as rtx and pwp, and for temperate conditions such as ccx, cgc, and stbio. As for the present study area, located in-between these two climate conditions (i.e., sub-tropical sub-humid and temperate conditions), ccx, cgc, and stbio were also identified in addition to root and soil parameters as significantly effective. However, the ranking of these parameters is different from that in Vanuytrecht et al. (2014). In Vanuytrecht et al. (2014), root and soil parameters are prioritized over ccx, cgc, and stbio parameters in certain areas and vice versa. However, ccx had a higher priority in the present study. This issue is fully dependent on different climate circumstances and their effect on GSA processing. Conversely, the more sensitive parameters have been found in this study indicated the existence of more interactions with other parameters (Figure 7) and must be accurately identified when calibrating the model.
4.3 Uncertainty analysis evaluation and final remark
A major point of GSA is to determine the range of variation in parameters and their distribution (Paleari and Confalonieri, 2016). Considering their variability in different regions, it is necessary to assess the extent of GSA uncertainty in the Morris method. Among the 59 parameters studied, the uncertainty of only a small number of parameters remained over 0.4 t ha−1, indicative of the high accuracy and certainty of variation ranges for parameters in this study (Figure 8).
Finally, it can be inferred that, in accordance with previous studies (e.g., Vanuytrecht et al., 2014; Silvestro et al., 2017; Upreti et al., 2020), applications of GSA for different environmental conditions in the Morris and EFAST methods make it possible to identify the most effective parameters prior to calibrating the AquaCrop model. Also, it further simplifies the model by considering the less effective parameters as constants, thereby reducing model complexity and calibration time. Moreover, it is possible to improve the accuracy of crop growth simulation and yield estimation by reducing the need for field data through model calibration using satellite data assimilation. For this purpose, and also to ensure that the execution of the calibrated model is not hindered by computational complexity, and to prevent failure in finding a response in the optimization loops, it is necessary to determine the minimum number of most effective parameters in the model output. Therefore, failure to correctly identify the most effective parameters for crops in a specific study area will both waste time and reduce the model’s calibration accuracy.
5 Conclusions
This study proceeded with a global sensitivity analysis that combines Morris and EFAST to identify the most sensitive parameters for calibrating the AquaCrop model. Consequently, the model is simplified, with the required time for calibration reduced and the model calibration accuracy increased. The GSA application for new climatic condition and crop type as opposed to previous studies in the AquaCrop model implemented in this study, we aimed to achieve more robustness conditions for the model and close the model to the reality. The findings revealed that (i) ccx, rtx, pwp, wp, anaer, stbio, kc, cgc, and rtmin had respectively higher sensitivity than other parameters, and (ii) in the water-driven AquaCrop model, soil and root parameters were more sensitive than those related to crop response to water stress in the case of silage maize in a semi-arid region with moderate to limited irrigation. Also, in agreement with Vanuytrecht et al. (2014), our results revealed the greater role of the soil and root parameters on the AquaCrop model as opposed to water stress parameters, which can make the model vulnerable in situations of shortage of water for irrigation, such as in the case of the study area. The effects of water stress parameters on soil, crop development, and root parameters remain indirect. As suggested by the obtained results, sensitivity analysis can be examined in a more realistic fashion by testing different ranges of variation for water stress parameters. In future studies, identifying and limiting to the key driving parameters may reduce computational complexity and lead to more accurate optimization of the model parameters through satellite data assimilation and simulation of crop yield output.
This study identified the most sensitive parameters, suggesting significant interactions with other parameters. Accurately calibrating these parameters becomes crucial for reliable model predictions. By pinpointing these sensitive parameters and their interactions, we provide valuable insights for plant breeders, crop physiologists, and agronomists. This knowledge empowers them to focus their research efforts on optimizing key traits that significantly influence crop performance in practice.
Data availability statement
The original contributions presented in the study are included in the article/Supplementary Material, further inquiries can be directed to the corresponding author/s.
Ethics statement
Written informed consent was obtained from the individual(s) for the publication of any potentially identifiable images or data included in this article.
Author contributions
EA: Writing – review & editing, Writing – original draft, Visualization, Validation, Software, Resources, Methodology, Investigation, Formal Analysis, Data curation, Conceptualization. AD: Writing – review & editing, Supervision, Methodology, Investigation, Conceptualization. JV: Writing – review & editing, Methodology, Investigation, Conceptualization. SP: Writing – review & editing, Methodology, Conceptualization. NN: Writing – review & editing, Conceptualization. SS: Writing – review & editing, Conceptualization. SH: Writing – review & editing, Conceptualization.
Funding
The author(s) declare that no financial support was received for the research, authorship, and/or publication of this article.
Acknowledgments
The authors deeply appreciate the great support from farmers and organization of agriculture in Ghale-Nou County in this research.
Conflict of interest
The authors declare that the research was conducted in the absence of any commercial or financial relationships that could be construed as a potential conflict of interest.
The reviewer HE declared a shared affiliation with the authors AB, NS and SH to the handling editor at the time of review.
Publisher’s note
All claims expressed in this article are solely those of the authors and do not necessarily represent those of their affiliated organizations, or those of the publisher, the editors and the reviewers. Any product that may be evaluated in this article, or claim that may be made by its manufacturer, is not guaranteed or endorsed by the publisher.
Supplementary material
The Supplementary Material for this article can be found online at: https://www.frontiersin.org/articles/10.3389/fagro.2024.1304611/full#supplementary-material
References
Abi Saab M. T., Todorovic M., Albrizio R. (2015). Comparing AquaCrop and CropSyst models in simulating barley growth and yield under different water and nitrogen regimes. Does calibration year influence the performance of crop growth models? Agric. Water Manage. 147, 21–33. doi: 10.1016/j.agwat.2014.08.001
Akbari E., Darvishi Boloorani A., Neysani Samany N., Hamzeh S., Soufizadeh S., Pignatti S. (2020a). Estimating the spatial-temporal distribution of Leaf Area Index using Sentinel-2 satellite images (Case study: silage maize farms of South of Tehran). Iranian J. Irrigation Drainage 14 (3), 967–980. doi: 20.1001.1.20087942.1399.14.3.20.7
Akbari E., Darvishi Boloorani A., Neysani Samany N., Hamzeh S., Soufizadeh S., Pignatti S. (2020b). Crop mapping using random forest and particle swarm optimization based on multi-temporal Sentinel-2. Remote Sens. 12 (9), 1449. doi: 10.3390/rs12091449
Akbari E., Darvishi Boloorani A., Neysani Samany N., Hamzeh S., Soufizadeh S., Pignatti S. (2020c). Deriving the leaf area index of silage maize using digital hemispherical photography method (Case study: Qaleh-Now farms, south of Tehran). Iranian J. Soil Water Res. 51, 1331–1340. doi: 10.22059/ijswr.2020.296569.668483. Persian.
Akbari E., Darvishi Boloorani A., Verrelst J., Pignatti S., Neysani Samany N., Soufizadeh S., et al. (2023). Biophysical variable retrieval of silage maize with Gaussian process regression and hyperparameter optimization algorithms. Remote Sens. 15, 3690. doi: 10.3390/rs15143690
Andarzian, Bannayan M., Steduto P., Mazraeh H., Barati M. E., M.A. and Rahnama A. (2011). Validation and testing of the AquaCrop model under full and deficit irrigated wheat production in Iran. Agric. Water Manage. 100, 1–8. doi: 10.1016/j.agwat.2011.08.023
Busetto L., Casteleyn S., Granell C., Pepe M., Barbieri M., Campos-taberner M., et al. (2017). Downstream services for rice crop monitoring in Europe: From regional to local scale. IEEE J. Selected Topics Appl. Earth Observations Remote Sens. 10, 5423–5441. doi: 10.1109/JSTARS.4609443
Cariboni J., Gatelli D., Liska R., Saltelli A. J. E. M. (2007). The role of sensitivity analysis in ecological modelling. Ecol. Model. 203, 167–182. doi: 10.1016/j.ecolmodel.2005.10.045
Chen Y., Cournède P. H. (2014). Data assimilation to reduce uncertainty of crop model prediction with convolution particle filtering. Ecol. Model. 290, 165–177. doi: 10.1016/j.ecolmodel.2014.01.030
Confalonieri R., Bellocchi G., Bregaglio S., Donatelli M., Acutis M. (2010a). Comparison of sensitivity analysis techniques: a case study with the rice model WARM. Ecol. Model. 221, 1897–1906. doi: 10.1016/j.ecolmodel.2010.04.021
Confalonieri R., Bellocchi G., Tarantola S., Acutis M., Donatelli M., Genovese G. (2010b). Sensitivity analysis of the rice model WARM in Europe: exploring the effects of different locations, climates and methods of analysis on model sensitivity to crop parameters. Environ. Model. Software 25, 479–488. doi: 10.1016/j.envsoft.2009.10.005
DeJonge K. C., Ascough J. C. II, Ahmadi M., Andales A. A., Arabi M. (2012). Global sensitivity and uncertainty analysis of a dynamic agroecosystem model under different irrigation treatments. Ecol. Model. 231, 113–125. doi: 10.1016/j.ecolmodel.2012.01.024
Franczyk A. (2019). Using the Morris sensitivity analysis method to assess the importance of input variables on time-reversal imaging of seismic sources. Acta Geophysica 67, 1525–1533. doi: 10.1007/s11600-019-00356-5
Ghasemizade M., Baroni G., Abbaspour K., Schirmer M. (2017). Combined analysis of time-varying sensitivity and identifiability indices to diagnose the response of a complex environmental model. Environ. Model. software 88, 22–34. doi: 10.1016/j.envsoft.2016.10.011
Guo D., Zhao R., Xing X., Ma X. (2020). Global sensitivity and uncertainty analysis of the AquaCrop model for maize under different irrigation and fertilizer management conditions. Arch. Agron. Soil Sci. 66, 1115–1133. doi: 10.1080/03650340.2019.1657845
Jin X. L., Feng H. K., Zhu X. K., Li Z. H., Song S. N., Song X. Y., et al. (2014). Assessment of the AquaCrop model for use in simulation of irrigated winter wheat canopy cover, biomass, and grain yield in the North China Plain. PLoS One 9, e86938. doi: 10.1371/journal.pone.0086938
Kasampalis D. A., Alexandridis T. K., Deva C., Challinor A., Moshou D., Zalidis G. (2018). Contribution of remote sensing on crop models: a review. J. Imaging 4, 52. doi: 10.3390/jimaging4040052
Katerji N., Campi P., Mastrorilli M. (2013). Productivity, evapotranspiration, and water use efficiency of corn and tomato crops simulated by AquaCrop under contrasting water stress conditions in the Mediterranean region. Agric. Water Manage. 130, 14–26. doi: 10.1016/j.agwat.2013.08.005
Li Z. H., Jin X. L., Liu H. L., Xu X. G., Wang J. H. (2019). Global sensitivity analysis of wheat grain yield and quality and the related process variables from the DSSAT-CERES model based on the extended Fourier Amplitude Sensitivity Test method. J. Integr. Agric. 18, 1547–1561. doi: 10.1016/S2095-3119(18)62046-5
Liu J., Pattey E., Admiral S. (2013). Assessment of in situ crop LAI measurement using unidirectional view digital photography. Agric. For. Meteorology 169, 25–34. doi: 10.1016/j.agrformet.2012.10.009
Ma H., Wang J., Liu T., Guo Y., Zhou Y., Yang T., et al. (2023). Time series global sensitivity analysis of genetic parameters of CERES-maize model under water stresses at different growth stages. Agric. Water Manage. 275, 108027. doi: 10.1016/j.agwat.2022.108027
Mkhabela M. S., Bullock P. R. (2012). Performance of the FAO AquaCrop model for wheat grain yield and soil moisture simulation in Western Canada. Agric. Water Manage. 110, 16–24. doi: 10.1016/j.agwat.2012.03.009
Morel J., Bégué A., Todoroff P., Martiné J. F., Lebourgeois V., Petit M. (2014). Coupling a sugarcane crop model with the remotely sensed time series of fIPAR to optimise the yield estimation. Eur. J. Agron. 61, 60–68. doi: 10.1016/j.eja.2014.08.004
Morris M. D. (1991). Factorial sampling plans for preliminary computational experiments. Technometrics 33, 161–174. doi: 10.1080/00401706.1991.10484804
Paleari L., Confalonieri R. (2016). Sensitivity analysis of a sensitivity analysis: We are likely overlooking the impact of distributional assumptions. Ecol. Model. 340, 57–63. doi: 10.1016/j.ecolmodel.2016.09.008
Pianosi F., Beven K., Freer J., Hall J. W., Rougier J., Stephenson D. B., et al. (2016). Sensitivity analysis of environmental models: A systematic review with practical workflow. Environ. Model. Software 79, 214–232. doi: 10.1016/j.envsoft.2016.02.008
Prescott J. A. (1940). Evaporation from water surface in relation to solar radiation, Transactions of The Royal Society of South Australia, Trans. Roy. Soc. S. Aust Vol. 40. 114–118.
Raes D. (2017). AquaCrop training handbooks Book I. Understanding AquaCrop (Rome. Italy: Food and Agriculture Organization of the United Nations).
Raes D., Steduto P., Hsiao T., Fereres E. (2017a). AquaCrop Version 6.0 Reference Manual. Annex I (Rome, Italy: Food Agric. Organ. United Nations). Available at: https://www.fao.org/land-water/databases-and-software/aquacrop/en/.
Raes D., Steduto P., Hsiao T. C., Fereres E. (2017b). AquaCrop. FAO Crop – Water productivity model to simulate yield response to water Software. 25, pp.1508-1517. Ref. Manual. Ver. 6 (Rome. Italy: FAO. L. Water Div).
Rahimikhoob H., Sohrabi T., Delshad M. (2024). Variance-based global sensitivity analysis and uncertainty quantification of the AquaCrop model parameters for basil (Ocimum basilicum L.) under different nitrogen fertilizer rates. Journal of Plant Nutrition 47 (4), 628–645. doi: 10.1080/01904167.2023.2280142
Richter K., Atzberger C., Hank T. B., Mauser W. (2012). Derivation of biophysical variables from Earth observation data: validation and statistical measures. J. Appl. Remote Sens. 6, 063557–063557. doi: 10.1117/1.JRS.6.063557
Roundy J. K. (2009). Uncertainty analysis for land surface model predictions: Application to the simple Biosphere 3 and Noah models at tropical and semiarid locations (Utah State University, Logan, Utah).
Saltelli A., Annoni P. (2010). How to avoid a perfunctory sensitivity analysis. Environ. Model. Software 25, 1508–1517. doi: 10.1016/j.envsoft.2010.04.012
Saltelli A., Ratto M., Andres T., Campolongo F., Cariboni J., Gatelli D., et al. (2008). Global Sensitivity Analysis: The Primer (New York: Wiley).
Saltelli A., Tarantola S., Campolongo F. (2000). Sensitivity analysis as an ingredient of modeling. Stat. Sci., 377–395.
Saltelli A., Tarantola S., Chan K. P.-S. (1999). A quantitative model-independent method for global sensitivity analysis of model output. Technometrics 41, 39–56. doi: 10.1080/00401706.1999.10485594
Silvestro P. C., Pignatti S., Yang H., Yang G., Pascucci S., Castaldi F., et al. (2017). Sensitivity analysis of the Aquacrop and SAFYE crop models for the assessment of water limited winter wheat yield in regional scale applications. PLoS One 12, 1–30. doi: 10.1371/journal.pone.0187485
Song M., Feng H., Li Z., Gao J. (2014). Global sensitivity analyses of DSSAT-CERES-wheat model using Morris and EFAST methods. Nongye Jixie Xuebao= Trans. Chin. Soc. Agric. Machinery 45, 124–166. doi: 10.6041/j.issn.1000-1298.2014.10.020
Specka X., Nendel C., Wieland R. (2019). Temporal sensitivity analysis of the MONICA model: Application of two global approaches to analyze the dynamics of parameter sensitivity. Agriculture 9, 37. doi: 10.3390/agriculture9020037
Steduto P., Hsiao T. C., Raes D., Fereres E. (2009). AquaCrop—The FAO crop model to simulate yield response to water: I. Concepts and underlying principles. Agron. J. 101, 426–437. doi: 10.2134/agronj2008.0139s
Sun X. Y., Newham L. T., Croke B. F., Norton J. P. (2012). Three complementary methods for sensitivity analysis of a water quality model. Environ. Model. Software 37, 19–29. doi: 10.1016/j.envsoft.2012.04.010
Upreti D., Pignatti S., Pascucci S., Tolomio M., Li Z., Huang W., et al. (2020). A Comparison of moment-independent and variance-based global sensitivity analysis approaches for wheat yield estimation with the Aquacrop-OS model. Agronomy 10, 607. doi: 10.3390/agronomy10040607
Vanuytrecht E., Raes D., Willems P. (2014). Global sensitivity analysis of yield output from the water productivity model. Environ. Model. Software 51, 323–332. doi: 10.1016/j.envsoft.2013.10.017
Wang J., Li X., Lu L., Fang F. (2013). Parameter sensitivity analysis of crop growth models based on the extended Fourier Amplitude Sensitivity Test method. Environ. Model. software 48, 171–182. doi: 10.1016/j.envsoft.2013.06.007
Xia T., Miao Y., Wu D., Shao H., Khosla R., Mi G. (2016). Active optical sensing of spring maize for in-season diagnosis of nitrogen status based on nitrogen nutrition index. Remote Sens. 8, 605. doi: 10.3390/rs8070605
Xiangxiang W., Quanjiu W., Jun F., Qiuping F. (2013). Evaluation of the AquaCrop model for simulating the impact of water deficits and different irrigation regimes on the biomass and yield of winter wheat grown on China's Loess Plateau. Agric. Water Manage. 129, 95–104. doi: 10.1016/j.agwat.2013.07.010
Xing H., Xu X., Yang F., Feng H., Yang G. (2016). “July. Global sensitivity analysis of winter wheat yield and process-based variable with AquaCrop model,” in 2016 IEEE International Geoscience and Remote Sensing Symposium (IGARSS). (Beijing, China: IEEE) 5929–5932. doi: 10.1109/IGARSS.2016.7730549
Xing H. M., Xu X. G., Li Z. H., Chen Y. J., Feng H. K., Yang G. J., et al. (2017). Global sensitivity analysis of the AquaCrop model for winter wheat under different water treatments based on the extended Fourier amplitude sensitivity test. J. Integr. Agric. 16, 2444–2458. doi: 10.1016/S2095-3119(16)61626-X
Keywords: global sensitivity analysis, AquaCrop model, Morris, EFAST, silage maize
Citation: Akbari E, Darvishi Boloorani A, Verrelst J, Pignatti S, Neysani Samany N, Soufizadeh S and Hamzeh S (2024) How global sensitive is the AquaCrop model to input parameters? A case study of silage maize yield on a regional scale. Front. Agron. 6:1304611. doi: 10.3389/fagro.2024.1304611
Received: 25 October 2023; Accepted: 29 March 2024;
Published: 16 April 2024.
Edited by:
Marco Bindi, University of Florence, ItalyReviewed by:
Hamed Ebrahimian, University of Tehran, IranBlessing Masasi, North Carolina Agricultural and Technical State University, United States
Amir Hajjarpoor, Julius Kühn Institute, Germany
Copyright © 2024 Akbari, Darvishi Boloorani, Verrelst, Pignatti, Neysani Samany, Soufizadeh and Hamzeh. This is an open-access article distributed under the terms of the Creative Commons Attribution License (CC BY). The use, distribution or reproduction in other forums is permitted, provided the original author(s) and the copyright owner(s) are credited and that the original publication in this journal is cited, in accordance with accepted academic practice. No use, distribution or reproduction is permitted which does not comply with these terms.
*Correspondence: Elahe Akbari, e.akbari@hsu.ac.ir