 P. Martin-Salvador
 R. H. Verschueren3
 A. Kumar
- 1Pharmaceutical Engineering Research Group (PharmaEng), Department of Pharmaceutical Analysis, Ghent University, Ghent, Belgium
- 2Laboratory of Pharmaceutical Process Analytical Technology (LPPAT), Department of Pharmaceutical Analysis, Ghent University, Ghent, Belgium
- 3Research and Development, PartiX NV, Leuven, Belgium
Cold plasma coating technology for surface functionalization of pharmaceutical powder particles is a promising approach to introduce new characteristics such as controlled release layers, improved powder flow properties, stability coatings, and binding of active components to the surface. This is typically achieved in a fluidized bed reactor, where a jet containing the chemical precursor and the plasma afterglow is introduced through a nozzle while extra fluidization gas is injected from the bottom plate. However, the process requires proper mixing of the particles and precursor inside the plasma active zone to ensure a homogeneous coating of all particles. Therefore, such coating processes are challenging to optimize, given the complex phenomena involved in fluidization, plasma species reactions, and surface reactions. In this study, we use the CFD-DEM approach as implemented in the CFDEM®coupling package to model the process. The functionalization rate is modeled as mass transfer from the surrounding gas onto the particles, using a plasma coating zone where this transfer may happen. Mass transfer is switched off outside this zone. The DEM contact parameters and drag force are calibrated to our cellulose beads model powder using experimental tests composed by the FT4 rheometer and spouting tests. We show that while the chemistry can make or break the process, the equipment design and process conditions have a non-negligible effect on the coating metrics and thus must be considered. Cases where the fluidization flow is not high enough to produce good mixing have a high coefficient of variation of the coating mass, and therefore, they must be avoided. In addition, we also proposed an extrapolation procedure to provide results at longer coating times, showing that it is possible to predict coating performance even when simulations of the process for more than a minute are not computationally efficient.
1 Introduction
Plasma, the ionized state of matter, is made of a mixture of neutral and charged species depending on its degree of ionization. It is named thermal or non-thermal plasma, whether in equilibrium or not. When used in conjunction with appropriate gases or vapors that can create reactive species, non-thermal plasmas offer a platform to generate thin coatings on a wide variety of substrates (Snyders et al., 2023). Typically, these coatings or functionalizations are made by polymerization of monomers or coating precursors. The value of plasma is that it offers an activating environment in which even typically non-reactive vapors can bond to inert surfaces (Dufour, 2023). The technology holds potential for many industrial applications. For example, functionalized sulfur powder holds potential for Li-S batteries (Shafique et al., 2023), or the surface of hydrophilic materials can be turned hydrophobic (Rendon-Piedrahita et al., 2022). Specifically for pharmaceutical powders, it has been used as a treatment for oral delayed release of Omeprazole (Trimukhe et al., 2021), sustained low-dose release of ampicillin (Cavallaro and Vasilev, 2015), or increased flowability of cohesive salicylic acid (Roth et al., 2012).
The application of plasma treatments on powders offers advantages over other coating techniques, for example, the fact that no solvents need to be used. This has obvious advantages, such as avoiding the need to evaporate the solvent, thus reducing energy requirements. In addition, the process allows the creation of very thin coatings, in the nanometers scale (Snyders et al., 2023), while also avoiding the agglomeration of fine particles which occurs in wet coating processes. However, this creates significant challenges as handling powders in a plasma reactor differs greatly from handling 2D surfaces such as wafers or textiles. One approach is fluidizing the powder to provide good mixing while the plasma afterglow and the coating precursors are injected from the bottom of the fluidized bed reactor. This is analogous to the fluidized bed (wet) coating process, where a coating solution is sprayed on the fluidized or in-circulation powder in the reactor.
The main quality attributes of the coating process are the amount of coating applied and its homogeneous distribution over the surface of the powder particles. The best measure for the coating homogeneity in pharmaceutical applications is the coefficient of variation CV (Turton, 2008), defined as the coating standard deviation divided by the mean (Eq. 1).
Given the novel nature of the technology, extensive testing is expected to determine the optimal gas flows, particle loading, or precursor flow rates. These are challenging parameters to determine experimentally, and often, they need to be obtained on a trial-and-error basis, providing no mechanistic insights. In contrast, simulations can be a valuable tool to provide insight into the effect of process conditions on the quality attributes. Several approaches can be used to model the evolution of the CV during the coating process. Examples include population balances with compartmentalization (Ronsse et al., 2007), or a Monte Carlo technique (Pandey et al., 2006). More recently, however, an increasing number of studies have successfully applied Computational Fluid Dynamics coupled with Discrete Element Method (CFD-DEM) to coating systems to account for the effects of mesoscale phenomena. For example (Song et al., 2017), included in the CFD-DEM model the effect of wet particles in their simulations of a fluidized bed (Askarishahi et al., 2017), included evaporation of the solvent in their simulations of a spray coating fluidized bed (Liu et al., 2019), simulated coating by assuming droplets are homogeneously distributed on the surface of the particles, a similar approach was followed by (Grohn et al., 2020; Jiang et al., 2020) even included the intra-particle coating differences as a Monte Carlo model to the CFD-DEM simulation.
In this work, we use the CFD-DEM method to model the fluidization process, which, coupled with a mass transfer model, serves to predict both the average coating thickness and its distribution among the particles to calculate the CV accurately.
2 Modelling methodology
This work uses the CFD-DEM method, as implemented in the open-source software CFDEMcoupling (Goniva et al., 2012), which combines OpenFOAM and LIGGGHTS. The method has been extensively discussed, e.g. (Blais et al., 2019), for the DEM side and (Zhou et al., 2010) for the coupling of DEM and CFD.
2.1 Fluid and particle motion
The governing equations used for the fluid phase are Eqs 2 and 3,
which correspond to (Zhou et al., 2010) model type II, generally known as model A. The fluid-particle forces are the viscous forces and pressure gradient forces, both shown in the first two terms of Eq. 3, and the fluid-particle forces Fpf, which can represent several forces, of which only the most dominant is used, namely, the drag force.
The governing equations for the particles are for translational and rotational motion, expressed for each particle i as:
The contact forces and torque (fc,ij, fd,ij, Mij) are evaluated using the Hertzian Spring Dashpot model, which computes the normal and tangential forces acting when two particles overlap. No force is computed when particles do not overlap. The model uses elastic and viscoelastic constants, which can be related to the particle properties - Young’s modulus, Poisson ratio, coefficient of restitution, and coefficient of friction. No cohesion model has been included, as the chosen particles are large, Geldart Group B particles, which ensures that cohesive forces can be avoided in DEM models (LaMarche et al., 2022) in favor of simpler models which are generally preferable (Ketterhagen and Wassgren, 2022).
Note that Eqs 4, 5 assume particles with constant mass. While this is not the case in the modeled system, the mass difference due to coating is negligible (in the order of 5% in a 30-min process). Golshan et al. (2020) discusses that the missing terms in Eqs 4, 5, which are
Of the fluid-particle forces (fpf,i), in this work the pressure gradient, viscous, and drag forces are used. The first two correspond to the fluid equation formulation in Eq. 3, and for the drag force, that of Beetstra et al. (2007) is used, with coarsening corrections from Radl and Sundaresan (2014). Pietsch et al. (2017) compared several drag models in a similar system and found that this drag model reproduced well the experimental data. In this case, other forces, such as virtual mass force or rotational effects due to fluid-particle interactions, are negligible.
2.2 Coating
The coating precursor and fluidization gas are defined as the two gaseous species. Therefore, the species conservation equation must be solved on the fluid side, with i being either N2 or the coating precursor.
The mass source term Sm included in the coating precursor equation transfers it to the particle surface. The rate of coating for particle i is
The particle surface area ai is evaluated for a perfect sphere, and the mass transfer coefficient is evaluated from modified Gunn correlation from Deen et al. (2014). The transfer coefficient should, in fact, also account for the reaction rate of the coating precursor to become coating. This has been simplified in Eq. 7, and only mass transfer is considered. This assumption implies that the reaction rate is much faster than the transfer rate.
The mass source term in Eq. 6 is the summation of the change in particle mass over all particles in a CFD cell, with the opposite sign. By assuming that particles are coated homogeneously, the particle mass can be used to track how much coating each particle has received.
2.3 Coarse-graining and longer coating times
The main drawback of CFD-DEM models is the computational time required. It is common practice to use the coarse-graining method to reduce the burden from the DEM side of the calculation. The particles are joined into grains, and calculations are performed only on grains. The cutback in accuracy is minimal compared to other solutions while providing simulation speed-ups of orders of magnitude (Lu et al., 2017). The coarse-graining factor cg is defined as Eq. 8,
which implies a reduction of the number of entities to be simulated by cg3. The implications of coarse-graining on the contact forces calculation are discussed by (Renzo et al., 2021). In the coating part of the model, the real particle diameter is used in all calculations to calculate for a single particle. Then, a factor cg3 is used when adding all particles within a CFD cell to obtain the mass source term.
Although simulations of a few tens of seconds are possible in a workstation thanks to coarse graining, it is not yet possible to simulate a batch coating process for its entire process duration. A typical batch plasma coating process runs from 15 min to 1 h or more. Some authors have combined CFD-DEM simulations with other methods to overcome this limitation. For example (Kieckhefen et al., 2019), used recurrence to extrapolate a few seconds of simulation to an hour process (Madlmeir et al., 2021). used a Monte Carlo coating model, which was first calibrated from the results of their CFD-DEM simulations. However, this is not needed in some cases, as identifying flow pattern deficiencies for a set of operating conditions can be enough to disregard them as optimal. In this work, we turn to the good mixing provided by the fluidized bed: a normal distribution of the coating mass is expected, as demonstrated later in Section 4.5. The mean coating mass on the particles will increase linearly with time, and the standard deviation will increase as the square root of time if the system is perfectly mixed, analogous to Brownian motion. This is also analogous to the work of Mann (1983), which shows that in a spouted bed with the constant addition of coating, a normal distribution is developed after infinite time, but that after 20 cycle times, it already can be approximated. He shows that the mean coating mass is μ = W0t/μT, with T denoting the cycle time, and the standard deviation is
They state that given αi determined by the simulated part of the process, the CV (Eq. 1) can be obtained for any arbitrarily long period of coating. We use empirical αi instead of the physical cycle time concept to avoid defining a cycle time on our fluidized bed. In addition, the normal distribution of the expected coating can be reconstructed at later times by extrapolating the mean and standard deviation. With this, if the simulated part of the process identifies good mixing is present, the extrapolation is a simplified process. Should poor mixing be identified, this procedure to predict coating at longer times would fail. However, such operating conditions should be immediately disregarded as suboptimal and, therefore, never get into the extrapolation stage.
3 Materials and methods
First, the relevant DEM contact parameters are calibrated, the CFD-DEM model is validated, and the coating equation is verified. Only then is the complete model, including the coating, used to simulate the coating process. Table 1 summarizes the steps followed in this study.
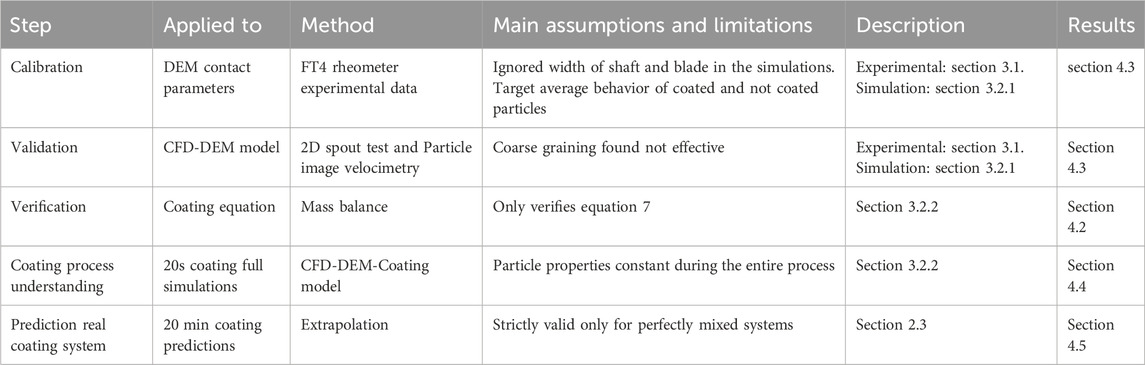
TABLE 1. Overview of the steps followed in this study.
3.1 Preliminary experiments
FT4: A powder rheometer (FT4, Freeman Technology, Malvern, United Kingdom) is used to calibrate the friction coefficient used to obtain the contact forces from Section 2.1. Vivapur Microcrystalline cellulose (MCC) spheres (JRS Pharma, Rosenberg, DE) have been chosen as test material due to their low cohesion properties, which allows neglecting cohesive force in the contact force model. The cohesion index of MCC is only 2.88, as measured in a GranuDrum instrument. At the same time, e.g., milled quartz sand, for comparison, has a cohesion index of 20 (Baesso et al., 2021), and for lactose powder is 45 (Neveu et al., 2022). For this reason, previous studies have modeled this material with the same assumption (Rouabah et al., 2022; Zheng et al., 2022). 100 g of MCC are loaded in the 50 mm vessel, and air is injected from the bottom attachment at 4.7 L/min. Dimensions of the FT4 rheometer are also shown in Figure 1A. The helix angle αh is kept at 5 deg with a tip speed of 100 mm/s. A preconditioning run is used before the test run to maximize repeatability, and tests are conducted in triplicate. The instrument logs the work required to move the blade at run time, calculated from the contributions of torque and vertical force as Eq. 11 shows.
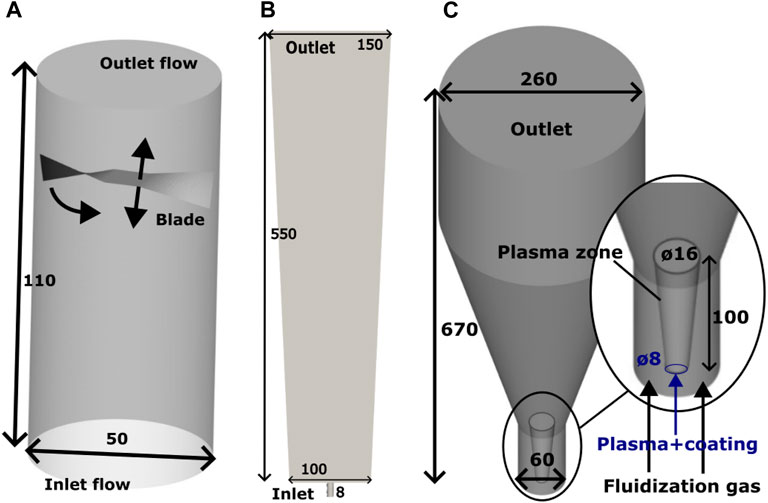
FIGURE 1. Geometries used (A) FT4. (B) 2D vessel. (C) Coating experiments vessel geometry. The coating zone has been included for visualization, but it is not a physical boundary.
2D spout: Another preliminary test is performed as a validation step of the particle movement in the reactor. MCC spheres are loaded into a makeshift pseudo-2-dimensional vessel until a bed height of 50 mm is reached. The dimensions are Height×Depth×Width (Top Width) 550 × 25 × 100 (150), also shown in Figure 1B. The construction is a stainless steel frame on which transparent plexiglass side panels can be mounted. Air is introduced at a rate of 100 L/min using an airflow controller (Bronkhorst, Veenendaal, NL) through a bottom nozzle to produce a spout while recording from a camera (FASTCAM SA4, Photron Europe Limited, High Wycombe, United Kingdom). Images of 1024 × 1024 pixels are taken at 1,000 fps using a macro lens focused on the particles. Sets of images are analyzed with Particle Image Velocimetry (PIV) using the Python implementation of OpenPIV (Liberzon et al., 2021). The main parameters chosen for the PIV analysis are the following, which are found to provide the best peak-to-peak signal-to-noise ratio: window size of 24 pixels, with overlap of 16 pixels, and search size of 24 pixels. The pseudo-2-dimensional nature of the vessel allows clear images of particles with upward movement that can be captured without the interference of particles moving downwards, which occurs only at the sides of the vessel. The dimensions (Figure 1 and flow rate (Table 2) are chosen close to those used during the coating simulations in the plasma reactor.
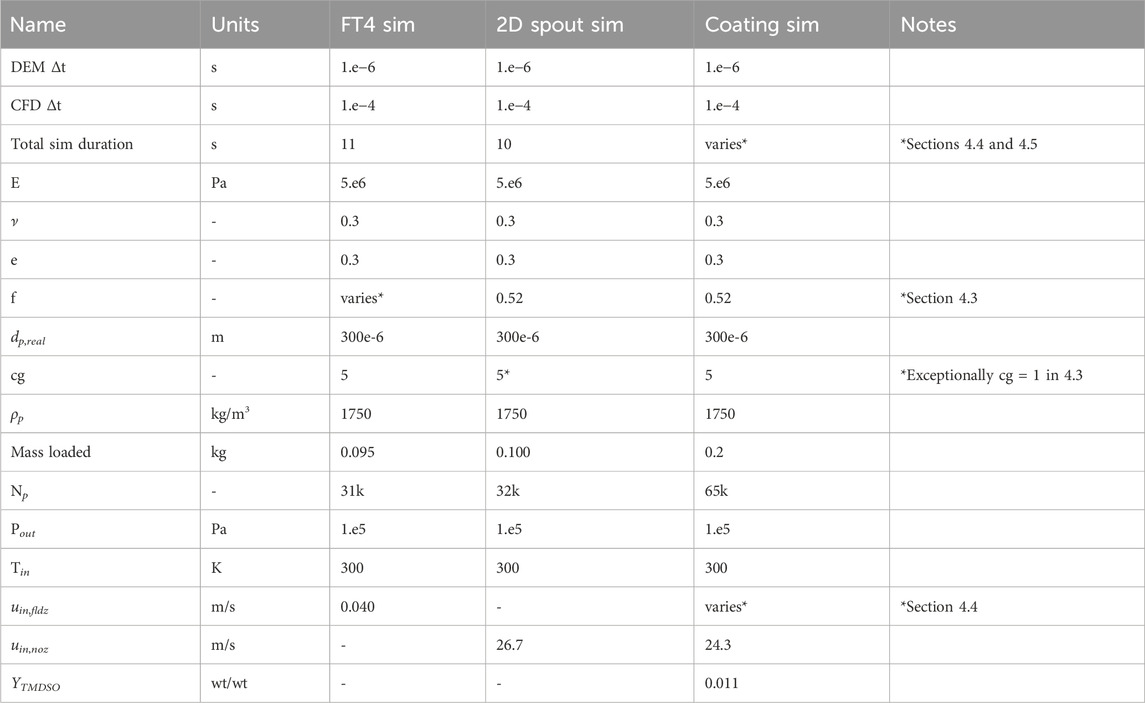
TABLE 2. Simulation parameters used in the simulations.
3.2 Numerical simulations
The CFD cell size is 4 mm, and the grain diameter is 1.5 mm, corresponding to a coarse-graining factor of 5. This is briefly further discussed in Section 4.1. Table 2 shows the simulation parameters used. Figure 1 shows the geometries used in the simulations.
3.2.1 Simulations of the preliminary experiments
The preliminary simulations were performed considering only particle and fluid motion without incorporating the mass and heat transfer between particles. The solver cfdemSolverRhoPimple is used (Leitz et al., 2018) in both simulations. These simulations aim to find an appropriate value for the friction coefficient and validate its applicability for the drag model of Beetstra used in our case.
FT4: Particles are initialized in the vessel and air is introduced from the bottom. After 2 s of initialization, the blade is lowered into the powder and rotated. The FT4 blade shaft is ignored, and the blade is flattened to remove its width. These simplifications allow bypassing the immersed boundary problem created by the moving geometry, which increases the complexity and computational resources needed excessively. The 6 mm shaft represents only 0.36% of the vessel cross-sectional area. Therefore, the underprediction of the drag forces due to the underprediction of the air velocities is not expected to be considerable in this simulation. The output of the FT4 simulation is the vertical force and torque that particles apply to the blade as it moves through the domain. This can be directly compared to the experiments.
2D spout: Particles are initialized in the vessel and air is introduced from the bottom opening. The simulation is run for 10 s, but the first 5 s are discarded to remove the first transient effect. The output of the 2D spout simulations is the particle velocity field, which is then averaged over time to compare to the experimental velocity fields.
3.2.2 Coating simulations
System under study: The coating of MCC spheres with tetramethyldisiloxane (TMDSO), a hydrophobic coating precursor, is simulated as a model system. The plasma fluidized bed reactor (R&D PlasmaPowder, PartiX NV, Belgium) is equipped with two bottom gas inlets: the fluidization gas flows through a bottom plate, and the plasma-containing gas flows through a nozzle, as seen in Figure 1C. The fluidization flow is used to improve the particle mixing in the reactor, while the plasma and precursor are introduced into the vessel only through the nozzle flow. After plasma generation through dielectric barrier discharge, the chemical precursors are introduced into the resulting plasma afterglow. A nozzle feeds this plasma gas flow into the bottom of the reactor by protruding the center of the diffuser plate, creating a reactive zone/spout. A glass reactor vessel allows for clear vision into the reactor.
Simulations: The full model as shown in Section 2 is used for these simulations. The solver used is cfdemSolverRhoPimpleChem (Kinaci et al., 2020). Although plasma generation physics has not been included in this simulation, an active zone is defined where mass transfer to the particle surface can happen, while in the inactive zone, no coating may occur. This accounts for the reaction initiation effect of plasma. This is achieved by turning off Eq. 7
The coating simulations provide the mass of each particle, which increases over time through Eq. 7. All particles are initially of the same size. Coating mass can thus be easily obtained by subtracting the initial particle mass from the time-dependent particle mass. This allows the analysis of the simulations through.
• Time evolution of the mean coating mass and its standard deviation,
• Particle coating homogeneity characterized by the coefficient of variation (CV),
• Distribution of the coating among the particles, characterized by histograms of coating mass.
Optimization of the fluidization gas flow is critical to achieve the best coating uniformity. Four cases are tested, varying the fluidization flow rate: 1L/min, 50L/min, 100 L/min, and 200 L/min. These simulations aim to find the appropriate flow rate that provides good mixing and a small CV.
4 Results and discussion
4.1 Mesh checks
The independence of the results from the cell-to-particle size ratio is checked in the FT4 and plasma coating simulations. In the unresolved CFD-DEM method, the cell size is limited by the particle size, which should be between 2 and 4.4 particle diameters in a system with monodispersed particles (Volk et al., 2023). In this range, the results are independent of the exact cell and particle dimensions. The particle size in this study is 1.5 mm (300 micron MCC spheres scaled by a coarse-graining factor of 5), which we have found reduces the computational time of the DEM side to about the same as the CFD side for the studied system. Therefore, the cell size analysis is limited to a narrow cell count. Figure 2 summarizes the results of these checks in the studied cell size range of about 3 mm–5 mm. The cell size in the studied range does not impact the resulting energy profiles of the FT4 rheometer simulations. However, in the coating simulations, the largest cell size of 4.5 mm does result in a different coating histogram compared to 4 mm and 3.3 mm. Hence, the chosen cell size is 4 mm for all simulations.
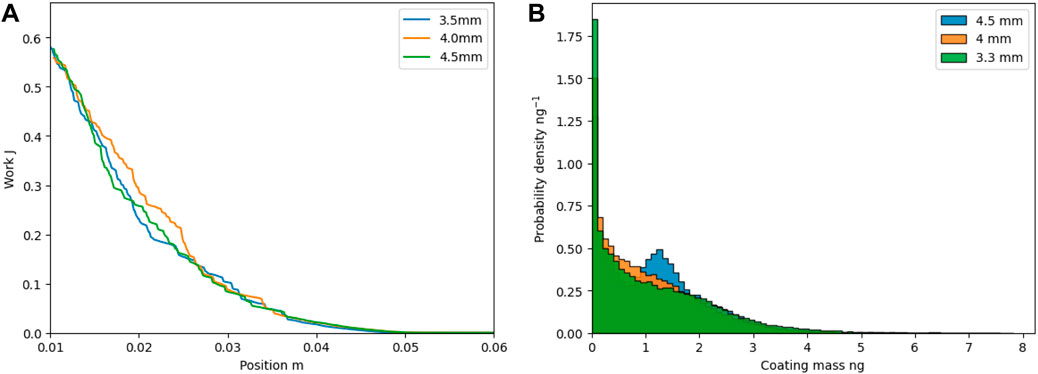
FIGURE 2. Mesh checks. (A) FT4 profiles of total energy required to move the blade through the aerated powder for three different CFD cell sizes. (B) Coating simulations results after 10 s for three different CFD cell sizes.
4.2 Mass balance
Figure 3 reports the mass balance for a 50 s plasma coating simulation. Given the transient nature of the simulation, the outlet precursor flow is not constant until the mass held in the vessel is. The mass balance error is calculated as the difference between the expected coating mass from the system mass balance (in - out - accumulated) and the coating obtained from Eq. 7. The results summarized in Table 3 show that the implementation of Eq. 7 is responsible for about 1% numerical error. This is deemed acceptable as a verification step to continue with the coating analysis.
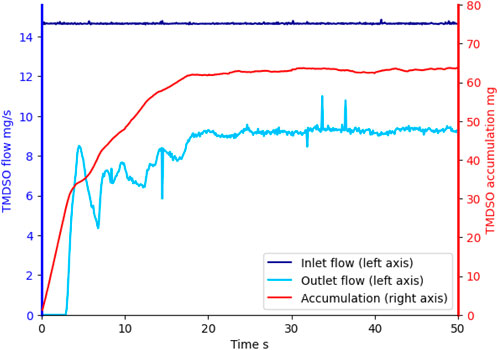
FIGURE 3. Inlet and outlet TMDSO flows during a 50 s plasma coating simulation (left axis) and total mass accumulated in the system (right axis).
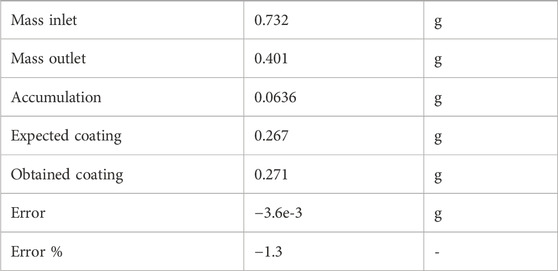
TABLE 3. Mass balance check results. Results shown are those from Figure 3, integrated over the whole simulation period.
4.3 Preliminary experiments and simulations
FT4: The experimentally obtained FT4 energy profiles are shown in Figure 4. Both pure MCC and 30-min coated MCC are tested, as the surface properties of the particles vary during coating experiments. The coating seems to reduce the friction between particles, thereby reducing the energy required for the blade to move through the powder. The gray area between the experimental values is used as the target for the friction coefficient in the FT4 simulations. Figure 4 also shows the simulation results for the same system, varying the friction coefficient. The results show a strong dependence of the flow energy with the friction coefficient used, which allows pinpointing the value that reproduces the experimental data. Based on the figure, a friction coefficient of 0.52 is chosen. No further optimization of the friction coefficient is performed, as increasing the significant digits of its value does not lead to observable differences in the coating profiles of plasma coating simulations.
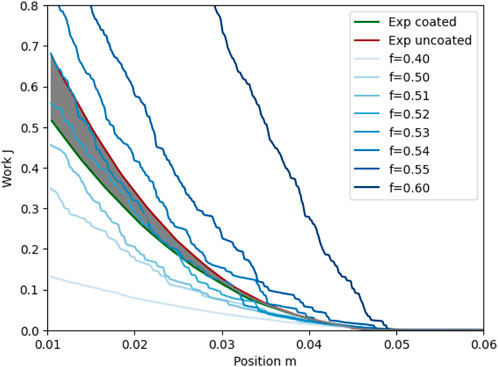
FIGURE 4. Experimentally determined total flow energy for coated and uncoated MCC, and simulation results varying the DEM friction coefficient used. Grayed area indicates the space between coated and uncoated.
2D spout: PIV is performed on pairs of images using 650 images obtained from the experiment, an example is given in Figure 5A. The resulting experimental vertical component of the velocity is shown in Figure 5B, together with simulation results, at two different vessel heights, 13 cm and 15 cm from the bottom of the vessel, which corresponds to the higher velocity portion of the particle motion. Simulations slightly overpredict the experimental velocities in the center of the vessel (upward particle movement as shown by positive values of the vertical velocity). However, poorer agreement is seen on the sides (downward particle movement and negative vertical velocity). This is caused by poor mapping of the individual particle velocities to the CFD cell grid. Due to the large coarse graining factor used, only a small number of particles are present at any point in time on the sides of the vessel where downward movement is observed. This causes lower downward velocities reported in Figure 5B when using a large coarse-graining (cg = 5). This fact is proved by removing the coarse-graining (cg = 1) and repeating the simulation. As seen in the figure, much better agreement is then obtained in the downward motion section. The average absolute error is reduced from 0.30 m/s in the coarse-grained case to 0.20 m/s in the non-coarse-grained case. The reduction in absolute error does, however, mask the fact that it only improves on the sides, as more overestimation of the velocity in the upward motion section in the center of the vessel is present. This issue might be related to the filtering of the drag force, as in this non-coarse-grained simulation, the ratio of cell size to particle size is 13.3, which is outside of the optimal range of maximum 4.4. Note that this is despite having included the filtered coarsening corrections of Radl and Sundaresan (2014), which removed this discrepancy in their simulations of a fluidized bed up to a ratio of 25. In our spouting test, we find this discrepancy in the upward movement, which originates where the highly dense region (particle volume fraction 0.4–0.6) at the bottom of the vessel meets the incoming air jet. In this region, the slip velocities are very small, and the calculation of the drag force becomes challenging as it is very sensitive to small fluctuations of the slip velocity (Radl and Sundaresan, 2014). The discrepancy has been deemed acceptable to continue with the plasma coating simulations.
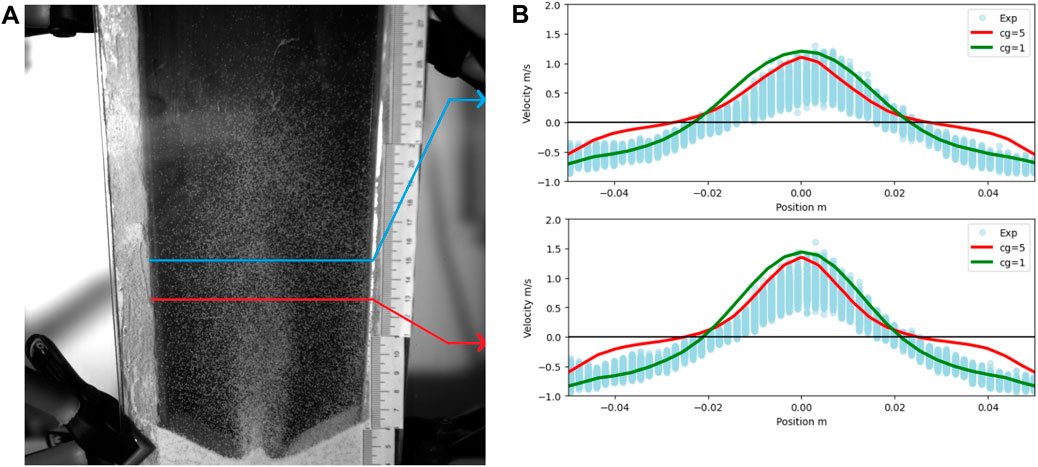
FIGURE 5. Particle image velocimetry results. (A) High speed camera image from the 2D spout test. Red line indicates 13 cm height, blue line indicates 15 cm height. (B) Experimental (blue circles) and simulated (red and green lines) particle vertical velocity along the horizontal axis of the pseudo 2D vessel at a height of 15 cm (top) and 13 cm (bottom).
4.4 Plasma coating reactor simulations and influence of fluidization flow
Simulations are run for the first 20 s of the process, given that trends are already visible at this stage. Figure 6 shows histograms of coating mass after 20 s of coating process. In the case of 1 L/min, representing the (almost) no fluidization flow case, the histogram shows that 15% of the particles never received any coating in the entirety of the 20 s simulation. The particles that did receive coating seem to develop a normal distribution. In contrast, in the 50 L/min case, all particles received some coating, and a normal distribution is developing with all particles. This points towards a mixing problem: at the lower fluidization rate, some of the particles never pass through the plasma coating zone in the center of the vessel. Furthermore, snapshots of the simulations are shown in Figure 7. They show how a spout is formed in the middle in the 1 L/min, and it becomes clear that mixing is not good enough to make all particles pass through the coating zone. Larger fluidization flows provide better mixing due to the change from spouting to bubbling fluidization. For a better comparison, the CV is plotted in Figure 8 against the average coated mass, a comparable measure of time between runs. The 1 L/min case stands out as the worst case, as the CV is higher at all points. All other cases present similar CVs. Thus, the results suggest that no further improvement in the CV can be expected from higher fluidization flows once sufficient mixing is achieved.
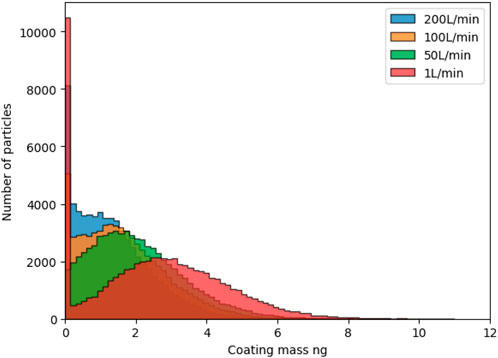
FIGURE 6. Histograms of coating mass after 20 s of coating time, for different fluidization flow rates. The total coating applied (sum of all particles) is 170, 136, 108, and 86 μg for the cases 1, 50, 100 L/min and 200 L/min.
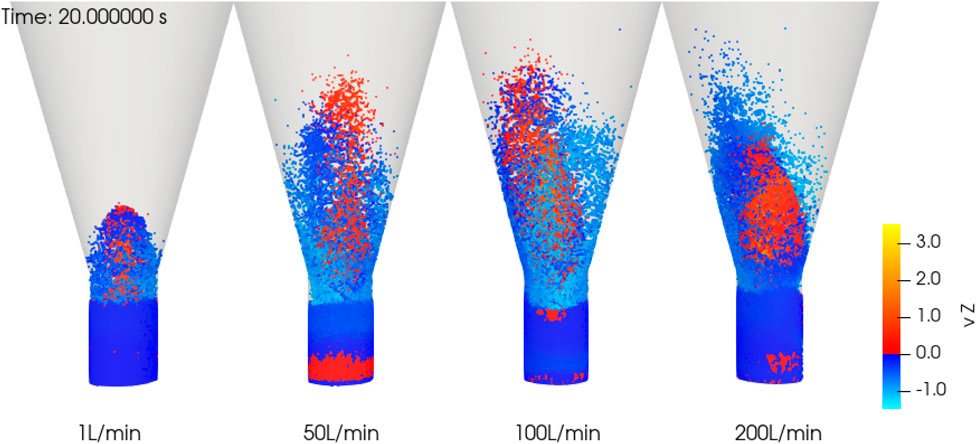
FIGURE 7. Snapshots taken after 20 s of simulation, with particles colored by vertical velocity vz. Fluidization flow rates are indicated. The 1 L/min case remains in a spouting regime, while the other cases are in a bubbling regime.
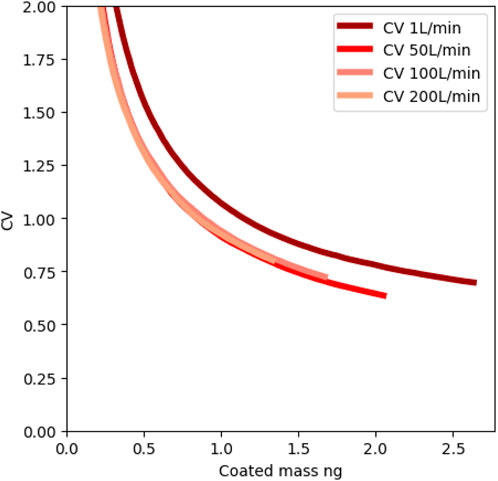
FIGURE 8. Trends of the coefficient of variation CV against the average coated mass for 20 s simulations.
Interestingly, increasing the fluidization flow decreases the amount of coating applied to the particles, as shown by the total coating applied of 170 μg in the 1 L/min case, while, e.g., for the 100 L/min case, only 108 μg were applied in total after 20 s. This might be due to the dilution effect that the fluidization flow imparts on the process, diminishing the driving force for the mass transfer. The discussion so far is from the point of view of reducing the CV as much as possible. In other cases, maximizing the applied coating per process time might also be interesting, thus reducing the total coating time required. This, however, has not been the objective of our study.
4.5 Longer coating times
Coating process times in the plasma reactor are typically between 5 and 60 min. Therefore, the CFD-DEM simulation results for a shorter coating time are used to predict coating performance in the longer run. In this section, the 100 L/min case is chosen, and a simulation is run up to 75 s to demonstrate the feasibility of predicting coating performance in an extended coating run. Figure 9 shows the histograms of the 100 L/min case at longer coating times. Normal distributions are fitted to the histograms. Given that all particles are initially of the same mass, a normal distribution does not fit after a short time. However, after enough time has passed, a normal distribution is formed. The discussion that the distribution formed is normal might seem trivial but allows for the simplified extrapolation to longer times discussed in 2.3.
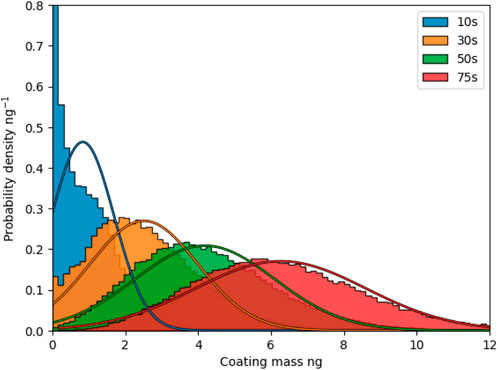
FIGURE 9. Coating mass distributions for a fluidization flow of 100 L/min for different time steps, with overlayed fit of a normal distribution.
Having established the trend on a relatively long simulation time, it is possible to establish trends for other simulation cases that did not run for that long. Figure 10C shows the linear trend of mean coating mass and its variance over time for the case of 100 L/min fluidization flow. In this figure, the first 20 s of the simulation have been used to fit a linear trend, which later is extrapolated to the end of the simulation at 75 s. It can be seen that extrapolation and simulation data agree well over this range. Other simulations are also shown in Figures 10A,B,D. These did not run for that long, as the lack of data after 20 s indicated. Nonetheless, it is clear from the figures that the extrapolation for the 200 L/min case is sound. This is not the case for the 1 L/min case: data deviates from the fitted line already at 20 s. This fact was already predicted from the histograms after 20 s of Figure 6, from the simulation snapshots of Figure 7, and highlighted from the large residuals of the 20 s fit of Figure 10E: the particle mixing that allows uniform coating is not achieved in this case.
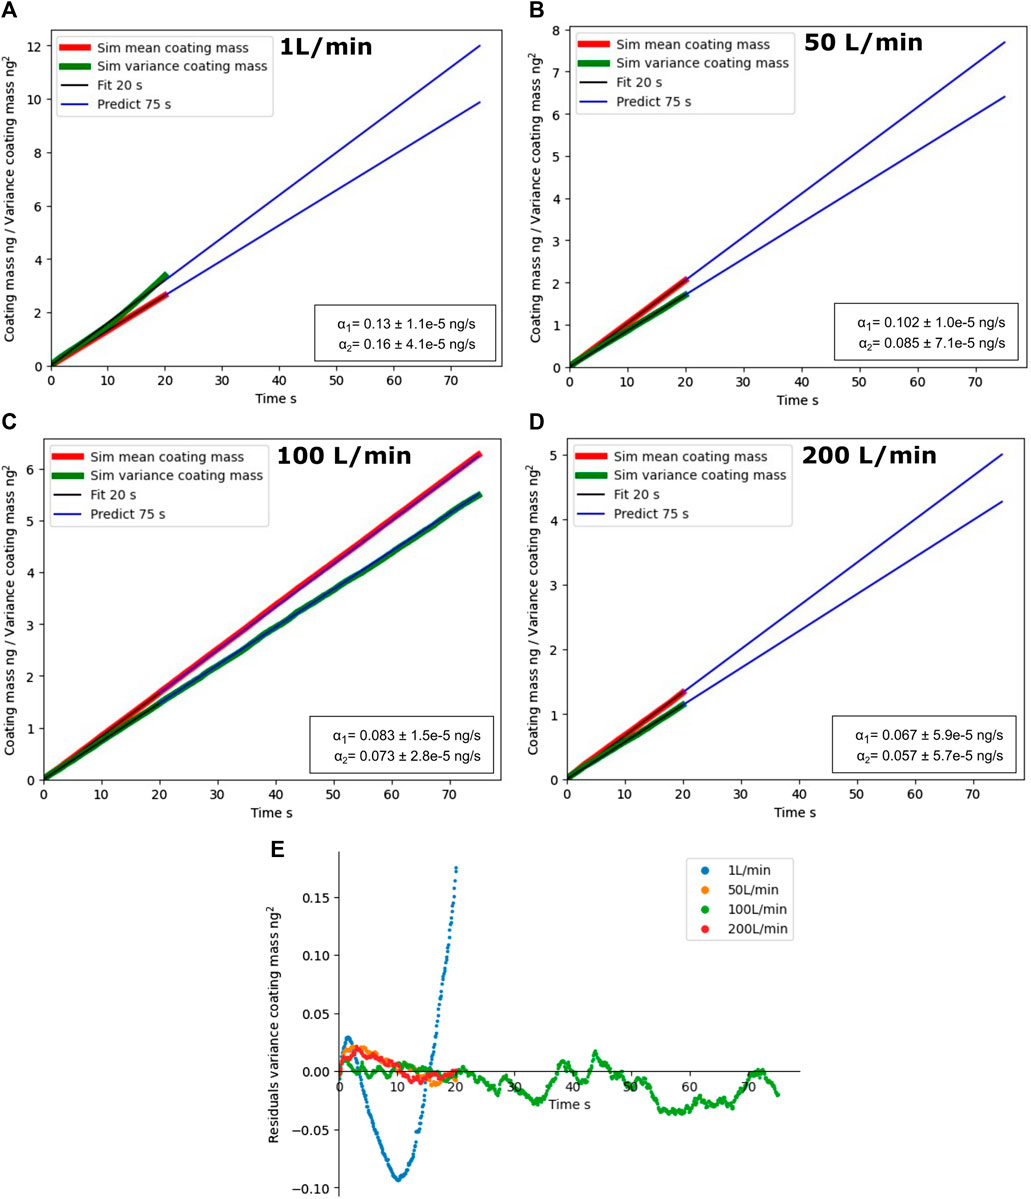
FIGURE 10. (A–D): Mean coating mass over time and its variance for different fluidization flow rates. The first 20 s are used to fit the regression model. Regression coefficients from Eqs 9, 10 are reported with one standard deviation error. (E): Residuals of this regression.
Furthermore, this allows the estimation of the results of a 20-min coating run with a detailed CFD-DEM simulation of 20 s. The CV shown in Figure 11 decreases as the square root of time as expected. Reconstructed coating distributions from the mean and the variance are shown in Figure 12. These predictions are made by fitting the first 20 s of simulation as shown in Figure 10C, which are then used to estimate the size distribution at 5 and 20 min. The CV decreases as the square root of time, as seen in Figure 11. This can be used, for example, in the pharmaceutical industry, to ensure the batch passes quality control with a low CV by extending the coating time. However, it is worth noting that the coating mass distributions get broader when extending the coating time as Eq. 10 predicts, and as seen in Figure 12. This highlights that CV is a measure of how broad the distribution is relative to the total amount coated.
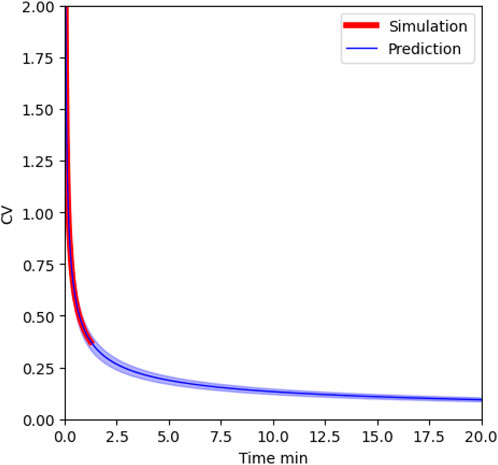
FIGURE 11. CV prediction at longer coating times. The colored area around the blue prediction line indicates a 20% deviation from the standard deviation fitting parameter α2.
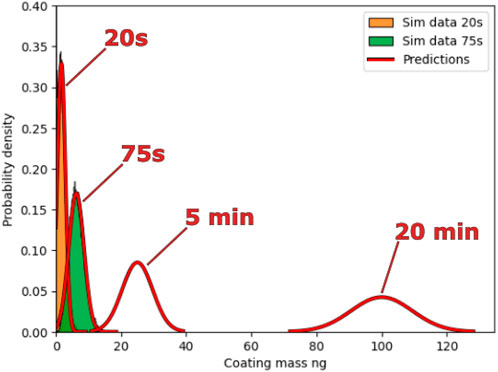
FIGURE 12. Predicted coating distributions after 20 s, 75 s, 5 min and 20 min of process time based on 20 s of detailed CFD-DEM simulation. Simulation data after 20 s and 75 s is also shown.
The reconstruction method, however, cannot be used indiscriminately, as discussed already for the 1 L/min case, since the assumption that a normal distribution with the entirety of the particles does not hold. The presented results show that 50 L/min and upwards do provide good mixing. However, these results do not show exactly where the switch occurs between 1 and 50 L/min.
5 Conclusion
The fluidized bed plasma coating process has been simulated using the CFD-DEM framework. The main objective of this study was to build a model which can be applied for process optimization. Several fluidization flow rates from 1 to 200 L/min have been tested as an example, while the plasma and coating precursor flow rates were kept constant. Differences in terms of the coefficient of variation were immediately noticed between the 1 L/min case and the other cases, suggesting that operating the equipment with excessive lowering of the fluidization rate results in a non-uniform coating.
The study also showed that when the short-term simulations show that good mixing is achieved for the selected process conditions, they can be easily extrapolated to longer processing times by assuming perfect mixing. This bypasses complex procedures such as flow recurrence to produce long-term coating results. Confidence in this extrapolation is built from the work of previous studies on population balance models and the relatively long 1.25 min simulation.
The results of this procedure set the foundation for further work, as they can be directly compared to experimental observations. This allows for a future full process optimization procedure, including more process conditions than the ones studied here, with direct comparison to experiments. Future work should also focus on the implementation of a detailed plasma model to improve on the assumption made here that the coating kinetics follow from the mass transfer rate.
Overall, the valuable insights gained from this work should assist in developing innovative particle coating methods based on plasma fluidized bed reactor technology. The problematic operating conditions that lead to non-uniform coating occurring at low fluidization flow rates identified in this work demonstrate the value of using CFD-DEM simulations in the process design of fluidized bed type plasma coating processes. Furthermore, even if the CFD-DEM simulations can only be done for a short time, they can be used to identify flow pattern deficiencies such as those demonstrated in this study.
Data availability statement
The original contributions presented in the study are included in the article/supplementary material, further inquiries can be directed to the corresponding author.
Author contributions
PM: Formal Analysis, Investigation, Software, Writing–original draft, Writing–review and editing. RV: Conceptualization, Writing–review and editing. TD: Conceptualization, Writing–review and editing. AK: Conceptualization, Funding acquisition, Methodology, Project administration, Writing–review and editing.
Funding
The author(s) declare financial support was received for the research, authorship, and/or publication of this article. The research is pursued as part of FUNY, an innovation project under the umbrella of Catalisti, the spearhead cluster that accelerates innovation into business in Flanders’ chemical and plastics sector. We gratefully acknowledge the financial support of Flanders Innovation and Enterpreneurship (VLAIO) through the Catalisti project FUNY (HBC. 2021.0821).
Conflict of interest
Author RV was employed by company PartiX NV.
The remaining authors declare that the research was conducted in the absence of any commercial or financial relationships that could be construed as a potential conflict of interest.
Publisher’s note
All claims expressed in this article are solely those of the authors and do not necessarily represent those of their affiliated organizations, or those of the publisher, the editors and the reviewers. Any product that may be evaluated in this article, or claim that may be made by its manufacturer, is not guaranteed or endorsed by the publisher.
References
Askarishahi, M., Salehi, M.-S., and Radl, S. (2017). Full-physics simulations of spray-particle interaction in a bubbling fluidized bed. AIChE J. 63, 2569–2587. doi:10.1002/aic.15616
Baesso, I., Karl, D., Spitzer, A., Gurlo, A., Günster, J., and Zocca, A. (2021). Characterization of powder flow behavior for additive manufacturing. Addit. Manuf. 47, 102250. doi:10.1016/j.addma.2021.102250
Beetstra, R., van der Hoef, M. A., and Kuipers, J. A. M. (2007). Drag force of intermediate Reynolds number flow past mono- and bidisperse arrays of spheres. AIChE J. 53, 489–501. doi:10.1002/aic.11065
Blais, B., Vidal, D., Bertrand, F., Patience, G. S., and Chaouki, J. (2019). Experimental methods in chemical engineering: discrete element method—DEM. Can. J. Chem. Eng. 97, 1964–1973. doi:10.1002/cjce.23501
Cavallaro, A., and Vasilev, K. (2015). Controlled and sustained release of pharmaceuticals via single step solvent-free encapsulation. Chem. Commun. 51, 1838–1841. doi:10.1039/c4cc08151j
Deen, N. G., Peters, E., Padding, J. T., and Kuipers, J. (2014). Review of direct numerical simulation of fluid–particle mass, momentum and heat transfer in dense gas–solid flows. Chem. Eng. Sci. 116, 710–724. doi:10.1016/j.ces.2014.05.039
Dufour, T. (2023). From basics to frontiers: a comprehensive review of plasma-modified and plasma-synthesized polymer films. Polymers 15, 3607. doi:10.3390/polym15173607
Golshan, S., Sotudeh-Gharebagh, R., Zarghami, R., Mostoufi, N., Blais, B., and Kuipers, J. (2020). Review and implementation of CFD-DEM applied to chemical process systems. Chem. Eng. Sci. 221, 115646. doi:10.1016/j.ces.2020.115646
Goniva, C., Kloss, C., Deen, N. G., Kuipers, J. A., and Pirker, S. (2012). Influence of rolling friction on single spout fluidized bed simulation. Particuology 10, 582–591. doi:10.1016/j.partic.2012.05.002
Grohn, P., Lawall, M., Oesau, T., Heinrich, S., and Antonyuk, S. (2020). CFD-DEM simulation of a coating process in a fluidized bed rotor granulator. Processes 8, 1090. doi:10.3390/pr8091090
Jiang, Z., Rieck, C., Bück, A., and Tsotsas, E. (2020). Modeling of inter- and intra-particle coating uniformity in a wurster fluidized bed by a coupled CFD-DEM-Monte Carlo approach. Chem. Eng. Sci. 211, 115289. doi:10.1016/j.ces.2019.115289
Ketterhagen, W., and Wassgren, C. (2022). A perspective on calibration and application of dem models for simulation of industrial bulk powder processes. Powder Technol. 402, 117301. doi:10.1016/j.powtec.2022.117301
Kieckhefen, P., Lichtenegger, T., Pietsch, S., Pirker, S., and Heinrich, S. (2019). Simulation of spray coating in a spouted bed using recurrence CFD. Particuology 42, 92–103. doi:10.1016/j.partic.2018.01.008
Kinaci, M., Lichtenegger, T., and Schneiderbauer, S. (2020). A CFD-DEM model for the simulation of direct reduction of iron-ore in fluidized beds. Chem. Eng. Sci. 227, 115858. doi:10.1016/j.ces.2020.115858
LaMarche, C. Q., Cocco, R., Reddy Karri, S., Dahl, S. R., and Hrenya, C. M. (2022). Experimental measurements of gas-particle flows in large-scale strippers. Chem. Eng. Sci. 264, 118087. doi:10.1016/j.ces.2022.118087
Leitz, K.-H., O'Sullivan, M., Plankensteiner, A., Lichtenegger, T., Pirker, S., Kestler, H., et al. (2018). CFDEM modelling of particle heating and acceleration in cold spraying. Int. J. Refract. Metals Hard Mater. 73, 192–198. doi:10.1016/j.ijrmhm.2018.02.003
Liberzon, A., Kaufer, T., Bauer, A., Vennemann, P., and Zimmer, E. (2021). OpenPIV/openpiv-python: OpenPIV-Python v0.23.6 (0.23.6). Zenodo. doi:10.5281/ZENODO.593157
Liu, M., Chen, M., Li, T., Tang, Y., Liu, R., Shao, Y., et al. (2019). CFD–DEM–CVD multi-physical field coupling model for simulating particle coating process in spout bed. Particuology 42, 67–78. doi:10.1016/j.partic.2018.03.011
Lu, L., Gopalan, B., and Benyahia, S. (2017). Assessment of different discrete particle methods ability to predict gas-particle flow in a small-scale fluidized bed. Industrial Eng. Chem. Res. 56, 7865–7876. doi:10.1021/acs.iecr.7b01862
Madlmeir, S., Forgber, T., Trogrlic, M., Jajcevic, D., Kape, A., Contreras, L., et al. (2021). Modeling the coating layer thickness in a pharmaceutical coating process. Eur. J. Pharm. Sci. 161, 105770. doi:10.1016/j.ejps.2021.105770
Mann, U. (1983). Analysis of spouted-bed coating and granulation. 1. batch operation. Industrial Eng. Chem. Process Des. Dev. 22, 288–292. doi:10.1021/i200021a019
Neveu, A., Francqui, F., and Lumay, G. (2022). Measuring powder flow properties in a rotating drum. Measurement 200, 111548. doi:10.1016/j.measurement.2022.111548
Pandey, P., Katakdaunde, M., and Turton, R. (2006). Modeling weight variability in a pan coating process using Monte Carlo simulations. AAPS PharmSciTech 7, E2–E11. doi:10.1208/pt070483
Pietsch, S., Heinrich, S., Karpinski, K., Muller, M., Schonherr, M., and Jager, F. K. (2017). CFD-DEM modeling of a three-dimensional prismatic spouted bed. Powder Technol. 316, 245–255. doi:10.1016/j.powtec.2016.12.046
Radl, S., and Sundaresan, S. (2014). A drag model for filtered euler–Lagrange simulations of clustered gas–particle suspensions. Chem. Eng. Sci. 117, 416–425. doi:10.1016/j.ces.2014.07.011
Rendon-Piedrahita, C., Baba, K., Quintana, R., Bardon, J., Borek-Donten, J., Heyberger, R., et al. (2022). Effect of crosslinker on the wettability and mechanical properties of hydrophobic coatings deposited via atmospheric pressure plasma. Plasma Process. Polym. 19, 2200023. doi:10.1002/ppap.202200023
Renzo, A. D., Napolitano, E., and Maio, F. D. (2021). Coarse-grain DEM modelling in fluidized bed simulation: a review. Processes 9, 279. doi:10.3390/pr9020279
Ronsse, F., Pieters, J., and Dewettinck, K. (2007). Combined population balance and thermodynamic modelling of the batch top-spray fluidised bed coating process. part i model development and validation. J. Food Eng. 78, 296–307. doi:10.1016/j.jfoodeng.2005.09.030
Roth, C., Keller, L., and von Rohr, P. R. (2012). Adjusting dissolution time and flowability of salicylic acid powder in a two stage plasma process. Surf. Coatings Technol. 206, 3832–3838. doi:10.1016/j.surfcoat.2012.01.046
Rouabah, M., Bourgeois, S., Briançon, S., and Cogné, C. (2022). A numerical tool to predict powder behaviour for pharmaceutical handling and processing. J. Drug Deliv. Sci. Technol. 70, 103258. doi:10.1016/j.jddst.2022.103258
Shafique, A., Vanhulsel, A., Rangasamy, V. S., Baert, K., Hauffman, T., Adriaensens, P., et al. (2023). DBD plasma-assisted coating of metal alkoxides on sulfur powder for li–s batteries. Battery Energy 2. doi:10.1002/bte2.20220053
Snyders, R., Hegemann, D., Thiry, D., Zabeida, O., Klemberg-Sapieha, J., and Martinu, L. (2023). Foundations of plasma enhanced chemical vapor deposition of functional coatings. Plasma Sources Sci. Technol. 32, 074001. doi:10.1088/1361-6595/acdabc
Song, C., Liu, D., Ma, J., and Chen, X. (2017). CFD-DEM simulation of flow pattern and particle velocity in a fluidized bed with wet particles. Powder Technol. 314, 346–354. doi:10.1016/j.powtec.2016.10.044
Trimukhe, A., Rojekar, S., Vavia, P. R., and Deshmukh, R. (2021). Pulsed plasma surface modified omeprazole microparticles for delayed release application. J. Drug Deliv. Sci. Technol. 66, 102905. doi:10.1016/j.jddst.2021.102905
Turton, R. (2008). Challenges in the modeling and prediction of coating of pharmaceutical dosage forms. Powder Technol. 181, 186–194. doi:10.1016/j.powtec.2006.12.006
Volk, A., Ghia, U., and Jog, M. (2023). How computational grid refinement in three dimensions affects computational fluid dynamics-discrete element method results for psuedo-two-dimensional fluidized gas-solid beds. J. Fluids Eng. 140, 121303. doi:10.1115/1.4040763
Zheng, C., Li, L., Nitert, B. J., Govender, N., Chamberlain, T., Zhang, L., et al. (2022). Investigation of granular dynamics in a continuous blender using the gpu-enhanced discrete element method. Powder Technol. 412, 117968. doi:10.1016/j.powtec.2022.117968
Zhou, Z. Y., Kuang, S. B., Chu, K. W., and Yu, A. B. (2010). Discrete particle simulation of particle–fluid flow: model formulations and their applicability. J. Fluid Mech. 661, 482–510. doi:10.1017/s002211201000306x
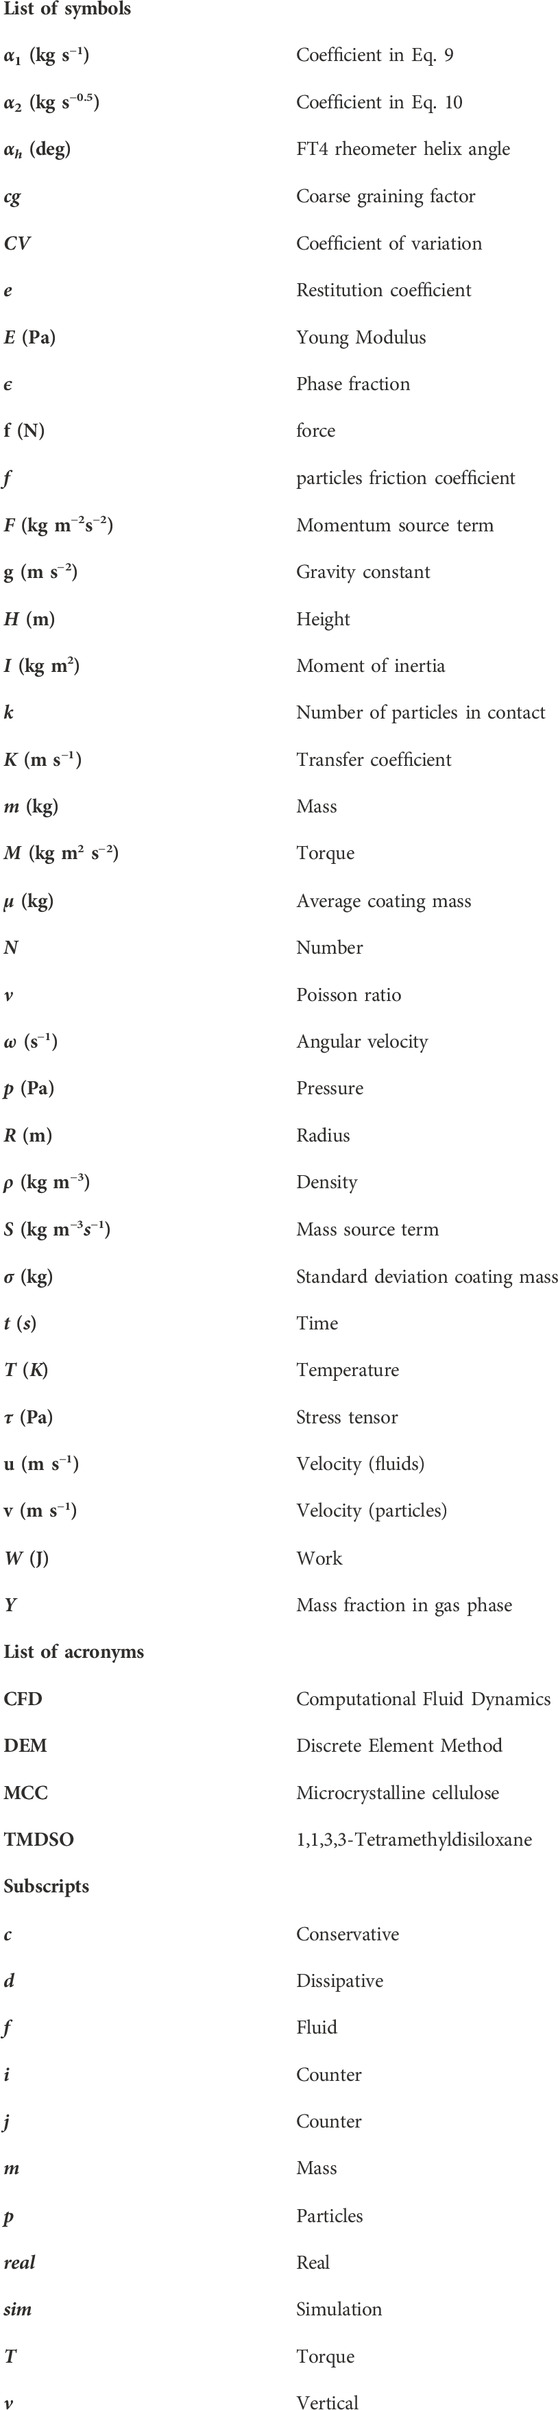
Nomenclature
Keywords: plasma coating, fluidization, cold plasma, process simulation, powder coating, CFD-DEM
Citation: Martin-Salvador P, Verschueren RH, De Beer T and Kumar A (2024) CFD-DEM model of a cold plasma assisted fluidized bed powder coating process. Front. Chem. Eng. 6:1347313. doi: 10.3389/fceng.2024.1347313
Received: 30 November 2023; Accepted: 01 February 2024;
Published: 27 February 2024.
Edited by:
Rachel Smith, The University of Sheffield, United KingdomReviewed by:
Alejandro López, University of Deusto, SpainHaifeng Lu, East China University of Science and Technology, China
Copyright © 2024 Martin-Salvador, Verschueren, De Beer and Kumar. This is an open-access article distributed under the terms of the Creative Commons Attribution License (CC BY). The use, distribution or reproduction in other forums is permitted, provided the original author(s) and the copyright owner(s) are credited and that the original publication in this journal is cited, in accordance with accepted academic practice. No use, distribution or reproduction is permitted which does not comply with these terms.
*Correspondence: A. Kumar, QXNoaXNoLkt1bWFyQFVHZW50LmJl