 Jere Confrey
 Meetal Shah
 Emily Toutkoushian
- 1Department of STEM Education, North Carolina State University, Raleigh, NC, United States
- 2The Math Door, Raleigh, NC, United States
This study reports how a validation argument for a learning trajectory (LT) is constituted from test design, empirical recovery, and data use through a collaborative process, described as a “trading zone” among learning scientists, psychometricians, and practitioners. The validation argument is tied to a learning theory about learning trajectories and a framework (LT-based data-driven decision-making, or LT-DDDM) to guide instructional modifications. A validation study was conducted on a middle school LT on “Relations and Functions” using a Rasch model and stepwise regression. Of five potentially non-conforming items, three were adjusted, one retained to collect more data, and one was flagged as a discussion item. One LT level description was revised. A linear logistic test model (LLTM) revealed that LT level and item type explained substantial variance in item difficulty. Using the LT-DDDM framework, a hypothesized teacher analysis of a class report led to three conjectures for interventions, demonstrating the LT assessment’s potential to inform instructional decision-making.
Introduction
Learning trajectory (LT)-based diagnostic assessments represent an alternative approach to traditional domain-sampling assessments (Briggs and Peck, 2015) in two fundamental ways: 1) they assess progress along a set of levels in an ordered sequence from less to more sophisticated, and 2) they are better positioned to formatively guide instructional modifications to improve student learning during, not after, instruction. Students and teachers can use data from LTs to find out what a student currently knows, and where that knowledge is in relation to what was learned prior and what has yet to be learned. Learning trajectories can vary in the grain size of the levels. A finer grain-size is useful in LT-based diagnostic assessments within the context of classroom assessments which take place during instruction as a means to provide formative feedback and guide instructional modifications. A finer grain size can ensure the LT is sensitive to differences in student thinking as they move from naive to more sophisticated understanding of target concepts. Teachers, equipped with these fine-grained data, can then interpret these data to make ongoing modifications to instruction in order to support and improve students’ learning.
It is a daunting effort to undertake validation of a diagnostic formative assessment system based on LTs at scale, if that system fundamentally transforms practice into a data-driven enterprise. This is especially the case if the data imply changes in curriculum, instruction, assessment, and/or professional development. For example, one such system, Math-Mapper 6–8 (MM6-8 can be accessed at sudds.co) addresses nine big ideas of middle school.1 which rest on 60 constructs with underlying LTs, grouped into 26 clusters of related constructs (Confrey Gianopulos, McGowan, Shah, and Belcher, 2017). The data are immediately available to students, teachers, and administrators, and are interpreted in light of the curriculum, instruction, and professional learning offerings. Because of its formative goals, to be effective, MM6-8’s value as a feedback system driving instructional improvement must be of primary importance in considering its validity and that of its assessments. Further, as a form of classroom assessment (Shepard et al., 2018), the criteria for validity, reliability, and fairness must be adapted towards low-, rather than high-stakes decision-making.
In this article, we illustrate how validation of such a system rests squarely on three components, LTs that form the system’s underlying empirically-based framework, a relevant psychometric model, and a framework for data-driven decision-making to guide instructional use of LT-based assessments. Having worked within a Design Based Implementation Research approach (Fishman et al., 2013) over 5 years and across multiple partners to develop MM6-8, we report that ongoing collaboration among learning scientists (LS), psychometricians, and practitioners is required to coherently tie the three components together. These collaborations are unlike the interactions often prescribed in the literature for building scales or measures (Carney and Smith, 2017; Wilmot et al., 2011; Wilson et al., 2005), which often involve LS and disciplinary experts early in the process (to review a proposed trajectory), and then involve practitioners only as users and implementers at the end of the process. Such a view of a LT development, writes Lehrer, “tends to privilege conceptual development and understates the wrenching work of aligning disparate communities and interests at its service.” (Lehrer, 2013 p. 183). He instead observed that in his team’s work on LTs, “The movement from initial conjectures from a more stabilized progression involved both coordination and conflict among disparate professional communities, including teachers, learning researchers, and assessment researchers.” (ibid, p.173). He draws from Galison (1997), a philosopher of science, to describe the collaborative interactions as a “trading zone,” where each community knows its own roles and obligations, but uses “boundary objects” to gain a shared understanding of the LTs and related items across the other communities.
We developed a formative diagnostic assessment system for the full scope of topics in middle grades mathematics. We undertook this size effort to provide mathematics teachers with systematic access to LTs that synthesize the literature from the learning sciences. Its goals include strengthening teachers’ knowledge of: 1) the mathematics underlying the middle school content, 2) the meaning of LT-levels, and 3) how to interpret student responses within the hierarchy of the LT-levels. An overarching goal was to then leverage the power of digital technology to administer, score, and report on LT-based assessments in order to provide LT-based diagnostic feedback in real time. In such a dynamic context, we experienced this trading zone as both an exhilaration and a burden, which only deepened our commitment to move the field forward on the issue of how to conceptualize validation with such complex communities of ongoing practice (Latour, 1999).
To this end, in this paper, we illustrate (working with a single LT) how the relevant collaborative perspectives need to be taken into consideration across the span of a validation argument. We illustrate that an LT (its hierarchical structure, levels, and items) serves as a boundary object and it is understood differently by different participants, all of whom exert influence on its emergence and on its ongoing evolution. To present the case, we 1) describe the LT in its most current state, 2) describe the underlying set of claims that tie its development to classroom practice, 3) report data from the annual validation, and 4) describe one class’s data report and what is expected of teachers from within a LT-data-driven decision-making (LT-DDDM) model. Our goals are to illustrate the depth of content- and learner-based distinctions required for serious progress towards instructional modifications for improved student learning, and to emphasize why intensive participation of all groups is required throughout the process.
Before presenting the case as a validation study of a diagnostic, formative assessment, we ground our work in the context of LTs and briefly discuss the meaning of validation within the classroom assessment context.
Theoretical Frameworks
Learning Trajectories
LTs are empirically supported descriptions of patterns of student reasoning as students learn and as their understanding of target ideas progresses in terms of sophistication (Clements and Sarama 2004; Confrey et al., 2014b; Lehrer and Schauble 2015). LTs are not stage theories (i.e., they do not imply complete mastery of earlier levels before progressing to a target idea), nor are they logical deconstructions of formal disciplinary concepts (Confrey et al., 2014a; Lehrer and Schauble, 2015). Their ordering, from least to most sophisticated, rests on a specific theory of learning, expressed by Piaget (1970) as “genetic epistemology” or by Freudenthal (1987) as “guided reinvention”. LTs are thus positioned within a constructivist view of learning. When students are provided with carefully ordered tasks and asked to describe their thinking with others (e.g., an interviewer or peers) as they solve them, patterns emerge on beliefs they express, reasons, strategies, and choices of representations. LTs are grounded in patterns of student thinking resulting from study of students’ interactions with such “epistemological objects”. Students’ movement towards more difficult tasks requires them to engage in a process Piaget called “reflective abstraction”, critical to the development of mathematical reasoning. LTs, for our team, are likened to pathways up a climbing wall with differing points of entry, but with predictable handholds, footholds, and obstacles (Confrey and Toutkoushian, 2019). Levels can be viewed as likely landing places that indicate progress towards the target construct. LTs also draw on socio-cultural perspectives in that they allow for students to enter from various points dependent on their prior knowledge and cultural experiences. For teachers to use LTs, they need to become sensitive to students’ expression of these different epistemological objects at each level and to support their emergence as a student moves between levels.
General Assumptions About an LT Measurement Model
Progress levels (1 through n) for an LT are designed to reflect increases in sophistication of mathematical reasoning, with upper progress levels and their items being more challenging for most students to learn than lower progress levels for a given construct and their items. We anticipate that, on average across many students, the difficulty of the items measuring progress levels will monotonically increase with the levels. We do not predict, nor necessarily desire, that all items at one level of an LT are less difficult than all items at the next level (i.e., a practical implication that LTs do not comprise a stage theory model). There are at least two reasons to allow for substantial variation in item difficulty within a level, and for the overlap of variation of neighboring levels. Firstly, in mathematics, cases associated with a specific level can legitimately vary in difficulty based on many factors, and secondly, students’ performance on these items can be influenced by instructional factors, including opportunity to learn. These considerations led us to distinguish three categories of variability that affect the difficulty of items: intra-level variation (“Intra-LV”), inter-level variation (“Inter-LV”), and construct-irrelevant variation (“Irrel-V”) (Confrey and Toutkoushian, 2019). If we encountered a situation where on average, items are more difficult for an earlier level than a later level, and we have ruled out Irrel-V, then we would aggressively seek an explanation based on the mathematical choices affecting the complexity of the problem (as related to the meaning of the level) or instructional practices shared across lots of teachers. If none could be found, adjustments to the levels would be considered.
A Validation Framework and Argument
The concept of validation began with the articulation of various types of validity (content, construct, criterion, and consequential) and evolved into “an integrated evaluative judgment of the degree to which empirical evidence and theoretical rationales support the adequacy and appropriateness of inferences and actions based on test scores” (Messick, 1989, p. 13). It has further evolved to require an interpretive argument that provides the necessary warrants for the propositions and claims of those arguments (Mislevy et al., 2003; Haertel and Lorie, 2004; Kane, 2006).
Pellegrino et al. (2016) identified three components for constructing a validation argument for classroom assessments: cognitive, instructional, and inferential. We adapted and elaborated on their framework to create a validation framework tailored to MM6–8. The modifications of this approach for MM6–8, and applications of a principled assessment design perspective (Nichols et al., 2016) are described in further detail in Confrey and Toutkoushian (2019) and Confrey et al. (2019b).
Our validation argument is specified by a chain of claims about the LT structure with respect to measurement theory and the related classroom use of data by teachers and students. The type of evidence necessary for such a validation argument differs from that for high-stakes assessments, in part because it is undergirded by a theory of action in the classroom: the claims need to be actionable and provide evidence of the impact on instruction. In this article we discuss the claims that span from the structure of the LT to the use of its assessment data in the classroom, and provide samples of the associated evidence (Table 1).
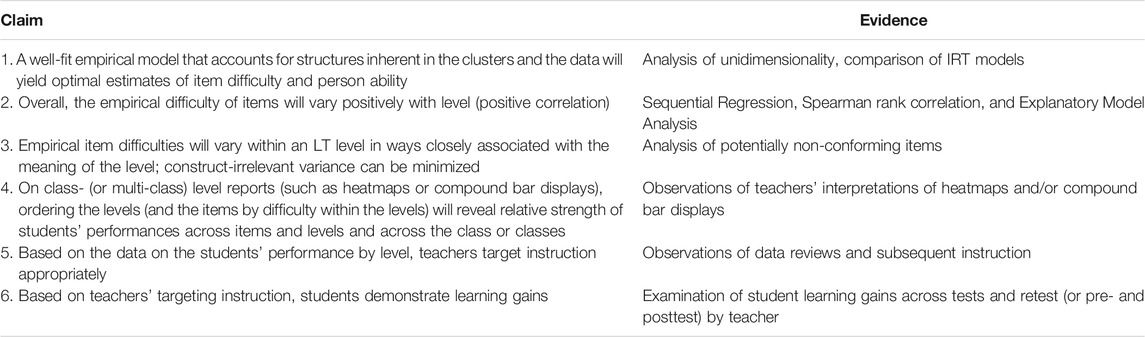
TABLE 1. Chain of claims and evidence for MM6-8 assessments’ validation argument.
Together, these claims provide a chain of reasoning from observed item scores to intended interpretations: if the internal structure of the item pool sufficiently reflects the constructs and LTs of the learning map, the heatmaps will be accurate representations of student knowledge and understanding (Claims 1–3), and the final steps in the argument will depend on a teacher’s ability to interpret data from the heatmap or compound bar displays to modify instruction (Claims 4–5) to improve student learning outcomes (Claim 6).
After observing teachers’ challenges with accurate and precise data interpretation of MM assessments (Confrey at al., 2018; Confrey and Shah, 2021; Persson and Ciliano, 2019b), we developed a framework for “LT-based data-driven decision-making” (LT-DDDM) (Confrey and Shah, 2021) (Figure 1). We adapted and modified Hamilton et al. (2009) data-use cycle to address the specific issues around LT-based assessments and included an additional component for reassess and review as means for teachers to evaluate the success of their evidence-based instructional modifications.
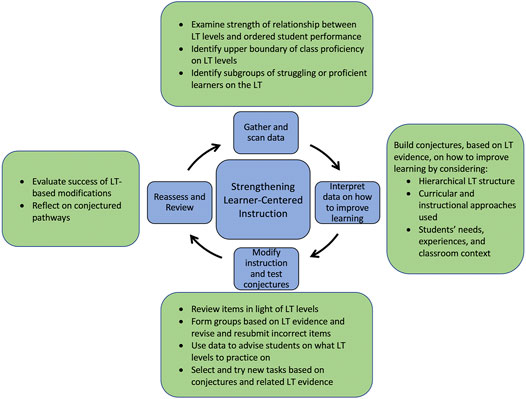
FIGURE 1. Learning trajectory-based, data-driven decision making (LT-DDDM) framework (from Confrey and Shah, 2021).
This specific validation study will first focus on Claims 1–3, and will illustrate how the psychometric analysis was complemented with a learning science analysis of the potentially non-conforming items. This will be presented in the form of four questions accompanied by procedures for investigation, results, and discussions. To illustrate the basis of claims 4 and 5 in the validation argument, data from one authentic heatmap will be analyzed to illustrate the intended use of the LT-DDDM content- and learner-centered elements. Claim 6 has been discussed elsewhere (Toutkoushian et al., 2019); the two aforementioned analyses illustrate the importance of building, validating, using, and refining LTs as a robust collaborative activity conducted in trading zones.
A Validation Study
Having defined the foundational theoretical object (learning trajectories), discussed its measurement, and described the validation argument, we document a validation study for one construct, “Relations and Functions.” The overall research question is:
To what degree can we provide a teacher with accurate and valid data on her class’s progress along a learning trajectory on Relations and Functions, and how might a teacher use these data for the purpose of adjusting and improving subsequent instruction to meet the students’ needs?
We begin by describing the LT levels, the research sites from which the data were collected, and then present the results and discussion of five more specific research questions associated with the claims.
An LT for “Relations and Functions”
In middle grades mathematics, the topic of functions, is typically introduced using two contrasting approaches: a set-theoretic approach and qualitative graphing. The first builds up the concept of a function from discrete cases, while the second begins with curve sketching of continuous situations. We position these two constructs as a pair within our first cluster in Algebra as Functions within our diagnostic software application, and have chosen to focus on one construct, “Relations and Functions” LT (set-theoretic approach; Table 2) for this validation study. The construct is aligned to the CCSS-M Standards, e.g., the first six (of seven) levels of this construct align to 8.F.A.1 and 8.F.A.22. The seventh level aligns to a high school standard and builds on the earlier levels (no data for level 7 is yet available in our middle grades work).
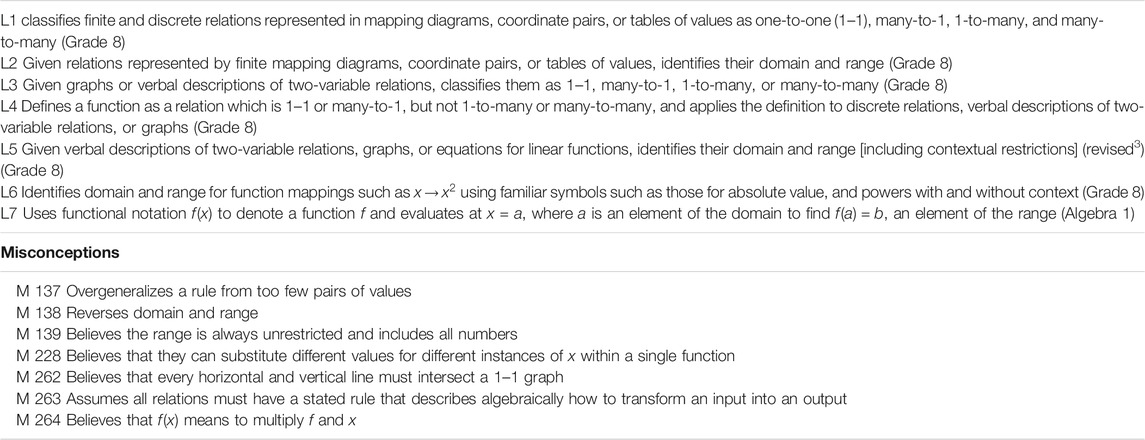
TABLE 2. Relations and Functions learning trajectory levels and misconceptions.
The set-theoretic approach introduces various forms of mappings of one set to another at Level 1. These mapping experiences involve a variety of representations (mapping diagrams, coordinate pairs, or tables of values) and types of mapping [one-to-one (1–1), many-to-1, 1-to-many, and many-to-many]. At level 2, students can deconstruct a mapping to distinguish and name a set of the values used as inputs (the domain) from the outputs (the range). At level 3, students extend their reasoning about the types of mappings from L1, to new representations such as graphs and context-based descriptions. This extension from discrete and finite cases to potentially continuous and/or infinite cases requires a shift in reasoning both for graphs and for contextual situations. For graphs, students have to analyze points in terms of mappings (such as those associated with the vertical/horizontal line test); for contexts, they must reason about the uniqueness (or not) of the relationship between inputs and outputs. At level 4, the concept of a function is differentiated from a relation as encompassing only those mappings which are one-to-one or many-to-one, but not one-to-many or many-to-many. Students at this level can distinguish functions from relations presented as mappings, and in tables and graphs, with and without context. At level 5, students can identify domains and ranges given familiar equations. In transitioning to level 6, the students can draw on their prior experience in applying unary operations to numbers to take absolute values or find squares or cubes. They apply these operations to sets of inputs and generate absolute value, squaring, and cubing of the inputs as outputs. Thus, the variable begins to be used symbolically in a mapping (e.g.,
In learning the increasingly sophisticated ideas in a LT, students make a number of predictable errors. Some of these rise to the level of a misconception, a systematic error, reached through a particular form of reasoning that is compelling to students because it has an element of partial correctness. Table 2 also displays a list of misconceptions associated with the Relations and Functions LT. Misconceptions can vary from being narrow, “reverses the domain and the range” to being quite broad, “overgeneralizes a rule from too few cases”. They are an important resource in item construction: one wants to provide data to students and teachers when misconceptions surface.
Materials and Data Collection Methods
Research Sites
The data for the study were collected during MM6-8 field-testing (2016–20), conducted in four districts, at six partner schools with 1:1 computing. The districts varied in size, ethnic diversity, and socio-economic status of student families. Teachers in all partner schools received an initial 1.5 days of professional development on LTs and the use of MM6-8. Many schools opted to collaborate with the research team on classroom data reviews and professional learning community (PLC) data reviews. Some schools requested specific assistance with the content; with those we collaborated over content-specific design studies (Cobb et al., 2003, Confrey, diSessa; Lehrer et al., 2014). A brief overview of the districts is provided in table 3.4
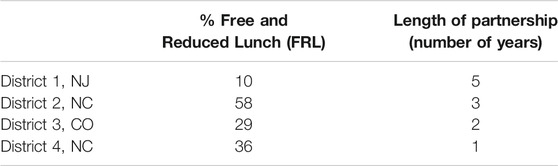
TABLE 3. Descriptive statistics for MM6-8’s district partners.
Data Sources: Diagnostic Assessments
LT-based assessments are situated within MM6-8, a digital diagnostic system that includes a hierarchical learning map and an assessment and reporting system. The middle grades learning map comprises 60 LTs and their related assessments. MM6-8’s assessments are administered during the course of instruction of a unit or topic. Most teachers administer a test about two-thirds of the way through their instructional unit, allowing sufficient time to make any changes to instruction.
Teachers can choose to administer assessments at the cluster- or construct-level. Assessments are digitally administered, consist of 8–12 items, and take between 20–30 min to complete. Cluster tests contain multiple, pre-equated forms with common items that are sampled evenly across the levels of the constructs among the different forms to cover the full LTs at a class level; there is an equivalent set of re-test forms. Construct tests have only a single form but contain at least one item per level to fully cover the LT. Across the different years of implementation, our test assembly process ensured that new forms contained previously piloted items, as well as new items. While the short lengths of the cluster and construct tests could pose challenges for analyzing the data using item response theory (IRT) for a specific form or test, the test assembly and item selection processes helped address these challenges by allowing us to concurrently calibrate the different forms with overlapping items.
Immediately following an assessment’s administration, data are returned to students and teachers. Student data are reported by percent correct, and allow students to review their responses and either revise and resubmit their responses, or reveal the correct answers. Data at the class level are reported to the teacher in the form of a “heat map” (Figure 2), which lists the levels vertically (bottom to top) and lists the students from lowest to highest performing on the construct (left to right). Each cell represents a student’s score for an item at that level, color-coded from orange (incorrect) to blue (correct). One can visualize a boundary between the mostly orange and mostly blue squares by utilizing a Guttman-shaped curve (Guttman, 1950). To the left and above the curve student performance is weaker; to the right and below the curve student performance is generally stronger. From this representation, teachers learn to identify a horizontal boundary, above which students as a whole class show evidence of difficulty on one or more levels, and a vertical boundary, to the left of which a subgroup of students are struggling with the material overall.
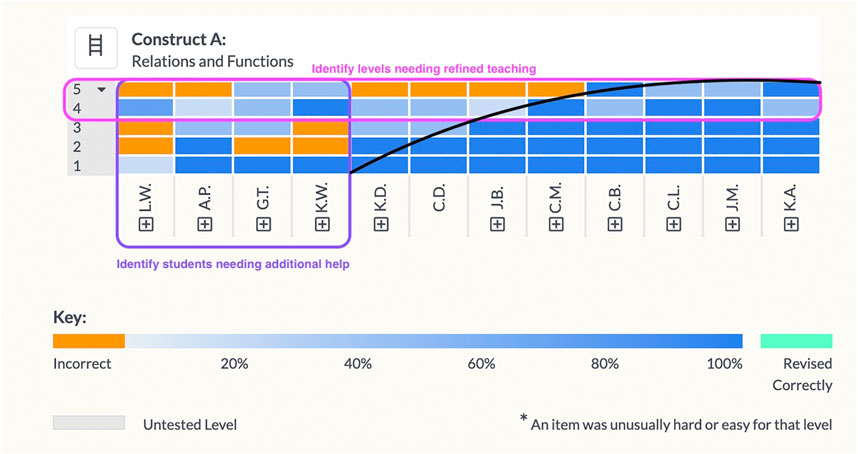
FIGURE 2. Class report: heatmap of the Relations and Functions the LT. Vertical axis: levels of LT, ordered from low (bottom) to high (top). Horizontal axis: student pseudonyms ordered by overall construct score, from low (left) to high (right). Each cell represents a single student’s score on an item measuring a single level.
To conduct the validation study, we proposed a set of questions associated with the claims that support our validation argument. The associations are listed at the end of the question. Each question is followed by the procedure used to answer it, a presentation of results, and a discussion.
Procedures, Results, and Discussion
Question 1. Considering Potential Multidimensionality and Different Possible Types of IRT Models, Which Model Does the Data Best Fit? (Claim 1)
Procedure for Q1: Item Response Theory Analyses
The analyses for this question involved comparing different models to establish which model was preferred for the cluster. Because the majority of the data comes from cluster tests that contain items from both the Relations and Functions LT and the Qualitative Graphing LT, the first step in the analyses involved comparing different IRT models to establish whether the two LTs should be modeled together in a unidimensional model or considered separately in a multidimensional model, as well as which IRT model should be used to derive the item difficulty estimates. To examine the independence, we estimated a unidimensional model (Model 1) which was equivalent to a model that assumes the correlation of both of the constructs is equal to 1 (Hatcher, 1994) and a two-dimensional model (Model 2) that assumed a simple structure, with each item aligned with the construct it was supposed to measure. We looked at the correlation of the latent construct scores from Model 2 and relative fit statistics of both models for evidence of whether the construct scores are independent (Model 2) or mutually dependent (Model 1). After the question of independence of the constructs was settled, we further compared partial credit Rasch and two-parameter logistic (2 PL) models of the data to choose the final model of the data. Either model could be preferred for the data. The Rasch model has only one parameter, item difficulty, which might ease interpretation, while the 2 PL model has two parameters, item difficulty and item discrimination, which might provide more nuanced information or a better fit for the data. Comparing the two models helps ensure that the item estimates for the later steps of analysis are as accurate as possible.
The IRT calibrations and model fit comparisons were conducted using the “MIRT” package (Chalmers, 2012) in R. The student response data, which included a mixture of dichotomous and polytomous data from cluster and construct tests, was read in, cleaned, and modeled in R. The relative fit statistics used were the Bayesian information criterion (BIC), sample-size adjusted BIC (SBIC), Akaike’s fit index (AIC), and corrected AIC (AICc). We also applied the chi-square difference test when comparing nested models and used the Metropolis-Hastings Robbins-Monro algorithm (MHRM) for all calibrations (Cai, 2010).
Results for Q1
The student response data came from 929 assessments at the cluster or construct level that were administered from school year (SY) 2016–17 through SY 2019–20. The data-cleaning process involved removing items that were retired or had fewer than 25 student responses, as well as assessments with fewer than six active items. The final number of items used in the analysis was 49 (26 items in Relations and Functions and 23 items in Qualitative Graphing). The number of student responses per item ranged from 25 to over 600 responses (average number of responses = 110) due to the items appearing on a differing number of forms over the years. 85% of the responses came from eighth grade students and 15% of the responses came from seventh grade students. The majority of the data came from cluster tests, but there were 204 Relations and Functions construct tests and 67 practice sessions included in the dataset as well.5
Once the dataset was finalized, the data were fit to the first two models to explore the independence of the constructs. The correlation of the latent construct scores in Model 2 was 0.88 (95% CI: 0.80, 1.01). Following guidance from Anderson and Gerbing (1988), the high correlation and confidence interval including the value of 1 for this model is evidence that the two constructs should be treated as mutually dependent and unidimensional. Further evidence was provided by the fit indices (Table 4) that show smaller values for Model 1 in the AIC, AICc, SBIC, and BIC to indicate better fit. The chi-square difference test similarly was rejected with p > 0.05. All of this evidence suggested that Model 1 should be favored over Model 2 and that the data from the two constructs should be considered mutually dependent for this analysis and so should be calibrated together in a unidimensional model.

TABLE 4. Comparison of fit statistics of two Confirmatory IRT models.
We compared the fit of two unidimensional models (Rasch and 2 PL) to determine which one the data fit better. The fit statistics primarily suggested the Rasch model over the 2 PL model with the AIC, AICc, SBIC, and BIC favoring the Rasch model. A further look at the R2 change statistic (de Ayala, 2009), which quantifies the difference in variance explained by the two models, revealed a minor 0.83% improvement in fit of the Rasch over the 2 PL model. The small practical differences between the models were also reflected in a high correlation of the theta estimates of the models (r = 0.99). We ultimately chose the simpler and better fitting Rasch model to generate the item difficulty estimates for the subsequent analyses.
Discussion of Q1
The results of this analysis supported the decision to use a unidimensional model with data from the Relations and Functions LT and Qualitative Graphing LT considered together. This was supported by considering the correlation of the two constructs in a multidimensional model and fit statistics for the unidimensional and multidimensional models. The final model chosen was a unidimensional Rasch model.
Question 2: To What Extent Does the Pattern of Item Difficulties Within and Across LTs for a Cluster Agree With the Pattern of Content Sophistication Within and Across LTs? (Claim 2)
Procedure for Q2
This section examines the structure of the item pool through the lens of empirical item difficulty, with difficulty defined by the b parameter from the Rasch Model in Q1. Because the Rasch model provides b parameters for each of the possible points in polytomous items, we chose to use the b parameter associated with getting all parts of an item correct (full credit) to be most similar to the dichotomous items which are scored as full or no credit. To answer Q2 we utilized linear regression to examine the relationship between item difficulty 2) and LT level, expressed as discrete numbers (1, 2, 3, ...) for each construct. We interpreted models with a positive slope and a high R2 as evidence that the pattern of content sophistication in the LTs is in fact reflected in the pattern of empirical item difficulties. Additionally, in order to determine if mis-fitting items were distorting the regression, after running a baseline model we sequentially.6 removed a single item based on its absolute residual value, re-ran the regression, and compared the new R2, residual sum of squares (RSS), and slope to the previous regression. We wanted to maximize the R2 value above 0.70 while also retaining as many items as possible. Finally, we examined the Spearman rank correlation of LT level and the item difficulty parameter b for the remaining subset of items. We interpreted strong positive correlations as further evidence that the pattern of content sophistication in the LTs are indeed reflected in the pattern of empirical item difficulties.
Results for Q2
Figure 3 and table 5 show the results of the sequential regression models generated for the construct “Relations and Functions” up to Level 6. We do not have data on Level 7, because the tool has not yet been piloted among high school students. The baseline model included all of the items, had a slope of 0.64, a sum of squares of 13.73, an R2 value of 0.69 and adjusted R2 of 0.68, suggesting that the relationship between LT level and item difficulty for this model was strongly positive and that it explained 69% of the variance in LT level by item difficulty. To improve the fit of the regression line, the absolute residual value for all of the items was considered; the item with the largest value was removed (Item 1263, n = 129). The regression run with the remaining 25 items showed minor improvement from the baseline model: the sum of squares decreased, however, the slope decreased to 0.59, and the R2 decreased to 0.68. Following the same pattern, four subsequent regressions were run, first removing Item 1265 (n = 68), then Item 1816 (n = 49), then Item 2242 (n = 25), and then Item 1267 (n = 37): the sum of squares decreasing to 5.65, while R2 fluctuated and ended up at 0.72.
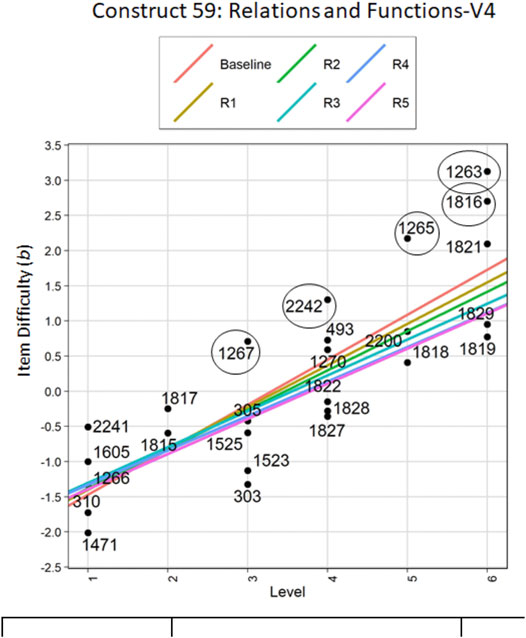
FIGURE 3. Linear regression of LT level (x-axis) predicting item difficulty (b, y-axis). Regression lines run sequentially after removing one item based on absolute residual value. Circled items were removed and remained out of the model for subsequent regressions.
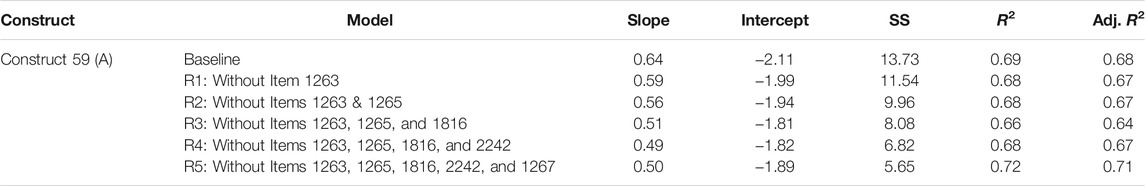
TABLE 5. Regression equations, R2 and sum of squares for sequential regression models.
Finally, to provide further evidence about the relationship between LT level and item difficulty the Spearman rank correlation coefficient was computed for the final model in each construct. It indicated a strong positive correlation of 0.88, significant at the p < 0.00 level.
Discussion of Q2
After removing five items that were sequentially identified as potentially non-conforming, based on their fit to a regression line modeling the desired positive relationship between item difficulty and ordered LT levels, the model of remaining items provided evidence of the increasing content sophistication of LT levels. The high values of R2 and adjusted R2 values suggest that a sufficient amount of variance in item difficulty can be explained by LT level. The high and positive value of the Spearman Rank correlation coefficient for the construct provided additional evidence supporting the agreement in the patterns of items and LT level.
Question 3: Which Items at Which Levels Show Evidence of Non-conformance to the Pattern of Item Difficulties Within and Across LTs, What Are the Likely Causes of Such Non-conformance, and What Should Be Done With Such Items? (Claim 2 and 3)
Procedure for Q3
The following procedure is used to examine each item provisionally-designated as non-conforming:
1. The LS team examines the item’s structure and empirical response behavior relative to its position in the LT, and suggests reason(s) for the item appearing not to conform.
2. Categories of variation relevant to each item are assigned: construct-irrelevant variation (Irrel-V), Intra-level (Intra-LV) or Inter-level (Inter-LV) variation.
3. Actions (one or more), based on the analysis of variation, are recommended from the following options:
a. Retire the item
b. Revise item to remove irrelevant variation
c. Revise item to adjust difficulty within level
d. Maintain item as is, and post an alert indicating that this item is known to be unusually hard or easy
e. Edit the level’s description to clarify range of or inclusion of items
f. Move the item or set of items to another level, or
g. Adjust order of levels
Action b addresses issues associated with Irrel-V, actions c-e address Intra-LV, and actions f-g address Inter-LV.
Examination for Irrel-V seeks to identify factors such as language or readability, representational ambiguity, use of unfamiliar terminology or context, being solvable by test-taking tricks, and other construct-irrelevant distractions such as too many steps, too many distractors, or too much time required to solve it. Irrel-V can also be identified by psychometric flags unrelated to the regression screening, during testing. Such psychometric flags are triggered if the DIF statistics, readability, word count, duration, or model-based misfit exceeds a threshold.
One tries to eliminate Irrel-V. However, a degree of Intra-LV is appropriate and expected based on restrictions on the test length of LT-based formative assessments, and because the items should assess the various aspects of the meaning of the level. General Intra-LV factors can include mathematical issues concerning the numeric values, directness of the question, familiarity or ease with the representation, availability of a calculator, or availability of additional visual support. The analysis is conducted by examining the description of the level, associated misconceptions, data from the item analysis, and other items at the level for comparison.
If one or more of the items at a level are identified as showing Inter-LV, the item(s) is/are considered relative to other levels. If the fit is better at a different level (e.g., with respect to substance and difficulty), the item(s) is/are moved. Such a relocation requires that the stepwise regression be run again to check whether different items become potentially non-conforming.
Results for Q3
Below, we illustrate the content- and learner-based distinctions considered in deciding adjustments, if any, to make with regard to of the five non-conforming items shown in Figure 3. Discussions of the other three items can be found in Supplementary Appendix SA.
Item 1267. The first non-conforming item (Figure 4) was difficult for the level; only 46% of the responses received full credit, and, 32% of the respondents reversed the answer, classifying the y = 3 graph as “1-to-many” and the x = 3 graph as “many-to-1”. In order to answer this item, students would draw on their skills, for classifying mappings into one of four categories, to visualize y = 3 as a many-to-one relationship (perhaps by analyzing the associated ordered pairs). Similarly, they should visualize x = 3 as a one-to-many relationship. Teachers often introduce the vertical line test (does a vertical line intersect a graph more than once) to procedurally disqualify a graph as a function, without adequately relating it to the analysis of that graph having a one-to-many mapping. Further, because a vertical line coincides with this graph (intersects with an infinite number of points), the vertical line test may be difficult for students to apply to the graph of x = 3. Therefore, analyzing this case in terms of a mapping diagram may prove more effective for students. These factors persuaded us that the item elicits a conceptual distinction that should be discussed by the teacher, so we decided to leave the item and flag it as difficult for the level.
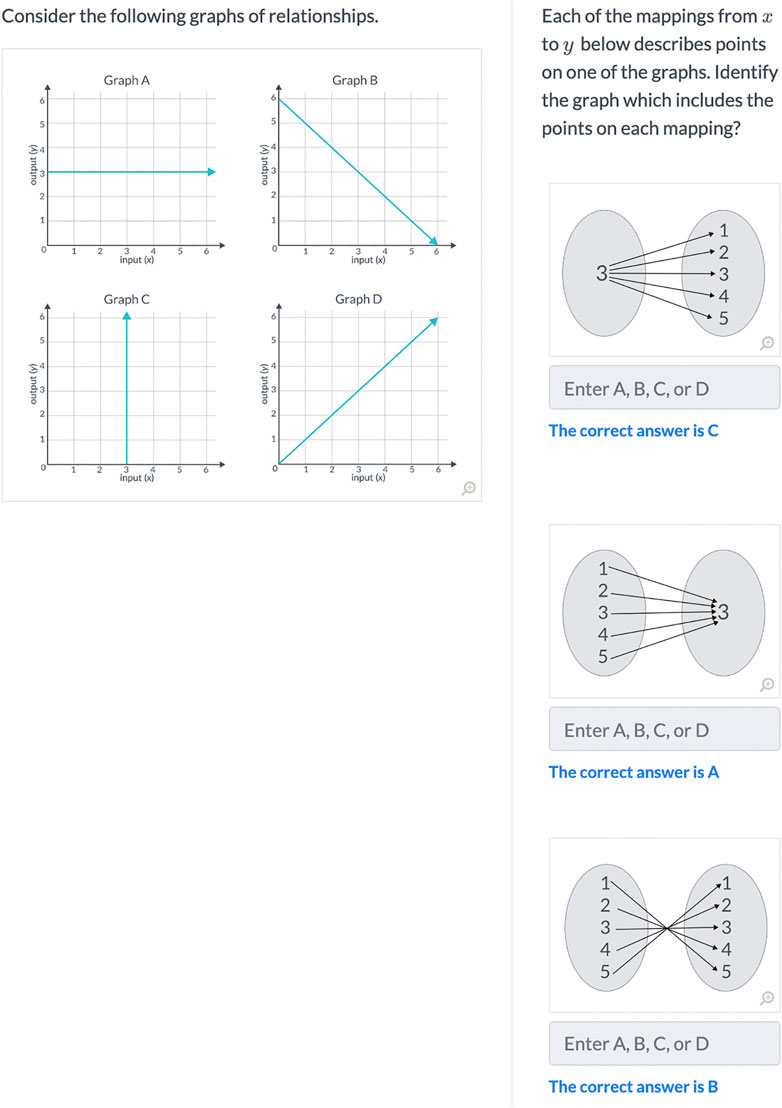
FIGURE 4. Item 1267 aligned to L3: “Given graphs or verbal descriptions of two-variable relations, classifies them as one to one, many-to-1, 1-to-many, or many-to-many”; difficulty parameter b = 0.71 (predicted: −0.39).
Item 1265. The second non-conforming item (Figure 5) reviewed by the LS team asked students to consider modeling the transport of 1,350 students on 72-passenger buses. The item has three parts: the first involved choosing a function that could model the scenario, the second involved finding the domain, and the third involved finding the range.
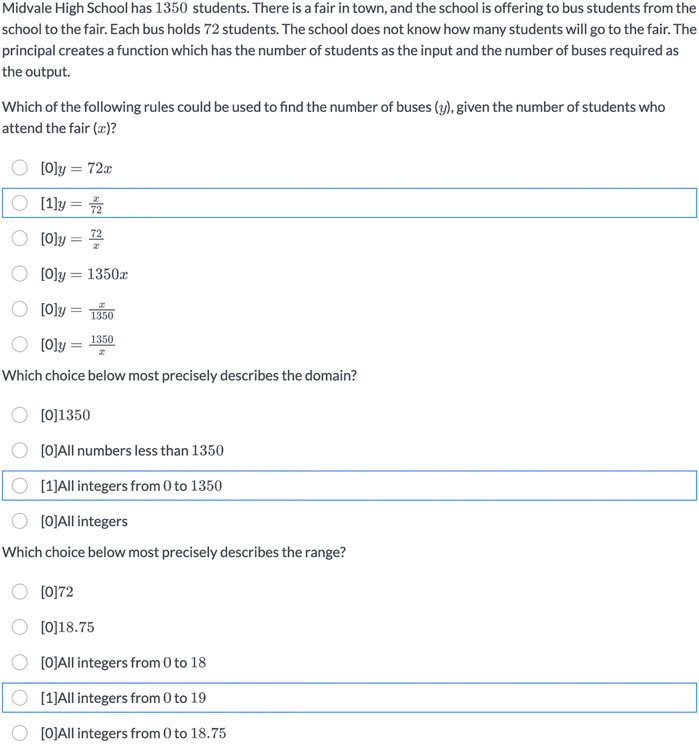
FIGURE 5. Item 1265 aligned to Level 5 “Given verbal descriptions of two-variable relations, graphs, or equations for linear functions, identifies their domain and range (including contextual restrictions)”; difficulty parameter b = 2.17 (predicted: 0.61).
In reviewing the first part, we noticed that only 40% respondents (n = 68) correctly picked
For the second part, we noticed that while 47% of the respondents (n = 68) correctly picked the restricted domain of all integers from 0 to 1,350, 18% selected the non-restricted domain “all number less than 1,350” and 13% selected the non-restricted domain “all integers”. For the third part, 44% of the respondents (n = 68) correctly picked the restricted range “all integers from 0 to 19” while another 10% selected an incorrectly restricted range of all integers from 0 to 18.
These results suggest that students may not be recognizing that an item’s context can introduce domain and range restrictions. At L2, there is no ambiguity in specifying domain and range, as students work with finite, discrete sets. At level 5, the students are specifying domains and ranges for continuous functions, and answers may be constrained to certain categories of numbers, undefined at certain points, or restricted due to contexts. We addressed the issue in two ways: 1) we revised the stem of the question to clarify that students were expected to select the most precise (instead of best) description of the domain (and range) and 2) we revised the level description to contain the phrase “including contextual restrictions” to signal that instruction should attend to restricted domains and ranges of continuous or dense functions. In our LT chart (Table 2), this appears in brackets to indicate that the change occurred as a result of this analysis.
Discussion of Q3
Of the five items identified in this construct as potentially non-conforming, three were adjusted (1263, 1265, and 1816). Two of the five items were retained without adjustment: one to collect more data (2242) and the other, flagged as difficult, to promote discussion (1267).
These decisions reflect the careful attention to and clarification of cases and issues that are associated with levels 3–6. At level 3, recognizing that categorization of mappings (from level 1) must be applied to the analysis of graphs, the LS team particularly valued the inclusion of the horizontal and vertical lines in the options. Teachers often teach students only to procedurally test if a graph is a function by observing if a vertical line passes through multiple points, without directly relating it to the categorization scheme from the lower level. The LS team concluded that trying to apply that test to a vertical line was likely to stimulate more conceptual discussion, so recommended retaining the item.
When reviewing the level 5 data, the LS team encountered three novel issues, insufficiently foreseen when building the LT: one pertaining to graphs or context and the others pertaining to use of a contextual problem. First, it became apparent that when specifying domains and ranges in continuous graphs or contexts, if the relevant discrete values were not specified, students found it difficult to precisely infer these sets to define domain and range. The LS team recognized that the use of “best” in the problem was vague and relied on “insider” knowledge. The word “precise” was substituted as a more accurate description. Secondly, the LS team realized that students did not immediately recognize that contextual situations could directly result in restrictions in the domain and range. And finally, when identifying domains and ranges in contextual problems, one is expected to report on all possible values for inputs and outputs, and not just the values associated with an optimal solution. This analysis led the team to realize that the level description should explicitly include the potential of restrictions due to context.
Question 4: After Accounting for Non-Conforming Items, to What Extent Do the LT Levels Explain Item Difficulty, and Can Additional Sources of Variation in Difficulty be Identified? (Claim 3)
Procedure for Q4
After removing the five non-conforming items from the regression analysis, we further explored the theoretical structure of the LT by examining the extent to which LT level explained item difficulty. The purpose of empirically testing the structure of the LT in this analysis is similar to the Q2 sequential regression analysis, this research question moves the focus from the individual items to LT level as a whole. We applied the linear logistic test model (LLTM) (Fischer, 1973) plus error (De Boeck et al., 2011) which explains the Rasch item difficulty in terms of item covariates. The model can be written as:
where
Results for Q4
The residual standard deviations and variances of the random intercepts for the items in the three models is shown in Table 6. The second model showed a large reduction in residual variance of 72% (from 1.09 to 0.30). This suggests that including LT level accounts for 72% of unexplained residual variance from the baseline model, providing strong evidence of the explanatory power of the LT levels for this construct. The third model (item type added as a covariate) had a reduction of residual variance of 43% from the second model, suggesting that the different item types also account for a significant amount of variance in item difficulty. Finding these significant decreases in residual variance for the models with LT level and item type highlights the possibilities of this type of model for providing validity evidence about the explanatory power of the LT.
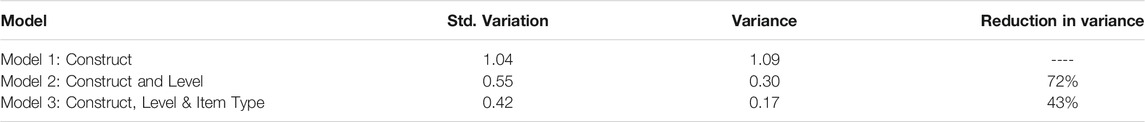
TABLE 6. Random effects: Residual variances by model and fixed effects of model 3.
We also examined the fixed effect estimates of the third model (Table 7) for evidence about the structure of the LT. The estimates in the table represent the effect that component (LT level or item type) had on the Rasch item parameter, d, which quantifies an item’s “easiness” (d is the multiplicative inverse of the item difficulty parameter b). After accounting for the item type covariates, the estimates generally follow an expected pattern of moving from higher (easier) values for the lowest LT level to lower values (more difficult) for the highest level. Level 2 does appear to be out of order but is also not significant and only based on two items at the level; it bears further attention as more data are collected. The other levels’ estimates are significant (at least p < 0.10) and suggest an increase in difficulty with level.
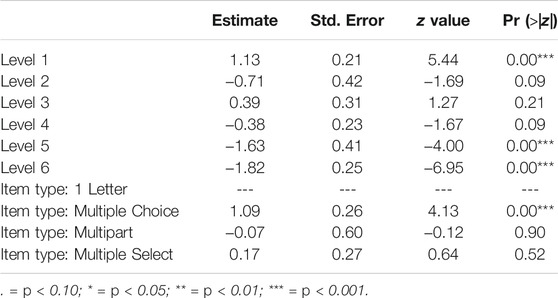
TABLE 7. Fixed effects estimates for relations and functions LT from model 3.
The other covariates of item type suggest the ways in which item type may affect item difficulty in this relational cluster. For instance, the estimates suggest that, relative to the one Letter items which were the intercept, multiple choice items were systematically and significantly easier, while multi-part items were more difficult although that estimate was not significant. As the psychometrics team works with the LS team to identify more item characteristics that could contribute to variance, such as context, the LLTM could be used to test and model how those characteristics may contribute to item difficulty.
Discussion of Q4
Using LLTM analysis to compare models with construct, LT level, and item type as covariates, we found that adding the covariates of LT level and item type reduced the amount of error variance, suggesting that LT and item type helped explain the variance in item difficulty. The LT levels were associated with the largest increase in item difficulty and were generally ordered sequentially in terms of magnitude, which provides further evidence of the relationship between item difficulty and the pattern of levels. The significant decrease in error variance once item type was added suggests that item type and other variables, such as context or readability, may be able to give additional insight into causes of item difficulty variation and provide a meaningful setting for collaboration between psychometrics and LS.
Question 5: When Provided One Class’s Data on Student Performance, How Should Teachers Interpret the Data and Decide on What Modifications to Make to Instruction? (Claims 4 and 5)
Procedure for Q5
In order to examine the question of whether the LT can validly be interpreted to provide adequate guidance for instructional modification, we chose to analyze (actual) heatmap data for one eighth grade class (Figure 6). In lieu of a teacher’s analysis of this heatmap, we conducted a hypothetical analysis to illustrate: 1) what is expected from teachers using such data, 2) the degree of precision needed for making content- and learner-based conjectures about how to modify instruction.
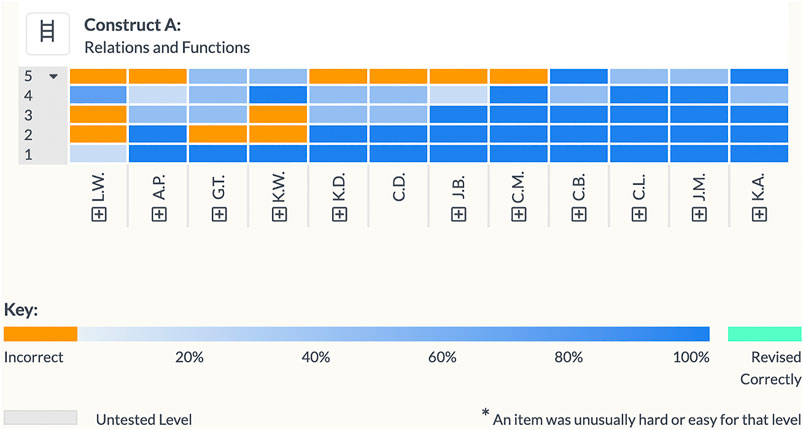
FIGURE 6. Class report: heatmap for the Relations and Functions LT.
Our hypothetical teacher, Ms. B, begins by scanning the heat map in order to use the data formatively to modify her instruction. She notes that most of the students show mastery of levels 1–3, but moderate difficulty at level 4 and struggle with level 5. Four students exhibited some difficulties at the lower levels; one student struggled across the board. Note: these data are from a class at one of our schools; with the small n’s, all analyses would be tentative and flexible, as is necessary in classroom instruction.
Ms. B then engages in data interpretation, beginning contextualizing the data (Mandinach et al., 2011). This requires two types of analysis. The first requires her to examine the performance on various items as situated in the LT’s hierarchical structure. She considers how behavior on items and their distractors relates to the meaning of items’ level, and, further, how the level is situated in its sequence of levels. In the second analysis, she considers how the data patterns relate to: 1) her use of curricular and instructional approaches and 2) the specific needs of students in her class. Based on these analyses, she generates specific conjectures about how to modify her instruction to improve learning outcomes. A teacher is asked to write these in the form of “based on data from <topic> LT showing evidence of <student learning> in (designated levels, items, or options), I conjecture that <some/all> students will improve learning if they develop more proficiency in <idea>.”
Based on the heatmap, Ms. B. knows her class needs work on level 5, but she first reviews the levels below 5. She recalls that at levels 1 and 3, students classified mapping diagrams, ordered pairs, tables and graphs as 1-to-1, 1-to-many, many-to-1, and many-to-many. At level 4, items assess whether students could identify functions from among mappings.
Among the response patterns for the L4 item (Figure 7), she observed that many students received partial credit and, further, that their incorrect responses were observed across all options. So, aware that she and the book had stressed the vertical line test, her first interpretation was that it was not surprising that ¾ths of the students correctly rejected the circle as a function. On the fourth option, 92% of students answered correctly and she conjectured that because the y-value of 12 appeared three times in the list of coordinate pairs, the students correctly classified this as many-to-one, which would be a function. But then she was surprised that 50% of the students got option two wrong, because it tested similar ideas as option 4 (no x-values were associated with multiple y-values, and a y-value (y = 7) had two arrows going to it, but so it was also many-to-one and therefore a function).
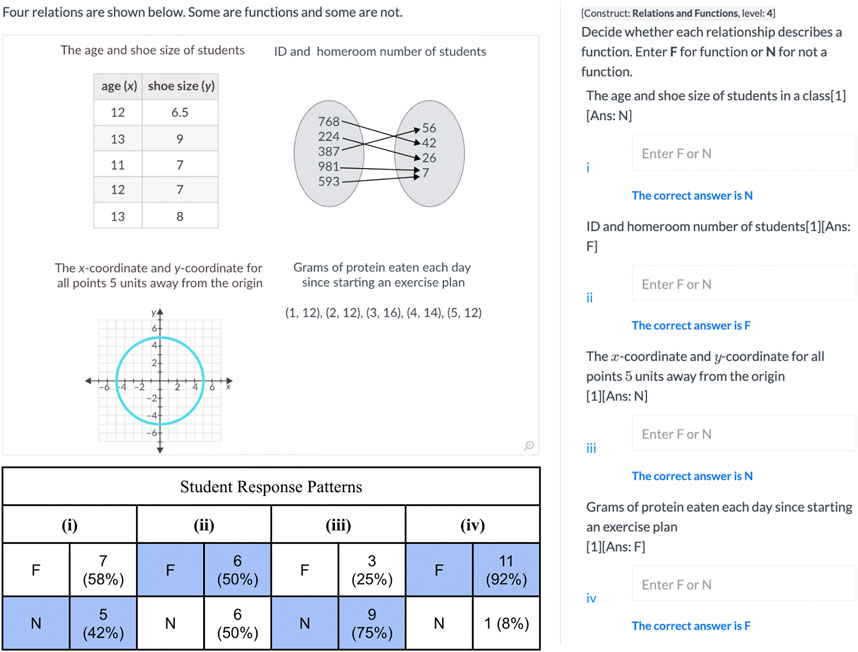
FIGURE 7. Item 1,270 aligned to Level 4 “Defines a function as a relation which is one to one or many-to-1, but not 1-to-many or many-to-many, and applies the definition to discrete relations, verbal descriptions of two-variable relations, or graphs”.
On option 1, she noted that over half the class described the table of values as a function, even though there were x-values that mapped to multiple y-values and different x-values mapped to the same y-value, making the relation many-to-many, and not a function. She wondered if perhaps the students had not had enough experience with many-to-many relations. Re-examining the textbook, she confirmed that it had very few examples of mapping problems involving many-to-many relations. Many texts do not treat this as a separate category, expecting students to categorize these examples as both 1-to-many and many-to-1.
Looking back at the heat map, Ms. B noted that most of her class was unsuccessful at level 5, where students had received one of two problems to solve.7 The task in Figure 8 required students to find the domain and range for an applied problem that provided an equation relating the number of gallons of gas to their purchase cost. The fuel tank capacity and the cost per gallon were given; students were asked to give the domain and range. One third of the students correctly specified the domain and range as a closed interval. One third described the domain but failed to put a lower bound at zero on either the number of gallons or the price, 17% reversed the two correct answers, and 17% thought the domain and range consisted of the single coordinate pair that solved the problem. Examining their performance on level 2, Ms. B confirmed the students understood that the input was the domain, and the output was the range. She decided she needed to emphasize that there can be restrictions on the domain and range that come from the context. And she wanted to discuss why the answer was an interval and not one single maximizing value. She knew that this class had a tendency to rush, racing to solutions without careful attention when reading.
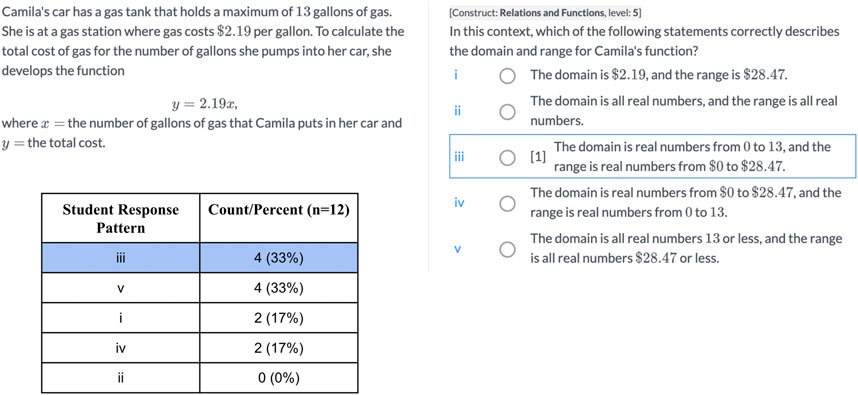
FIGURE 8. Item 1818 aligned to Level 5 “Given verbal descriptions of two-variable relations, graphs, or equations for linear functions, identifies their domain and range”.
In applying the LT-DDDM framework, Ms. B would be asked to consolidate her interpretations into a set of conjectures to test with instructional modifications. For this data set, we hypothesize that she might propose three conjectures (written in first person):
1. Based on data from Relations and Functions LT showing evidence that 42% of students neither fully interpreted the variables in context nor restricted the domain or range, with an additional 17% exhibiting one or the other of said behaviors, in L5 items 1818 and 2,200, I conjecture that many students will improve learning if they develop more proficiency in fully interpreting the variables and writing precise intervals for domain and range based on the context.
2. Based on data from Relations and Functions LT showing evidence that 58% failed to recognize the many-to-many relationship in the table and 50% failed to recognize the 1-to-many relationship in the mapping diagram at the level 4 item 1,270, I conjecture that many students will improve learning if they develop more proficiency in categorizing tables and mapping diagrams into cases that include experience with many-to-many relations.
3. Based on data from Relations and Functions LT showing evidence that 25% of the students were not able recognize the many-to-many relationship in the graph of a circle at the level 4 item 1,270, I conjecture that some students will improve learning if they develop more proficiency in relating the vertical line test to the various categorizations of mappings.
Discussion of Q5
These conjectures generated from the hypothetical analysis of the heatmap conducted using the LT-DDDM framework are specific and diagnostic compared to the typical kinds of interpretations drawn from results on individual items in domain sampling tests. Even provided with LT-data in heatmaps within MM6-8, teachers exhibited difficulties in generating precise and accurate interpretations of data and subsequently translating them into classroom tasks (Confrey and Shah, 2021). However, our ability to interpret a class’s heatmap using the LT-DDDM framework and generate specific diagnostic conjectures shows promise, even as it requires additional research to thoroughly complete a validation study. Thus, our validation argument which spans the design, use and interpretation of data from an LT-based assessment is bolstered by the addition of a clear articulation of an approach to instructional change. We outline one in which teachers are viewed as essential partners in the process of data interpretation and use.
However, successful use of the framework relies on teachers buying into and trusting the LTs and their underlying theory of learning. The trajectories not only describe behaviors and cognitive beliefs at each level, but they describe the underlying movement from naive to sophisticated reasoning. For the Relations and Functions LT, based on a foundation in categorizing different kinds of mapping in discrete and finite settings, learners extend that reasoning into rich contexts and a variety of relations (expressed as graphs and equations) to define and work with domains, ranges, and definitions of functions. It is the movement that matters, and the levels are indicators of that movement. Thus, teachers need the theory of LTs, specific knowledge of the relevant trajectory, and the LT-DDDM to interpret and apply the data.
Limitations
This study included data interpretations from a single teacher which provides a biased perspective on the analyses of items. Future studies should collect data from teachers with a variety of experience with teaching and MM. Another limitation involves the inherent tension between the use of IRT which focuses primarily on empirical estimates of ability and the emphasis on the contextualization of learning inherent to learning theories such as LTs (e.g., Snow and Lohman, 1989; Mislevy, 1996). We attempt to address this challenge by considering multiple IRT models and closely investigating, rather than eliminating, items that do not fit expected patterns. The use of IRT in this validation process was based on practical considerations, as well as established methods in the field, however, alternative models could be considered for the future.
Conclusion
Diagnostic formative classroom assessments based on LTs have the potential to provide relevant and timely data to students and teachers that can lead to data-driven instructional improvements. To realize that potential, however, clear expectations regarding validation processes must be developed for LT-based diagnostic formative assessment systems. Those processes must be woven into a larger validation argument that spans the construction of the measures, the gathering and interpretation of measurement data in relation to psychometric models, and the measures’ use and impact in the classroom. In this article, we have presented the structure of our validation argument as a set of six claims and showed how those claims rest on a theory of learning that underlies the concept of an LT, an application of a psychometric model to LTs, and a framework of LT-based data driven decision-making.
We have published a variety of articles communicating our progress to date. Confrey (2019a) summarized the current state of international scholarship on mathematics LTs for the Organization of Economic Cooperation and Development (OECD). With respect to MM6-8, Confrey et al. (2020) summarized the results of the first round of validation studies across all 60 constructs in the learning map. Two other articles describe our validation framework and report on validation studies focusing on the first four claims for two clusters (Measuring Characteristics of Circles and Finding Key Percent Relationships) (Confrey et al., 2017; Confrey and Toutkoushian, 2019). Confrey et al. (2019a) and Confrey and Shah (2021) report on patterns of how teachers use MM6-8 in practice, both individually and collectively in PLCs. Our interest in writing this article has been to emphasize that validation processes need deep, enduring, content-driven collaborations among psychometricians, learning scientists, and practitioners. In reporting on our validation study, we offer detailed examples of content, measurement, and pedagogical exchanges.
Specifically, in this article, after articulating an overall structure of a validation argument using claims and evidence, we applied it in order to conduct a validation study of a specific LT (“Relations and Functions”). We were able to show a significant correlation (0.88) between item difficulty parameters (excluding those of potentially non-conforming items) and the LT levels allowing us to psychometrically recover the LTs structure. For the excluded items, based on the LT, we proposed explanations for variation in item difficulty, made adjustments to the items, and proposed other actions that focused attention on the learner. We interpreted class-level data to demonstrate that it could be used to generate actionable conjectures for instructional interventions.
This validation study underlines the critical importance of the deep professional collaboration--among LS, psychometricians and practitioners in building and validating diagnostic formative assessment systems at scale--that resembles a “trading zone” (Lehrer, 2013). In a trading zone, there is no external medium of exchange to co-measure the expertise of another; instead, what each participant brings as expertise must prove valuable to the others in the pursuit of the shared goals, in this case the improvement of student learning. In the Relations and Functions example, learning scientists received information from the psychometricians on item difficulty as modeled in the Rasch model. The LS team and the psychometrician generated and debated possible explanations for and adjustments to potentially non-conforming items. Adjustments would be tested in subsequent rounds of validation studies. Similarly, data reports to practitioners can be interpreted in the context of curriculum, students, or circumstances of testing, shedding light on interpretations and changing conditions. Multiple perspectives strengthen the evidentiary base for validation arguments.
The need for deep and enduring collaboration is predicated on the fact that learning fundamentally evolves. Successful assessment thus has a moving target that requires timely and relevant feedback. The details about the content learning matter: students need the right feedback at the right time. Further, the approach needs to recognize that learning takes place in social settings, and hence needs to support the dialogue and interactions among peers and with teachers, making the idea of positioning along an LT subject to interactions. As a result, we regard LTs as boundary objects among these diverse groups of experts, and as such, believe that they will be useful to the degree that they are shaped by all parties working in ongoing, mutually respectful partnership.
Data Availability Statement
The datasets presented in this article are not readily available because IRB restrictions. Requests to access the datasets should be directed to https://research.ncsu.edu/administration/compliance/research-compliance/irb/irb-for-researchers/.
Ethics Statement
The studies involving human participants were reviewed and approved by North Carolina State University. Written informed consent to participate in this study was provided by the participants’ legal guardian/next of kin.
Author Contributions
All authors listed have made a substantial, direct, and intellectual contribution to the work and approved it for publication.
Funding
This work was supported by the National Science Foundation under Grant No. DRL-1621254. Any opinions, findings, and conclusion or recommendations expressed in this material are those of the author(s) and do not necessarily reflect the views of the National Science Foundation.
Conflict of Interest
The authors declare that the research was conducted in the absence of any commercial or financial relationships that could be construed as a potential conflict of interest.
Publisher’s Note
All claims expressed in this article are solely those of the authors and do not necessarily represent those of their affiliated organizations, or those of the publisher, the editors and the reviewers. Any product that may be evaluated in this article, or claim that may be made by its manufacturer, is not guaranteed or endorsed by the publisher.
Supplementary Material
The Supplementary Material for this article can be found online at: https://www.frontiersin.org/articles/10.3389/feduc.2021.654353/full#supplementary-material
Footnotes
1It is currently being expanded to include topics from Algebra 1, adding two additional big ideas
2Understand that a function is a rule that assigns to each input exactly one output. The graph of a function is the set of ordered pairs consisting of an input and the corresponding output. Compare properties of two functions each represented in a different way (algebraically, graphically, numerically in tables, or by verbal descriptions). For example, given a linear function represented by a table of values and a linear function represented by an algebraic expression, determine which function has the greater rate of change
3See page 29 for the discussion
4Further demographic breakdown of students for each district is not available
5Previous analysis within the team has suggested that construct test and single session practice data of six or more items performs similarly to cluster test data in IRT analysis, although more research on that data is warranted as more data is accumulated
6While this type of sequential variable selection has well-documented challenges, including biasing regression statistics and coefficients and vulnerability to sampling error (e.g., Miller, 2002; Roecker, 1991), we decided to use this as an exploratory method to identify and prioritize potentially non-conforming items and areas of LTs that should be looked at more closely in the analysis for Question 3
7For this article, we selected one of these two problems to illustrate how Ms. B’s review may have been conducted. See Appendix for review of the other level 5 item review
References
Anderson, J. C., and Gerbing, D. W. (1988). Structural Equation Modeling in Practice: A Review and Recommended Two-step Approach. Psychol. Bull. 103 (3), 411–423. doi:10.1037/0033-2909.103.3.411
Bates, D., Maechler, M., Bolker, B., and Walker, S. (2015). Fitting Linear Mixed-Effects Models Using Lme4. J. Stat. Softw. 67 (1), 1–48. doi:10.18637/jss.v067.i01
Bernbaum Wilmot, D., Schoenfeld, A., Wilson, M., Champney, D., and Zahner, W. (2011). Validating a Learning Progression in Mathematical Functions for College Readiness. Math. Thinking Learn. 13 (4), 259–291. doi:10.1080/10986065.2011.608344
B. J. Fishman, W. R. Penuel, A.-R. Allen, and B. H. Cheng. (2013). Design-based Implementation Research: Theories, Methods, and Exemplars (New York: Teachers College), Vol. 112.
Briggs, D. C., and Peck, F. A. (2015). Using Learning Progressions to Design Vertical Scales that Support Coherent Inferences about Student Growth. Meas. Interdiscip. Res. Perspect. 13 (2), 75–99. doi:10.1080/15366367.2015.1042814
Cai, L. (2010). High-dimensional Exploratory Item Factor Analysis by a Metropolis-Hastings Robbins-Monro Algorithm. Psychometrika 75 (1), 33–57. doi:10.1007/s11336-009-9136-x
Carney, M. B., and Smith, E. V. (2017). Analyzing Item Measure Hierarchies to Develop a Model of Students' Proportional Reasoning. San Antonio, TX: Paper presented at the American Education Research Association Annual Meeting.
Chalmers, R. P. (2012). Mirt: A Multidimensional Item Response Theory Package for the R Environment. J. Stat. Softw. 48 (6), 1–29. doi:10.18637/jss.v048.i06
Clements, D. H., Sarama, J. H., and Liu, X. H. (2008). Development of a Measure of Early Mathematics Achievement Using the Rasch Model: the Research‐Based Early Maths Assessment. Educ. Psychol. 28 (4), 457–482. doi:10.1080/01443410701777272
Clements, D. H., and Sarama, J. (2004). Learning Trajectories in Mathematics Education. Math. Thinking Learn. 6 (2), 81–89. doi:10.1207/s15327833mtl0602_1
Cobb, P., Confrey, J., diSessa, A., Lehrer, R., and Schauble, L. (2003). Design Experiments in Educational Research. Educ. Res. 32 (1), 9–13. doi:10.3102/0013189x032001009
Confrey, J., Gianopulos, G., McGowan, W., Shah, M., and Belcher, M. (2017). Scaffolding Learner-Centered Curricular Coherence Using Learning Maps and Diagnostic Assessments Designed Around Mathematics Learning Trajectories. ZDM Maths. Edu. 49 (5), 717–734. doi:10.1007/s11858-017-0869-1
Confrey, J., Maloney, A. P., Belcher, M., McGowan, W., Hennessey, M., and Shah, M. (2018). The Concept of an Agile Curriculum as Applied to a Middle School Mathematics Digital Learning System (DLS). Int. J. Educ. Res. 92, 158–172. doi:10.1016/j.ijer.2018.09.017
Confrey, J., Maloney, A. P., and Nguyen, K. H. (2014a). “Learning Trajectories in Mathematics. Introduction,” in Learning over Time: Learning Trajectories in Mathematics Education. Editors A. P. Maloney, J. Confrey, and K. H. Nguyen (Charlotte, NC): Information Age), xi–xxii.
Confrey, J., Maloney, A. P., Nguyen, K. H., and Rupp, A. A. (2014b). “Equipartitioning, a Foundation for Rational Number Reasoning: Elucidation of a Learning Trajectory,” in Learning over Time: Learning Trajectories in Mathematics Education. Editors A. P. Maloney, J. Confrey, and K. H. Nguyen (Charlotte, NC: Information Age), 61–96.
Confrey, J., and Shah, M. (2021). Examining Instructional Change at Scale Using Data from Diagnostic Assessments Built on Learning Trajectories. ZDM-Math. Educ. 1–19.
Confrey, J., Shah, M., Persson, J., and Ciliano, D. (2019a). “The Conceptual and Practical Challenges of Taking Learning Trajectories to Scale in Middle School Math,” in Proceedings of the Forty-First Annual Meeting of the PME-NA. Editors S. Otten, A. G. Candela, Z. de Araujo, C. Haines, and C. Munter (St. Louis, MO: University of Missouri), 34–43.
Confrey, J., and Toutkoushian, E. (2019). “A Validation Approach to Middle-Grades Learning Trajectories within a Digital Learning System Applied to the "Measuring Characteristics of Circles",” in Quantitative Measures of Mathematical Knowledge: Researching Instruments and Perspectives. Editors J. Bostic, E. Krupa, and J. Shih (New York: Routledge), 67–92. doi:10.4324/9780429486197-4
Confrey, J., Toutkoushian, E., and Shah, M. (2019b). A Validation Argument from Soup to Nuts: Assessing Progress on Learning Trajectories for Middle-School Mathematics. Appl. Meas. Edu. 32 (1), 23–42. doi:10.1080/08957347.2018.1544135
Confrey, J., Toutkoushian, E., and Shah, M. (2020). Working at Scale to Initiate Ongoing Validation of Learning Trajectory-Based Classroom Assessments for Middle Grade Mathematics. J. Math. Behav. 60. doi:10.1016/j.jmathb.2020.100818
de Ayala, R. J. (2009). The Theory and Practice of Item Response Theory. New York, NY: The Guilford Press.
De Boeck, P., Bakker, M., Zwitser, R., Nivard, M., Hofman, A., Tuerlinckx, F., et al. (2011). The Estimation of Item Response Models with the Lmer Function from the Lme4 Package in R. J. Stat. Softw. 39 (12), 1–28. doi:10.18637/jss.v039.i12
Fischer, G. H. (1973). The Linear Logistic Test Model as an Instrument in Educational Research. Acta Psychologica 37 (6), 359–374. doi:10.1016/0001-6918(73)90003-6
Freudenthal, H. (1987). “Mathematics Starting and Staying in Reality,” in Proceedings of the USCMP Conference on Mathematics Education on Development in School Mathematics around the World. Editors I. Wirszup, and R. Street (Reston, VA: NCTM).
Galison, P. (1997). Image and Logic: A Material Culture of Microphysics. University of Chicago Press.
Graf, E. A., and van Rijn, P. W. (2016). “Learning Progressions as a Guide for Design: Recommendations Based on Observations from a Mathematics Assessment,” in Handbook of Test Development. Editors S. Lane, M. R. Raymond, and T. M. Haladyna. 2nd ed. (New York, NY: Taylor & Francis), 165–189.
Guttman, L. (1950). “The Principal Components of Scale Analysis,” in Measurement and Prediction. Editor S. A. Stouffer (Princeton, NJ: University Press), 312–361.
Haertel, E. H., and Lorie, W. A. (2004). Validating Standards-Based Test Score Interpretations. Meas. Interdiscip. Res. Perspective 2 (2), 61–103. doi:10.1207/s15366359mea0202_1
Hamilton, L., Halverson, R., Jackson, S. S., Mandinach, E., Supovitz, J. A., and Wayman, J. C. (2009). Using Student Achievement Data to Support Instructional Decision MakingIES Practice Guide. NCEE 2009-4067. National Center for Education Evaluation and Regional Assistance.
Hatcher, L. (1994). A Step-by-step Approach to Using Sas for Factor Analysis and Structural Equation Modeling. Cary, NC: SAS Institute.
National Research Council (2001). in Knowing what Students Know: The Science and Design of Educational Assessment. Editors J. W. Pellegrino, N. Chudowsky, and R. Glaser (Washington, D.C.: National Academies Press).
Kane, M. T. (2006). “Content-related Validity Evidence in Test Development,” in Handbook of Test Development. Editors M. T. Haladyna, and M. S. Downing (Mahwah, NJ: Lawrence Erlbaum Associates), 131–153.
Kolen, M. J., and Brennan, R. L. (2004). Test Equating, Scaling,and Linking. New York, NY: Springer.
Latour, B. (1999). Pandora's hope: Essays on the Reality of Science Studies. Harvard University Press.
Lehrer, R. (2013). “A Learning Progression Emerges in a Trading Zone of Professional Community and Identity,” in Quantitative Reasoning in Mathematics and Science Education. Editors R. L. Mayes, and L. L. Hatfield (Laramie: University of Wyoming), 3, 173–186.
Lehrer, R., Kim, M. J., Ayers, E., and Wilson, M. (2014). “Toward Establishing a Learning Progression to Support the Development of Statistical Reasoning,” in Learning over Time: Learning Trajectories in Mathematics Education. Editors A. P. Maloney, J. Confrey, and K. H. Nguyen (Charlotte, NC: Information Age Publishers), 31–59.
Lehrer, R., and Schauble, L. (2015). Learning Progressions: The Whole World Is Not a Stage. Sci. Ed. 99 (3), 432–437. doi:10.1002/sce.21168
Mandinach, E. B., Gummer, E. S., and Muller, R. D. (2011). “The Complexities of Integrating Data-Driven Decision Making into Professional Preparation in Schools of Education: It’s Harder Than You Think,” in Report from an invitational meeting (Alexandria, VA: CNA Education).
Mason, A. J. (2012). “OpenSolver - an Open Source Add-In to Solve Linear and Integer Progammes in Excel,” in Operations Research Proceedings 2011. Editors D. Klatte, H.-J. Lüthi, and K. Schmedders (Berlin, Germany: Springer), 401–406. doi:10.1007/978-3-642-29210-1_64
Messick, S. (1989). “Validity,” in Educational Measurement. Editor R. L. Linn (New York, NY: Macmillan), 13–103.
Mislevy, R. J., Steinberg, L. S., and Almond, R. G. (2003). Focus Article: On the Structure of Educational Assessments. Meas. Interdiscip. Res. Perspective 1 (1), 3–62. doi:10.1207/s15366359mea0101_02
Mislevy, R. J. (1996). Test Theory Reconceived. J. Educ. Meas. 33 (4), 379–416. doi:10.1111/j.1745-3984.1996.tb00498.x
National Council on Measurement in Education (2017). Special Conference on Classroom Assessment and Large-Scale Psychometrics: The Twain Shall Meet. Lawrence, KS.
National Research Council (1998). The Nature and Role of Algebra in the K-14 Curriculum. Washington, DC: National Academy Press.
Nichols, P. D., Kobrin, J. L., Lai, E., and Koepfler, J. (2016). “The Role of Theories of Learning and Cognition in Assessment Design and Development,” in The Handbook of Cognition and Assessment: Frameworks, Methodologies, and Applications. Editors A. A. Rupp, and J. P. Leighton (West Sussex, UK: John Wiley & Sons), 15–40. doi:10.1002/9781118956588.ch2
Patz, R. J., and Junker, B. W. (1999). Applications and Extensions of MCMC in IRT: Multiple Item Types, Missing Data, and Rated Responses. J. Educ. Behav. Stat. 24 (4), 342–366. doi:10.2307/1165367
Pellegrino, J. W., DiBello, L. V., and Goldman, S. R. (2016). A Framework for Conceptualizing and Evaluating the Validity of Instructionally Relevant Assessments. Educ. Psychol. 51 (1), 59–81. doi:10.1080/00461520.2016.1145550
Pham, D., Bauer, M., Wylie, C., and Wells, C. Using Cognitive Diagnosis Models to Evaluate a Learning Progression Theory. (in press).
Shepard, L. A., Penuel, W. R., and Pellegrino, J. W. (2018). Using Learning and Motivation Theories to Coherently Link Formative Assessment, Grading Practices, and Large-Scale Assessment. Educ. Meas. Issues Pract. 37 (1), 21–34. doi:10.1111/emip.12189
Snow, R. E., and Lohman, D. F. (1989). “Implications of Cognitive Psychology for Educational Measurement,” in The American council on Education/Macmillan Series on Higher Education. Educational Measurement. Editor R. L. Linn (Washington, DC: Macmillan Publishing Co, Inc; American Council on Education), 263–331.
Toutkoushian, E., Confrey, J., and Shah, M. (20192019). “Exploring the Relationships Among Usage and Performance on Learning-Trajectory Aligned Classroom Assessments and Performance and Growth on State-wide Summative Assessments,” in Paper presented at the National Council on Measurement in Education’s special conference on Classroom Assessment (Boulder, CO).
Keywords: validation, learning trajectories, diagnostic, mathematics, middle grades, formative assessment, classroom assessment, psychometrics
Citation: Confrey J, Shah M and Toutkoushian E (2021) Validation of a Learning Trajectory-Based Diagnostic Mathematics Assessment System as a Trading Zone. Front. Educ. 6:654353. doi: 10.3389/feduc.2021.654353
Received: 16 January 2021; Accepted: 09 August 2021;
Published: 26 August 2021.
Edited by:
Laine P. Bradshaw, University of Georgia, United StatesReviewed by:
Kim Koh, University of Calgary, CanadaNeal M. Kingston, University of Kansas, United States
Copyright © 2021 Confrey, Shah and Toutkoushian. This is an open-access article distributed under the terms of the Creative Commons Attribution License (CC BY). The use, distribution or reproduction in other forums is permitted, provided the original author(s) and the copyright owner(s) are credited and that the original publication in this journal is cited, in accordance with accepted academic practice. No use, distribution or reproduction is permitted which does not comply with these terms.
*Correspondence: Jere Confrey, amVyZV9jb25mcmV5QG5jc3UuZWR1