Diagnosing Stagnant Gas Bubbles in a Polymer Electrolyte Membrane Water Electrolyser Using Acoustic Emission
 Maximilian Maier1
  Quentin Meyer2
  Jude Majasan1
  Rhodri E. Owen1,3
  James B. Robinson1,3
  James Dodwell1 Yunsong Wu1 Luis Castanheira4
  Gareth Hinds4
  Paul R. Shearing1,3 Dan J. L. Brett1,3*
- 1Electrochemical Innovation Lab, Department of Chemical Engineering, UCL, London, United Kingdom
- 2School of Chemistry, UNSW, Sydney, NSW, Australia
- 3The Faraday Institution, Quad One, Harwell Science and Innovation Campus, Didcot, United Kingdom
- 4National Physical Laboratory, Teddington, United Kingdom
The use of acoustic emission as a low-cost, non-destructive, and operando diagnostic tool has been demonstrated for a range of electrochemical energy conversion and storage devices, including polymer electrolyte membrane water electrolysers (PEMWEs) and fuel cells. In this work, an abrupt change in acoustic regime is observed during operation of a PEMWE as the current density is increased from 0.5 to 1.0 A cm−2. This regime change is marked by a sudden drop in the number of acoustic hits, while hit duration, amplitude, and energy increase significantly. It is found that the change in acoustic regime coincides with a significant extension of the stagnant bubble region in the flow channels of the PEMWE, observed with high-speed optical imaging. These results demonstrate that acoustic emission can be used effectively as an operando diagnostic tool to monitor bubble formation (two-phase flow conditions) in PEMWEs, facilitating rapid testing or prototyping, and contributing to operational safety.
Introduction
Polymer electrolyte membrane water electrolysers (PEMWEs) represent one of the most promising approaches to the production of “green” hydrogen and large-scale energy grid stabilization. The technology is likely to replace the widely commercially used alkaline electrolysis due to advantages including lower voltage at equal current density, lower gas crossover, compact build, and the possibility of high-pressure operation (Carmo et al., 2013). While currently more expensive than the alternative alkaline technology, the capital cost of a typical PEMWE system is dropping (Saba et al., 2018) and plants rated up to 6 MW are in operation (Buttler and Spliethoff, 2018).
Water flooding has been shown to be a major mass transport limitation occurring in polymer electrolyte membrane fuel cells (PEMFCs) at high current densities, particularly at high humidity when water condenses at the cathode forming droplets which coalesce. This leads to water blocking the flow channels and occupying the gas diffusion layer (GDL), causing a consequent increase in pressure drop and decrease in performance (Tüber et al., 2003; Spernjak et al., 2007; Hussaini and Wang, 2009). Similarly to water accumulation in a PEMFC, which eventually leads to flooding, product gas can accumulate in polymer PEMWEs leading to bubbles blocking the flow channels. This occurs if the gas production from the catalyst sites exceeds the gas removal capacity of the flow channels, which is mainly determined by the cross-sectional area and the flow rate of water through the channels. The effects of bubble blockage on performance, pressure drop, and life-time of a PEMWE have not yet been investigated, but it is expected that prolonged bubble blockage results in local water starvation, causing a non-uniform current distribution over the active area and a decrease in performance (Sun et al., 2015).
Acoustic emission (AE) is a non-destructive, operando diagnostic tool traditionally used in civil engineering, e.g., for monitoring crack propagation in steel (Roberts and Talebzadeh, 2003) or the stability of bridges (Nair and Cai, 2010). It uses a piezoelectric sensor to detect mechanical perturbations emitted by an object and has been applied to a range of electrochemical energy storage devices. It has been used to monitor particle fracture and morphological changes in battery electrodes during charge and discharge (Ohzuku et al., 1997; Rhodes et al., 2010; Villevieille et al., 2010), has been found to be sensitive to Li-ion intercalation and formation of the solid electrolyte interphase (Kircheva et al., 2011; Kircheva et al., 2012) in Li ion batteries, and has also been applied to PEMFCs (Legros et al., 2009; Legros et al., 2010; Bethapudi et al., 2019).
Two-phase systems, such as the water-gas mixture in the flow channels of the PEMWE analyzed in this work, are also readily analyzed using AE. This includes the calculation of bubble size distribution (Pandit et al., 1992), recognition of different flow patterns by analyzing AE data with neural networks (Yen and Lu, 2002), and observing the formation and collapse of single bubbles (Husin et al., 2013). Hence, AE is a valuable alternative diagnostic tool to other techniques for the investigation of two-phase dynamics (Huguet et al., 2011; Maiyalagan and Saji, 2017; Dastafkan et al., 2020).
In previous work, the authors demonstrated the ability of AE to detect changes in the number and size of bubbles passing through the flow channel of a PEMWE. This enabled the prediction of the change from bubbly to slug flow and showed that AE is a valuable operando tool for PEMWE diagnosis (Maier et al., 2019). Here, we demonstrate that AE signal changes dramatically when, rather than normal two-phase flow, stagnant bubbles are located within the vicinity of AE sensor. This feature can be used to detect and locate bubble “blockage” (channel dehydration) in PEMWEs, for operando monitoring or design optimization.
Experimental
Polymer Electrolyte Membrane Water Electrolyser Cell
The electrolyser used in this work (Figure 1) had a 9 cm2 active area and consisted of transparent Perspex end-plates, parallel titanium flow-fields, a titanium sinter liquid-GDL on the anode side, a Toray H-060 carbon paper as the GDL on the cathode side, and a catalyst coated membrane, which was based on Nafion 115 with 0.6 mg cm−2 platinum on the cathode and 3.0 mg cm−2 iridium/ruthenium oxide on the anode (ITM Power, United Kingdom). The flow-field consisted of nine parallel channels, with a length of 3 cm and a land and channel width of 1.76 mm. The electrolyser was run at ambient pressure with a deionized water inflow temperature of 50°C and a water inflow rate of 10 ml min−1 at the anode and cathode. Electrochemical testing was performed between 0.0 and 2.0 A cm−2 using a potentiostat (Gamry Reference 3,000 Galvanostat/Potentiostat with a Gamry 30k Booster; Gamry Instruments, USA).
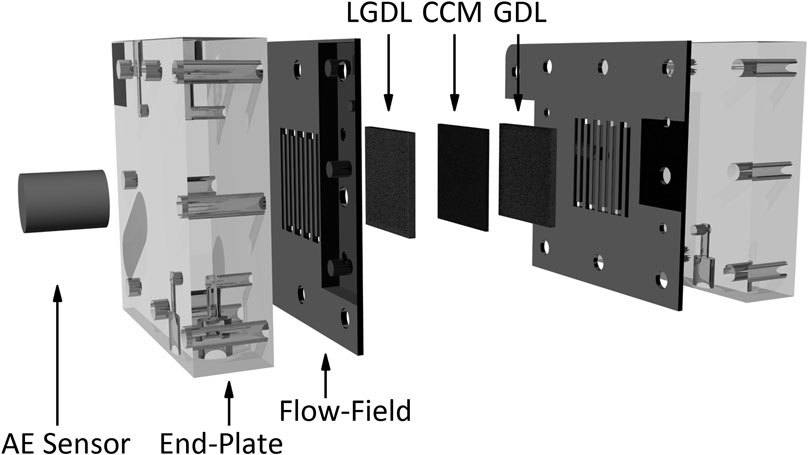
FIGURE 1. Assembly of a polymer electrolyte membrane water electrolyser with the acoustic emission (AE) sensor, two end-plates, two flow-fields, the liquid-gas diffusion layer (LGDL), the catalyst coated membrane (CCM), and the gas diffusion layer (GDL) on the anode side.
Acoustic Emission
AE was measured with a cylindrical piezoelectric sensor (S9208, Mistras NDT, United Kingdom), with a diameter and height of 25 mm. The sensor was placed in the center of the flow-field on the anode side; data acquisition lasted 1 min during galvanostatic operation of the PEMWE. Due to the nature of sound transmission, no clear area can be defined within which acoustic data is collected. Whether a mechanical perturbation is detected by the sensor is contingent on the location and intensity of the perturbation, with the intensity necessary for detection increasing with the distance between acoustic source and sensor. Therefore, detection of stagnant bubbles is increasingly likely as they are located closer to the sensor (bubbles “grow” from the top end of the channel toward the center). Data were processed using the software AEWin (Physical Acoustics, USA). The sensor produces a continuous voltage/time signal, with strong mechanical perturbations producing high voltage values. After filtering and pre-amplification by 26 dB, acoustic hits exceeding a noise threshold of 37 dB were extracted from the continuous signal. An acoustic hit is defined as an acoustic event initiated by AE signal exceeding the noise threshold and ending when the signal falls back below that threshold (Figure 2). Strong acoustic activity is marked by a high number of separate acoustic hits (events). The number of hits per unit time (hit rate H), the maximum of each waveform averaged over all hits (average hit amplitude A), the averaged time from exceeding the threshold until falling back below it (average hit duration D) and the average hit energy E were recorded. The hit energy was determined by integrating the area under the waveform with respect to time. Further details on AE data analysis can be found in previous work (Maier et al., 2019).
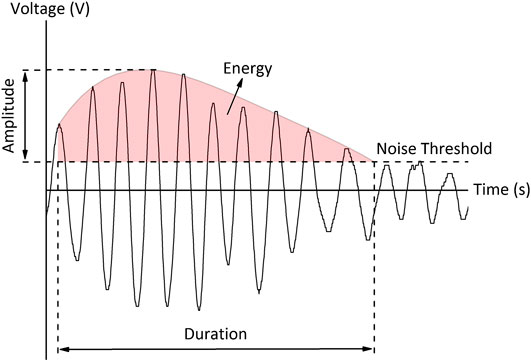
FIGURE 2. Typical structure of an acoustic hit as voltage profile as a function of time. The acoustic hit is initiated when the signal exceeds the noise threshold and ends when the signal falls back below the threshold. The hit amplitude is the intensity of the most prominent peak within the hit, and its energy is the integrated area of the hit (adapted from Caesarendra et al., 2016).
High-Speed Imaging
To visualize the movement of bubbles and the effect of increasing current density on the rate of removal of bubbles in the flow channels, high-speed imaging was employed. A Photron FASTCAM SA1 high-speed camera with a Tokina MACRO 100 F2.8 D lens was used to image the full flow-field on the anode side (1024 × 1024 pixel resolution, 2,000 frames per second, 5.46 s acquisition). The transparent end-plates allowed for direct optical access to the flow-field (Dedigama et al., 2014; Majasan et al., 2018).
Results and Discussion
The bubble evolution as a function of the current density has been captured with high-speed imaging experiments, which are shown as a function of increasing current density (Figure 3). As the cross-sectional area of the flow channels is finite and as all bubbles have to leave the flow-field through the manifold at the top end of the flow channels, the ability of the PEMWE cell to remove product gas is limited. This leads to bubbles blocking the top end of the flow channels at high current densities. For a given flow rate, the length of channel that contains stagnant bubbles at the top end of the flow channel increases significantly with current density. Here, a stagnant bubble is defined as a bubble which does not change its location, and particularly a bubble at the top end of the channel not entering the combining manifold, but remaining at the top end of the flow channel. The location of the largest stagnant bubble in each image in Figure 3 is marked in red. The amount of oxygen produced at the anode increases as a function of current density (Faraday’s law); hence, a growth in the length of stagnant bubbles is expected with increasing current density. At a current density of 0.3 A cm−2 (Figure 3A) the top end of each channel is almost free of stagnant bubbles, while a clear growth of these bubbles can be observed at 0.6 A cm−2 (Figure 3B). At 1.0 A cm−2 (Figure 3C), bubble blockage covers more than a quarter of the channel length.
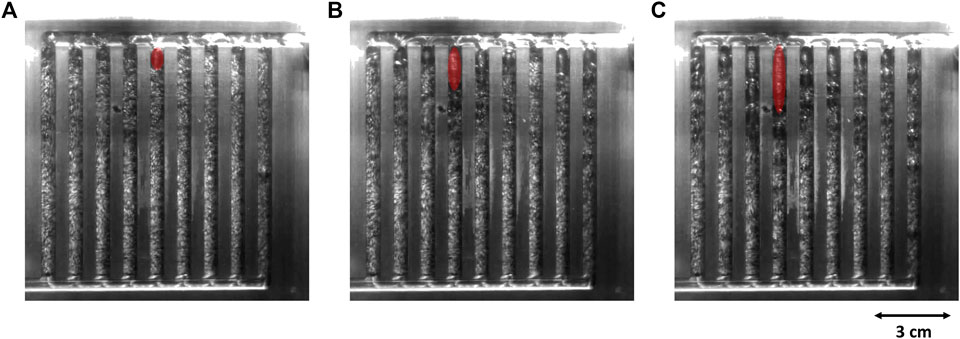
FIGURE 3. Exemplary results from high-speed imaging of the anode flow field of the polymer electrolyte membrane water electrolyser at (A) 0.3 A cm−2, (B) 0.6 A cm−2, and (C) 1.0 A cm−2 at a water inflow rate of 10 ml min−1. The largest stagnant bubble at the top end of the flow channels is marked in red for each current density.
AE parameters are strongly influenced by the current density (Figure 4). As illustrated above, current density leads to bubble blockage at the top end of the flow channels; hence, Figure 4 can be interpreted as the correlation between AE signal and the formation of stagnant bubbles. The acoustic hit rate drops from 80.0 s−1 to the limit of detection for AE system used in this work (1.0 s−1) between 0.5 and 1.0 A cm−2 (Figure 4A). The limit of detection is an artifact of the data acquisition, which cuts off any hit longer than 1.0 s, which means that from 1.0 A cm−2 onwards AE signal continuously exceeds the noise threshold, with no individual acoustic hits discernible. This significant decrease of acoustic hits highlights a dramatic change of two-phase flow within the flow channels. The relationship between the number of acoustic hits and the number of bubbles passing through the flow channels has been established in previous work (Maier et al., 2019), which found that the number of acoustic hits scales directly with the number of bubbles passing through the flow channels. Hence, a drop in the number of acoustic hits indicates a decrease in the number of bubbles generated and passing through the flow channels, which is likely due to the blocking of the flow channel by a stagnant bubble. This stagnant bubble stops smaller bubbles from traveling upwards through the flow channels; instead the bubbles coalesce into the stagnant bubble. Hence, the drop in the number of acoustic hits between 0.5 and 1.0 A cm−2 is likely caused by the extension of stagnant bubbles into the sensor area.
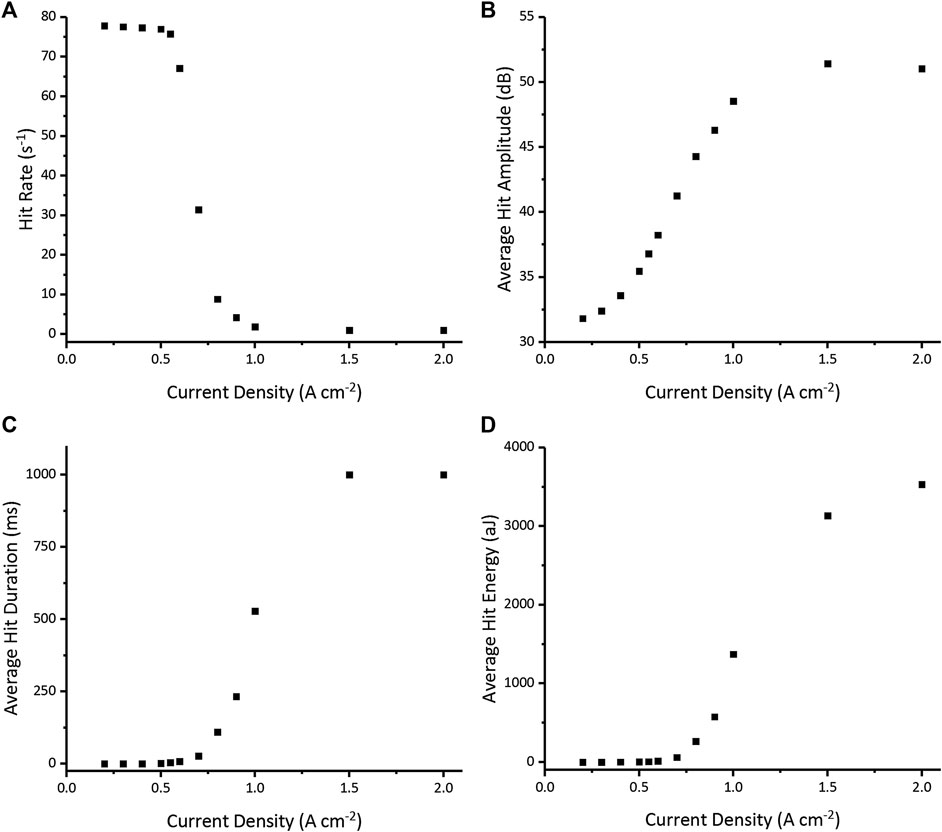
FIGURE 4. Acoustic emission parameters as a function of current density for a water inflow rate of 10 ml min−1. Acoustic hit rate (A), average hit amplitude (B), average hit duration (C), and average hit energy (D) are shown.
Further, the average hit amplitude (Figure 4B) increases steeply by around 50% between 0.5 and 1.0 A cm−2, the same range within which the hit rate drops. The average hit duration increases from less than 0.1 m s to the cut off value of 1.0 s mentioned above (Figure 4C). For current densities above 1.0 A cm−2, a constant signal is detected, indicating permanent contact between a bubble and the end-plate. Finally, an increase in hit duration and amplitude causes an increase in acoustic energy (Figure 4D). All these changes occur in a step-like manner between 0.5 and 1.0 A cm−2.
The decreasing number of hits, while hit amplitude and contact time between bubble and end-plate increase, all suggest that the signal change is caused by the extension of the stagnant bubble region toward the sensor location in the current density range between 0.5 and 1.0 A cm−2 (Figure 4). This is supported by the extension of the stagnant bubble region (Figure 3) observed via high-speed imaging, a major part of which occurs between 0.6 and 1.0 A cm−2.
Conclusion
AE has been demonstrated as a useful technique for operando diagnosis of bubble blockage in PEMWEs. High-speed imaging of an optically-transparent PEMWE cell was used to visualize the bubble movement in the flow channels. The length of the part of the flow channel containing stagnant bubbles was found to increase with current density, eventually reaching the location of AE sensor. With increasing flow channel blockage, a dramatic change in acoustic activity was observed. The acoustic hit rate dropped from 80.0 to 1.0 s−1, average hit amplitude increased from 32 to 50 dB, average hit duration from 0.1 m s to 1.0 s, and average hit energy from 0.004 to 3,400 aJ. These changes occurred abruptly between 0.5 and 1.0 A cm−2, which coincides with a significant extension of the stagnant bubble region in the flow channels. This leads us to conclude that the change in acoustic activity is caused by the flow regime in the channels changing from two-phase flow to stagnant bubbles. The accumulation of gas in the flow channels occurs when gas production exceeds the capacity of the system for gas removal, which can affect the water distribution in the PEMWE. Insufficient water supply at the anode causes a voltage increase (Sun et al., 2015), hence lowers PEMWE efficiency and reduces hydrogen production at equal voltage. It is expected that AE can be used to detect local bubble blockage and insufficient water supply in specific areas of a PEMWE.
The use of this operando diagnostic tool has successfully been applied to a PEMWE, but could be extended to other applications. The accumulation of gas within a system or plant can cause inefficiencies or pose a hazard in many areas of chemical production and transport. Moreover, it has been shown that the change of two-phase flow regime influences the pressure drop (Cubaud and Ho, 2004; Choi et al., 2011). Hence, the technique presented in this work could be deployed to screen various flow-field configurations or monitor safe limits of operation, replacing less cost-effective or accessible diagnostic tools such as neutron or X-ray imaging (Panchenko et al., 2018; Majasan et al., 2019; Maier et al., 2020).
Data Availability Statement
The raw data supporting the conclusions of this article will be made available by the authors, without undue reservation.
Author Contributions
MM: conceptualization, methodology, formal analysis, investigation, writing—original draft, visualization. QM and YW: resources, conceptualization, writing—review and editing. JM: conceptualization, investigation, writing—review and editing. RW, JR, LC, and GH: conceptualization, writing—review and editing. JD: investigation, writing—review and editing. PS and DB: supervision, funding acquisition, writing—review and editing.
Funding
The authors acknowledge financial support into the EIL’s hydrogen and fuel cell activity from the EPSRC through grants (EP/R023581/1; EP/P009050/1; EP/N032888/1; EP/M014371/1; EP/M009394; EP/L015749/1; EP/K038656/1). Support from the National Measurement System of the UK’s Department of Business, Energy and Industrial Strategy is also gratefully acknowledged. PS acknowledges funding from The Royal Academy of Engineering (CiET1718/59).
Conflict of Interest
The authors declare that the research was conducted in the absence of any commercial or financial relationships that could be construed as a potential conflict of interest.
References
Bethapudi, V. S., Maier, M., Hinds, G., Shearing, P. R., Brett, D. J. L., and Coppens, M.-O. (2019). Acoustic emission as a function of polarisation: diagnosis of polymer electrolyte fuel cell hydration state. Electrochem. Commun. 109, 106582. doi:10.1016/j.elecom.2019.106582
Buttler, A., and Spliethoff, H. (2018). Current status of water electrolysis for energy storage, grid balancing and sector coupling via power-to-gas and power-to-liquids: a review. Renew. Sustain. Energy Rev. 82, 2440–2454. doi:10.1016/j.rser.2017.09.003
Caesarendra, W., Kosasih, B., Tieu, A. K., Zhu, H., Moodie, C. A. S., and Zhu, Q. (2016). Acoustic emission-based condition monitoring methods: review and application for low speed slew bearing. Mech. Syst. Signal Process. 72–73, 134–159. doi:10.1016/j.ymssp.2015.10.020
Carmo, M., Fritz, D. L., Mergel, J., and Stolten, D. (2013). A comprehensive review on PEM water electrolysis. Int. J. Hydrogen Energy. 38, 4901–4934. doi:10.1016/j.ijhydene.2013.01.151
Choi, C. W., Yu, D. I., and Kim, M. H. (2011). Adiabatic two-phase flow in rectangular microchannels with different aspect ratios: Part I—flow pattern, pressure drop and void fraction. Int. J. Heat Mass Transfer. 54, 616–624. doi:10.1016/j.ijheatmasstransfer.2010.07.067
Cubaud, T., and Ho, C.-M. (2004). Transport of bubbles in square microchannels. Phys. Fluids. 16, 4575–4585. doi:10.1063/1.1813871
Dastafkan, K., Meyer, Q., Chen, X., and Zhao, C. (2020). Efficient oxygen evolution and gas bubble release achieved by a low gas bubble adhesive iron-nickel vanadate electrocatalyst. Small 16, e2002412. doi:10.1002/smll.202002412
Dedigama, I., Angeli, P., Ayers, K., Robinson, J. B., Shearing, P. R., Tsaoulidis, D., et al. (2014). In situ diagnostic techniques for characterisation of polymer electrolyte membrane water electrolysers—flow visualisation and electrochemical impedance spectroscopy. Int. J. Hydrogen Energy. 39, 4468–4482. doi:10.1016/j.ijhydene.2014.01.026
Huguet, P., Morin, A., Gebel, G., Deabate, S., Sutor, A. K., and Peng, Z. (2011). In situ analysis of water management in operating fuel cells by confocal Raman spectroscopy. Electrochem. Commun. 13, 418–422. doi:10.1016/j.elecom.2011.02.008
Husin, S., Addali, A., and Mba, D. (2013). Feasibility study on the use of the acoustic emission technology for monitoring flow patterns in two phase flow. Flow Meas. Instrum. 33, 251–256. doi:10.1016/j.flowmeasinst.2013.07.011
Hussaini, I. S., and Wang, C.-Y. (2009). Visualization and quantification of cathode channel flooding in PEM fuel cells. J. Power Sources. 187, 444–451. doi:10.1016/j.jpowsour.2008.11.030
Kircheva, N., Genies, S., Brun-Buisson, D., and Thivel, P.-X. (2012). Study of solid electrolyte interface formation and lithium intercalation in Li-ion batteries by acoustic emission. J. Electrochem. Soc. 159, A18–A25. doi:10.1149/2.045201jes
Kircheva, N., Thivel, P.-X., Genies, S., Brun-Buisson, D., and Bultel, Y. (2011). Study of SEI formation in Li-ion batteries by acoustic emission technique. ECS Trans. 35, 19–26. doi:10.1149/1.3644900
Legros, B., Thivel, P.-X., Bultel, Y., Boinet, M., and Nogueira, R. P. (2009). Electrochemical impedance and acoustic emission survey of water desorption in Nafion membranes. Electrochem. Solid State Lett. 12, B116–B118. doi:10.1149/1.3131728
Legros, B., Thivel, P.-X., Bultel, Y., Boinet, M., and Nogueira, R. P. (2010). Acoustic emission: towards a real-time diagnosis technique for proton exchange membrane fuel cell operation. J. Power Sources. 195, 8124–8133. doi:10.1016/j.jpowsour.2010.07.045
Maier, M., Dodwell, J., Ziesche, R., Tan, C., Heenan, T., Majasan, J., et al. (2020). Mass transport in polymer electrolyte membrane water electrolyser liquid-gas diffusion layers: a combined neutron imaging and X-ray computed tomography study. J. Power Sources. 455, 227968. doi:10.1016/j.jpowsour.2020.227968
Maier, M., Meyer, Q., Majasan, J., Tan, C., Dedigama, I., Robinson, J., et al. (2019). Operando flow regime diagnosis using acoustic emission in a polymer electrolyte membrane water electrolyser. J. Power Sources. 424, 138–149. doi:10.1016/j.jpowsour.2019.03.061
T. Maiyalagan and V. S. Saji (Editors) (2017). Electrocatalysts for low temperature fuel cells: fundamentals and recent trends. Hoboken, NJ: John Wiley and Sons.
Majasan, J. O., Cho, J. I. S., Dedigama, I., Tsaoulidis, D., Shearing, P., and Brett, D. J. L. (2018). Two-phase flow behaviour and performance of polymer electrolyte membrane electrolysers: electrochemical and optical characterisation. Int. J. Hydrogen Energy. 43, 15659–15672. doi:10.1016/j.ijhydene.2018.07.003
Majasan, J. O., Iacoviello, F., Cho, J. I. S., Maier, M., Lu, X., Neville, T. P., et al. (2019). Correlative study of microstructure and performance for porous transport layers in polymer electrolyte membrane water electrolysers by X-ray computed tomography and electrochemical characterization. Int. J. Hydrogen Energy. 44, 19519. doi:10.1016/j.ijhydene.2019.05.222
Nair, A., and Cai, C. S. (2010). Acoustic emission monitoring of bridges: review and case studies, Eng. Struct. 32, 1704–1714. doi:10.1016/j.engstruct.2010.02.020
Ohzuku, T., Tomura, H., and Sawai, K. (1997). Monitoring of particle fracture by acoustic emission during charge and discharge of Li/MnO2 cells. J. Electrochem. Soc. 144, 3496–3500. doi:10.1149/1.1838039
Panchenko, O., Borgardt, E., Zwaygardt, W., Hackemüller, F. J., Bram, M., Kardjilov, N., et al. (2018). In-situ two-phase flow investigation of different porous transport layer for a polymer electrolyte membrane (PEM) electrolyzer with neutron spectroscopy. J. Power Sources. 390, 108–115. doi:10.1016/j.jpowsour.2018.04.044
Pandit, A. B., Varley, J., Thorpe, R. B., and Davidson, J. F. (1992). Measurement of bubble size distribution: an acoustic technique. Chem. Eng. Sci. 47, 1079–1089. doi:10.1016/0009-2509(92)80233-3
Rhodes, K., Dudney, N., Lara-Curzio, E., and Daniel, C. (2010). Understanding the ddegradation of silicon electrodes for lithium-ion batteries using acoustic emission. J. Electrochem. Soc. 157, A1354–A1360. doi:10.1149/1.3489374
Roberts, T. M., and Talebzadeh, M. (2003). Acoustic emission monitoring of fatigue crack propagation. J. Constr. Steel Res. 59, 695–712. doi:10.1016/S0143-974X(02)00064-0
Saba, S. M., Müller, M., Robinius, M., and Stolten, D. (2018). The investment costs of electrolysis—a comparison of cost studies from the past 30 years. Int. J. Hydrogen Energy. 43, 1209–1223. doi:10.1016/j.ijhydene.2017.11.115
Spernjak, D., Prasad, A. K., and Advani, S. G. (2007). Experimental investigation of liquid water formation and transport in a transparent single-serpentine PEM fuel cell. J. Power Sources. 170, 334–344. doi:10.1016/j.jpowsour.2007.04.020
Sun, S., Xiao, Y., Liang, D., Shao, Z., Yu, H., Hou, M., et al. (2015). Behaviors of a proton exchange membrane electrolyzer under water starvation. RSC Adv. 5, 14506–14513. doi:10.1039/C4RA14104K
Tüber, K., Pócza, D., and Hebling, C. (2003). Visualization of water buildup in the cathode of a transparent PEM fuel cell. J. Power Sources. 124, 403–414. doi:10.1016/S0378-7753(03)00797-3
Villevieille, C., Boinet, M., and Monconduit, L. (2010). Direct evidence of morphological changes in conversion type electrodes in Li-ion battery by acoustic emission. Electrochem. Commun. 12, 1336–1339. doi:10.1016/j.elecom.2010.07.014
Keywords: acoustic emission, polymer electrolyte membrane water electrolyser, operando diagnostics, mass transport, flow channels, flow regime, gas bubble
Citation: Maier M, Meyer Q, Majasan J, Owen RE, Robinson JB, Dodwell J, Wu Y, Castanheira L, Hinds G, Shearing PR and Brett DJ L (2020) Diagnosing Stagnant Gas Bubbles in a Polymer Electrolyte Membrane Water Electrolyser Using Acoustic Emission. Front. Energy Res. 8:582919. doi: 10.3389/fenrg.2020.582919
Received: 13 July 2020; Accepted: 22 September 2020;
Published: 19 October 2020.
Edited by:
Cesar Augusto Correia De Sequeira, University of Lisbon, PortugalReviewed by:
Qiong Cai, University of Surrey, United KingdomThandavaryan Maiyalagan, SRM Institute of Science and Technology, India
Copyright © 2020 Maier, Meyer, Majasan, Owen, Robinson, Dodwell, Wu, Castanheira, Hinds, Shearing and Brett. This is an open-access article distributed under the terms of the Creative Commons Attribution License (CC BY). The use, distribution or reproduction in other forums is permitted, provided the original author(s) and the copyright owner(s) are credited and that the original publication in this journal is cited, in accordance with accepted academic practice. No use, distribution or reproduction is permitted which does not comply with these terms.
*Correspondence: Dan J. L. Brett, d.brett@ucl.ac.uk