Research on electric vehicle load forecasting considering regional special event characteristics
 Tuo Xie1
  Gang Zhang
- 1School of Electrical Engineering, Xi’an University of Technology, Xi’an, China
- 2State Grid Shaanxi Electric Power Co, LTD. Ultra High Voltage Company, Xi’an, China
- 3Electric Power Research Institute of State Grid Shaanxi Electric Power Company, Xi’an, China
- 4School of Water Resources and Hydropower, Xi’an University of Technology, Xi’an, China
With the rise of electric vehicles and fast charging technology, electric vehicle load forecasting has become a concern for electric vehicle charging station planners and operators. Due to the non-stationary nature of traffic flow and the instability of the charging process, it is difficult to accurately predict the charging load of electric vehicles, especially in sudden major events. In this article, We proposes a high-precision EV charging load forecasting model based on mRMR and IPSO-LSTM, which can quickly respond to the epidemic (or similar emergencies). Firstly, the missing data in the original EV charging load data are supplemented, and the abnormal data are corrected. Based on this, a factor set is established, which included five epidemic factors, including new confirmed cases, the number of moderate risk areas, the number of high risk areas, epidemic situation and epidemic prevention policies of the city, and other factors such as temperature. Secondly, the processed load data and other data in the influencing factor set are normalized, and the typical characteristic curve is established for personalized processing of the relevant data of epidemic factors, so as to improve the sensitivity of load response to epidemic changes and the ability to capture special data (peak and valley values and turning points of load). Then the maximum relevant minimum redundancy (mRMR) is used to select the optimal feature set from the set of influencing factors. Then, the processed load data and its corresponding optimal selection are input into the IPSO-LSTM model to obtain the final prediction result. Finally, taking the relevant data of EV charging load in a city in China from November 2021 to April 2022 (the city experienced two local epidemics in December 2021 and March 2022 respectively) as an example, the model is evaluated and compared with other models under the forecast period of 1 h. Meanwhile, the performance of the model under different foresight periods (2 h, 4 h, 6 h) is compared and analyzed. The results show that the model has good stability and representativeness, and can be used for EV charging load prediction under the COVID-19 pandemic.
1 Introduction
Effective renewable friendly smart grid technologies contribute to the development of RWJ projects, indirectly facilitating friendly interactions between EVs and the grid (Zhong et al., 2014). The multi-time scale short-term prediction of EV charging load is an important reference for intraday demand-side response (Li and Pye, 2018), and can provide a reference for the optimal scheduling of the distribution network with electric vehicles (Zakernezhad et al., 2022), so accurate multi-time-scale electric vehicle charging load forecasting is of great significance. At the end of 2019, the spread of COVID-19 had an impact on the entire electricity industry and renewable energy in many countries (Liu, 2020), and renewable energy consumption affects economic growth (The State Council of the People’s Republic of China). Under the general strategy of “ foreign defense against imports, internal defense against rebound” and the general policy of “dynamic clearing” in China, people’s willingness to travel will be reduced when the epidemic occurs, and travel will be restricted at certain times (Xi’an Municipal People’s Government, 2022), which will lead to significant changes in the charging load of electric vehicles. Large-scale use of electric vehicles can significantly reduce carbon emissions, but the load of large-scale electric vehicles has strong randomness, which is a huge challenge for power system security and stability (Leou et al., 2014; SALAH et al., 2015).
At present, the main research methods of electric vehicle charging load forecasting can be divided into two categories: model-driven and data-driven forecasting methods. The former uses mathematical statistics to establish a probability model, and on this basis uses Monte Carlo simulation to predict (Iversen et al., 2017; Zhang et al., 2018; Iwafune et al., 2020). Compared with such methods, relying on data-driven methods for EV charging load forecasting is more transferable and can reduce forecasting costs. The development of IoT technology has driven the development of a large number of cloud-based electric vehicle services (Atif et al., 2016; Chen and Chang, 2016), and data integration platforms have been established in many provinces in China (Shaanxi Provincial Development and Reform Commission, 2022; State-owned Assets Supervision, 2022; State-owned Assets Supervision and Administration Commission of the State Council, 2022). In this context, data-driven forecasting methods have received more attention (Wang et al., 2022). Back Propagation Neural Network (BPNN) (Dabbaghjamanesh et al., 2021), Auto-Regressive and Moving Average (ARMA) (Wen et al., 2019), Convolutional Neural Network (CNN) (Zhang X. et al., 2021), Long Short-Term Memory (LSTM) (Zhu et al., 2019), and other methods are beginning to be applied to EV charging load prediction. Since the impact of COVID-19 on EV charging loads is not instantaneous, this requires predictive models to remember information delivered over longer periods of time. Therefore, this paper will continue to take advantage of the LSTM network’s ability to learn long-range dependencies to build an effective EV charging load forecasting model (Bayrak et al., 2020).
Under normal circumstances, the electric vehicle charging load is similar to the power load in terms of data characteristics, and both show periodic changes. The influence of influencing factors is often considered in power load forecasting (Lin et al., 2021; Bian et al., 2022). Therefore, in order to further improve the forecasting accuracy, factors such as temperature, electricity price, and date type have also begun to be considered in electric vehicle charging load forecasting (Abbas et al., 2019; Feng et al., 2021; Zhang et al., 2022). Among them (Abbas et al., 2019) used meteorological data and historical load as influencing factors to accurately predict the load; Literature (Feng et al., 2021) considered two related factors of electricity price and temperature, using EMGM to predict the charging load of electric vehicles, and using LSTM for error correction; Literature (Zhang et al., 2022) using The multi-channel 1DCNN extracts the load characteristics of different time scales under the influence factors such as meteorological characteristics and date characteristics (seasonal type, week type), and inputs them into the TCN to establish a time-dependent relationship for each characteristic and improve the forecast accuracy. But the COVID-19 outbreak is a non-periodic emergency, and its impact on EV load is contingent and persistent. As of August 2022, the COVID-19 outbreak is ongoing, with concentrated outbreaks continuing across China. The establishment of a forecasting model capable of rapid response to the epidemic (or similar emergencies) and with high accuracy is conducive to the development of demand-side response plans and scheduling plans (National Health Commission of the People’s Republic of China, 2022). Therefore, during the epidemic period, electric vehicle load not only needs to consider the impact of temperature, electricity price and other factors, but also the impact of epidemic-related factors.
In the process of load forecasting using machine learning methods, it is necessary to perform feature selection on relevant factors. Commonly used feature analysis methods include the covariance method, the Pearson coefficient method, the maximal information coefficient (MIC) (Reshef et al., 2011) and the MIC-based mRMR (Peng et al., 2005). Among them, literature (Xie et al., 2022) used Pearson coefficients to determine the key influencing factors of loads, which were regarded as multivariate information, and then input them into LSTM to obtain a load prediction model with multi-information fusion. However, the Pearson coefficient can only reflect the linear correlation, but there may be a nonlinear relationship between the EV charging load and the related factors, and it is difficult to describe the change of EV charging load linearly, so it is more suitable for the MIC and mRMR. Literature (Sun et al., 2022) for the existing in different moments of each influential factors to load the same degree of contribution to the problem, the use of mutual information (MI) to portray different moments under the degree of contribution of each factor, and then use the Bidirectional Long Short-Term Memory (Bi-LSTM) to get the final prediction results. MIC was applied to short-term electricity load forecasting, effectively improving the screening effect of the feature sequence (Ge et al., 2021), and literature (Zhang et al., 2023) utilized MIC and Akaike information criterion to select input variables, obtain key information, and reduce the difficulty of model training. However, the redundancy of epidemic-related feature sequences in EV charging load in the context of COVID-19 is high, which is not considered in the MIC, while the mRMR incorporates the redundancy in the sequences into the screening metrics (Dai et al., 2014), which is more suitable for electric vehicle charging load forecasting under the COVID-19 outbreak.
This paper aims to implement a predictive model that can quickly respond to an outbreak (or similar emergencies) with high accuracy. This method fully considers the impact of the epidemic, establishes five epidemic-related influencing factors, uses mRMR to select the optimal feature set from the set of influencing factors including epidemic factors and meteorological factors, and uses IPSO-LSTM to predict the short-term load of EV charging load with multiple foresight periods. The main novelties of this paper are as follows:
(1) A charging load forecasting model for electric vehicles that can quickly respond to the epidemic (or similar emergencies) and has high accuracy is established.
(2) The epidemic-related data are processed to make the data more suitable for the forecasting of electric vehicle charging load during the COVID-19 pandemic, and mRMR is used to select the best input features according to the characteristics of the epidemic feature sequence.
(3) For the determination of model parameters, IPSO is used to optimize the training parameters, which improves the forecast accuracy, and the effectiveness of the proposed model is verified by an example.
The organization of this paper is as follows: Section 2 introduces the above methods, including mRMR, IPSO-LSTM prediction model, and predictive performance evaluation indicators; Section 3 introduces data trends and related characteristics; Section 4 carries out case studies; Section 5 discusses the results; and Section 6 gives research conclusions.
2 Methods
2.1 Maximum relevant minimum redundancy
In order to consider the correlation between the single feature variable and the target variable, and consider the linear relationship and nonlinear relationship at the same time, the MIC method can be selected to judge the correlation between the two sequences.
The MIC method was proposed by Reshef in 2011, which can effectively detect linear or other functional relationships between two variables (Li et al., 2015). The concept of using mutual information in the MIC method can be expressed as:
Where:
MIC can be calculated by formula (2) and (3):
In the formula:
The mRMR method can penalize redundant features with high correlation among the selected features (Zhang et al., 2019). Among all feature sequences, new feature sequences are incrementally selected, each time the locally optimal feature is selected.
Defined
Where:
2.2 Improved particle swarm optimization–long short term memory (IPSO-LSTM)
2.2.1 Long short term memory
LSTM is a neural network obtained by improving RNN (Hochreiter and Schmidhuber, 1997). Compared with RNN, LSTM can better deal with the problem of gradient disappearance and gradient explosion. The difference between LSTM and RNN is that LSTM adds a memory unit Cell and three gates (input gate, forget gate and output gate) to the neurons in the hidden layer. The internal structure of LSTM is shown in Figure 1.
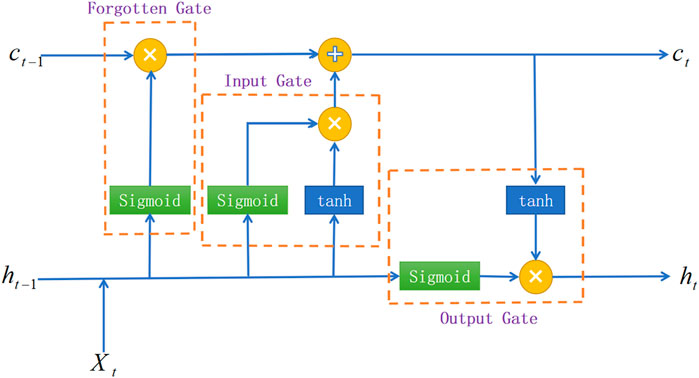
FIGURE 1. The basic LSTM cell.
The propagation formula of the LSTM computing node at time t can be expressed as Eqs 7–11.
In Figure 1, the input gate controls the information entering the node, the forget gate controls the retention of the historical state in the Cell, and the output gate controls the information of the computing node output.
2.2.2 Improved particle swarm optimization algorithm (IPSO)
The particle swarm optimization algorithm can be described as: Assuming that there is a population of particles in the dimension space, the velocity and position of the ith particle are respectively, and the optimal position of the individual particle and the optimal position of the group at time are evaluated by the objective function. Then iteratively update the velocity and position of each particle by the following formula (Zhang Y. G. et al., 2021).
The inertia weight
In the formula:
2.2.3 IPSO-LSTM model
The LSTM neural network optimized by the IPSO algorithm is called the IPSO-LSTM model. Taking the two-layer LSTM network as an example, the particles in the IPSO algorithm are, which represents the number of neurons in the first hidden layer of the LSTM network, and represents the second LSTM network. The number of neurons in the hidden layer represents the learning rate of the LSTM network.
The flowchart of the IPSO-LSTM network model is shown in Figure 2.
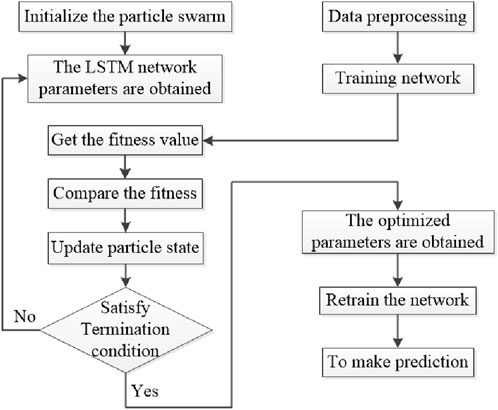
FIGURE 2. IPSO-LSTM flow chart.
The specific steps in Figure 2 are as follows:
Step 1:. Preprocess the sample data, remove abnormal data, fill in the incomplete data, convert the input data into matrix form, and initialize the IPSO algorithm parameters
Step 2:. Define fitness. The mean square error of the predicted value of the LSTM network is used as the particle fitness value fit;
Step 3:. Using the position information of the particles as the parameters of the LSTM network, construct multiple LSTM networks
Step 4:. Train all networks to get the fitness value of each particle. Update individual extrema and group extremum
Step 5:. Iteratively update particle velocity and position information with nonlinear inertia weights according to individual extremum and group extremum
Step 6:. Stop iterating after meeting the conditions or reaching the maximum number of iterations, otherwise go back to Step 3
Step 7:. Get the optimized parameters, increase the number of iterations to 100, and retrain the LSTM network
Step 8:. Predict through the trained IPSO-LSTM network.
2.3 A novel hybrid model based on mRMR and IPSO-LSTM
Based on the above analysis, this section proposes a forecasting model based on mRMR and IPSO-LSTM for the short-term forecasting of EV charging loads during the COVID-19 pandemic, and the overall framework is shown in Figure 3.
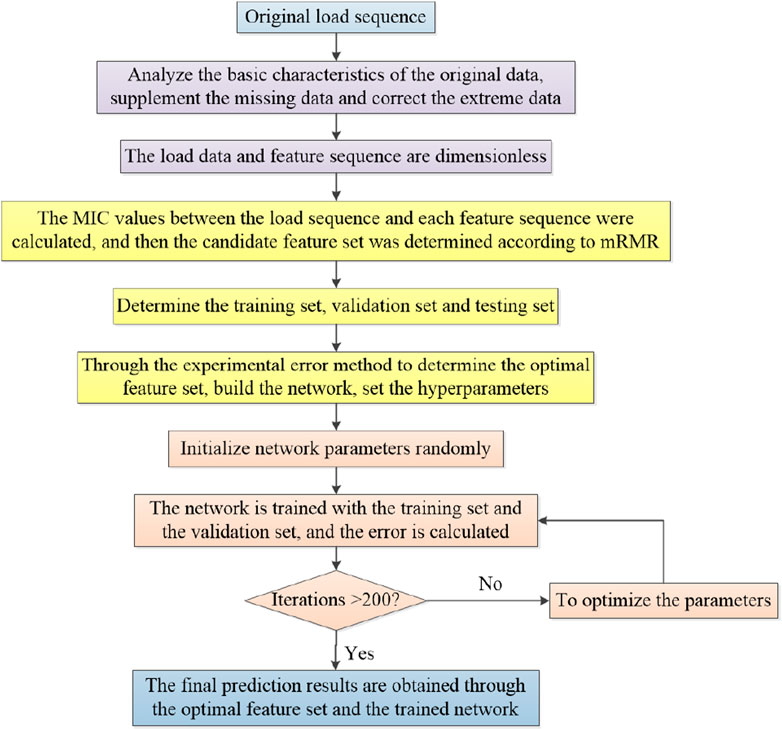
FIGURE 3. Overall framework.
The framework shown in Figure 3 can be summarized into three parts, which are as follows.
Part 1: Data processing. Analyze the basic characteristics of original data, supplement missing data, and correct extreme data and abnormal data.
Part 2: Feature extraction. Considering the hysteresis of epidemic factors, a factor set containing five groups of 20 epidemic factors was established, and the feature sequence is dimensionless processed, and the mRMR method is used to obtain the optimal feature set.
Part 3: Final forecast. The optimized LSTM model is obtained by IPSO, and the elements in the optimal feature set are added to predict the electric vehicle charging load to obtain the final forecast result.
2.4 Evaluation indicators
In this study, the mean absolute error (MAE), root mean square error (RMSE) and symmetric mean absolute percentage error (SMAPE) were selected as the evaluation criteria for evaluating the forecast accuracy of each model, and the calculation formula is shown in Eqs 16–18.
Where:
3 Analysis of influencing factors of electric vehicle charging load
The charging load of electric vehicles is mainly affected by travel willingness, and its daily variation is mainly affected by charging habits and charging prices. Under normal circumstances, the production and life in an area have regularity, so the charging load changes have periodicity, and the fluctuation of adjacent days will not be very large. However, in some regional special events, some traffic control measures may be taken, or some policies and guidelines may be implemented to restrict people’s travel, which may directly or indirectly affect the user’s travel psychology, thereby changing the travel route or reducing the travel, and then affecting the charging load of some regions or the whole region’s charging station.
3.1 The influence of conventional factors on charging load
Conventional factors mainly consider the impact of time, date type, weather and so on.
3.1.1 Influence of time factor on charging load
Time factors mainly include seasonal, holiday and cyclical factors. Cyclical factors can be divided into daily cyclical factors, weekly cyclical factors, monthly cyclical factors and annual cyclical factors. The data selected in this paper is from November 2021 to April 2022, a total of 6 months, so only the influence of daily cyclical factors and weekly cyclical factors are considered. The correlation between time factor and charging load is shown in Figure 4.
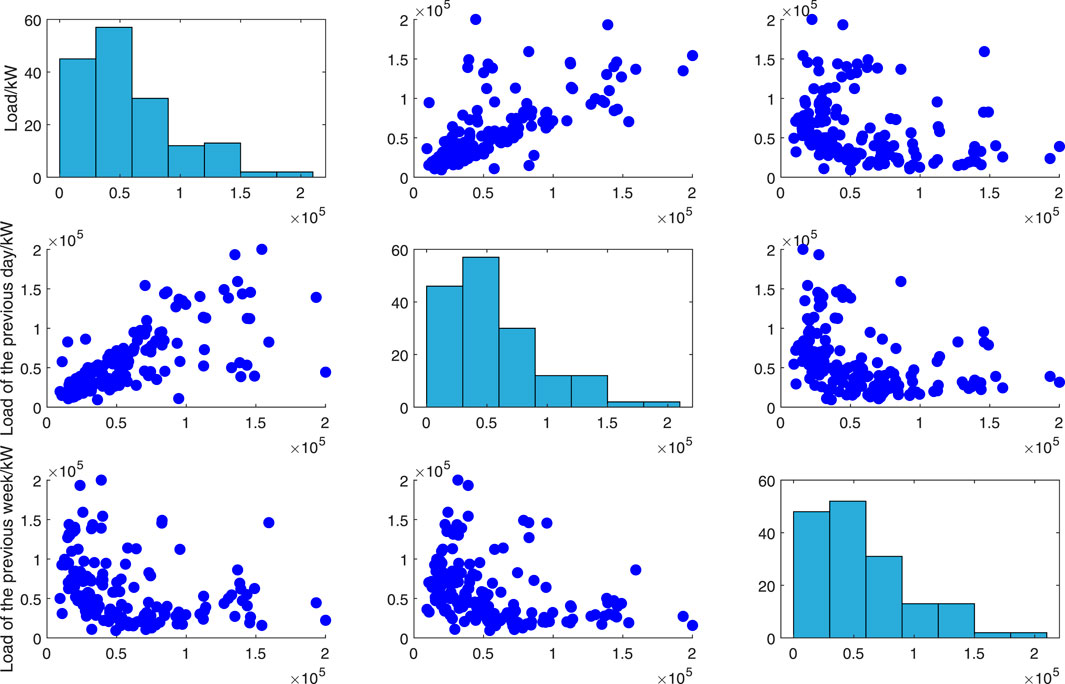
FIGURE 4. Correlation between time factor and charging load.
Figure 4 shows the degree of correlation between the load of the previous day and the load of the previous week and the current load at the current time, in which the load of the previous day and the current load show an obvious positive correlation, while the correlation between the previous week and the current load is not obvious, and the three factors also have mutual influence.
3.1.2 The impact of date type on charging load
The user’s travel habits may be affected by the date type, and there is a difference between non-working days such as weekends or holidays and working days, which will cause changes in the charging load. Load statistics are collected from Monday to Sunday, as shown in Table 1.
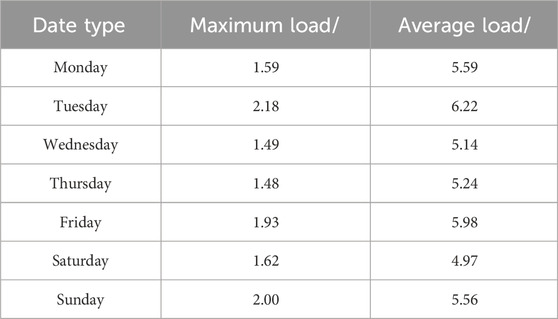
TABLE 1. Date type and charging load statistics.
As can be seen from Table 1, the load varies from Monday to Sunday. The maximum load from Monday to Friday is 218000 kW (Tuesday), which is larger than the load on Sunday, while the minimum load is 159000 kW (Monday), which is smaller than the load on Saturday, with no obvious difference. Therefore, the effect of date type on charging load needs further study.
3.1.3 The influence of meteorological factors on the charging load
The charging load of electric vehicles will be affected by users’ willingness to travel. For example, when encountering extreme weather, users will reduce unnecessary travel, leading to a decrease in charging load, while weather types will affect temperature, relative humidity and air quality index. For example, when there is heavy rain, it may cause a decrease in temperature, an increase in relative humidity, a decrease in air quality index and a decrease in wind. The temperature will affect the driving range of electric vehicles, the longest driving range when the temperature is moderate, the shortest driving range when the temperature is too high or too low, and the temperature will also affect the use of air conditioning in the car, the use of air conditioning will increase power consumption. Figure 5 shows the correlation between temperature, relative humidity, wind, air quality index, and charging load.
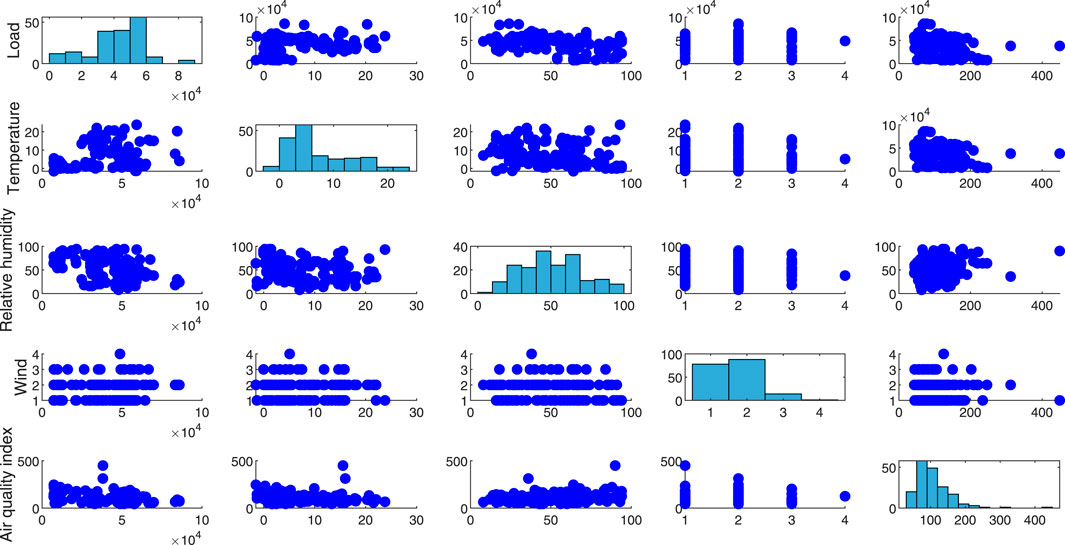
FIGURE 5. Correlation between temperature, relative humidity, wind, air quality index and charging load.
As shown in Figure 5, there is a strong positive correlation between temperature and load. As the temperature rises, the use of air conditioning in the car increases the load. However, it can also be seen that when the temperature is low, the load is also at a higher level due to the increase in vehicle power consumption. There is a strong negative correlation between relative humidity and load, because the change of humidity is related to precipitation in many cases, when the weather is not good, it will affect the desire to travel, avoid unnecessary travel and lead to load reduction. When the weather is particularly good, travel enthusiasm is strong, and the increase of vehicle frequency leads to the increase of load. There was no significant correlation between wind and air quality index and charging load.
3.1.4 Influence of time-of-use price on charging load
Most of the public charging stations in the city adopt time-of-use (TOU), and the implementation of TOU is of great significance to guide the orderly charging of electric vehicles and reduce the pressure on the grid. The charging price of charging stations using TOU is mostly divided into 6 periods (the price may be different), each period and the corresponding price are shown in Table 2. The price in the table is electricity, excluding service fee.
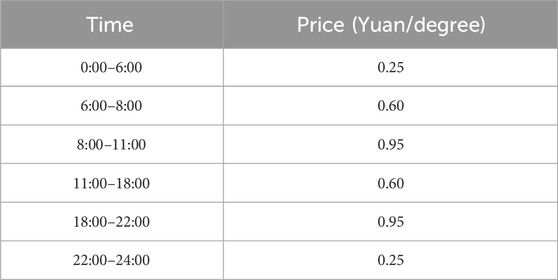
TABLE 2. Electric vehicle charging station price information.
As can be seen from Figure 6, the peak daily load of electric vehicle charging load appears at 0, and the trough price is just from 23 to 6. During this period of time, the load is high in most cases, and the charging price during the time of 11:00–18:00 is medium, but after a morning of power consumption, some vehicles that need to supplement the power during the day will choose to charge at this time, and after 18:00 is the rush hour, some commuter cars will charge at this time, so the load is larger. However, on the whole, it basically conforms to the characteristics of large load when the price is high and small load when the price is low.
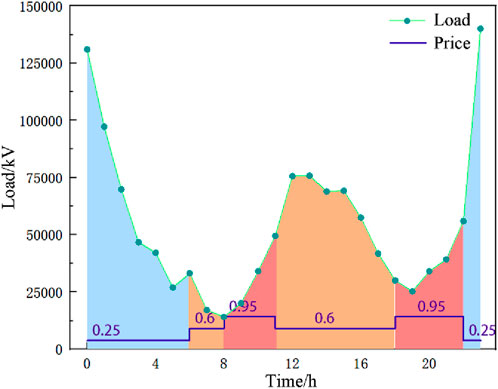
FIGURE 6. Time division tariff and its corresponding load change.
3.2 The influence of unconventional factors on charging load
In addition to the routine factors mentioned in 3.2, taking into account the key events in recent years in China, the novel coronavirus epidemic, which has had a huge impact on people’s production and life in the past 3 years, is selected as the main unconventional factors to study from four aspects: the number of new confirmed cases, the number of high-risk areas, the number of medium-risk areas, and epidemic prevention policies. The correlation between epidemic factors and charging load is shown in Figure 7.
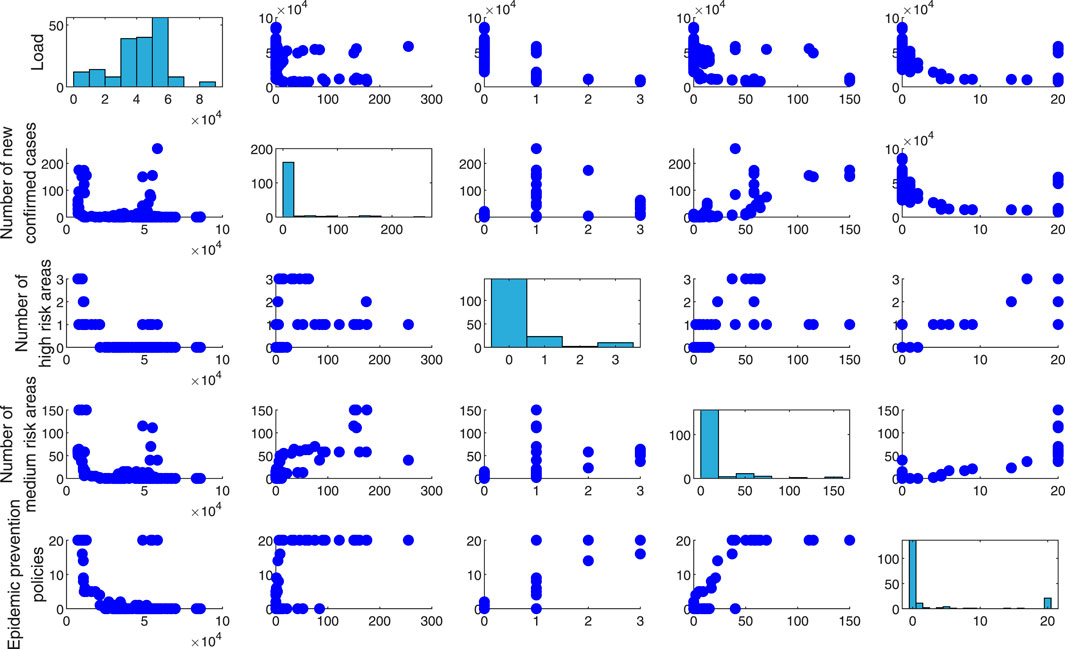
FIGURE 7. Correlation between epidemic factors and charging load.
As can be seen from Figure 7, the number of newly confirmed cases, the number of high-risk areas, the number of medium-risk areas, and epidemic prevention policies are negatively correlated with the charging load. The more new confirmed cases, the more serious the outbreak. The greater the number of high risk areas indicates the greater the number of areas seriously affected by the epidemic, which indicates the depth of the development of the epidemic to a certain extent. The more at-risk areas, the more areas affected by the epidemic, to a certain extent indicates the breadth of the epidemic development, and the more stringent epidemic prevention policies, indicating that the more areas are sealed and controlled, the more restrictions on people’s travel, all of which will reduce the load. The new confirmed cases were negatively correlated with the epidemic prevention policy, indicating that the epidemic prevention policy has been dynamically adjusted in strict accordance with the development of the epidemic situation, and the epidemic prevention policy has indeed prevented the further spread of the epidemic, which is in line with the development law of the epidemic, and is suitable for epidemic prevention and control. The number of high-risk areas and the number of medium-risk areas is positively correlated with epidemic prevention policy. According to China’s epidemic prevention policy, according to the number of newly confirmed cases, regions can be divided into high-risk areas and medium-risk areas, and at some times, they are also divided into prevention areas, while high-risk areas will be banned or restricted to go out (by time or by number of people), indicating that the more the number of medium-risk areas, the more the number of high-risk areas, the more the number of high-risk areas. The more stringent the epidemic prevention policy. Therefore, when making predictions, it is very necessary to consider such unconventional factors as the epidemic.
4 Case analysis
4.1 Data sources
In this paper, the load of electric vehicles under the influence of COVID-19 in a city in China is taken as the research object. In recent years, the city’s new energy vehicle industry has developed rapidly. The province’s electric power company built a new energy vehicle intelligent monitoring platform in July 2019, which can monitor the operation of charging piles in real time. This article obtained the electric vehicle load data for a total of 181 days in the capital city of the province from 1 November 2021 to 30 April 2022 through this platform, and obtained meteorological data such as temperature on the website of the city’s meteorological bureau. The data sampling interval for 1 h, a total of 4,344 samples were collected. The epidemic-related data was obtained on the website of the Provincial Health and Health Commission. The data sampling interval was 1 day, and a total of 181 samples were collected. In this process, there may be data missing and data mutation. In this paper, the interpolation method is used to ensure the smoothness of the data. When it is judged that the original data is 0 or abrupt, the data average of the previous time and the next time is used to replace the missing data. If the continuous data is 0, the data of the previous moment will be uniformly used instead.
Where:
During this period, the city experienced two local outbreaks in December 2021 and March 2022 respectively, among which the outbreak on 9 December 2021 was the most severe outbreak in the city since the COVID-19 outbreak in 2019. The load in the period with and without confirmed cases is shown in Figure 8.

FIGURE 8. The load in the period with and without confirmed cases.
It can be seen from Figure 8 that COVID-19 has a significant impact on EV load, and the two impacts have different degrees, with the impact of the December epidemic being greater than that of the March epidemic. COVID-19 indirectly affects EV load by affecting people’s travel conditions to a certain extent. Compared with other factors, this impact is more complex, irregular, non-cyclical and has a lag. Table 3 shows the electric vehicle load and epidemic statistics in the city.
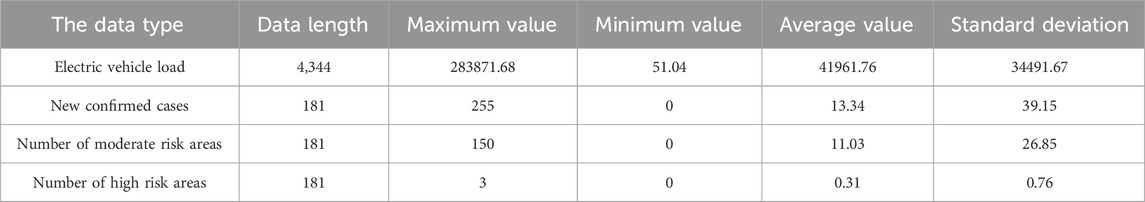
TABLE 3. Statistics of electric vehicle load and epidemic situation.
The data presented in Table 1 can be seen as follows: (1) For the charging load of electric vehicles, its maximum value is large, indicating that the city has a high ownership of electric vehicles. There is a huge difference between the maximum value and the minimum value, and the standard deviation is large, and the ratio to the average value is also large but less than 1, indicating that the load is volatile. (2) For the new confirmed cases and the number of medium-risk areas, the two types of data had a large maximum value, indicating that there was a large-scale epidemic in the city in some periods. There is a big difference between the maximum value and the minimum value, and it has a large standard deviation. The ratio of the standard deviation and the average value is between two to three, indicating that these two types of data are highly volatile, which can reflect the impact scope of the epidemic to a certain extent, and their changes may cause some epidemic prevention policy changes. (3) For the number of high-risk areas, the maximum value is not large, and there is little difference between the minimum value and the maximum value. The standard deviation is also small, but the ratio to the average is large, which indicates that the data is highly volatile and reflects the severity of the epidemic to a certain extent. The change of the data may also cause some epidemic prevention policy changes.
4.2 Feature selection based on mRMR
There are many kinds of feature sequences in EV load forecasting, and it is necessary to calculate the correlation between these feature sequences and the load series to be predicted, and select an appropriate set of feature sequences as the input of the forecasting model. The influence of meteorological factors such as temperature and date types are usually considered in the prediction of power load. It is assumed that these factors will also have a certain impact on the charging load of electric vehicles. Therefore, these influencing factors and the impact of COVID-19 are taken into account in this paper. Considering the hysteresis of epidemic factors, it is assumed that EV charging load will be affected by epidemic factors 1–3 days before the current day, and the influencing factor set is established as shown in Table 4.
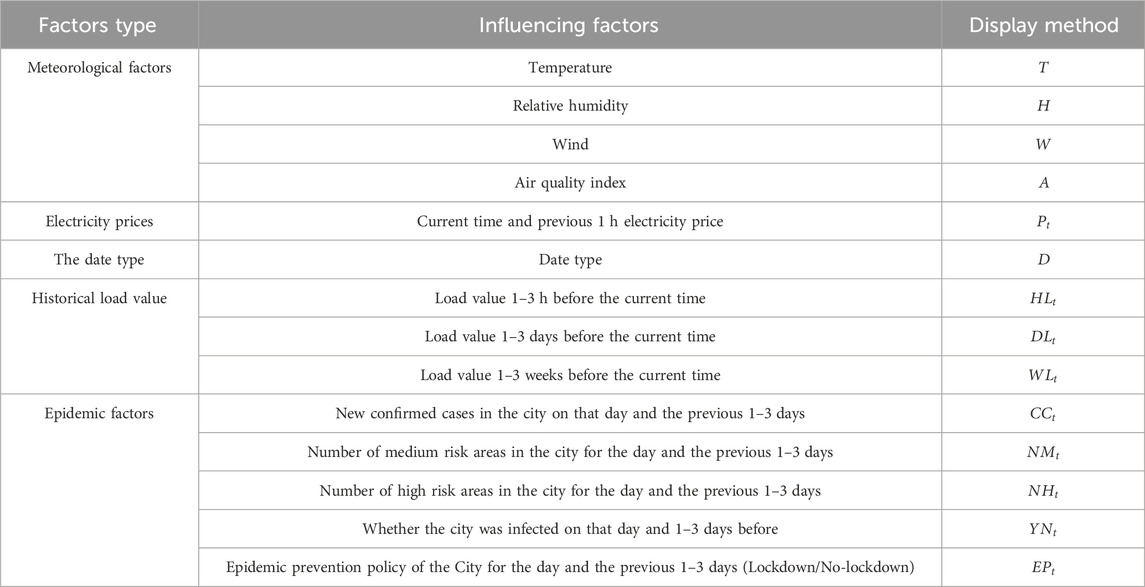
TABLE 4. Influencing factor set.
Take
Before feature selection, data should be processed dimensionless to make the data have the same specification and accelerate the convergence of neural network. Electric vehicle load, meteorological series and electricity price data can be normalized to the interval [−0.5, 0.5] to achieve dimensionless. Different from the common [0, 1] interval, neural networks tend to input data centered on 0. Therefore, setting the center of the normalized interval as 0 is conducive to the convergence of neural networks, and normalization is shown in Eq. 20.
Where:
The date type sequence defines working days as 0, weekends as 1, and holidays as 2 to identify the load characteristics of different date types.
Since the time granularity of epidemic data was inconsistent with EV charging load data, MIC was first used to analyze the correlation between epidemic data and daily average load. The results showed that MIC values of 20 epidemic related information were all above 0.8, showing strong correlation. In order to improve the sensitivity of intra-day load to epidemic information, the charging load of electric vehicles was divided according to whether there was an epidemic (the first confirmed case was regarded as the beginning of an epidemic, and the 7-day absence of new cases was regarded as the end of an epidemic). The average value of the two groups of data was respectively taken as the typical characteristic curve of epidemic period and non-epidemic period. Thus, the proportion of load at each moment in the total load of a day can be obtained, that is, the proportion of epidemic period and non-epidemic period. Then, multiply the epidemic information to get the epidemic data with unified time granularity. For such data, if the interval −[−0.5, 0.5] is used, the discrimination degree is low. Therefore, the interval of epidemic data is mapped to [0,10] to improve the sensitivity to epidemic information with a larger interval range.
In order to consider the correlation between the single characteristic variable and the target variable, as well as the linear and nonlinear relationships, MIC method can be chosen to judge the correlation between two sequences. The correlation between each sequence is shown in Figure 9.
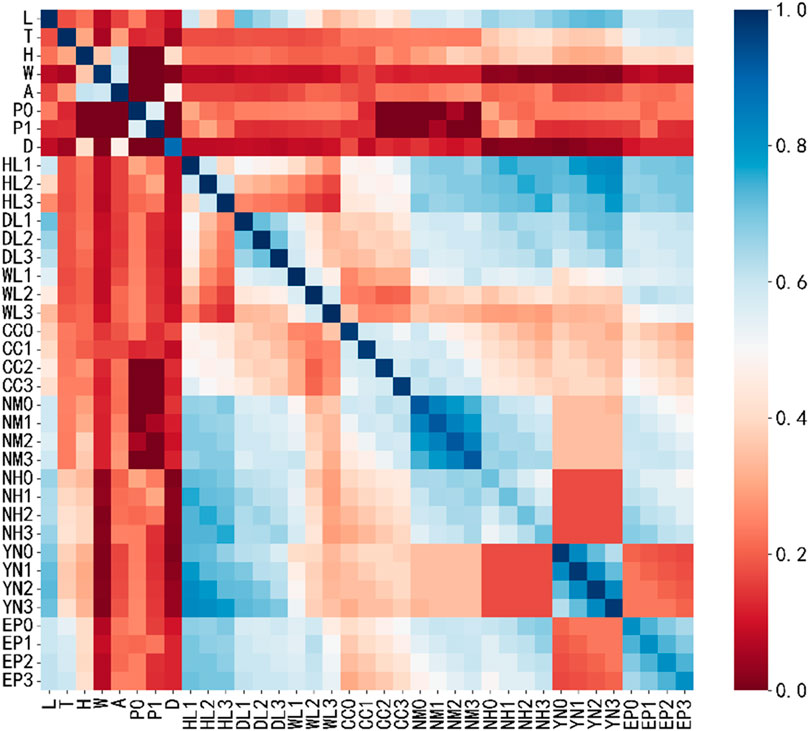
FIGURE 9. MIC between each sequences.
The MIC value of some sequences in Figure 9 and itself is not 1, because it is necessary to grid
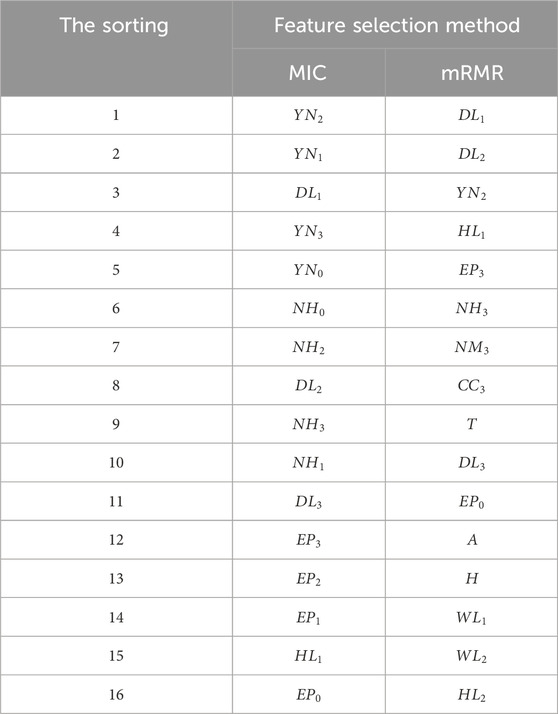
TABLE 5. Feature sets obtained by feature selection (MIC and mRMR).
As can be seen from Figure 9, the feature subset selected according to the MIC method in Table 3 have a lot of redundant information. For example, the correlation of:
4.3 Electric vehicle charging load forecast based on IPSO-LSTM
Set the data according to 6: 2: 2 is divided into training set, validation set and testing set, where the data of training set is the first 109 days (data volume is 2,616, accounting for 60.22%), validation set is the middle 36 days (data volume is 864, accounting for 19.89%), and testing set is the last 36 days (data volume is 864, accounting for 19.89%), as shown in Figure 10.
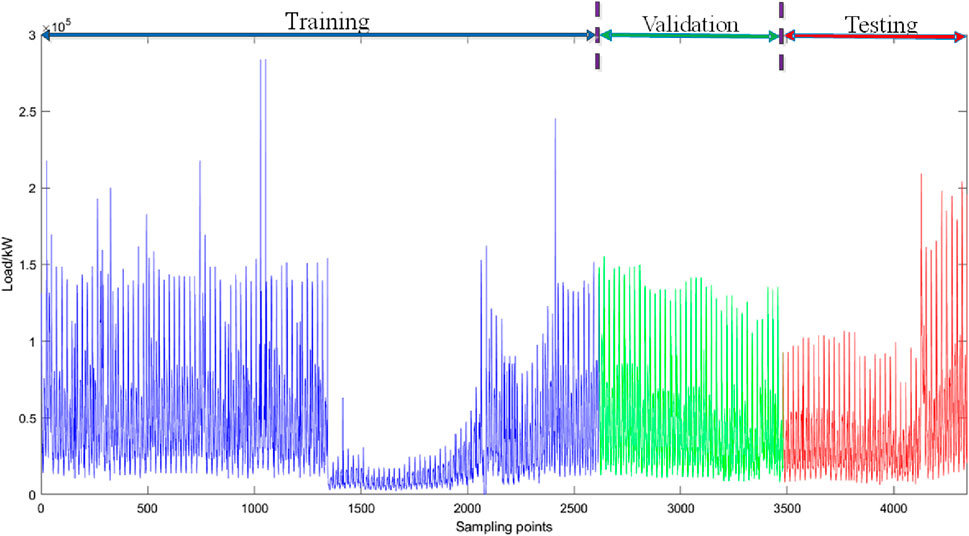
FIGURE 10. The load value of training and testing data set ranged from 1/11/2021 to 30/4/2022.
In Figure 10, blue is the training set, green is the validation set, and red is the testing set. Both the training set and the testing set included epidemic period and non-epidemic period, which ensured the accuracy of the model establishment and the reliability of the test. The validation set is used to determine the number of input features and the input parameters in the IPSO-LSTM model.
The initial parameters in the IPSO-LSTM model were set as: the number of individuals in the population was 10; The iteration number
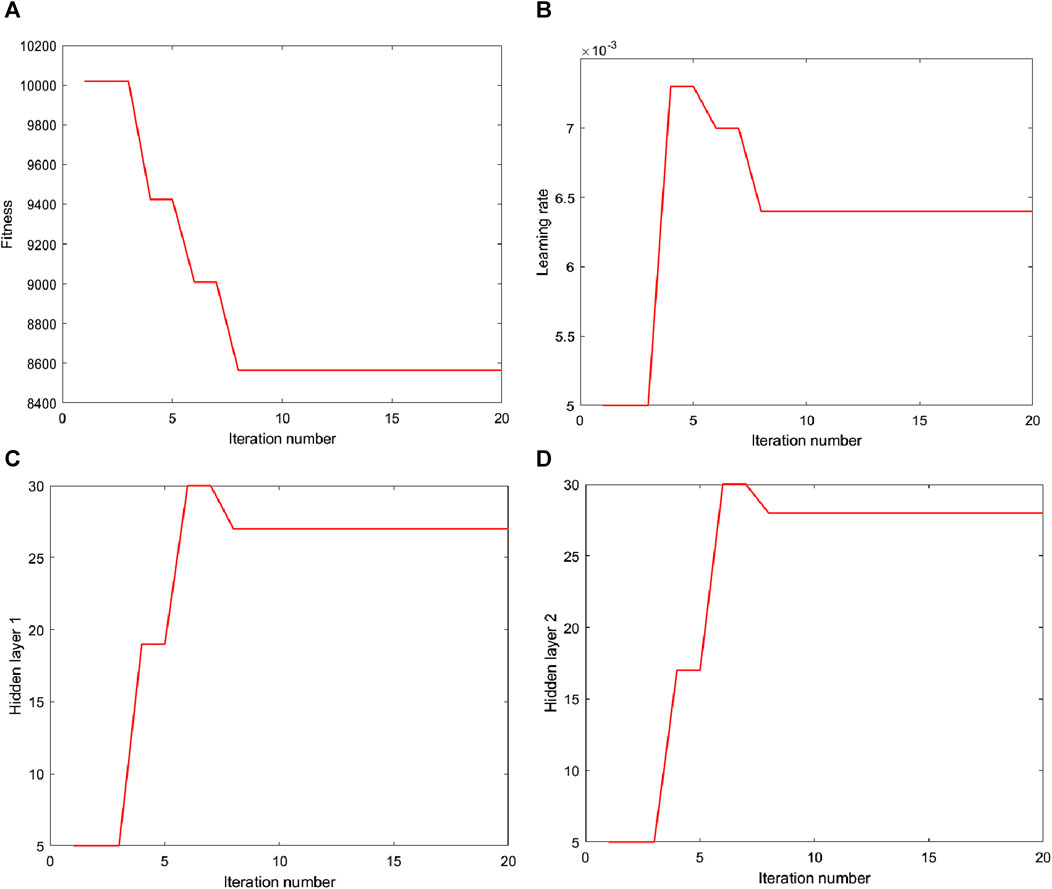
FIGURE 11. Adaptation and hyperparameter variation curves. (A) Fitness. (B) Learning rate. (C) Hidden layer 1. (D) Hidden layer 2.
As can be seen from Figure 11, the fitness value tends to be stable at the eighth iteration after two declines, and the optimal parameter after IPSO optimization is as follows: the number of neurons in hidden layer 1 is 27, the number of neurons in hidden layer 2 is 28, and the learning rate is 0.0064.
The influencing factors in Table 5 were input into the forecasting model one by one in order, and the minimum number of input features of SMAPE was taken as the optimal feature set. The relationship between the error on the validation set and the number of input features is shown in Figure 12.
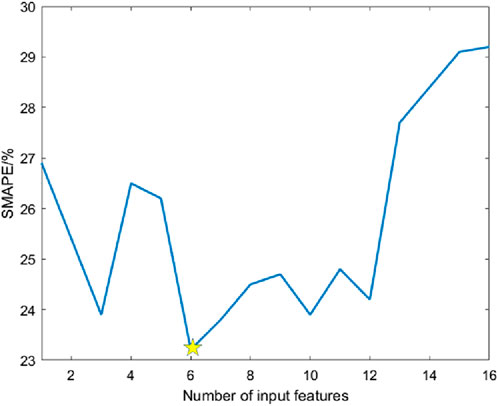
FIGURE 12. SMAPE with different number of input features.
In Figure 12, SMAPE values are different under different number of input features. When the number of input features is 1–12, the SMAPE value fluctuates continuously, and when the number of input features is 6, the SMAPE value is the smallest. When the number of input features is greater than 12, the SMAPE value increases rapidly, which indicates that the more input features is not the better, and too much input will make the model not selective. Therefore, the number of input features is chosen to be 6.
Finally, the optimal feature set of the forecasting model is
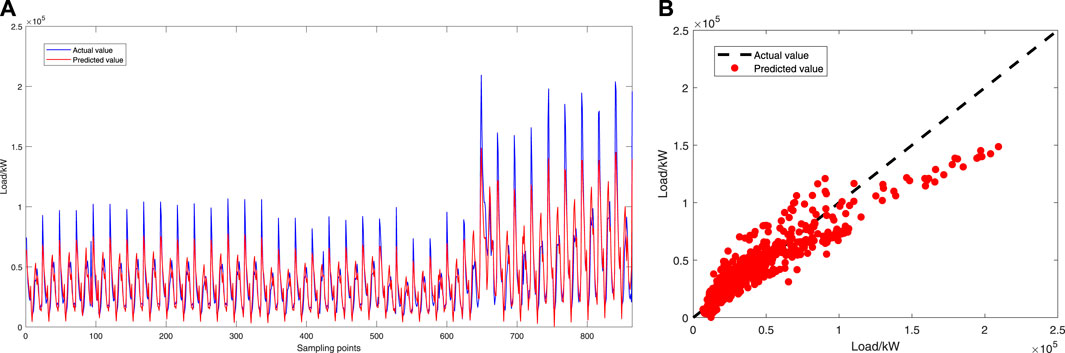
FIGURE 13. Final forecast results. (A) Forecast result chart, (B) Forecast scatter plot.
As can be seen from Figure 13A, the forecast effect at the peak is poor, while the prediction effect at other points is good. In Figure 13B, when the load value is greater than 120000 kW, the point is far away from the dashed line, which also verifies the deficiency of peak prediction. When the load value is less than 120000 kW, the predicted point falls near the dashed line, which has good accuracy.
5 Comparative analysis and discussion
In order to verify the forecast accuracy and stability of the proposed model in multiple dimensions, three experiments are compared in this section.
5.1 Comparison of forecasting models
In order to verify the forecast accuracy and stability of the proposed model, four different forecasting models, namely, BPNN, ARMA, LSTM and IPSO-LSTM, are used for comparison. Figure 14 shows the forecast results of the four forecasting models.
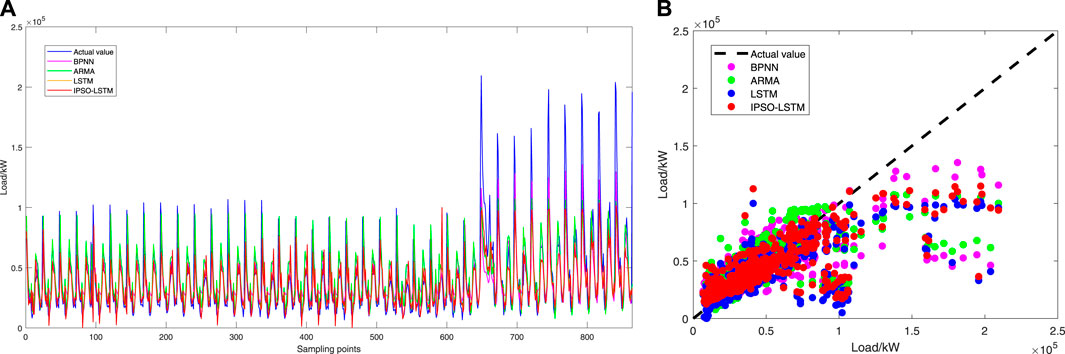
FIGURE 14. Comparison of the forecast results of the four forecasting models. (A) Forecast result chart, (B) Forecast scatter plot.
It can be seen from Figure 14 that the IPSO-LSTM model is better than BPNN, ARMA and LSTM. However, in general, the errors of the four models are larger when the load value is greater than 100000 kW. As a whole, the forecast effect increases with the increase of the load value, and the forecast effect further decreases when the peak value is large.
Table 6 shows the forecast performance indexes when the four forecasting models are adopted.
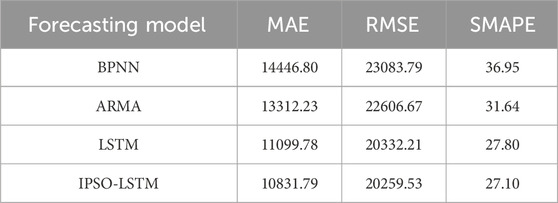
TABLE 6. Forecast performance indexes of the four forecasting models.
According to the forecast performance index results in Table 4, it can be seen that IPSO-LSTM > LSTM > ARMA > BPNN as a whole in terms of forecast effect. In terms of MAE value, IPSO-LSTM decreased by 25.02%, 18.63% and 2.41% compared with BPNN, ARMA and LSTM, respectively. In terms of RMSE and SMAPE, IPSO-LSTM is also 2%–13% lower than BPNN, ARMA and LSTM, respectively. This shows that LSTM can better learn the long-distance dependence relationship depending on its own advantages, which is suitable for application in EV charging load forecasting.
5.2 Comparison of different sets of influencing factors
To measure the influence of COVID-19 epidemic related factors on EV load forecasting, this paper divides the influencing factor set into two categories: one is all factors except epidemic factors in Table 2, which is represented by
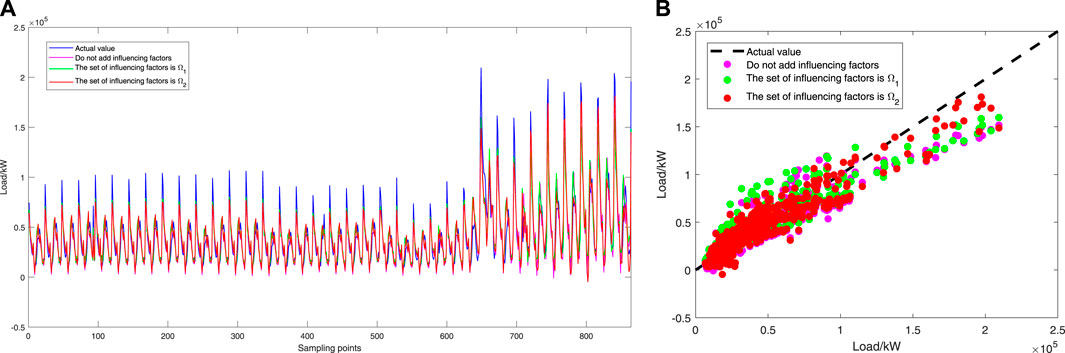
FIGURE 15. Comparison of forecast results under different influence factor sets. (A) Forecast result chart, (B) Forecast scatter plot.
It can be seen from Figure 15 that the forecast effect is not significantly improved when the influencing factor set is
Table 7 shows the forecast performance indexes under different sets of influencing factors.
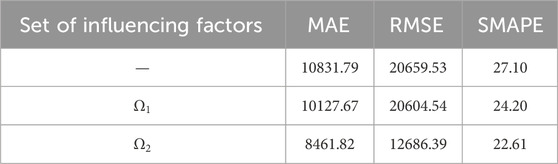
TABLE 7. Forecast performance indexes under different sets of influencing factors.
As can be seen from Table 5, when the influencing factor set is
The above research shows that the model proposed in this paper has a satisfactory effect on single-step forecasting. However, in addition to focusing on the accuracy of the forecast, the forecast results of different foresight periods are of great significance for the intraday demand-side response with EV charging loads.
5.3 Comparison of different forecast periods
The model proposed in this study is taken as an example to illustrate the impact of different forecast periods on the forecast results. Figure 16 shows the forecast results for the different forecast periods (2 h, 4 h, 6 h).

FIGURE 16. The forecast results of the model proposed in this paper in different forecast periods (2 h, 4 h, 6 h). (A) Forecast result chart, (B) Forecast scatter plot.
As can be seen from Figure 16, with the growth of the foresight period, the deviation on the peak and valley value gradually increases. This is due to the gradual accumulation of errors as the forecast period increases, which reduces the forecast accuracy. In addition, the accuracy of the forecasting at the turning point of the epidemic also decreased, which may be because the sensitivity of the quantitative treatment of epidemic factors for longer time changes is not obvious. Table 8 lists the evaluation index values of the forecasting model for the different forecast periods.
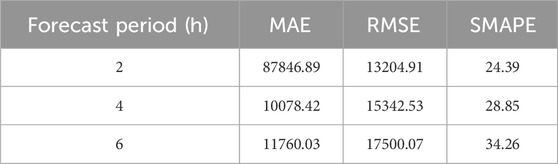
TABLE 8. Evaluation index values of the forecast model proposed in this paper in different forecast periods.
In Table 8, the MAE, RMSE and SMAPE all increase with the growth of the foresight period, which is consistent with the results in Figure 16.
6 Conclusion
The main purpose of this study is to design an EV charging load forecasting model with high accuracy that can quickly respond to epidemic situations (or similar emergencies). In the case study, we test the performance of the proposed model using measured data during the COVID-19 in a city in China. The results show that:
(1) Aiming at the determination of hidden layer parameters and learning rate in LSTM, IPSO was used to optimize the training parameters, and the best parameters suitable for such data were determined in the validation set, which improves the prediction accuracy. The example showed that the accuracy of the LSTM network optimized by IPSO can be improved by 2% compared with that before optimization, which proves the effectiveness of the proposed model.
(2) By affecting travel, the epidemic has affected charging loads of electric vehicles. The charging load of electric vehicles in the two epidemic periods showed great changes compared with the non-epidemic period, but the changes were different. It can be considered that COVID-19 has a very important impact on the charging load of electric vehicles, and the impact results are related to the severity and spread of the epidemic. It is therefore reasonable to take epidemic factors into account in such forecasting problems in the context of the COVID-19 pandemic.
(3) In the process of data processing, the epidemic factors were personalized, and the proportion coefficient of the corresponding moment was obtained by taking the typical characteristic curves of the epidemic period and the non-epidemic period to unify the time granularity. Increasing the range of the mapping interval to improve the sensitivity of epidemic information is conducive to capturing the amount of mutations, improving the forecast effect of peak and valley values and turning points, focusing on improving the prediction ability of high-load areas in non-epidemic periods, and thus achieving the purpose of overall forecast accuracy. Compared with the forecasting model without considering the influencing factors, MAE, RMSE and SMAPE decreased by 21.88%, 38.59% and 16.57%, respectively, and were more consistent with the current social background.
(4) The measured data of interaction changes between epidemic and non-epidemic periods in a city in China were selected to test the forecast effect of the model in epidemic and non-epidemic periods. Compared with other forecasting models, the model proposed in this paper achieves better and more stable forecast results in both epidemic and non-epidemic periods, with MAE, RMSE and SMAPE all reduced by more than 20%, it showed that the forecasting model is consistent in improving the forecast effect of data with different characteristics. In addition, real-time demand-side response is carried out based on the forecast results of multiple foresight periods, which can alleviate the problem of large load variation during the epidemic to a certain extent.
In addition, how to more reasonably unify the time granularity of the feature series and load series, and how to more effectively dimensionless the data to improve the sensitivity to the epidemic situation are the focus of the next research when the hour-level epidemic related data cannot be obtained. In future work, the electric vehicle charging load forecasting method proposed in this paper will be applied to the smart Internet of vehicles system in the city in combination with the GPS road network system and regional special event characteristics, and the real-time updated multi-time scale forecasting results will provide reference for the demand-side response under the background of epidemic prevention and control.
Data availability statement
The original contributions presented in the study are included in the article/Supplementary material, further inquiries can be directed to the corresponding author.
Author contributions
TX: Conceptualization, Formal Analysis, Resources, Writing–original draft. YZ: Data curation, Investigation, Writing–original draft. GZ: Funding acquisition, Investigation, Writing–review and editing. KZ: Methodology, Software, Writing–review and editing. HL: Project administration, Validation, Writing–review and editing. XH: Supervision, Validation, Writing–review and editing.
Funding
The author(s) declare financial support was received for the research, authorship, and/or publication of this article. The authors gratefully acknowledge the financial support provided by Natural Science Basic Research Program of Shaanxi Province (2022JQ-534).
Conflict of interest
Author YZ was employed by LTD. Ultra high voltage company.
Author HL was employed by Electric Power Research Institute of State Grid Shaanxi Electric Power Company.
The remaining authors declare that the research was conducted in the absence of any commercial or financial relationships that could be construed as a potential conflict of interest.
Publisher’s note
All claims expressed in this article are solely those of the authors and do not necessarily represent those of their affiliated organizations, or those of the publisher, the editors and the reviewers. Any product that may be evaluated in this article, or claim that may be made by its manufacturer, is not guaranteed or endorsed by the publisher.
References
Abbas, F., Feng, D. H., Habib, S., Rasool, A., and Numan, M. (2019). An improved optimal forecasting algorithm for comprehensive electric vehicle charging allocation. ENERGY Technol. 7 (10). doi:10.1002/ente.201900436
Atif, Y., Ding, J., and Jeusfeld, M. A. (2016). Internet of things approach to cloud-based smart car parking. Procedia Comput. Sci. 98, 193–198. doi:10.1016/j.procs.2016.09.031
Bayrak, A. T., Aktas, A. A., Susuz, O., Tunalı, O., et al. (2020). “Churn prediction with sequential data using long short term memory,” in 2020 4th International symposium on multidisciplinary studies and innovative technologies, 1–4. doi:10.1109/ISMSIT50672.2020.9254679
Bian, H. H., Wang, Q., Xu, G. Z., and Zhao, X. (2022). Load forecasting of hybrid deep learning model considering accumulated temperature effect. ENERGY Rep. 8 (1), 205–215. doi:10.1016/j.egyr.2021.11.082
Chen, Y. W., and Chang, J. M. (2016). Fair demand response with electric vehicles for the cloud based energy management service. IEEE Trans. Smart Grid 9, 458–468. doi:10.1109/tsg.2016.2609738
Dabbaghjamanesh, M., Moeini, A., and Kavousi-Fard, A. (2021). “Reinforcement learning-based load forecasting of electric vehicle charging station using Q-learning technique,” in IEEE TRANSACTIONS ON INDUSTRIAL INFORMATICS, 17 (6), 4229–4237. doi:10.1109/tii.2020.2990397
Dai, Q., Cai, T., Duan, S. X., and Zhao, F. (2014). Stochastic modeling and forecasting of load demand for electric bus battery-swap station. Bus. Battery-Swap Stn. 29 (4), 1909–1917. doi:10.1109/tpwrd.2014.2308990
Feng, J. W., Yang, J. Y., Li, Y. L., Wang, H. X., Ji, H. C., Yang, W. Y., et al. (2021). Load forecasting of electric vehicle charging station based on grey theory and neural network. ENERGY Rep. 7 (6), 487–492. doi:10.1016/j.egyr.2021.08.015
Ge, L. J., Xian, Y. M., Wang, Z. G., Gao, B., Chi, F., and Sun, K. (2021). Short-term load forecasting of regional distribution network based on generalized regression neural network optimized by grey wolf optimization algorithm. CSEE J. POWER ENERGY Syst. 7 (5), 1093–1101. doi:10.17775/CSEEJPES.2020.00390
Hochreiter, S., and Schmidhuber, J. (1997). Long short-term memory. Neural comput. 9, 1735–1780. doi:10.1162/neco.1997.9.8.1735
Iversen, E. B., Mø ller, J. K., Morales, J. M., Madsen, H., et al. (2017). Inhomogeneous Markov models for describing driving patterns. IEEE Trans. Smart Grid 8 (2), 581–588. doi:10.1109/TSG.2016.2520661
Iwafune, Y., Ogimoto, K., Kobayashi, Y., and Murai, K. (2020). Driving simulator for electric vehicles using the Markov chain Monte Carlo method and evaluation of the demand response effect in residential houses. IEEE Access 8, 47654–47663. doi:10.1109/access.2020.2978867
Leou, R. C., Su, C. L., and Lu, C. N. (2014). Stochastic analyses of electric vehicle charging impacts on distribution network. IEEE Trans. Power Syst. 29 (3), 1055–1063. doi:10.1109/tpwrs.2013.2291556
Li, L., Wei, J., Li, C. B., Cao, Y. J., Song, J. Y., Fang, B. L., et al. (2015). Prediction of load model based on artificial neural network. Trans. China Electrotech. Soc. 30 (8), 225–230. (in Chinese).
Li, P. H., and Pye, S. (2018). Assessing the benefits of demand-side flexibility in residential and transport sectors from an integrated energy systems perspective. Appl. ENERGY 228, 965–979. doi:10.1016/j.apenergy.2018.06.153
Lin, S., Wang, H., Qi, L. H., Feng, H. Y, Su, Y., et al. (2021). Short-term load forecasting based on conditional generative adversarial network. Automation Electr. Power Syst. 45 (11), 52–60. (in Chinese).
Liu, J. (2020). “Statistical analysis on the change of economic condition in China under the influence of COVID-19,” in 2020 International conference on big data economy and information management, 95–100.
National Health Commission of the People’s Republic of China (2022). Office of Health emergency. Available at: http://www.nhc.gov.cn (Accessed on August 10, 2022).
Peng, H. C., Long, F. H., and Ding, C. (2005). Feature selection based on mutual information: criteria of max-dependency, max-relevance, and min-redundancy. IEEE Trans. Pattern Analysis Mach. Intell. 27 (8), 1226–1238. doi:10.1109/tpami.2005.159
Reshef, D. N., Reshef, Y. A., Finucane, H. K., Grossman, S. R., McVean, G., Turnbaugh, P. J., et al. (2011). Detecting novel associations in large data sets. Science 334 (6062), 1518–1524. doi:10.1126/science.1205438
Salah, F., Ilg, J., Flath, C., Basse, H., and Dinther, C. V. (2015). Impact of electric vehicles on distribution substations: a Swiss case study. Apply Energy 137, 88–96. doi:10.1016/j.apenergy.2014.09.091
Shaanxi Provincial Development and Reform Commission (2022). Energy bureau electricity division. Available at: http://sndrc.shaanxi.gov.cn (Accessed on August 10, 2022).
State-owned Assets Supervision (2022). State-owned Assets supervision and administration commission of hubei provincial people’s government. Hubei Provincial Communications Group. Available at: http://gzw.hubei.gov.cn (Accessed on August 10, 2022).
State-owned Assets Supervision and Administration Commission of the State Council (2022). State-owned Assets supervision and administration commission of the state Council. State Grid Co., Ltd. Available at: http://www.sasac.gov.cn (Accessed on August 10, 2022).
Sun, H., Yang, F., Gao, Z. N., Hu, S. B., Wang, Z. H., Liu, J. S., et al. (2022). Short-term load forecasting based on mutual information and Bi-directional long short-term memory network considering fluctuation in importance values of features. Automation Electr. Power Syst. 46 (08), 95–103. (in Chinese).
The State Council of the People’s Republic of China The state Council of the people’s Republic of China. People’s Daily. Available at: http://www.gov.cn (Accessed on August 10, 2022).
Wang, H. X., Yuan, J. H., Chen, Z., Ma, Y. M., Dong, H. N., Yuan, S., et al. (2022). Review and prospect of key techniques for vehicle-station-network integrated operation in smart city. Trans. China Electrotech. Soc. 37(1): 112–132. (in Chinese).
Wen, L. L., Zhou, K. L., Yang, S. L., and Lu, X. (2019). Optimal load dispatch of community microgrid with deep learning based solar power and load forecasting. Energy, 171: 1053–1065. doi:10.1016/j.energy.2019.01.075
Xi’an Municipal People’s Government (2022). Xi’an epidemic prevention and control headquarters. Available at: http://www.xa.gov.cn (Accessed on August 10, 2022).
Xie, J. J., Zhong, Y. J., Xiao, T., Wang, Z., Zhang, J., Wang, T., et al. (2022). A multi-information fusion model for short term load forecasting of an architectural complex considering spatio-temporal characteristics. Energy and Build., 277. doi:10.1016/j.enbuild.2022.112566
Xie, M., Deng, J. L., Ji, X., Liu, M. B., et al. (2017). Cooling load forecasting method based on support vector machine optimized with entropy and variable accuracy roughness set. Power Syst. Technol. 41 (1), 210–214. (in Chinese).
Zakernezhad, H., Nazar, M. S., Shafie-khah, M., and Catalão, J. P. (2022). Optimal scheduling of an active distribution system considering distributed energy resources, demand response aggregators and electrical energy storage. Appl. Energy 314, 118865. doi:10.1016/j.apenergy.2022.118865
Zhang, C., Hu, H. W., Ji, J., Liu, K., Xia, X., Nazir, M. S., et al. (2023). An evolutionary stacked generalization model based on deep learning and improved grasshopper optimization algorithm for predicting the remaining useful life of PEMFC. Appl. Energy, 330. (PA). doi:10.1016/j.apenergy.2022.120333
Zhang, G., Liu, H. C., Zhang, J. B., Yan, Y., Zhang, L., Wu, C., et al. (2019). Wind power prediction based on variational mode decomposition multi-frequency combinations. J. Mod. Power Syst. Clean Energy 7 (2), 281–288. doi:10.1007/s40565-018-0471-8
Zhang, J. A., Liu, C. Y., and Ge, L. J. (2022). Short-term load forecasting model of electric vehicle charging load based on MCCNN-TCN. ENERGIES 7 (6).
Zhang, T., Chen, X., Yu, Z., Zhu, X., and Shi, D. (2018). A Monte Carlo simulation approach to evaluate service capacities of EV charging and battery swapping stations. IEEE Trans. Industrial Inf. 14 (9), 3914–3923. doi:10.1109/tii.2018.2796498
Zhang, X., Chan, K. W., Li, H. R., Wang, H., Qiu, J., and Wang, G. (2021). Deep-learning-based probabilistic forecasting of electric vehicle charging load with a novel queuing model. IEEE Trans. Cybern. 51 (6), 3157–3170. doi:10.1109/tcyb.2020.2975134
Zhang, Y. G., Li, R. X., and Zhang, J. H. (2021). Optimization scheme of wind energy prediction based on artificial intelligence. Environ. Sci. Pollut. Res. 28 (29), 39966–39981. doi:10.1007/s11356-021-13516-2
Zhong, J., He, L., Li, C., Cao, Y., Wang, J., Fang, B., et al. (2014). Coordinated control for large-scale EV charging facilities and energy storage devices participating in frequency regulation. Appl. Energy 123 (15), 253–262. doi:10.1016/j.apenergy.2014.02.074
Zhu, J. C., Yang, Z. L., Mourshed, M., Guo, Y., Zhou, Y., Chang, Y., et al. (2019). Electric vehicle charging load forecasting: a comparative study of deep learning approaches. ENERGIES 12 (24), 2692. doi:10.3390/en12142692
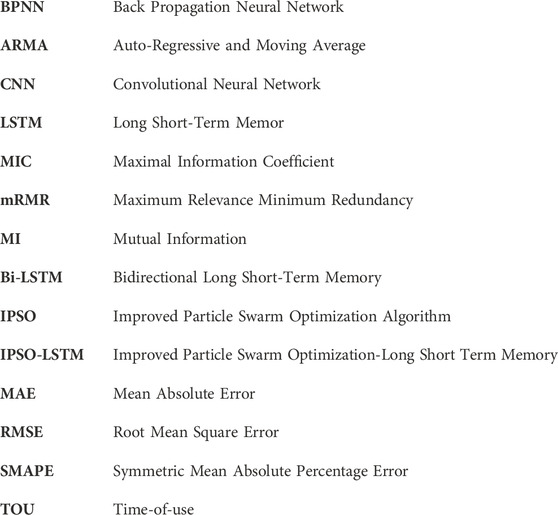
Nomenclature
Keywords: electric vehicle charging load forecast, feature correlation, maximum relevant minimum redundancy, improved particle swarm optimization -long short term memory, special event characteristics
Citation: Xie T, Zhang Y, Zhang G, Zhang K, Li H and He X (2024) Research on electric vehicle load forecasting considering regional special event characteristics. Front. Energy Res. 12:1341246. doi: 10.3389/fenrg.2024.1341246
Received: 20 November 2023; Accepted: 31 January 2024;
Published: 13 February 2024.
Edited by:
Hailong Li, Central South University, ChinaReviewed by:
Yongxi Zhang, Changsha University of Science and Technology, ChinaSonali Goel, Independent Researcher, India
Copyright © 2024 Xie, Zhang, Zhang, Zhang, Li and He. This is an open-access article distributed under the terms of the Creative Commons Attribution License (CC BY). The use, distribution or reproduction in other forums is permitted, provided the original author(s) and the copyright owner(s) are credited and that the original publication in this journal is cited, in accordance with accepted academic practice. No use, distribution or reproduction is permitted which does not comply with these terms.
*Correspondence: Gang Zhang, zhanggang3463003@163.com