Collocation-analyzed multi-source ensembled wind speed data in lake district: a case study in Dongting Lake of China
 Shi-Qi Tan1,2
  Hai-Feng Guo1,2* Chun-Hua Liao1,2 Jing-Hao Ma1,2 Wen-Zhi Tan3 Wei-Ying Peng1,2
  Jia-Zhi Fan2,4,5*
- 1Hunan Meteorological Service Center, Changsha, China
- 2Hunan Key Laboratory of Meteorological Disaster Prevention and Reduction, Changsha, China
- 3Chenzhou Meteorological Bureau, Chenzhou, China
- 4China Meteorological Administration Training Centre Hunan Branch, Changsha, China
- 5Nanjing University of Information Science and Technology, Nanjing, China
The lack of reliable near-surface wind data products in lake district regions significantly limits the efficiency of meteorological models, forecasts, services, and wind resource development. This is primarily due to a shortage of observation data and related studies, as well as insufficient validation and promotion of existing data products, which further hinders the comprehension and monitoring of local wind fields. In this study, comprehensive verification research was conducted on mainstream wind field products, namely, ERA5-Land (EC), GLDAS (GL), and HRCLDAS (HR) in the Dongting Lake area of China. This was achieved by utilizing a large volume of measured data and a triple collocation analysis (TCA) method. Additionally, an exploration into the optimal wind field data fusion method was undertaken. HR products demonstrate superior performance in capturing wind speed at the in situ measured scale, while GL outperforms at the grid scale, and EC products show relatively stable performance with minimal outliers. The long short-term memory (LSTM) neural network model, combined with time-series features, emerges as the most optimal data fusion model. LSTM fusion product is superior to the original product (except for HR products at the in situ measured scale), TCA-based weighted fusion products, and multi-layer fully connected neural network (MFCNN) on various parameters. This study quantifies the performance of mainstream wind products in lake areas and provides a benchmark for further application of these products. Furthermore, the successful implementation of an optimal wind data fusion method can provide valuable insights for related research, and the resulting wind fusion products can offer superior basic data support for local terminal applications.
1 Introduction
Wind, a fundamental meteorological element, exerts considerable influence on a large scale, affecting precipitation, and on a smaller scale, influencing heat, water vapor flux, convection, and cloud development (Gimeno et al., 2020; Dias Neto et al., 2023). Accurate wind speed data can significantly facilitate the creation and validation of meteorological models (Gimeno et al., 2020), enhance wind resource development (Nezhad et al., 2022), and refine meteorological services (Kosiba et al., 2013). Over the past few years, extensive research on wind fields in sea, island, and offshore areas has led to the creation of a range of data products. Despite this progress, there remains a notable shortage of medium and high-resolution data on near-surface wind speeds in mainland lake regions (Brinckmann et al., 2016).
Lakes, reservoirs, and other water bodies make up about 4% of the Earth’s land area (Downing et al., 2006). Compared to land, these water bodies have distinct features like higher heat capacity, lower albedo, less surface roughness, and more water vapor content. These characteristics lead to thermal disparities between water bodies and land, which in turn create unique wind circulations, making the wind field variable (Desai et al., 2009). This complex interaction significantly affects regional weather patterns and local convective processes (Long et al., 2007). Hence, accurate wind data products are essential for understanding local weather changes, climate patterns, and their underlying mechanisms in lake areas. It becomes a key scientific issue to study the optimization of wind field products in lake areas using existing observation techniques.
China has a vast inland water system, of which Dongting Lake, located in the middle reaches of the Yangtze River, is the second largest freshwater lake. Fishing, shipping, and tourism thrive in Dongting Lake, with a constant flow of fishing boats, sand dredging/transporting vessels, cruise ships, and cargo carriers. However, during flood seasons or extreme weather events, high winds and waves can significantly compromise navigation and flood protection safety in the lake area. Therefore, access to high-quality wind speed data is instrumental in fortifying shipping meteorological services, bolstering disaster prevention and reduction capabilities, and fostering wind resource development.
Despite the value of wind observation data, there is an apparent shortage of large-scale spatial and uniform wind speed observation products. Traditional wind speed observations near the surface (water surface) typically stem from ground (buoy) station observations, which are accurate (Lucio-Eceiza et al., 2018) but lack sufficient resolution. The increasingly adopted remote sensing technology can offer inversion products of sea surface wind fields. However, due to the complexity of the relationship between sea surface parameters and backscatter (Elyouncha et al., 2021), coupled with the lack of verification access, these products warrant further improvement.
Numerical simulation is also one of the solutions for obtaining wind speed products (Nezhad et al., 2020). The continuous evolution of meteorological observation systems and the accumulation of multi-source data from in situ automatic observation stations, radars, and satellites have paved the way for assimilating multi-source data or model products. These products compensate for the insufficient spatial resolution of observation products (Shi et al., 2019), and they have become the mainstream grid wind data products. They have found extensive application in wind energy resource assessment (Ren et al., 2022), air pollution analysis and prediction (Zhang et al., 2022), and meteorological disaster monitoring (Zhu et al., 2022). Such assimilated or model products provide large-scale parameterized wind field references. However, there are unquantified uncertainties at a regional scale. Thus, validation research is a crucial prerequisite for advancing the various applications and facilitating their deeper integration (Li et al., 2022a).
Each independent wind data product has its own optimized application scenarios and shortcomings, owing to differences in development models. ERA5-Land (EC), GLDAS (GL), and HRCLDAS (HR) are commonly utilized in meteorology, being official data products from meteorological agencies in Europe, the United States, and China. Each of these products offers wind field data. For instance, EC and GL have coarse resolution, and their accuracy levels vary across regions (Jiang et al., 2021), moreover, the lack of in situ measured data in China makes them easy to underestimate wind speed (Yu et al., 2019). Nevertheless, reanalysis data typically possess long time series and good spatial performance. For example, EC can effectively address the issues of spatial and temporal heterogeneity and data scarcity (Zhang et al., 2017). It demonstrates strong applicability in near-surface wind in the Bohai Rim region (Chen et al., 2017). HR, as an assimilation product, does not incorporate model data, which may impact its ability to capture spatial wind fields (Van Vledder and Akpınar, 2015), and the short application time leads to a lack of validation studies (Jiang et al., 2021). However, it assimilates extensive measured data in China, fostering iterative improvement, and offers superb spatial and temporal resolution. To sum up, the studies mentioned above, along with a broader body of related research, have provided evidence of both the advantages and disadvantages of these three widely used grid products. This suggests the possibility of employing data fusion techniques based on mathematical methodologies.
Data fusion is a technique that synthesizes incomplete information from various independent sources about the characteristics of an environment to generate more complete, unified, and accurate data (Yu et al., 2020). It is designed to achieve lower detection errors and heightened reliability (Rashinkar and Krushnasamy, 2017). Prominent data fusion methods include Bayesian estimation (Ma et al., 2020), reliability ensemble average method (Yoo et al., 2020), and machine learning (Yin et al., 2021). In the meteorological sector, data fusion technology has proven successful in enhancing temperature, wind, evapotranspiration, and other data products, thereby improving data quality and promoting product application (Sharma et al., 2022).
The accurate monitoring of wind fields in lake areas is a cutting-edge and complex scientific issue. The reasons are twofold: firstly, under the context of climate change, localized strong convective weather occurs frequently, especially in lake areas. Due to the uniqueness of the underlying surface, these areas exhibit complex dynamic and thermal interactions, leading to highly variable local wind fields. Consequently, a single observational approach is insufficient for accurately monitoring surface wind field characteristics. Secondly, the research on wind fields in lake areas is limited due to a lack of observational data and technical methodological constraints. Most of the limited research conducted focuses on regions like the Great Lakes in North America (Doubrawa et al., 2015), with insufficient studies carried out in Chinese regions. As a typical inland lake, Dongting Lake, influenced by its terrain and climate, has become a high-incidence area for strong winds. The scarcity of high-quality wind speed product limits local aviation meteorological services, disaster prevention and mitigation work, as well as the development of wind energy resources. In view of this situation, this research comprises three segments: 1) the verification process for the wind products from EC, GL, and HR in the Dongting Lake District involved conducting authenticity tests (to evaluate the performance of each product) through a combination of comparing in situ measured data and employing triple collocation analysis (TCA); 2) studying a wind fusion method based on TCA and a neural network model, and screening for the optimal fusion method; 3) conducting a comprehensive assessment of the optimal wind speed fusion product’s performance in the Dongting Lake area. The research results can quantify the performance of mainstream wind speed products in the Dongting Lake area, offer a reference for further product application, and bolster subsequent development of fusion products. Successful fusion technology application can provide a reference for related research, and the resulting wind fusion products can improve basic data support for local weather forecasts, services, and wind resource development.
2 Materials and methods
2.1 Study area
Dongting Lake, situated at 27°39′–29°51′ N, 111°19′–113°34′ E (Figure 1), spans the provinces of Hunan and Hubei. It is China’s second-largest freshwater lake, with the largest water volume among the lakes connected to the Yangtze River. Its water system comprises Dongting Lake (2,691 km2), Xiangjiang River, Zishui River, Yuanjiang River, Lishui River, Miluo River, Xinwall River, and other small to medium-sized rivers directly feeding into the lake. The lake area is vast, encompassing a complex network of interconnected water systems. Dongting Lake is surrounded by a multi-lake water network plain, formed over an extended period of geological activity. The lake is bordered by hills to the east, south, and west, and a broad plain lies to the north.
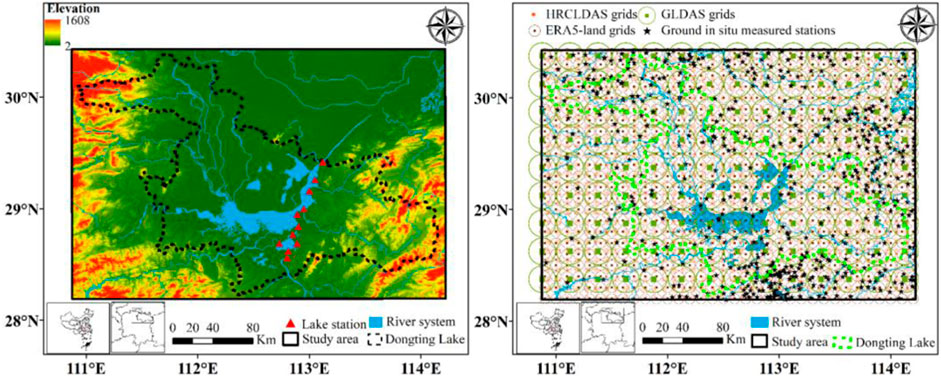
FIGURE 1. Distribution of terrain, water system, wind observation stations on lake (left), and wind observation stations on land, grids of the three products (right) in the study area.
In this study, the term “lake area” specifically pertains to the region enclosed by the dotted line shown in Figure 1, whereas the land area is situated beyond this delineation. All the areas depicted in Figure 1 are designated as study areas.
2.2 Data
With regard to the future utilization of the research results, EC, GL, and HR wind field products were selected as the primary data sources for this study. These gridded datasets were sourced from official meteorological agencies in Europe, the United States, and China, respectively, ensuring a high level of product quality and reliable accessibility. In this study, data from each product spanning 1 year, from 0:00 on 1 July 2021, to 23:00 on 30 June 2022, were utilized. This approach mitigates any potential influence of seasonal factors on the results.
(1) Data obtained from in situ measured stations
There are 552 surface wind observation stations (right figure in Figure 1) of the China Meteorological Administration in the study area, but all of the observation data have been used in the assimilation process of HR products. For the objectivity of validation results, observation data from these 552 stations are not used in the authenticity test of the first part, but they are used to validate the fusion product in the third part.
In addition, we set up 11 wind speed observation stations in Dongting Lake on our own (left figure in Figure 1) to obtain the first and unpublished wind observation data. Based on this dataset, mainstream grid products were verified more rigorously and objectively.
The above two data products are hourly automatically measured by the ZQZ-TF cup-type wind speed sensor at 10 m height, the measuring range is 0–75 m/s, the resolution is 0.1 m/s, and the averaged missing rate of all 563 stations is 1.09%.
(2) ERA5-Land reanalysis data (EC)
The EC reanalysis data, released by the European Center for Medium-Range Weather Forecasts (ECMWF) in 2017, is the fifth generation of global atmospheric numerical forecast reanalysis data (Hersbach et al., 2017; Muñoz Sabater, 2019). Utilizing the 4D-Var method that combines model-based estimates with observations (such as air temperature, air humidity, and pressure), EC effectively addresses uneven spatio-temporal distribution of observed products and data scarcity (Ma et al., 2023). The EC 10 m UV wind speed product, released in 2019, boasts a spatial resolution of 0.1° and a temporal resolution of an hour (Li et al., 2020). The data source is the Copernicus Climate Data Store.
(3) GLDAS assimilation data (GL)
The Global Land Data Assimilation Systems (GLDAS) is among the most widely employed land surface data assimilation products. Comprising both satellite observation and in situ measurement, GLDAS leverages an advanced land surface model and data assimilation technology (Rodell et al., 2004), and incorporates data from both satellites and ground-based observations. The GLDAS-2.1 simulation data, spanning from the year 2,000 to the present, are driven by various inputs, including atmospheric analysis fields from the National Oceanic and Atmospheric Administration (NOAA)/Global Data Assimilation System (GDAS), disaggregated precipitation fields from the Global Precipitation Climatology Project (GPCP), and radiation fields from the Air Force Weather Agency’s AGRicultural METeorological modeling system (AGRMET). This study utilized the GLDAS-2.1 10 m UV wind product, produced by a Noah-3.6 land surface process model, with a 3-h temporal resolution and a 0.25° spatial resolution (Rodell et al., 2004). The data source is the NASA Goddard Earth Sciences Data and Information Services Center.
(4) HRCLDAS assimilation data (HR)
The High-Resolution China Meteorological Administration Land Data Assimilation System (HRCLDAS) employs multiple grid variational technology and a terrain correction algorithm. It combines numerical prediction data, satellite data, and site observation data to produce atmospheric-data-driven products (Han et al., 2019). Built upon the foundations of CLDAS-V1.0 and 2.0, which served as the fundamental components of the fusion algorithm for ground temperature, humidity, ground pressure, and 10 m wind speed, the HR product represents a significant advancement. This integration includes radiation station data and precipitation data gathered from various satellites and in situ observations within China. The HR system elevates spatial resolution from 0.0625° (the spatial resolution of CLDAS) to 0.01°, all while maintaining an hourly time resolution. The 10 m UV wind incorporates high-resolution digital elevation model and albedo information (Han et al., 2018). The data source is the China Meteorological Information Center.
2.3 Data processing method
Firstly, spatio-temporal nearest neighbor matching and error coefficient calculation were conducted between the wind grid products and the observed data from the 11 lake stations. If multiple in situ measured stations are involved in the matching process, the average value of these stations is taken as the in situ measured wind speed value of the grid. Subsequently, the EC and GL products were interpolated to a resolution of 0.01°/1 h using the inverse distance weighting-based spatio-temporal interpolation method (Li et al., 2014). This allowed for a TCA after the spatio-temporal nearest neighbor matching of the three grid products. The next step involved combining the TCA-based fusion method and the neural network model to develop an optimal data fusion technology. With this technology, we generated fusion products for the entire year in the study area. Ultimately, the accuracy of the fusion product was validated by comparing it to in situ wind speed data from 552 stations that were not used in constructing the fusion model (Figure 2).
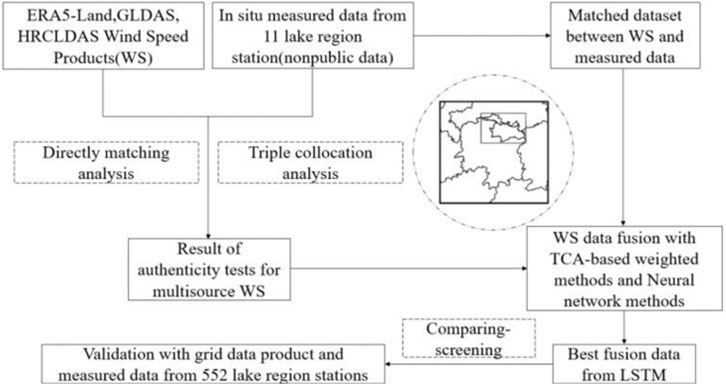
FIGURE 2. Flowchart of this research project.
2.3.1 Triple collocation analysis and data fusion method
Wind parameters with high spatio-temporal variability pose a challenge in finding high-quality reference data sets for validation studies, particularly in regions like lake areas, which are known for their scarcity of wind observation data. However, TCA can overcome this hurdle. By employing collocation analysis among three independent data products, TCA extracts error parameters and authenticity information between the evaluated product and the unknown truth value. Hence, it has evolved as an important evaluation tool for surface parameters (Fan et al., 2022).
In the TCA method, it is assumed that surface products are linearly correlated with real signals (Stoffelen, 1998), and the linear model is given by:
where,
For three independent data products, assuming that conditions ①
Hence, the error term
The principle of the TCA-based data fusion method involves the linear combination of the three products according to the uncertainty of each data product:
where,
where,
The second method, proposed by Li et al. (2022b), is referred to as the Li square method. Its calculation formula is (Eq. 7):
For each parameter, take
2.3.2 Neural network model and data fusion method
Artificial neural networks (ANNs) are a class of machine learning models designed to simulate the operations of the human brain. They employ nodes that function similarly to biological neurons, forming connections to process and transmit data. ANNs provide notable advantages over traditional regression and statistical models, as they excel in effectively modeling nonlinear relationships (Abiodun et al., 2018). In recent times, neural network models have gained extensive popularity across various domains, including machine learning and data fitting, and have delivered impressive results (Zhou et al., 2017; Fan et al., 2021).
A multi-layer fully connected neural network (MFCNN) is a neural network model that contains multiple hidden layers and enables data transmission between nodes of each layer (Figure 3). As a fundamental neural network model, it can enhance the self-optimization ability of the neural network model during multiple rounds of training due to its long data processing link and the flexible setting of model layer numbers, node numbers, and node functions, thus improving the performance of model fitting.
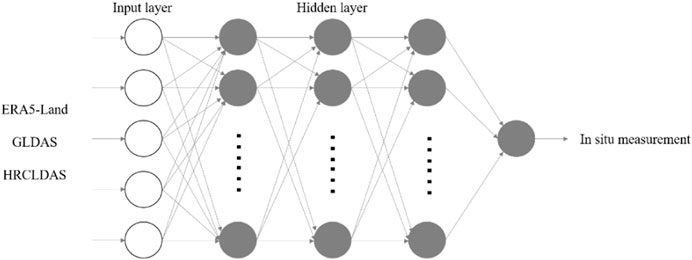
FIGURE 3. Neural network model structure.
The long short-term memory (LSTM) network is a variant of the recurrent neural network (Hochreiter and Schmidhuber, 1997; Gers et al., 2000). It effectively tackles the problem of gradient explosion and disappearance by introducing new internal states and gate mechanisms. Compared to MFCNN, it significantly increases the number of model parameters, but also broadens the model’s capacity to mine the time-series connection between data through the learning process. LSTM modulates the self-cyclic weight through the input gate, the forgetting gate, and the output gate (Eqs 9–14), allowing the model training process to alter the gradient and cumulative time scale (Eqs 9–14).
where,
In this study, a data fusion model was established based on the two aforementioned neural networks. In our approach, we employed the current and previous 23 time-series grid products corresponding to the grids that aligned with the 11 Dongting Lake observation stations as input variables for the model. Additionally, we utilized the current wind speed data obtained from these 11 stations as the target values for model fitting. When constructing the model, 80% of the matched dataset was allocated as the training set, while 20% served as the validation set. To prevent overfitting during training, a separate test set was created from the training data, consisting of 10% of the training data. Each training and validation round randomly selected 128 sets of data. The model’s maximum training rounds were capped at 100, and the optimal model was determined by the first model to undergo 10 consecutive rounds without improvement. Through continuous refinement of data preprocessing methods, regularization techniques, model structure, and node functions, the optimal neural network data fusion model was explored and verified with the fusion model based on TCA.
2.3.3 Performance indicators
2.3.3.1 Direct matching analysis
Data product results from the direct matching analysis are evaluated by the following parameters: Pearson correlation coefficient (r), Bias, relative bias (Biasr), root mean square error (RMSE), and unbiased RMSE (ubRMSE). The equations for these indexes are as follows (Eqs 15–19):
where
2.3.3.2 Triple collocation analysis
The following parameters are used as indicators of TCA: correlation coefficient (Rho), standard error (Stderr), fractional RMSE (fRMSE), and signal-to-noise ratio in decibels (Snr_db) (Eqs 20–26). The equations used are as follows:
If
where a, b, and c are the triple-collocated products in each grid.
In the preceding parameters, higher values of r and Rho, and lower values of Bias, Biasr, RMSE, ubRMSE, and Stderr, indicate superior product performance. The value of fRMSE ranges from 0 (indicating perfect estimates) to 1 (indicating total noise with no ground truth signal), with values > ∼0.7 suggesting an error variance that exceeds the variance of the true time series (Fan et al., 2021). A value of zero for Snr_db indicates that signal variance is equal to noise variance; +3 (+6) dB indicates that signal variance is twice (four times) noise variance; −3 (−6) dB indicates that signal variance is half (one-fourth) noise variance, and so forth (Chen et al., 2017).
3 Results
3.1 Authenticity tests of multi-source grid wind products
The authenticity of three distinct grid products tested in the Dongting Lake area was assessed by employing direct matching analysis for each independent wind field product and the triple collocation analysis for the interpolated data. The direct matching analysis involves comparing original EC, GL, and HR with the observation data from 11 lake stations and computing error parameters. The results of the analysis, as depicted in Table 1, reveal unique strengths and weaknesses for each of the three grid products in the Dongting Lake area. In terms of the overall error coefficient, EC products exhibit the smallest RMSE and ubRMSE, signifying fewer outliers and a smaller absolute deviation. GL products, with the highest r value, demonstrate superior capacity to capture surface wind speed. Conversely, HR products achieve the best results in Bias and Biasr, indicating minor overall deviation. However, each product also presents certain shortcomings. GL products, in terms of the overall error coefficient, perform the poorest in Bias, Biasr, and RMSE, suggesting a large overall deviation and more outliers. HR products, with the worst r and ubRMSE, reveal an inadequate capability to capture wind speed and a larger absolute deviation.
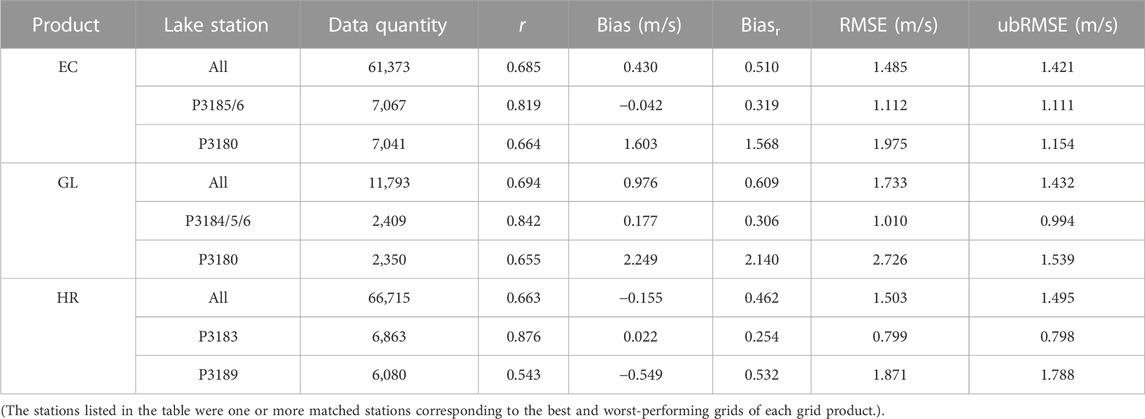
TABLE 1. Error coefficients of three grid products matched with the 11 Lake station data.
When evaluating the best-performing grids for each product, it becomes clear that a HR grid demonstrates superior performance in various parameters. Nevertheless, it is important to highlight that there is an underperformance observed in the case of the worst-performing HR grid. This underperformance is characterized by the poorest values for parameters like r and ubRMSE. This suboptimal performance of the worst-performing HR grid can be attributed to its heavy reliance on measured surface data and its susceptibility to instability in areas with insufficient data support. Conversely, the worst-performing grids reveal a significant Bias, Biasr, and RMSE in the GL product, indicating a high abnormal deviation and random error at some grids, thereby negatively affecting the product’s overall performance.
Remarkably, the TCA verification results contrast with the direct matching analysis, demonstrating an optimal performance for GL products (Figure 4). A total of 800 times were randomly selected from the 8,760 annual occurrences, and the analysis was conducted using the TCA method after matching. The analysis’ Rho parameters reveal a noticeably stronger correlation of EC and GL products with the real wind field in the Dongting Lake area than that of HR products. The respective mean values in the study area are 0.908, 0.933, and 0.622. Furthermore, GL outperforms EC in the lake area boundary and some regions outside the lake area. The mean values of Stderr for EC, GL, and HR products are 0.478, 0.44, and 0.585, respectively, and their corresponding fRMSE values are 0.41, 0.345, and 0.756. These results suggest that EC and GL products have lesser errors when compared with the actual wind field than HR products, with GL demonstrating superior performance. Interestingly, the Stderr of HR products is comparable to the others, but its fRMSE is substantially different, indicating a higher error variance than the real signal in most areas and an increased prevalence of outliers with large deviations. The results of Snr_db are similar to Rho and fRMSE, with mean values of 7.084, 9.157, and −1.957 for EC, GL, and HR respectively, ranking the products in the order of GL, EC, and HR. This parameter indicates that the proportion of effective signals in the data for GL, EC, and HR is considerably higher than that of noise in most parts of the lake area. In contrast, the proportion of noise in the HR product data in the lake’s surrounding areas is too high, obscuring the real signal.
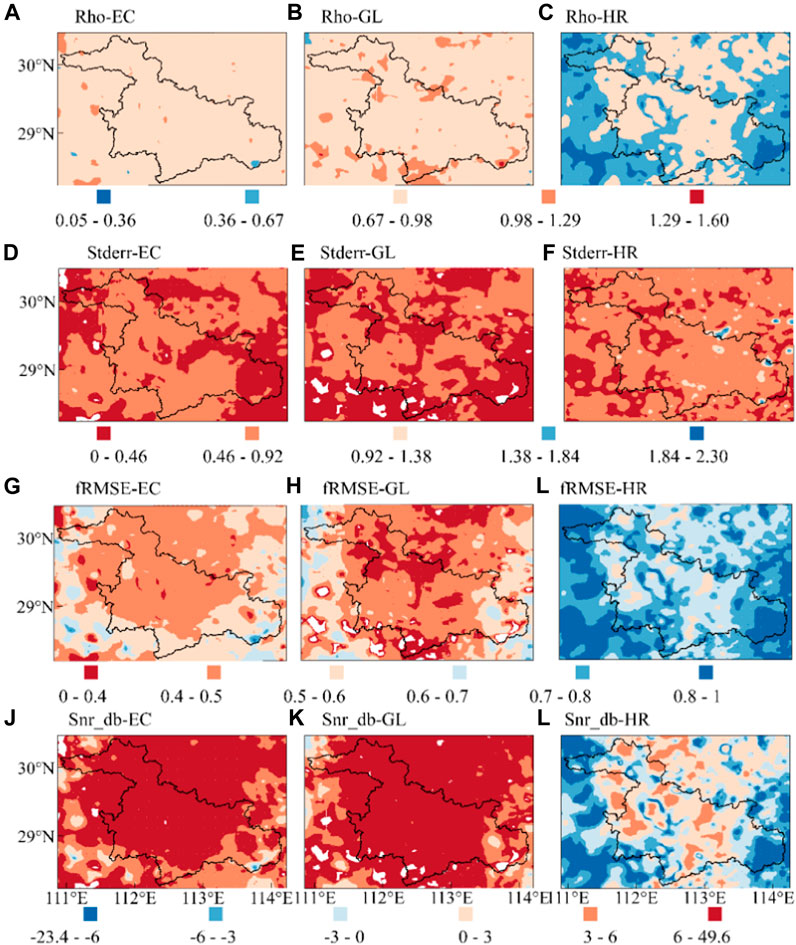
FIGURE 4. The TCA error parameter of EC, GL, and HR wind speed products in the Dongting Lake area: the gradual deepening of the red color signifies an improvement in product performance, while the gradual deepening of the blue color indicates a decline in product performance. The results presented in the figure pertain only to grids where all three datasets exhibit a positive correlation, and there are more than 100 data triplets available for analysis. (A) Rho-EC (B) Rho-GL (C) Rho-HR (D) Stderr-EC (E) Stderr-GL (F) Stderr-HR (G) fRMSE-EC (H) fRMSE-GL (I) fRMSE-HR (J) Snr_db-EC (K) Snr_db-GL (L) Snr_db-HR.
The distribution of TCA error coefficients for the three products in the lake area is relatively uniform, suggesting superior performance in the lake area or its boundary compared to the land area outside. In the lake area, the correlation between the product and the real wind field is strong (Figures 4A–C), the overall error is small (Figures 4G–I), and the signal-to-noise ratio is high (Figures 4J–L). The exception to this pattern is the Stderr parameter (Figures 4D–F), which performs better in some land areas outside the lake than within it. This, along with the fRMSE distribution analysis, suggests that deviations in land areas are primarily caused by a greater number of outliers, indicating that the product’s stability is compromised outside the lake area.
From the authenticity tests using both methods, it is established that the GL products in the Dongting Lake area perform comparatively well, demonstrating a good ability to capture surface wind speed at both in situ measured and grid scales. However, they are prone to abnormal deviations. While the HR products show strong performance in direct matching at certain lake stations, their overall performance is subpar. This is particularly evident in the TCA evaluation, which provides a better representation of the model’s capability to capture the spatial distribution of the grid wind field and address any discrepancies in product assessment. In fact, when it comes to TCA indicators, the HR products consistently exhibit the poorest performance compared to other products. EC products are stable in the study area with a smaller abnormal deviation, but they do not excel in any particular aspect. Considering that GL performs better, closely followed by EC in the Dongting Lake area, and HR shows some advantages in specific parameters, it is crucial to leverage data fusion technology to capitalize on the strengths of each independent product. Developing fusion products with superior comprehensive performance is the ultimate goal of the following research.
3.2 Research on the optimal wind field data fusion method
In this study, data fusion research on three independent wind field products—EC, GL, and HR—are conducted using two data fusion methods based on TCA and two data fusion methods based on machine learning. As a representative of the weight fusion method, the TCA fusion method calculates the weight coefficient based on the error coefficient. The neural network model, due to its robust fitting capacity, fits the measured data through the grid product. This neural network fusion model undergoes numerous rounds of training and improvement, eventually leading to the formation of two fusion model structures as outlined in Table 2.
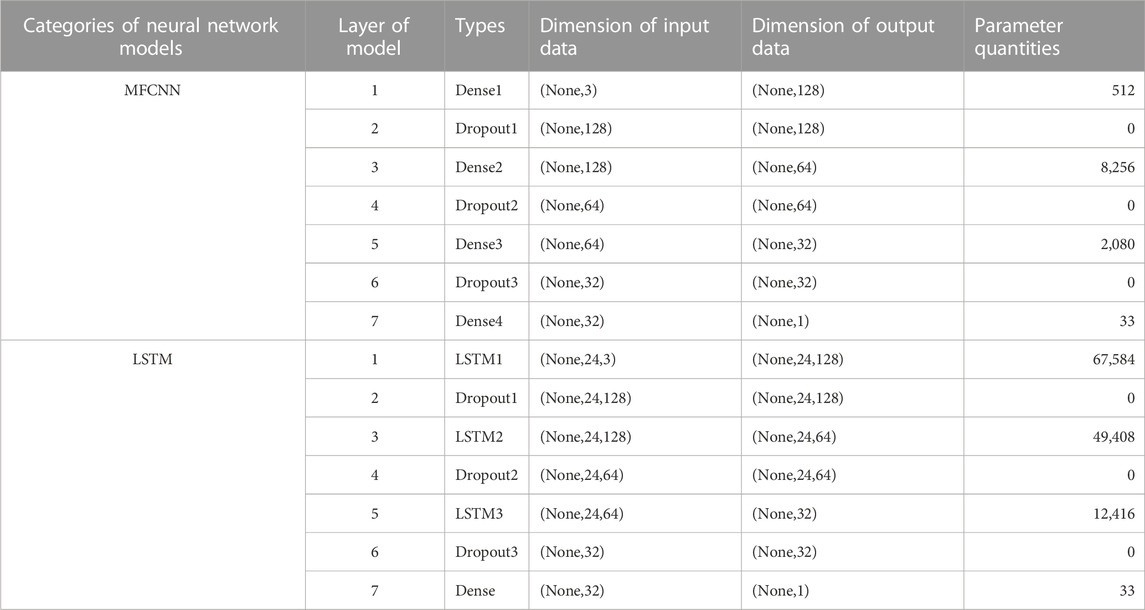
TABLE 2. Neural network fusion model structure.
To ensure objectivity in the comparative evaluation of the fusion effects of the four models, the verification data used was a matched data set that excluded the neural network model training data. This set comprised approximately 10,000 data points, and the validation results are presented in Table 3. According to the correlation between the grid product, the fusion product, and the measured data, the correlation between the four fusion products and the measured data is higher than that of the three original grid products. The LSTM fusion product shows the highest correlation coefficient, thereby confirming its superior ability to capture the wind speed of the lake area, followed by MFCNN and TCA-Li with similar results. Based on Bias, Biasr, RMSE, and ubRMSE, LSTM is the closest to the observed value, followed by TCA-Li and TCA-Gruber. The error performance of these two triple matching fusion models shows a slight improvement compared to each grid product, but they do not have a distinct advantage. MFCNN has the largest gap with the measured data, indicating that this fusion model cannot efficiently filter out the outliers. Overall, the LSTM fusion product outperforms the others.
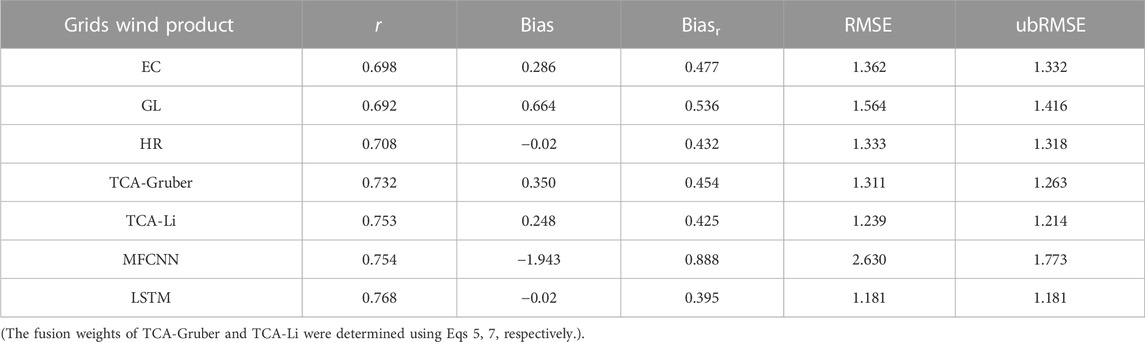
TABLE 3. Error coefficients of wind grid products and fusion products in the validation dataset.
3.3 Validation of LSTM fusion wind field products in the study area
The LSTM data fusion model, which yielded the most optimal results, was applied to all grids in the study area. This resulted in the generation of the best fusion wind field product with a resolution of 1 km/1 h throughout the year. The fusion product was then directly matched and verified based on all 563 wind speed observation station data in the study area. As presented in Table 4, the accuracy of the LSTM fusion products greatly improves compared to the EC and GL products, excluding HR products which have already assimilated data from 552 of these stations. This improvement is evident at nearly all overall, optimal, and worst sites.
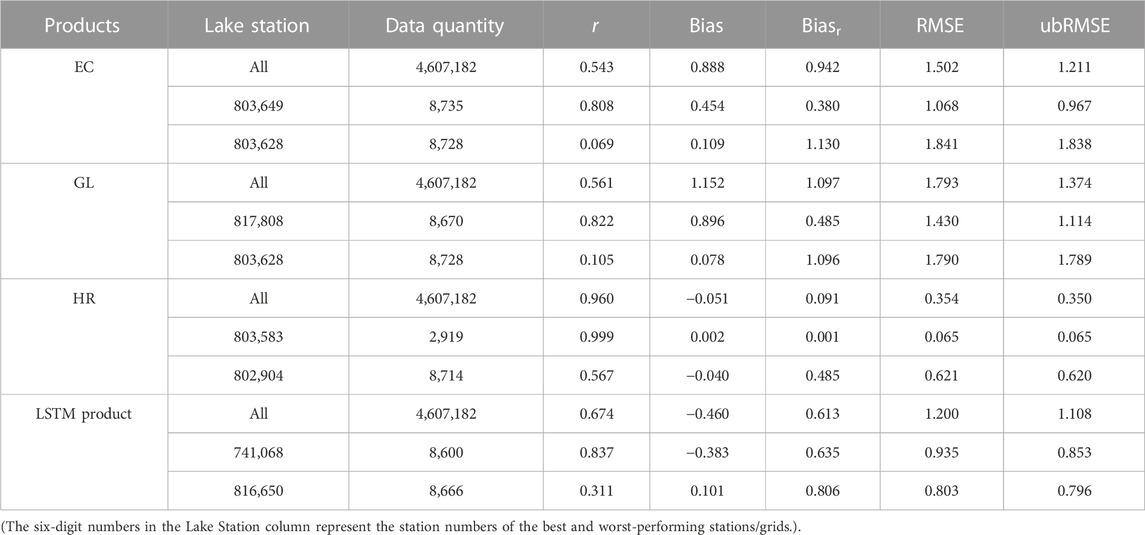
TABLE 4. Error coefficients of wind grid products and LSTM fusion products with in situ measurements in the study area.
In the direct verification of in situ measured scale, LSTM fusion products surpass all data products except HR, which possesses an absolute advantage in error parameter comparison due to its data source benefits. However, it is important to acknowledge that there is a scale difference between the in situ measurements and the grid-scale wind field. In order to assess the fusion product’s ability to accurately represent the wind field at the grid scale, TCA evaluation was carried out after the GL-HR-LSTM matching process. Results further affirmed the LSTM fusion product’s relative optimality, and the spatial distribution of product performance contrasts that of GL and HR, showing better results in the land area close to the lake than in the middle of the lake area (Figure 5). The Rho of LSTM products in the study area shows clear advantages (with mean values of 0.806, 0.745, and 0.936), affirming that the fusion product’s ability to capture the surface wind field has notably improved, especially in the land area near the lake. The distribution of Stderr (mean 0.757, 0.497, and 0.1) suggested that the fusion products’ deviation in other areas is smaller, barring some blank land areas. The fRMSE (mean values of 0.571, 0.641, and 0.469) and Snr_db (mean values of 3.188, 1.358, and 5.931) are mostly consistent with the above parameters, but some grids in the middle of the lake area perform slightly worse, potentially due to a greater deviation and increased data noise in this portion of the grids.
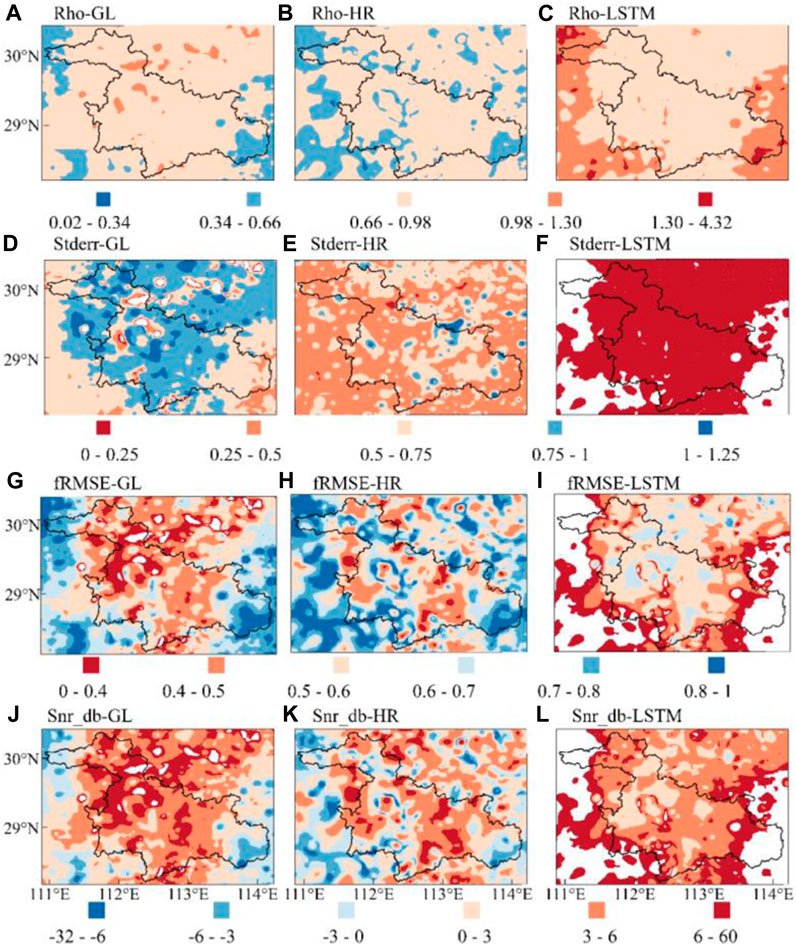
FIGURE 5. The TCA error distribution map of TCA of GL-HR-LSTM fusion product (results are only shown for grids where all three datasets display a significant positive correlation and there are more than 100 data triplets). (A) Rho-GL (B) Rho-HR (C) Rho-LSTM (D) Stderr-GL (E) Stderr-HR (F) Stderr-LSTM (G) fRMSE-GL (H) fRMSE-HR (I) fRMSE-LSTM (J) Snr_db-GL (K) Snr_db-HR (L) Snr_db-LSTM.
Stderr, fRMSE, and Snr_db of the fusion products in some terrestrial regions near the lake are blank. According to the calculation process of these parameters, this could be because the data is stable with small fluctuations, there is a low correlation between GL and HR products, or there is a high correlation between the data product and the other two, resulting in negative values of Errvara and Snra Eqs 22, 25. Also, due to the large Rho, fRMSE cannot be calculated Eq. 11, which could explain the product’s solid performance on land near the lake.
4 Discussion
As a fundamental meteorological element, the surface wind field significantly impacts meteorology, agriculture, fishery, shipping, construction, water conservancy, and other industries. Accurate wind field products are crucial. This study holistically analyzed the accuracy performance of three mainstream wind speed products in the Dongting Lake area, identified the best data fusion method, and generated an annual set of 1 km/1h resolution wind speed products for the Dongting Lake area, followed by inspection and evaluation. The study confirmed the varying strengths and weaknesses of the three mainstream wind speed products and also affirmed that a neural network model considering the time factor can better integrate the lake wind field. These research results can provide a reference for related research, but some issues remain open for further discussion.
Due to the scarcity of wind field data products in lake areas, there are only a few verification studies on them. Most of the existing studies are focused on land or sea surface wind fields. The performance of the three products obtained in the Dongting Lake area is largely consistent with related in situ measured scale research in this study. The error coefficient (Table 1) of EC products aligns with the research results of (Chen et al., 2017) in the (Kuang et al., 2015) in the Taiwan Strait, and Jiang et al. (2021) in the inland of Hainan Island. Few studies verify GL products, but the literature also reports results of similar accuracy (Wang and Zeng, 2012) and a propensity to overestimate wind speed (Qi et al., 2015) with the mainstream wind speed products, consistent with this study. Based on in situ measurements and comparative studies involving CLDAS series products, such as CLDAS being superior to EC products in Sichuan Province (Li et al., 2020), and HRCLDAS performing better than EC products in Hainan Island (Jiang et al., 2021), the findings are also consistent with this study. HR demonstrates a notable advantage in the in situ measured scale verification research, which may be due to the product’s significant advantage of abundant site-measured data resources in China. However, it displays a distinct disadvantage in subsequent accuracy verification involving the area scale (Figure 4), suggesting a need for future improvements in HR products.
Grid-scale wind field product verification research combining EC, GL, and HR grid products has not been found, so a comparison with related research is not feasible. However, the results of this paper suggest that EC and GL are close to and significantly better than HR at the grid scale. It seems that the performance of reanalysis products integrated with model data is significantly superior to that of assimilation data products at the grid scale. This study conducted TCAs for both groups of data and assessed product quality. GL and HR products are involved in two TCAs, but the error parameter values are not entirely consistent (Figures 4, 5). As TCA primarily relies on mathematical principles such as covariance, although there is a clear and rigorous technical basis, the results are relative values closely associated with the three matching original products and cannot provide absolute analysis results.
In the data fusion research, we used four methods for comparison, but there are many other data fusion methods. Future research might discover better fusion methods for obtaining superior lake wind field fusion products. However, as it currently stands, the LSTM fusion model that can capture the characteristics of data time series can yield considerably better wind field products, suggesting that the wind field products themselves have time-correlated features, which has also been confirmed in related research (Huang et al., 2019; Zhang, 2020). The fusion effect of the optimal model surpasses that of the maximum likelihood estimation algorithm and the space-time weighting algorithm in the sea surface wind field (Zhang, 2018). It also outperforms the fusion effects of various interpolation methods in the offshore wind field of China (Xu et al., 2016). Therefore, it can be considered an effective wind field fusion method. By examining the spatial distribution of error parameters in the in situ measured data obtained from stations that were not part of the model construction (comprising 552 stations), it is evident that the merged products in the study area can accurately capture the station-level wind (Figure 6). However, the scatter color distribution in the figure also shows that the ability of the fusion product to capture the land wind field near the lake area is stronger than that in the middle of the lake area, and the correlation coefficient is higher in the land area. The distribution of Biasr shows that most of the middle of the lake area performs well, probably due to the fact that the wind speed in the middle of the lake area is high, and the wind speed in the land area, especially in the southern mountainous area, is generally low. Smaller data deviations can easily show a relatively large difference. The distribution of RMSE and ubRMSE suggests that the overall deviation of the product is small and the land area around the lake area is slightly better. These results align with the TCA (Figure 5).
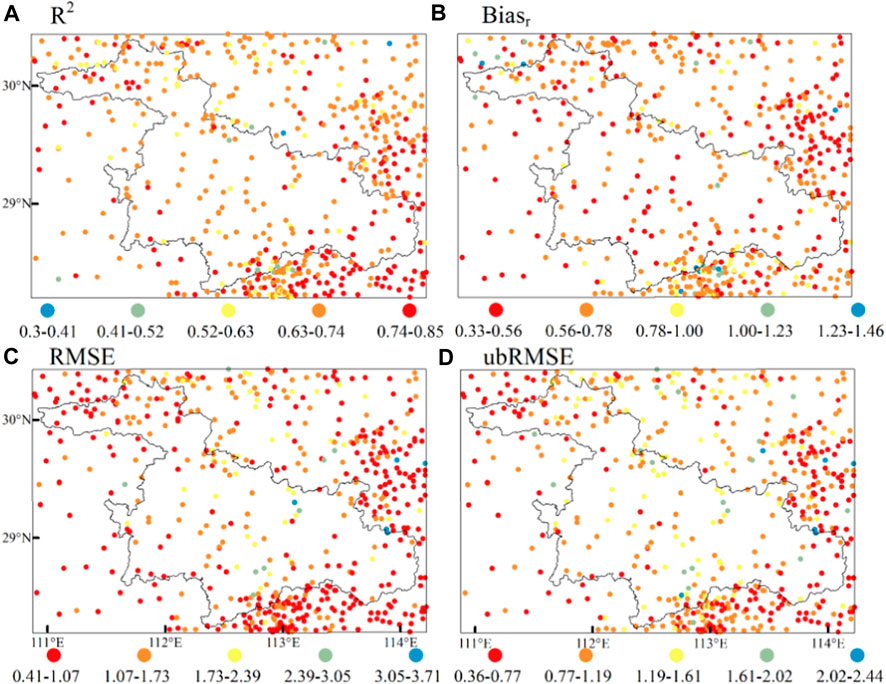
FIGURE 6. Error coefficients of the LSTM fusion product with the in situ measured data in 552 stations. (A) R2 (B) Biasr (C) RMSE (D) ubRMSE.
In summary, LSTM fusion products can incorporate the advantages of each product and perform better than EC, GL, and TCA, MFCNN fusion products at the in situ measured scale, except for HR (which incorporates observed data from most stations in the lake area). At the grid scale, it is stronger than all three mainstream products involved in the study. This confirms the benefits of the fusion model and also verifies that the data fusion method can significantly improve the accuracy of wind speed products in the lake area, offering a reference for related research. With the future application and continuous improvement of this product in meteorological operations, it can enhance the refinement of meteorological services such as water transportation, fisheries, wind energy resource development, and tourism in the lake area.
5 Conclusion
In this study, we conducted verification and fusion research on three mainstream wind field products in the unique Dongting Lake area, successfully developing a set of optimally fused wind field products. The main conclusions drawn from the research are summarized as follows:
• Validation results, based on in situ measured data from the Dongting Lake area, revealed distinct characteristics for each of the three mainstream grid wind speed products. GL products demonstrate the most significant ability to capture surface wind speed changes at the in situ measured scale (r = 0.694). EC products exhibit a small absolute deviation with few outliers (RMSE = 1.502 m/s, ubRMSE = 1.211 m/s). HR products maintain a minor overall deviation (Bias = −0.155 m/s, Biasr = 0.462).
• The TCA confirmed that among the three mainstream grid wind speed products, GL products display absolute advantages at the grid scale (average Rho = 0.933, Stderr = 0.44, fRMSE = 0.345, Snr_db = 9.157), excelling in terms of correlation, error, and signal-to-noise ratio. However, HR products lag significantly behind the other two products in this regard (average Rho = 0.622, Stderr = 0.585, fRMSE = 0.756, Snr_db = −1.957).
• In comparison to independent products, TCA-based weight fusion products, and MFCNN fusion products, the LSTM data fusion method with time-series features proves to be superior when merging wind speed products in the Dongting Lake area. The fusion products demonstrate enhanced performance both at the in situ measured scale (except HR products) and the grid scale (average r = 0.674, Bias = −0.460 m/s, ubRMSE = 1.108 m/s; Rho = 0.936, Stderr = 0.1, fRMSE = 0.469, Snr_db = 5.931).
Data availability statement
The original contributions presented in the study are included in the article/Supplementary material, further inquiries can be directed to the corresponding authors.
Author contributions
S-QT: Conceptualization, Validation, Visualization, Writing–original draft. H-FG: Writing–original draft, Writing–review and editing. C-HL: Formal Analysis, Funding acquisition, Supervision, Writing–original draft. J-HM: Investigation, Project administration, Resources, Writing–original draft. W-ZT: Data curation, Methodology, Writing–original draft. W-YP: Investigation, Project administration, Writing–original draft. J-ZF: Methodology, Validation, Writing–original draft.
Funding
The author(s) declare financial support was received for the research, authorship, and/or publication of this article. This work was supported by the Hunan Meteorological Bureau 2022 Research Business Forecast Project (XQKJ22C010); the Hunan Provincial Natural Science Foundation of China (2021JC0009), and Hunan Meteorological Bureau 2024 Key Project (CXFZ2024-ZDZX07).
Acknowledgments
We sincerely acknowledge the Copernicus climate data store for providing ERA5-L and reanalysis data, and the NASA Goddard earth sciences data and information services center for providing GLDAS assimilation data. We also thank Hunan Meteorological Big Data Center for providing HRCLDAS and observation data, and Yueyang Meteorological Administration for providing the in situ measured wind speed data.
Conflict of interest
The authors declare that the research was conducted in the absence of any commercial or financial relationships that could be construed as a potential conflict of interest.
Publisher’s note
All claims expressed in this article are solely those of the authors and do not necessarily represent those of their affiliated organizations, or those of the publisher, the editors and the reviewers. Any product that may be evaluated in this article, or claim that may be made by its manufacturer, is not guaranteed or endorsed by the publisher.
Abbreviations
EC, ERA5-Land; GL, GLDAS (Global Land Data Assimilation Systems); HR, High-Resolution China Meteorological Administration Land Data Assimilation System; LSTM, long short-term memory; MFCNN, multi-layer fully connected neural network; TCA, triple collocation analysis.
References
Abiodun, O. I., Jantan, A., Omolara, A. E., Dada, K. V., Mohamed, N. A., and Arshad, H. (2018). State-of-the-art in artificial neural network applications: a survey. Heliyon 4 (11), e00938. doi:10.1016/j.heliyon.2018.e00938
Brinckmann, S., Krähenmann, S., and Bissolli, P. (2016). High-resolution daily gridded data sets of air temperature and wind speed for Europe. Earth Syst. Sci. Data 8 (2), 491–516. doi:10.5194/essd-8-491-2016
Chen, Y., Wang, N., Gu, W., Tang, Z., Liu, H., Meng, X., et al. (2017). Comparative analysis of wind velocity of reanalysis datasets over the Bohai Rim Region. J. Mar. meteorology 37 (01), 67–72. doi:10.19513/j.cnki.issn2096-3599.2017.01.007
Desai, A. R., Austin, J. A., Bennington, V., and McKinley, G. A. (2009). Stronger winds over a large lake in response to weakening air-to-lake temperature gradient. Nat. Geosci. 2 (12), 855–858. doi:10.1038/ngeo693
Dias Neto, J., Nuijens, L., Unal, C., and Knoop, S. (2023). Combined wind lidar and cloud radar for high-resolution wind profiling. Earth Syst. Sci. Data 15 (2), 769–789. doi:10.5194/essd-15-769-2023
Doubrawa, P., Barthelmie, R. J., Pryor, S. C., Hasager, C. B., Badger, M., and Karagali, I. (2015). Satellite winds as a tool for offshore wind resource assessment: the Great Lakes Wind Atlas. Remote Sens. Environ. 168, 349–359. doi:10.1016/j.rse.2015.07.008
Downing, J. A., Prairie, Y. T., Cole, J. J., Duarte, C. M., Tranvik, L. J., Striegl, R. G., et al. (2006). The global abundance and size distribution of lakes, ponds, and impoundments. Limnol. Oceanogr. 51 (5), 2388–2397. doi:10.4319/lo.2006.51.5.2388
Elyouncha, A., Eriksson, L. E. B., Broström, G., Axell, L., and Ulander, L. H. M. (2021). Joint retrieval of ocean surface wind and current vectors from satellite SAR data using a Bayesian inversion method. Remote Sens. Environ. 260, 112455. doi:10.1016/j.rse.2021.112455
Fan, J., Luo, M., Han, Q., Liu, F., Huang, W., and Tan, S. (2022). Evaluation of SMOS, SMAP, AMSR2 and FY-3C soil moisture products over China. Plos one 17 (4), e0266091. doi:10.1371/journal.pone.0266091
Fan, J., Tan, S., Luo, Y., Zhuang, X., Zhou, W., and Luo, M. (2021). Application of long/short term memory neural network in soil moisture multi-time dynamic prediction. Soils 53 (1), 209–216. doi:10.13758/j.cnki.tr.2021.01.028
Gers, F. A., Schmidhuber, J., and Cummins, F. (2000). Learning to forget: continual prediction with LSTM. Neural Comput. 12 (10), 2451–2471. doi:10.1162/089976600300015015
Gimeno, L., Vázquez, M., Eiras-Barca, J., Sorí, R., Stojanovic, M., Algarra, I., et al. (2020). Recent progress on the sources of continental precipitation as revealed by moisture transport analysis. Earth-Science Rev. 201, 103070. doi:10.1016/j.earscirev.2019.103070
Gruber, A., Dorigo, W. A., Crow, W., and Wagner, W. (2017). Triple collocation-based merging of satellite soil moisture retrievals. IEEE Trans. Geoscience Remote Sens. 55 (12), 6780–6792. doi:10.1109/TGRS.2017.2734070
Han, S., Shi, C., Jiang, Z., Xu, B., Li, X., Zhang, T., et al. (2018). Development and progress of high resolution CMA land surface data assimilation system. Adv. meteorological Sci. Technol. 8 (01), 102–108+116.
Han, S., Shi, C., Xu, B., Sun, S., Zhang, T., Jiang, L., et al. (2019). Development and evaluation of hourly and kilometer resolution retrospective and real-time surface meteorological blended forcing dataset (SMBFD) in China. J. Meteorological Res. 33 (6), 1168–1181. doi:10.1007/s13351-019-9042-9
Hersbach, H., Bell, B., Berrisford, P., Hirahara, S., Horányi, A., Muñoz-Sabater, J., et al. (2017). Complete ERA5 from 1940: fifth generation of ECMWF atmospheric reanalyses of the global climate. Copernic. Clim. Change Serv. (C3S) Data Store (CDS).
Hochreiter, S., and Schmidhuber, J. (1997). Long short-term memory. Neural Comput. 9 (8), 1735–1780. doi:10.1162/neco.1997.9.8.1735
Huang, Z., Ding, Q., and Li, C. (2019). Nonlinear short-term prediction of wind speed time series. J. Eng. Therm. energy power 34 (09), 199–206. doi:10.16146/j.cnki.rndlgc.2019.09.023
Jiang, Y., Han, S., Shi, C., Gao, T., Zhen, H., and Liu, X. (2021). Evaluation of HRCLDAS and ERA5 datasets for near-surface wind over hainan island and south China sea. Atmosphere 12 (6), 766. doi:10.3390/atmos12060766
Kosiba, K., Wurman, J., Richardson, Y., Markowski, P., Robinson, P., and Marquis, J. (2013). Genesis of the goshen county, Wyoming, tornado on 5 June 2009 during VORTEX2. Mon. Weather Rev. 141 (4), 1157–1181. doi:10.1175/mwr-d-12-00056.1
Kuang, F., Zhang, Y., Zhang, J., and Jia, C. (2015). Comparison and evaluation of three see surface wind products in Taiwan Strait. Acta Oceanol. sin. 37 (05), 44–53. doi:10.3969/j.issn.0253-4193.2015.05.005
Li, C., Yang, H., Yang, W., Liu, Z., Jia, Y., Li, S., et al. (2022a). Error characterization of global land evapotranspiration products: collocation-based approach. J. Hydrology 612, 128102. doi:10.1016/j.jhydrol.2022.128102
Li, C., Yang, H., Yang, W., Liu, Z., Yao, J., Li, S., et al. (2022b). CAMELE: collocation-analyzed multi-source ensembled land evapotranspiration data.
Li, L., Losser, T., Yorke, C., and Piltner, R. (2014). Fast inverse distance weighting-based spatiotemporal interpolation: a web-based application of interpolating daily fine particulate matter PM2.5 in the contiguous U.S. Using parallel programming and k-d tree. Int. J. Environ. Res. Public Health 11 (9), 9101–9141. doi:10.3390/ijerph110909101
Li, S., Wu, W., and Huang, X. (2020). Wind speed evaluation of CLDAS and ERA5-land in sichuan. Plateau Mt. Meteorology Res. 40 (04), 70–76. doi:10.3969/j.issn.1674-2184.2020.04.012
Long, Z., Perrie, W., Gyakum, J., Caya, D., and Laprise, R. (2007). Northern Lake impacts on local seasonal climate. J. Hydrometeorol. 8 (4), 881–896. doi:10.1175/jhm591.1
Lucio-Eceiza, E. E., González-Rouco, J. F., Navarro, J., and Beltrami, H. (2018). Quality control of surface wind observations in northeastern north America. Part I: data management issues. J. Atmos. Ocean. Technol. 35 (1), 163–182. doi:10.1175/jtech-d-16-0204.1
Ma, Y., Hu, Z., Xie, Z., Ma, W., Wang, B., Chen, X., et al. (2020). A long-term (2005–2016) dataset of hourly integrated land–atmosphere interaction observations on the Tibetan Plateau. Earth Syst. Sci. Data 12 (4), 2937–2957. doi:10.5194/essd-12-2937-2020
Ma, Y., Mao, R., Yang, Y., Ma, L., and Gou, S. (2023). Evaluation of the ERA5 reanalysis data on the near-surface wind speed climate characteristics and change trend reproduction ability in gansu province. Plateau meteorol., 1–11. doi:10.7522/j.issn.1000-0534.2022.00030
Muñoz Sabater, J. (2019). ERA5-Land hourly data from 1950 to present. Copernic. Clim. Change Serv. (C3S) Clim. Data Store (CDS).
Nezhad, M. M., Heydari, A., Groppi, D., Cumo, F., and Garcia, D. A. (2020). Wind source potential assessment using Sentinel 1 satellite and a new forecasting model based on machine learning: a case study Sardinia islands. Renew. Energy 155, 212–224. doi:10.1016/j.renene.2020.03.148
Nezhad, M. M., Neshat, M., Piras, G., and Garcia, D. A. (2022). Sites exploring prioritisation of offshore wind energy potential and mapping for wind farms installation: Iranian islands case studies. Renew. Sustain. Energy Rev. 168, 112791. doi:10.1016/j.rser.2022.112791
Qi, W., Zhang, C., Fu, G., and Zhou, H. (2015). Global Land Data Assimilation System data assessment using a distributed biosphere hydrological model. J. Hydrology 528, 652–667. doi:10.1016/j.jhydrol.2015.07.011
Rashinkar, P., and Krushnasamy, V. (2017). “An overview of data fusion techniques,” in Proceedings of the 2017 International Conference on Innovative Mechanisms for Industry Applications (ICIMIA), Bengaluru, India, February 2017 (IEEE), 694–697.
Ren, L., Ji, J., Lu, Z., and Wang, K. (2022). Spatiotemporal characteristics and abrupt changes of wind speeds in the Guangdong–Hong Kong–Macau Greater Bay Area. Energy Rep. 8, 3465–3482. doi:10.1016/j.egyr.2022.02.224
Rodell, M., Houser, P. R., Jambor, U., Gottschalck, J., Mitchell, K., Meng, C. J., et al. (2004). The global land data assimilation system. Bull. Am. Meteorological Soc. 85 (3), 381–394. doi:10.1175/bams-85-3-381
Sharma, S. K., Aryal, J., and Rajabifard, A. (2022). Remote sensing and meteorological data fusion in predicting bushfire severity: a case study from victoria, Australia. Remote Sens. [Online] 14 (7), 1645. doi:10.3390/rs14071645
Shi, C., Pan, Y., Gu, J., Xu, B., Han, S., Zhu, Z., et al. (2019). A review of multi-source meteorological data fusion products. Acta Meteorol. Sin. 77 (04), 774–783. doi:10.11676/qxxb2019.043
Stoffelen, A. (1998). Toward the true near-surface wind speed: error modeling and calibration using triple collocation. J. Geophys. Res. 103, 7755–7766. doi:10.1029/97jc03180
Van Vledder, G. P., and Akpınar, A. (2015). Wave model predictions in the Black Sea: sensitivity to wind fields. Appl. Ocean Res. 53, 161–178. doi:10.1016/j.apor.2015.08.006
Wang, A., and Zeng, X. (2012). Evaluation of multireanalysis products with in situ observations over the Tibetan Plateau. J. Geophys. Res. Atmos. 117 (D5). doi:10.1029/2011JD016553
Xu, X., Gao, J., Zhang, K., Huang, J., and Wang, X. (2016). Fusion method of China’s offshore wind field based on multi-source data. J. Hangzhou normal Univ. Nat. Sci. Ed. 15 (03), 325–330. doi:10.3969/j.issn.1674-232X.2016.03.019
Yin, L., Tao, F., Chen, Y., Liu, F., and Hu, J. (2021). Improving terrestrial evapotranspiration estimation across China during 2000–2018 with machine learning methods. J. Hydrology 600, 126538. doi:10.1016/j.jhydrol.2021.126538
Yoo, B. H., Kim, J., Lee, B.-W., Hoogenboom, G., and Kim, K. S. (2020). A surrogate weighted mean ensemble method to reduce the uncertainty at a regional scale for the calculation of potential evapotranspiration. Sci. Rep. 10 (1), 870. doi:10.1038/s41598-020-57466-0
Yu, H., Liang, Z., and Yan, Y. (2020). Review on multi-source and multi-modal data fusion and integration. Inf. Stud. theory and Appl. 43 (11), 169–178. doi:10.16353/j.cnki.1000-7490.2020.11.027
Yu, J., Zhou, T., Jiang, Z., and Zou, L. (2019). Evaluation of near-surface wind speed changes during 1979 to 2011 over China based on five reanalysis datasets. Atmosphere 10 (12), 804. doi:10.3390/atmos10120804
Zhang, D. (2018). Research of Multi-source satellite sea surface wind validation and data fusion. Changsha, China: National university of defense technology.
Zhang, D. (2020). Prediction of wind speed time series based on LSTM and ARIMA. Lanzhou, China: Lanzhou university.
Zhang, K., Xiang, J., Yang, B., and Zhou, C. (2017). Validation of ASCAT satellite scatterometer winds based on ERA-interim and monthly mean wind filed over the South China Sea. Ocean. forecast 34 (02), 27–36.
Zhang, X., Hu, J., Zhou, P., and Wang, G. (2022). “An improved multi-source spatiotemporal data fusion model based on the nearest neighbor grids for PM2 5 concentration interpolation and prediction,” in Proceeding of the Data Mining and Big Data: 7th International Conference, DMBD 2022, Beijing, China, November 2022 (Proceedings, Part I: Springer), 273–287.
Zhou, F., Jin, L., and Dong, J. (2017). Review of convolutional neural network research. Chin. J. Comput. 40 (6), 1229–1251. doi:10.11897/SP.J.1016.2017.01229
Keywords: wind speed grid product, authenticity test, data fusion, triple collocation analysis, neural network model
Citation: Tan S-Q, Guo H-F, Liao C-H, Ma J-H, Tan W-Z, Peng W-Y and Fan J-Z (2024) Collocation-analyzed multi-source ensembled wind speed data in lake district: a case study in Dongting Lake of China. Front. Environ. Sci. 11:1287595. doi: 10.3389/fenvs.2023.1287595
Received: 02 September 2023; Accepted: 14 December 2023;
Published: 31 January 2024.
Edited by:
Charles Jones, University of California, Santa Barbara, United StatesReviewed by:
Changjiang Xiao, Tongji University, ChinaGert-Jan Duine, University of California, Santa Barbara, United States
Copyright © 2024 Tan, Guo, Liao, Ma, Tan, Peng and Fan. This is an open-access article distributed under the terms of the Creative Commons Attribution License (CC BY). The use, distribution or reproduction in other forums is permitted, provided the original author(s) and the copyright owner(s) are credited and that the original publication in this journal is cited, in accordance with accepted academic practice. No use, distribution or reproduction is permitted which does not comply with these terms.
*Correspondence: Hai-Feng Guo, ghf0510@outlook.com; Jia-Zhi Fan, fjz92419@hotmail.com