Data driven assessment of rock mass quality in red-bed hilly area: a case study of Guang’an city, SW China
 Fang Zhou
 Hong Liang1*
 - 1Department of Geological Information, Chengdu Center, China Geological Survey (Geosciences Innovation Center of Southwest China), Chengdu, China
- 2Department of Fundamental Geological, China Aero Geophysical Survey and Remote Sensing Center for Nature Resources, Beijing, China
- 3Department of Geological Information, Application Center of Geological Survey, Chengdu, China
The evaluation of geological suitability for urban underground space (UUS) development is an indispensable prerequisite for its optimal utilization. As the actual carrier of underground facilities, the evaluation of rock mass quality plays a crucial role in assessing geological suitability. However, it is notable that the evaluation of rock mass quality has regrettably remained somewhat marginalized within the broader framework of the geological suitability assessment in recent years. The selection of pertinent indicators for the evaluation of rock mass quality inherently presents an appreciable degree of subjectivity. Predominantly subjective evaluation methods continue to dominate the field, while the application of objective algorithms, such as unsupervised clustering, remains in its nascent stage. Furthermore, there is a lack of comprehensive investigations into distinct combinations of attributes. This limitation confines the broader applicability of the evaluation outcomes in the context of urban underground space. Within this study, we meticulously amassed rock core test data from over 40 boreholes of engineering geological significance within the urban planning ambit of Guang'An City. Utilizing the K-means unsupervised clustering algorithm and the Principal Component Analysis (PCA) algorithm. We successfully conducted an unsupervised clustering procedure with nine distinct physical and mechanical attributes. This yielded an aggregation into five discernible clusters. Building upon the derived clustering outcomes, a stratification of rock mass quality was effectuated into three distinct tiers: Level 1 (characterized by pure sandstone), Level 2 (primarily dominated by sandstone), and Level 3 (denoting fair conditions predominantly influenced by mudstone). This structured stratification facilitates a relatively objective and comprehensive evaluation of rock mass quality within the context of the red-bed hilly terrain. In the course of this analytical trajectory, we conducted a dissection of the clustering efficacy. For strongly correlated attributes, we propose a preliminary dimensionality reduction procedure prior to the clustering endeavor. Moreover, we recommend intervals of 10 m for the stratified evaluation in red bed hilly urban terrains.
1 Introduction
Since the commencement of the 21st century, concomitant with the swift proliferation of the Chinese economy, a substantial surge in population influx has gravitated toward urban locales, thereby engendering an accentuated escalation in the urbanization quotient. In order to address the issues arising from the population-density imbalance, alleviate the problems associated with large cities, and achieve sustainable future development, the concept of “subterranean development” has emerged as an important direction and trend in the development of large to mega-cities worldwide (Pan and Jin, 2006; Peng and Peng, 2012; Qu et al., 2015; Qian, 2019; Lapenna and Chambers, 2020; Zhang et al., 2021b; Ge et al., 2021).
Urban Underground Space (UUS) represents an idiosyncratic spatial reservoir subject to profound transformation throughout its developmental trajectory. In contrast to surface domains, the ramifications of UUS advancement, epitomized by entities like subway systems, inherently harbor precise and exclusive functionalities. Once deployed, such infrastructures stand impervious to facile dismantlement or modification. Therefore, prior to the development and utilization of UUS, a thorough assessment of the geological suitability of the underground conditions is essential (Andriamamonjisoa and Hubert, 2019; Hu et al., 2019; Zhu et al., 2020; Tao et al., 2021). Furthermore, the underground geological conditions, represented by the subsurface rock and soil formations, play a crucial role as the actual carriers of underground facilities. They have a significant influence on the development of Urban Underground Space (UUS) (Peng et al., 2019; Zhu et al., 2021; Tang et al., 2022). Hence, the appraisal of rock mass quality assumes an eminent stance within the overarching framework of a comprehensive UUS evaluative paradigm.
The evaluation of rock mass quality, akin to the assessment of Urban Underground Space (UUS), encompasses two primary dimensions: the selection of evaluation attributes/indicators and the discernment of suitable mathematical models. Previous studies have shown that rock mass quality is primarily influenced by lithological composition, physical properties, and mechanical attributes (El et al., 2010; Zhou et al., 2019). Therefore, in the evaluation process, it is common to consider attributes such as bearing capacity, lithology, or selected mechanical experimental properties as evaluation criteria (Zhang et al., 2020; Wu et al., 2021; Tong et al., 2022; Wang et al., 2022; Li et al., 2023; Zhao et al., 2023). Nonetheless, it is noteworthy that existing scholarship alludes to the absence of a standardized corpus of criteria governing attribute selection, and the imperative of the chosen attributes has not been comprehensively interrogated within this context (Tan et al., 2021). Hence, it is imperative to investigate the interrelationships among evaluation indicators to choose an appropriate type and quantity of indicators for the evaluation endeavors.
In the evaluation of rock and soil quality, an array of semi-quantitative mathematical models frequently finds application, encompassing methodologies such as the Analytic Hierarchy Process (AHP) and the Most Unfavorable Grade Method (MUGM) (Xiong et al., 2006; Wang, 2013; Yuan, 2020; Li et al., 2021; Tian et al., 2021), Fuzzy Comprehensive Evaluation (Zhou B. et al., 2022; Zhao et al., 2022) and combination of the above method (Wu, 2021; Tong et al., 2022). Although these methodologies incorporate expert knowledge, their outcomes are conspicuously shaped by subjective elements, consequently engendering challenges in terms of result reproducibility. On the contrary, unsupervised clustering algorithms, characterized by a diminished susceptibility to subjective influences, have the capacity to yield relatively objective evaluation outcomes. Wang et al. (2022) and Li (2020) employ Fuzzy C-mean clustering algorithm to evaluate geological suitability; Du et al. (2022) adopted spectral clustering in Jiaozhou Bay stability evaluation. These studies have pioneered the application of clustering methods in the suitability assessment of subterranean spaces. However, extant scholarship reveals a paucity of research delving into comparative analyses of clustering outcomes across distinct attributes. Moreover, the formulation of definitive guidelines for the curation of evaluation criteria remains an unexplored terrain within this domain.
This study incorporates classical unsupervised learning (K-means) and dimensionality reduction algorithms (PCA) into the assessment of rock-soil mass quality in Guang’an City. Through clustering physical and mechanical attributes from over 40 boreholes of engineering geological, it evaluates the effectiveness of various attribute combinations. Additionally, a detailed analysis of the clustering results is performed. Providing a foundation for the future utilization of underground spaces in the red-bed hilly areas and offering insights into the transition from empirical and expert-driven suitability assessments to data-driven methodologies. In a broader spectrum, this inquiry furnishes illuminating insights germane to the structuring of a comprehensive evaluation indicator framework, extending its relevance to the expanse of diverse urban subterranean locales.
2 Geological setting
The study area is situated at the confluence of Chongqing municipality and Sichuan province in the southwestern region of China (Figure 1) (Zhang et al., 2021a). It serves as a pioneering demonstration zone for the advancement of China’s western regions and the establishment of the Chengdu-Chongqing economic sphere. A further facet of its distinctiveness lies in its characteristic as a prolific milieu characterized by the pervasive juxtaposition of red sandstone-mudstone amalgams. The study area encapsulates a dyadic delineation of natural terrains, delineated as the Sichuan red bed hilly belt and the lower elevation sector of the Huaying Mountain terrain. It is noteworthy that these domains are situated within the precincts of the Upper Yangtze platform, concurrently aligning with the Central Sichuan depression, as delineated in the scholarly oeuvre authored by Wei et al. (2017).
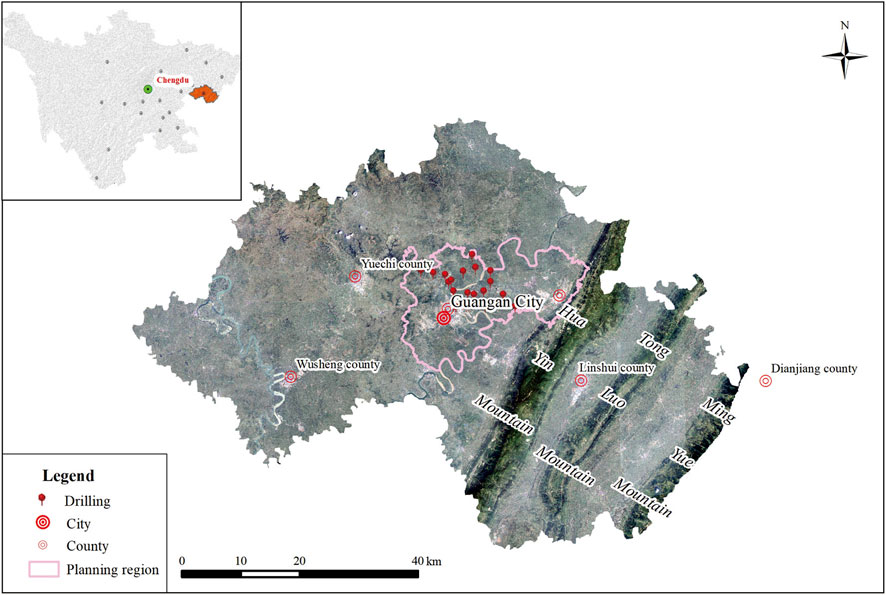
Figure 1. Location of study area and distribution of wells.
The region exhibits a prevalence of tectonically inactive fractures, with seismic activity of relatively low magnitude primarily observed in the eastern sector (Zhou et al., 2022; Zhou et al., 2023). Within Guang'An, a total of eight distinct geological strata can be identified, namely the Cambrian, Ordovician, Silurian, Carboniferous, Permian, Triassic, Jurassic, and Quaternary. The initial six strata are predominantly present in the mountainous terrain, while the remaining exposed strata in the red soil hilly area exhibit gentle dip angles ranging from 1 to 5°. The Jurassic Shaximiao Formation (J2s), which is extensively distributed with a thickness of 400–500 m, displays varying degrees of weathering, ranging from moderate to severe (Zhou et al., 2022). Moreover, approximately 80% of the entire outcrop consists of interlayered and lenticular sand and mudstone (Figure 2).
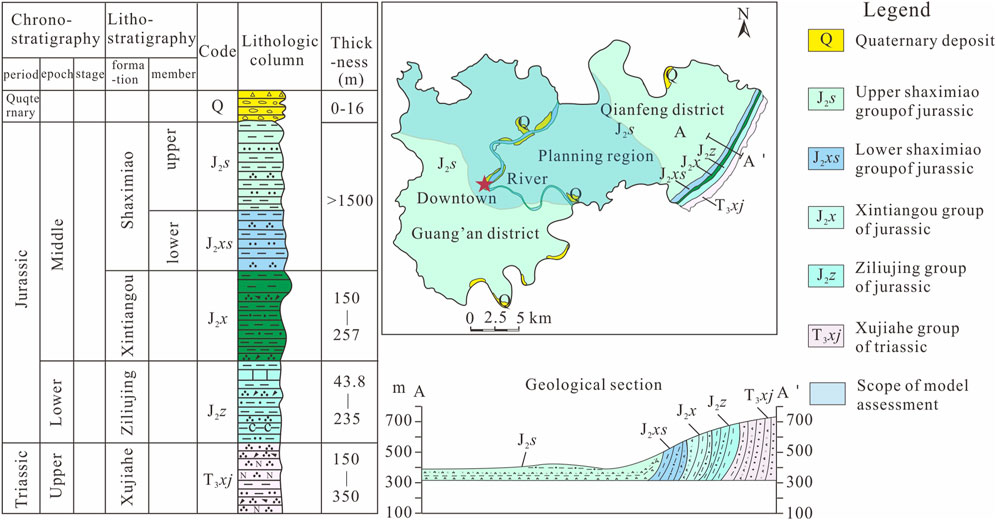
Figure 2. Simplify geological map of study area [modified after (Zhou et al., 2022)].
3 Methodology
3.1 Theory review of k-means
K-means, a prominent exemplar within the spectrum of unsupervised machine learning algorithms, traces its origins to an incipient proposition by Stuart (1982), wherein its conceptualization was envisioned as a mechanism to effectuate signal quantization within the realm of telecommunications. It is of pertinence to highlight that its subsequent rediscovery and consequential propagation within the scientific milieu can be attributed to E. W. Forgy, who independently rekindled the algorithm’s conceptual essence in the year 1965.
The fundamental tenet underpinning the K-means algorithm entails the partitioning of a bestowed dataset into a set of K clusters, with K signifying a predetermined numeric value. This partitioning is actualized through the imperative of minimizing the cumulative sum of squared distances, spanning the interrelation between individual data points and their corresponding cluster centroids. The algorithm embarks upon an iterative expedition, which commences with the assignment of each data point to its nearest centroid, subsequently culminating in the recalibration of these centroids, predicated on the arithmetic mean encapsulated within the assortment of data points ascribed to each specific centroid. This iterative voyage persists until such time that the centroids evince nominal displacement, indicative of a state of relative stasis, or alternately, upon the exhaustion of a predetermined threshold pertaining to the maximum number of iterative cycles. Concretely, the algorithm adheres to the following sequential series of steps:
1. Initially, assign the data center vector with an appropriate value based on the data characteristics (assuming an initial setting of K = 3, representing three distinct types) (Eq. 1). In the case of non-numeric data within the dataset, utilize the one-hot encoding technique to initialize the category indicator variable R, ensuring that all data instances are categorized as type 1 (Eq. 2).
Where K is the number of quasi-clustering clusters of the dataset,
2. Update data cluster type R in dataset according to the nearest square Euclidean distance between
Where
3. Update
4. Repeat steps 2 and 3 until the values of R and
5. Calculate the loss function J for evaluating the clustering results using the provided loss measure illustrated in Figure 3 (Eq. 6). This involves computing the sum of the squared Euclidean distances between each data point and its corresponding cluster center
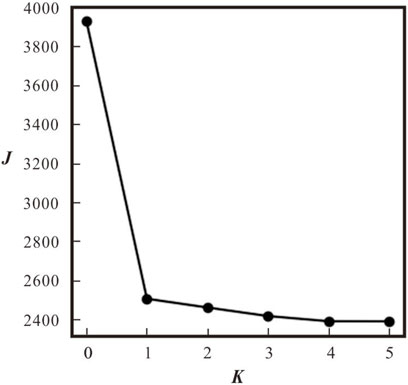
Figure 3. Demonstration of loss function (J) calculation results (also known as elbow chart).
3.2 Description of cluster dataset
The dataset emanates from engineering geological drilling endeavors undertaken within the chronological span of 2019–2021, encapsulated within the tapestry of the urban planning expanse. A cumulative tally of 29 boreholes stands completed, although their distribution within the study area is characterized by an asymmetric dispersion, prominently accentuated by a concentration bias towards the western terrain, with a meager representation on the eastern facet. The altitudinal and profundity metrics span the spectrum from 409 to 236 m and 120.4 to 50 m, correspondingly. The boreholes were meticulously executed in a vertical trajectory, thereby accommodating comprehensive coring along the entire well section. Notably, the coring extents oscillate within the bounds of 0.3–0.7 m, as delineated in Figure 4. Every distinct section within this vertical continuum manifests as a distinctive datum within the comprehensive dataset. Predicated upon the coring findings in tandem with the geological contextual milieu, the lithological spectrum was systematically categorized into five distinct strata, namely clay, sandstone, mudstone, shaly sandstone, and sandy mudstone. The suite of mechanical experiments concomitant with the coring processes were seamlessly orchestrated by two duly accredited entities, situated within Sichuan and Chongqing correspondingly. Notably, the ambit of mechanical experimentation encompassed tensile strength and shear strength assessments, undertook by the southern construction engineering testing corporation in Chongqing, while the remaining array of attribute experiments were adroitly executed under the aegis of the geological engineering exploration institute corporation in Sichuan. Pertinently, in instances where particular attribute assessments were repeated on a single coring specimen, an average value was judiciously computed to bestow attribute modeling consistency. The comprehensive dataset amalgamates an aggregate of 442 data points, each imbued with an assortment of 9 distinct attributes. The summative statistical portrait of this clustered dataset is comprehensively documented within Table 1.
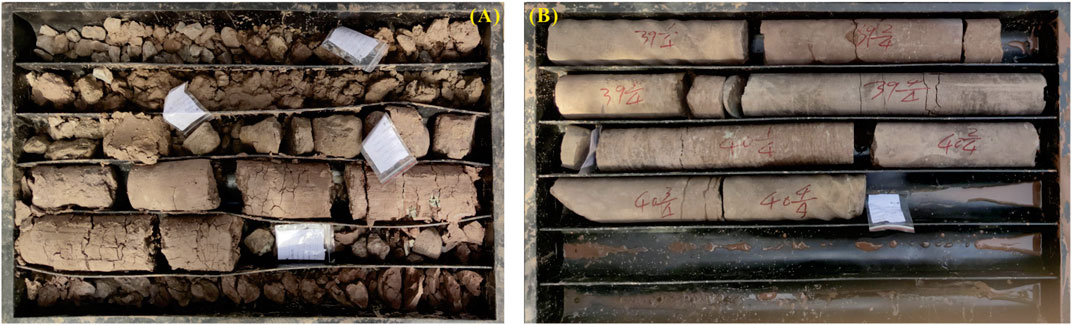
Figure 4. Coring samples in the study area (A): upper section, (B) bottom section).
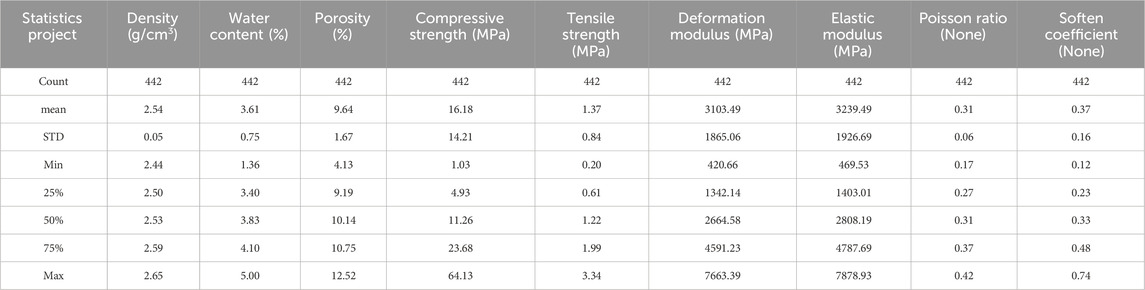
Table 1. Statistics summary of the cluster dataset.
3.3 K-means cluster
3.3.1 Dataset scaling
As delineated in Tables 1, 2, the nine attributes exhibit conspicuous disparities in scales or magnitudes. This discrepancy can potentially hinder the performance of machine learning algorithms. To address this issue, two distinct feature scaling methodologies emerge as viable remedies: min-max scaling and standard scaling. Min-max scaling transforms the values to a range of 0–1 in the scaled dataset. In contrast, standard scaling does not rescale the values to a specific range like min-max scaling but is less susceptible to the influence of outliers or anomalous data. This characteristic is particularly advantageous when working with large datasets. Therefore, for this study, we have selected the standard scaling method to rescale the datasets (Formula 7).
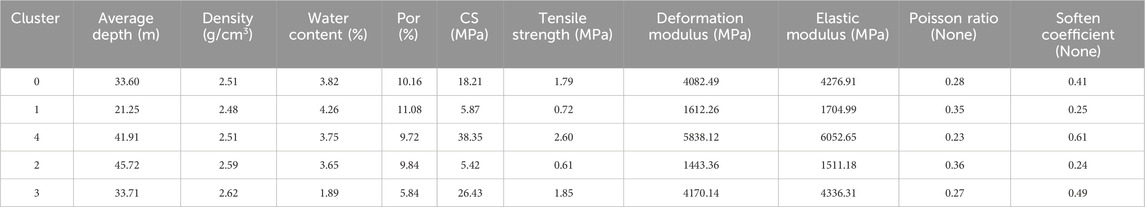
Table 2. The average sector of each cluster.
Where X_scale signifies the scaled dataset, X corresponds to the original dataset,
3.3.2 Methods for determining the optimal value of K
The K-means algorithm mandates the a priori definition of K for clustering. This value bears substantial significance, exerting considerable impact on the resultant clusters. The discernment of an apt K value assumes paramount importance, given its pivotal role in shaping the ensuing cluster architecture. A misjudged selection of K can culminate in suboptimal clustering outcomes, thereby failing to effectively discern the sought-after cluster delineation. Consequently, the judicious determination of the optimal K value emerges as a pivotal factor in the pursuit of attaining robust clustering results.
For datasets encompassing merely two or three attributes, the determination of the suitable K value, or rather the cluster count, can be gleaned through discerning visual insights from intuitive plots. However, when the attribute count surpasses four, a mathematical methodology assumes precedence in the quest for selecting the appropriate K value. In this context, the inertia (sum squared errors, SSE, formula 8) and silhouette coefficient stand as prominent mathematical instruments employed in the quest to ascertain the optimal K. The inertia, meticulously formulated by Eq. (8), emerges as a statistical metric affording quantification to the extent of variability or dispersion inherently housed within a dataset. It embodies the sum of squared discrepancies between each data point and the mean manifestation of the dataset. In the evaluation of clustering efficacy, should the ascertained K value fall short of the optimal K, an augmentation of K will be mirrored by a pronounced elevation in inter-class aggregation, thereby engendering a commensurate diminution in the inertia value. Once the K value aligns with the optimal quotient, the inertia value stabilizes, exhibiting insubstantial oscillation upon further K escalation. It follows, therefore, that the trajectory of the inertia value plot typically conforms to an “elbow” configuration, and the value at the juncture of this bend is conventionally regarded as the optimal K.
However, it should be noted that the inertia method entails a rather coarse estimation for determining the optimal K value. An alternative avenue encompasses the computation of the silhouette coefficient (SC, Eq. 9) across diverse K values. The silhouette coefficient delineates the degree of similitude between a data object and its affiliated cluster as juxtaposed against alternative clusters. Its quantitative manifestation embodies the amalgamation of clustering compactness and inter-cluster separation. This metric, residing within a range spanning from +1 to −1, holds profound explanatory power. A SC value of +1 attests to the coherence of a data point with its corresponding cluster while also highlighting its incongruity with adjacent clusters. In contradistinction, a SC value of 0 bespeaks the proximate alignment of data points with the inter-cluster boundaries. Conversely, a SC value of −1 conveys the misclassification of a data point within an erroneous cluster context.
Where s(i) represents the value of the i-th data point, a(i) denotes the average dissimilarity value between i and all data points within its own cluster, b(i) signifies the average dissimilarity value between i and all data points within the nearest neighboring cluster, and max (a(i), b(i)) conveys the pinnacle of dissimilarity observed between i and any other data point.
To ensure the judicious choice of a clustering outcome, we will employ both the inertia and silhouette coefficient methods. This dual approach seeks to procure a reinforced validation of the optimal K value, thus augmenting the thoroughness of our clustering analysis while elevating its overall reliability.
The dataset underwent clustering using the Python programming language, facilitated by the Scikit-Learn library within the Spyder coding platform. The initialization of dataset centroids was accomplished through the k-means++ algorithm, introduced by David and Sergei (2007). The clustering procedure retained the default parameter settings for all other aspects of the process.
3.4 Principle component analysis (PCA)
Principal Component Analysis (PCA) stands as a widely embraced statistical technique catering to dimensionality reduction and data exploration purposes. It functions as a means to transmute high-dimensional datasets into lower-dimensional renditions, all the while preserving fundamental information. PCA achieves this through the identification of principal components, which are linear amalgamations of the original variables. The fundamental underpinning of PCA lies in discerning the directions, known as principal components, along which data showcases its most pronounced variability. The customary steps associated with PCA encompass the following: ①Computation of the covariance matrix; ②Computation of eigenvectors and eigenvalues; ③Selection of principal components; ④Data projection. For a more comprehensive exposition, the exhaustive inquiry undertaken by Shlens (2014) is recommended as a reference.
4 Results and discussion
4.1 Feature selection
Considering the intrinsic characteristics of the experimental data attributes, a bifurcation into two principal categories is discerned: physical properties and mechanical properties. The former encapsulates density, porosity, and water content, while the latter encompasses compressive strength, tensile strength, deformation modulus, elastic modulus, Poisson’s ratio, and softening coefficient. The selection of features for subsequent clustering endeavors is fundamentally anchored in the computation of correlation coefficients between these distinctive attributes (Figures 5, 6).
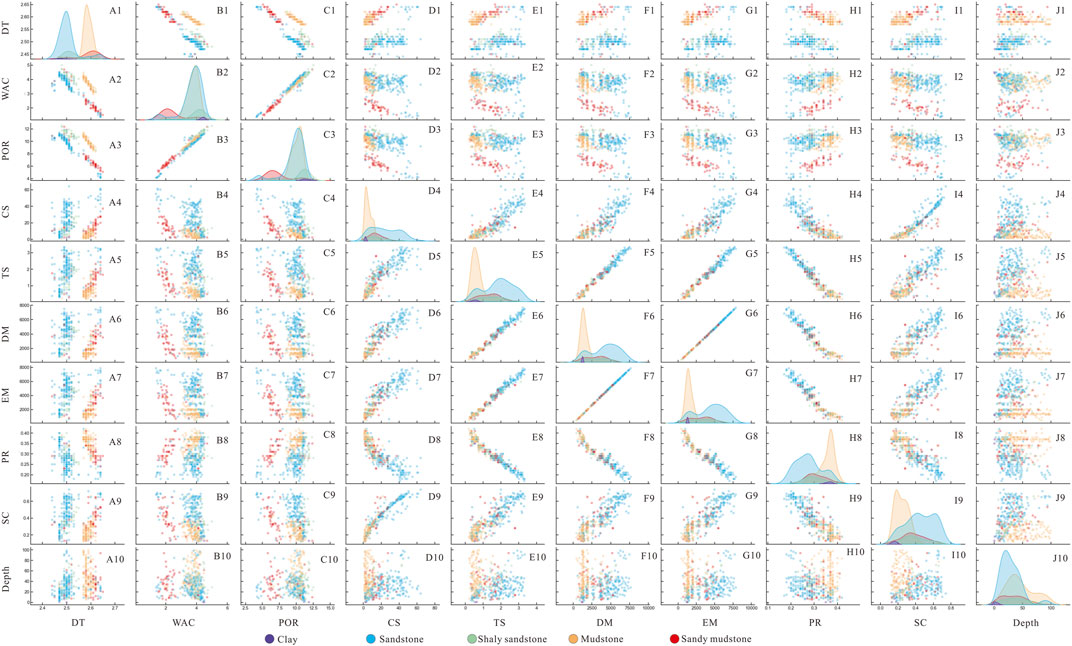
Figure 5. The scatter matrix of the 9 attributes. DT-density; WAC-water content; POR-porosity; CS-compressive strength; TS-tensile strength; DM-deformation modulus; EM-elastic modulus; PR-poisson ratio; SC- soften coefficient; Lithos-lithology.
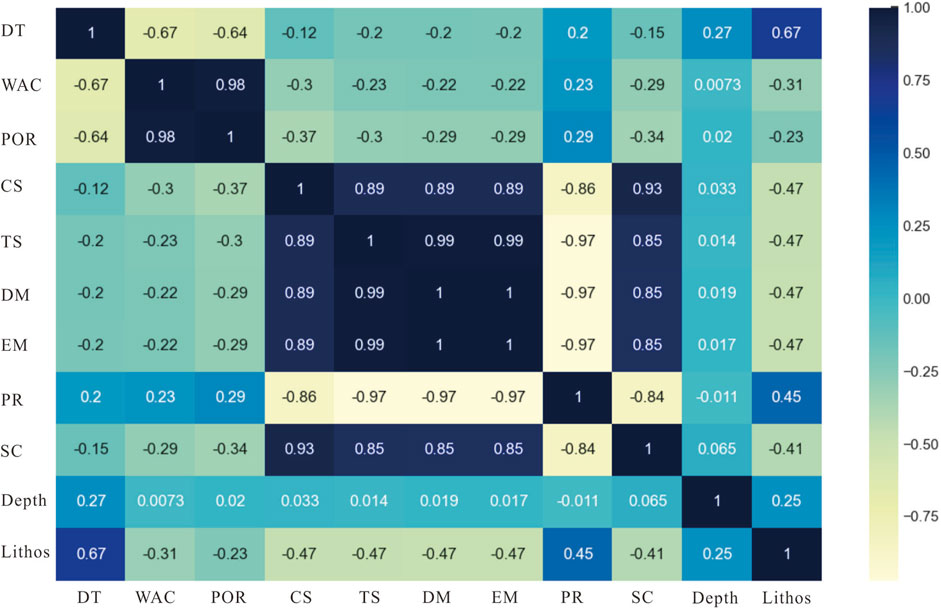
Figure 6. Correlation coefficients values of the nine attributes.
On the whole, individual mechanical and physical properties manifest a planar distribution concerning depth. The correlation coefficient values span from −0.37 to −0.12 and from 0.2 to 0.29, indicating a lack of pronounced correlation yet revealing distinct zonations. Among these attributes, density can be dichotomized into two classes based on a threshold of 2.55 g/cm3 (refer to Figure 5). The left side is predominantly characterized by sandstone and shaly sandstone, while the right side is predominantly occupied by mudstone and sandy mudstone. This suggests that despite their lithological similarities, these formations exhibit marked divergences in their physical attributes. The categorization of water content, porosity, and mechanical parameters proves to be relatively intricate. Noteworthy is the significant differentiation observed within the mudstone category, particularly between mudstone and sandy mudstone. Additionally, several outliers are evident within the sandstone category, resulting in a classification that intersects between 3 and 4 categories.
Substantial positive or negative correlations are discernible among the mechanical attributes, with correlation coefficient values spanning from −0.86 to −0.97 and 0.86 to 0.99. The demarcation between sandstone and mudstone is distinguishable, although it lacks precise definition (refer to Figure 5). In broad terms, the categorization can be roughly delineated into three classes: ①predominantly consisting of mudstone; ②displaying a mixed composition of shaly sandstone and sandy mudstone; ③primarily composed of sandstone.
The correlation coefficients among the physical parameters manifest noteworthy disparities. The correlation coefficients between density-porosity and density-water content are relatively alike, spanning from −0.64 to −0.67, whereas the correlation coefficient between porosity and water content approaches 1. The correlation coefficient plot within the realm of physical properties exhibits a relatively well-defined boundary, signifying substantial stratification. It can be broadly categorized into 3–4 classes (refer to Figure 5).
In the realm of supervised learning, it is typically advantageous to opt for parameters that demonstrate a strong correlation with the target data, especially for predictive tasks (Yu and Liu, 2003). Conversely, within the domain of unsupervised clustering learning, employing attributes with high correlations for clustering can substantially elevate the influence of correlated features and obscure inherent clusters, particularly in the presence of noisy data (Parsons et al., 2004).
To validate these concepts, we conducted unsupervised clustering using six mechanical attributes. To compare the clustering results of strongly correlated attributes across different values of K (ranging from 2 to 15), we generated an elbow plot and computed the silhouette coefficient values. The clustering results are depicted in Figure 7. Initially, as K increases, the inertia values exhibit a relatively smooth and insignificant variation, lacking a distinct inflection point. This observation suggests that there may not be a definitive optimal value of K. However, the silhouette coefficient consistently decreases as K increases, indicating that with the expansion of K, the boundaries between different clusters tend to blur, resulting in a gradual decline in clustering performance. Consequently, the optimal value of K likely falls within the range of 2–4.
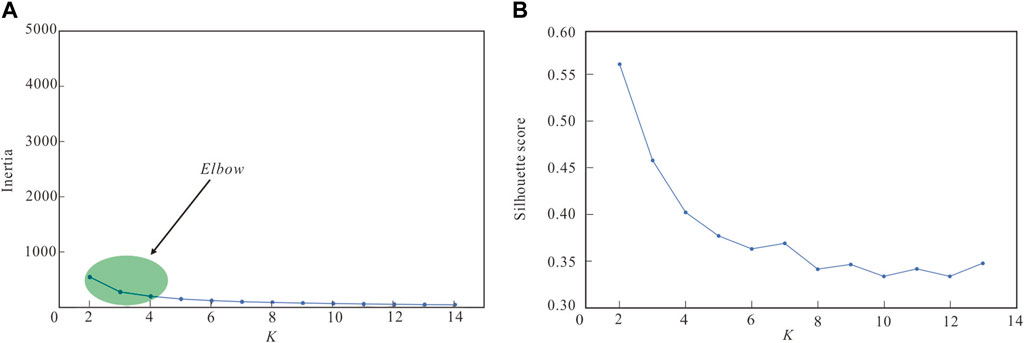
Figure 7. Elbow (A) and silhouette coefficient (B) plots.
Therefore, we generated parallel coordinate clustering plots for K = 2, 3, and 4 to visually elucidate the actual clustering results (Figure 8). The observations drawn from these plots indicate that, as K increases, the clusters tend to retain approximate parallelism. Specifically, the softening coefficient, which exhibits the lowest correlation coefficient with other mechanical attributes, demonstrates noticeable intersections when K = 4. In contrast, the remaining attributes do not manifest distinct intersections as K increases. This discovery suggests that the choice of K has minimal impact on the clustering results for strongly correlated attributes, posing a challenge in ascertaining an optimal K value. Consequently, it is recommended to consider data merging or dimensionality reduction for strongly correlated attributes before embarking on clustering, as this approach effectively mitigates computational complexity and conserves processing time.
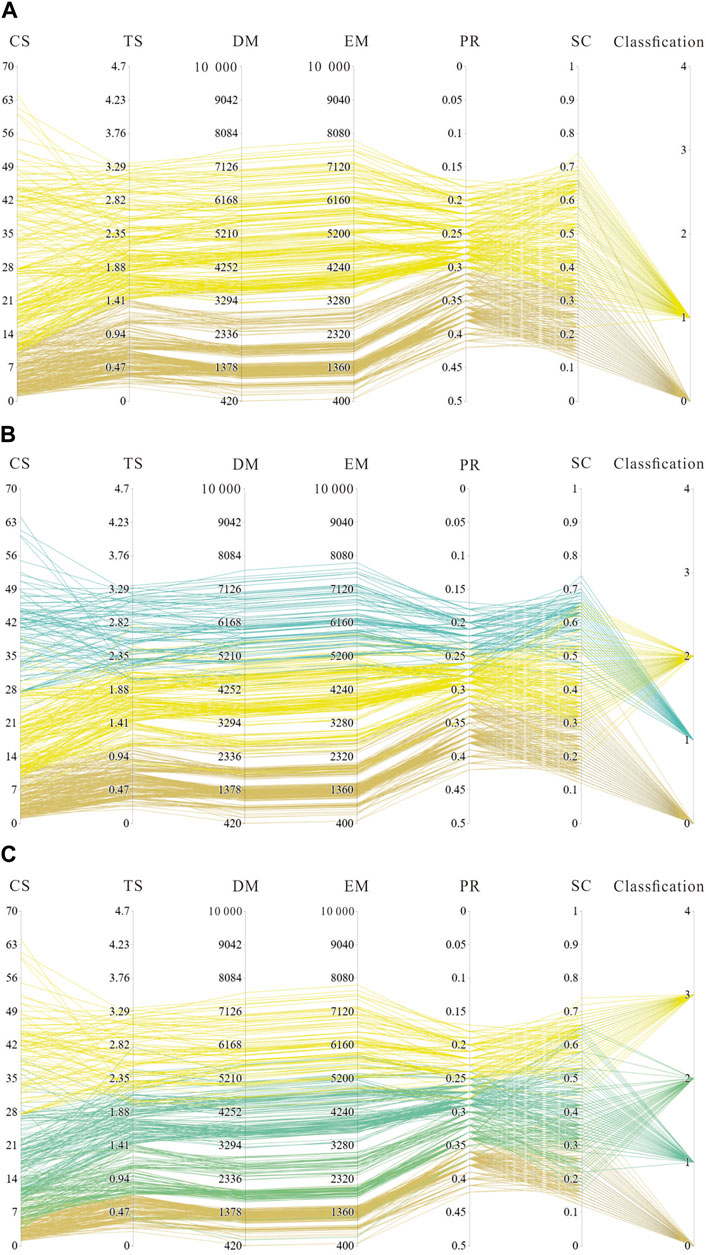
Figure 8. Different K (A): K = 2, (B) K = 3, (C) K = 4) values for parallel parameters.
In light of these findings, this study incorporates PCA (Principal Component Analysis) as a dimensionality reduction technique to amalgamate porosity and water content into a singular attribute, while condensing the six mechanical parameters into two attributes. Following this transformation, a new dataset is created, and subspace clustering is subsequently conducted upon it.
4.2 Optimal K
The new dataset is also assessed using inertia and silhouette coefficient plots to ascertain the optimal K value. In the elbow plot, the inertia values span from 300 to 2000, with the point of inflection occurring between 4 and 7, signifying that the optimal K value falls within the range of 4–7 (Figure 9). The silhouette coefficient plot suggests that the ideal range for the optimal K value is between 3 and 7 (Figure 10). Upon closer inspection of the silhouette coefficient plot, when K is set to 6 or 7, clusters with silhouette coefficients near the red line (the average value) indicate blurred boundaries between different clusters. However, when K is set to 4 or 5, the silhouette coefficients for the clusters significantly surpass the average value, indicating strong clustering performance. All things considered, in light of similar conditions, the silhouette coefficient for K = 5 outperforms that for K = 4. Consequently, K = 5 is chosen as the optimal number of clusters for this clustering analysis. This result slightly deviates from the suggestion of 2–4 clusters in the correlation coefficient plot, underscoring that the optimal number of clusters in multi-attribute clustering, as determined through data analysis, may exhibit slight variations from the outcomes depicted in intuitive charts and graphs.
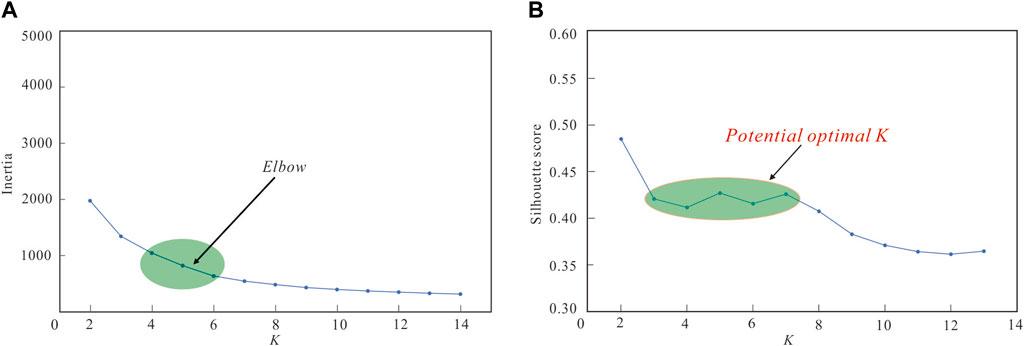
Figure 9. Elbow (A) and silhouette coefficient (B) plots.
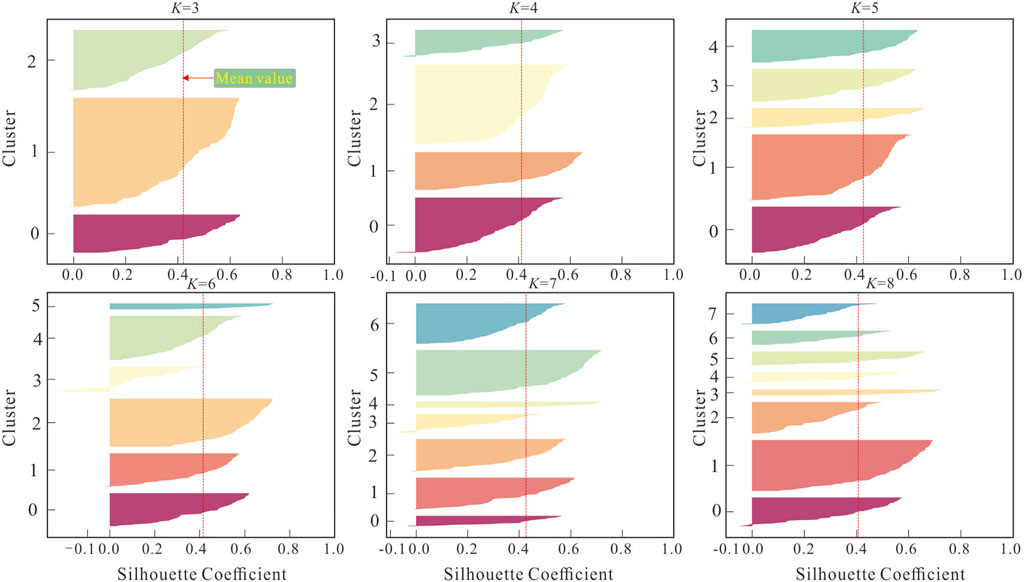
Figure 10. Silhouette coefficient plots.
4.3 Cluster results
From the clustering outcomes (Figures 11, 12), each cluster demonstrates a predominant rock type, constituting more than 50% of the total data points. Specifically, Cluster 0 (comprising 102 data points), Cluster 1 (consisting of 70 data points), and Cluster 4 (encompassing 72 data points) predominantly consist of sandstone, with no substantial disparities in their overall quantities. In Cluster 4, sandstone constitutes over 93% of the data points, while the remaining 7% are also primarily sandstone. Clusters 0 and 1 both exhibit a composition of over 80% sandstone and shaly sandstone data points, suggesting significant variations in the properties and attributes of sandstone. On the other hand, Cluster 2 (comprising 148 data points) and Cluster 3 (comprising 50 data points) are predominantly composed of mudstone. Cluster 2, in particular, contains over 88% mudstone data points, representing over 95% of the total mudstone category. In Cluster 3, silty mudstone accounts for over 60% of the data points. However, in terms of quantity, Cluster 3 is considerably smaller than Cluster 2, implying that mudstone may not exhibit as substantial variations in properties as sandstone.
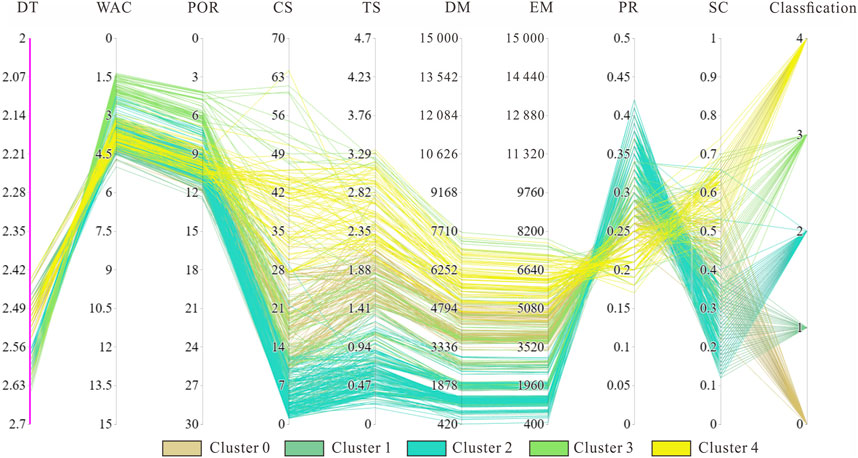
Figure 11. Parallel coordinate plot of cluster results, including all attributes (before PCA).
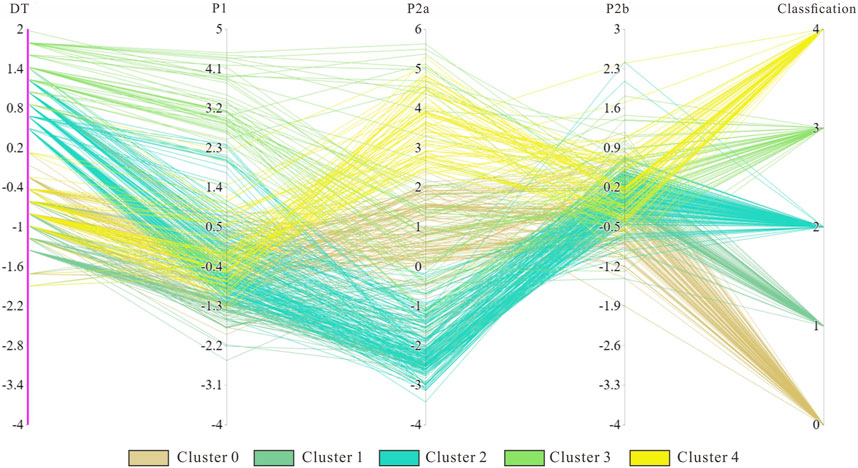
Figure 12. Parallel coordinate plot of cluster results (dataset after PCA).
Through the computation of mean vectors for the identified clusters (Clusters 0, 1, and 4), it becomes evident that there is no significant disparity in rock density among them. Nevertheless, both porosity and water content exhibit a discernible trend with depth. Porosity gradually decreases from shallow to deep, following the order of Cluster 1 (11.08%, 21.25 m) < Cluster 0 (10.16%, 33.6 m) < Cluster 4 (9.27%, 41.91 m). Similarly, water content also decreases in the same sequence: Cluster 1 (11.08%) < Cluster 0 (10.16%) < Cluster 4 (9.72%). In parallel, physical parameters (e.g., CS) increase following this order: Cluster 1 (5.87 MPa) < Cluster 0 (18.21 MPa) < Cluster 4 (38.35 MPa).
Based on these observations, we deduce that the primary factor contributing to the differentiation in sandstone properties is the compaction effect. This effect results in reduced porosity, increased rock densification, and consequent alterations in their mechanical parameters. Furthermore, this discovery indirectly validates that clustering algorithms can effectively perform the role of conventional stratigraphic evaluation by identifying property variations within the same rock type at different depths.
On the other hand, there exists a depth discrepancy of 12.1 m and 8.3 m between Clusters 0, 1, and 4, with an average interval of 10.2 m (Table 2). Based on this observation, for urban areas situated in the red bed hilly region, when employing a traditional stratigraphic assessment of rock mass quality, we recommend utilizing a depth interval of 10 m for stratification. Clusters 2 and 3 also exhibit depth-related trends; however, owing to a substantial shift in their predominant lithology, transitioning from fine-grained sandy mudstone to mudstone, they are not directly comparable.
4.4 Assessment of rock mass
Based on the average vectors of the five clustering results, excluding cluster 3, there is minimal disparity in the physical parameters among the various lithological clusters. Consequently, this study primarily stratifies the rock mass based on the mechanical properties derived from the clustering outcomes. Cluster 4, characterized by pure sandstone, manifests the highest compressive strength, tensile strength, and deformation modulus, positioning it as the category with relatively superior rock mass quality within the study area. Clusters 1 and 2, possessing comparable overall physical and mechanical parameters but the lowest compressive strength, are categorized as having relatively inferior quality within the study area. Clusters 0 and 3, due to significant lithological distinctions leading to substantial variations in physical parameters, exhibit minor deviations in the mean values of the mechanical parameters, and are classified as intermediate categories in terms of rock mass quality. Consequently, grounded in the clustering results, the rock mass quality in the study area is stratified into three levels: cluster 4 (optimal, grade 1) → clusters 0 and 3 (relatively good, grade 2) → clusters 1 and 2 (ordinary, grade 3).
Furthermore, cluster 1 is predominantly characterized by sandstone, whereas cluster 2 is primarily composed of mudstone. Despite substantial distinctions in lithology and depth between these two clusters, their values for the nine attributes exhibit relatively minor fluctuations. This implies that in the red bed hilly region, there might not be a substantial correlation between rock mass quality and either depth or lithology. This suggests that the conventional stratified approach may not be imperative for rock mass quality assessment in this context.
Based on the clustering outcomes, we constructed a three-dimensional geological model of the study area for in-depth exploration. Utilizing indicator kriging interpolation, we obtained a grade distribution model for the rock mass quality assessment of the study area (Figure 13). However, due to data concentration in the central region, the kriging interpolation results were limited to this area, leaving peripheral zones with sparse interpolated data. The model indicates that Grade 1 represents 6.4%, Grade 2 comprises 50.8%, and Grade 3 constitutes 42.8% of the total. Grade 1 displays a scattered distribution, primarily concentrated in the northern part of the study area, while Grade 2 and 3 exhibit an interactive distribution covering a significant portion of the area. In summary, the rock mass quality across the entire study area generally falls within the relatively good to ordinary range. Considering other assessment factors, this dataset serves as essential reference information for the comprehensive evaluation of underground space suitability in this region.
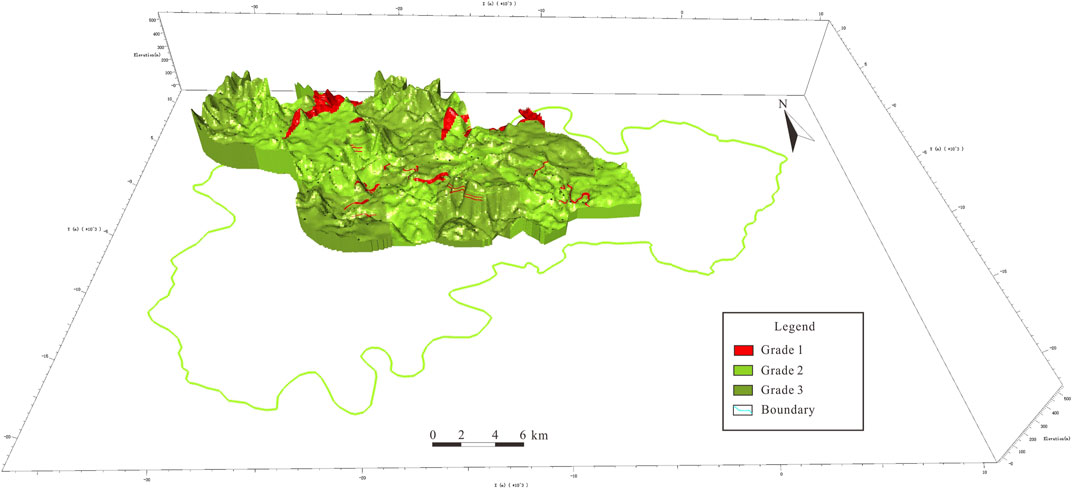
Figure 13. 3D model of assessment results using kriging interpolation.
5 Conclusion
The current investigation applied an unsupervised clustering algorithm, K-means, coupled with PCA dimensionality reduction, to appraise the geotechnical quality of a representative urban zone within the red-bed hilly region. This strategy proficiently alleviated the impact of subjective variables on the evaluation outcomes, consequently attaining a heightened level of objectivity in the assessment. The particular conclusions are delineated as follows:
1. The engineering geological drilling core test data from Guang’an City were categorized into five clusters, and the geotechnical quality was stratified into three levels. Cluster 4 signifies the highest quality (Level 1), primarily consisting of pure sandstone, while clusters 0 and 3 denote a relatively favorable quality (Level 2) characterized by the prevalence of sandstone. Conversely, clusters 1 and 2 signify the lowest quality (Level 3), predominantly comprised of mudstone. The classification order is as follows: Cluster 4 (optimal, grade 1) → Clusters 0 and 3 (relatively good, grade 2) → Clusters 1 and 2 (ordinary, grade 3). And the entire study area generally falls within the relatively good to ordinary range.
2. The clustering results suggest that there is relatively minor variation in the physical properties among distinct clusters, whereas there is substantial variation in the mechanical properties. Consequently, it is advisable to consider compressive strength and the softening coefficient as representative physical properties indicators for assessing rock mass quality.
3. Within the red-bed hilly regions, there appears to be no notable correlation between rock mass quality and depth. Therefore, it is recommended to evaluate the underground space rock mass as a unified entity. Nonetheless, for those employing the classical stratified evaluation method, a stratification interval of 10 m is suggested.
Data availability statement
The data that support the conclusion of this study are available from corresponding author upon reasonable request. Due to privacy concerns, certain restrictions may apply to the availability of these data.
Author contributions
FZ: Conceptualization, Writing–original draft. HL: Formal Analysis, Methodology, Writing–review and editing. TL: Data curation, Writing–review and editing. ML: Data curation, Writing–review and editing. JZ: Supervision, Writing–review and editing. BW: Investigation, Writing–review and editing. MH: Writing–review and editing.
Funding
The author(s) declare financial support was received for the research, authorship, and/or publication of this article. This work was financially supported by the China Geological Survey projects “Shale gas investigation and evaluation in key basins” (DD20221661); “China-ASEAN geo-information big data platform construction” (DD20230577).
Acknowledgments
We gratefully acknowledge architecture archives of Guang’an city for providing the resources and support. And we also would like to express our gratitude for contents revised suggestions from reviews and editor.
Conflict of interest
The authors declare that the research was conducted in the absence of any commercial or financial relationships that could be construed as a potential conflict of interest.
Publisher’s note
All claims expressed in this article are solely those of the authors and do not necessarily represent those of their affiliated organizations, or those of the publisher, the editors and the reviewers. Any product that may be evaluated in this article, or claim that may be made by its manufacturer, is not guaranteed or endorsed by the publisher.
References
Andriamamonjisoa, S. N., and Hubert, F. A. (2019). Combining geology, geomorphology and geotechnical data for a safer urban extension: application to the antananarivo capital city (Madagascar). J Afr. Earth Sci. 151, 417–437. doi:10.1016/j.jafrearsci.2018.12.003
David, A., and Sergei, V. (2007). K-means++: the advantages of careful seeding. in Proc of the 18th annu ACM-SIAM symp on discrete algorithms, 1027–1035.
Du, X., Sun, Y. F., Dong, J., Wang, Q., Song, Y. P., Su, Z. M., et al. (2022). Assessment and subdivision of environmental suitability for submarine engineering in the jiaozhou bay by unsupervised machine learning. Oceanol. limnologia sinica 53 (4), 972–980. doi:10.11693/hyhz20210900206
El, M. M., Dlala, M., and Chenini, I. (2010). Urban geological mapping: geotechnical data analysis for rational development planning. Eng. Geol. 116 (1-2), 129–138. doi:10.1016/j.enggeo.2010.08.002
Forgy, E. W. (1965). Cluster analysis of multivariate data: efficiency vs interpretability of classifications. Biometrics 21, 768–780.
Ge, W. Y., Wang, R., Zhang, Q., Xing, H. X., and Zhou, J. (2021). Conception of comprehensive utilization evaluation of urban underground space resources. Geol. Bull. China 40 (10), 1601–1608. doi:10.12097/j.issn.1671-2552.2021.10.001
Hu, Z. P., Peng, J. B., Zhang, F., Wang, R., and Chen, N. N. (2019). The critical issues and creative concepts in the development of urban underground space. Earth Sci. Front. 26 (3), 76–84. doi:10.13745/J.esf.2019.03.009
Lapenna, V., Chambers, J., Shi, B., Lienhart, W., and Zhu, H. H. (2020). Preface to the special issue on “Frontiers and applications of geological engineering and geophysical monitoring technologies in urban areas”. Eng. Geol. 268, 105508. doi:10.1016/j.enggeo.2020.105508
Li, P. Y., Han, H. D., Wang, D. H., and Wang, C. S. (2021). Current situation and development trends of suitability evaluation of urban underground space resources. Sediment Geol. Tethyan Geol. 41 (1), 121–128. doi:10.19826/j.cnki.1009-3850.2020.11004
Li, S., Hong, Z. L., Xue, X. P., Liu, X. F., and Shi, W. (2023). Comprehensive evaluation of the underground space resources in Xianyang city. Sci. Rep. 13, 17348. doi:10.1038/s41598-023-44657-8
Li, X. (2020). Evaluation of the suitability for urban underground space resources development using GIS. Dalian: Dalian University of Technology. [dissertation/master’s thesis].
Pan, M., and Jin, J. J. (2006). Urban geology and prospects of its development. Urban Geol. 1 (1), 5–9. doi:10.3969/j.issn.1007-1903.2006.01.003
Parsons, L., Haque, E., and Liu, H. (2004). Subspace clustering for high dimensional data: a review. ACM SIGKDD Explor Newsl. 6 (1), 90–105. doi:10.1145/1007730.1007731
Peng, F. L., Qiao, Y. K., Cheng, G. H., and Zhu, H. H. (2019). Current situation and exsiting problems of and coping strategies for urban underground space planning in China. Earth Sci. Front. 26 (3), 57–68. doi:10.13745/j.esf.sf.2019.5.23
Peng, J. W., and Peng, F. L. (2012). Utilization of deep underground space in Japan and its enlightenment for Chinese city. Chin J Undergr Sp Eng. 8 (S1), 1341–1343. doi:10.3969/j.issn.1673-0836.2012.z1.002
Qian, Q. H. (2019). Scientific use of the urban underground space to construction the harmonious livable and beautiful city. Hazard Control Tunn Undergr Eng 1 (1), 1–7.
Qu, H. G., Pan, M., Liu, X. Q., and Yu, C. L. (2015). Urban 3D geological modeling and its application to urbanization. Geol. Bull. China 34 (7), 1350–1358. doi:10.3969/j.issn.1671-2552.2015.07.013
Shlens, J. (2014). A tutorial on principal component analysis. San Diego La Jolla: University of California. http://www.snl.salk.edu/∼shlens/pca.pdf/ (Accessed April 3, 2014).
Stuart, P. L. (1982). Least squares quantization in PCM. IEEE Trans. Inf. Theory 28, 129–137. doi:10.1109/tit.1982.1056489
Tan, F., Wang, J., Jiao, Y. Y., and Ma, B. C. (2021). Current situation and development of urban underground space suitability evaluation. Earth Sci. 46 (5), 1896–1908. doi:10.3799/dqkx.2020.155
Tang, X., Gong, X. L., Xu, S. G., Zhang, Q. Q., Guo, H., and Deng, F. L. (2022). Development and utilization of urban underground space resources and geological survey countermeasures in southern Jiangsu metropolitan area. Geol. Rev. 68 (2), 593–605. doi:10.16509/j.georeview.2021.12.125
Tao, Z., Zhu, C., He, M. C., and Murat, K. (2021). A physical modeling-based study on the control mechanisms of Negative Poisson's ratio anchor cable on the stratified toppling deformation of anti-inclined slopes. Int. J. Rock Mech. Min. 138, 104632. doi:10.1016/j.ijrmms.2021.104632
Tian, C., Su, J. W., Ni, H. Y., and Wang, R. (2021). Progress and prospect of urban underground space resources evaluation. East China Geol. 42 (2), 147–156. doi:10.16788/j.hddz.32-1865/P.2021.02.003
Tong, D. F., Tan, F., Ma, B. C., Jiao, Y. Y., and Wang, J. (2022). A suitability evaluation method of urban underground space based on rough set theory and conditional entropy: a case study in wuhan changjiang new town. Appl. Sci. 12 (3), 1347. doi:10.3390/app12031347
Wang, B. (2013). Exploration and practice of the development and utilization of urban underground space. Beijing: China university of Geosciences.
Wang, M. L., Wang, H. X., Feng, Y., He, Y. Z., Han, Z., and Zhang, B. (2022). Investigating urban underground space suitability evaluation using fuzzy c-mean clustering algorithm-a case study of huancui district, Weihai city. Appl. Sci. 12 (23), 12113. doi:10.3390/app122312113
Wei, X. J., Fu, B., Deng, X. L., and Wang, Z. L. (2017). The risk evaluation on geological hazards assessment in Guang’an urban overall plan areas. J Changchun Inst Technol Nat Sci Ed. 18 (2), 110–116. doi:10.3969/j.issn.1009-8984.2017.02.026
Wu, X. Z. (2021). Study on assessment of urban underground space resources in Wuhu City. Chin J Undergr Sp Eng. 17 (1), 9–18.
Xiong, J. X., Ni, S. J., Zhang, C. J., Ding, J., and Wei, L. W. (2006). The design and implementation of the GIS software for risk assessment of urban geo-environments. Sediment Geol. Tethyan Geol. 26 (2), 106–109. doi:10.3969/j.issn.1009-3850.2006.02.021
Yu, L., and Liu, H. (2003). Feature selection for high-dimensional data: a fast correlation-based filter solution. Machine Learning. Proc Twent Int. Conf. 2, 856–863.
Yuan, X. R. (2020). Research on evaluation of geological environment suitability of urban underground Facilities. Beijing: Beijing University of Civil Engineering and Architecture.
Zhang, X. B., Wang, C. S., Fan, J., Wang, H. J., and Li, H. L. (2020). Optimizing the analytic hierarchy process through a suitability evaluation of underground space development in tonghu district, Huizhou city. Energies 13 (3), 742. doi:10.3390/en13030742
Zhang, Y. H., Dai, Y. S., Wang, Y., Huang, X., Xiao, Y., and Pei, Q. M. (2021a). Hydrochemistry, quality and potential health risk appraisal of nitrate enriched groundwater in the Nanchong area, Southwestern China. Sci. Total Environ. 784, 147186. doi:10.1016/J.Scitotenv.2021.147186
Zhang, Y. H., He, Z. H., Tian, H. H., Huang, X., Zhang, Z. X., Liu, Y., et al. (2021b). Hydrochemistry appraisal, quality assessment and health risk evaluation of shallow groundwater in the mianyang area of sichuan basin, Southwestern China. Environ. Earth Sci. 80 (17), 576–592. doi:10.1007/S12665-021-09894-Y
Zhao, S. C., Xu, B., Li, X. J., Zhang, W. B., and Liu, B. L. (2022). 3D evaluation of suitability of underground space development in core areas of mountainous cities. J Tongji Univ. Sci. 50 (1), 70–78. doi:10.11908/j.issn.0253-374x.20489
Zhao, Y. T., Liu, H. H., Qu, W. L., Luan, P. Y., and Sun, J. (2023). Research on geological safety evaluation index systems and methods for assessing underground space in coastal bedrock cities based on a back-propagation neural network comprehensive evaluation–analytic hierarchy process (BPCE-AHP). Sustainability 15 (10), 8055. doi:10.3390/su15108055
Zhou, B., Gui, Y. B., Xie, X. Y., Li, W. S., and Li, Q. (2022a). A measurable evaluation method of visual comfort in underground space by intelligent sorting and classification algorithms. Undergr. Sp. 7 (3), 453–464. doi:10.1016/j.undsp.2021.10.004
Zhou, D. K., Li, X. Z., Wang, Q., Wang, R., Wang, T. D., Gu, Q., et al. (2019). GIS-based urban underground space resources evaluation toward three-dimensional land planning: a case study in Nantong, China. Tunn Undergr Sp Technol 84, 1–10. doi:10.1016/j.tust.2018.10.017
Zhou, F., Li, M. H., Huang, C. J., Liang, H., Liu, Y. J., Zhang, J. L., et al. (2022b). Lithology-based 3d modeling of urban geological attributes and their engineering application: a case study of Guang’an city, SW China. Front. Earth Sci 10, 918285. doi:10.3389/feart.2022.918285
Zhou, F., Li, M. H., Huang, C. J., Liu, Y. J., Zhang, J. L., Wang, B. D., et al. (2023). Modeling of urban geological attributes based on conditional simulation: a case study of Guang'an City. Sediment Geol. Tethyan 43 (4), 844–855. doi:10.19826/j.cnki.1009-3850.2022.06002
Zhu, C., He, M. C., Murat, K., Cui, X. B., and Tao, Z. G. (2020). Investigating toppling failure mechanism of anti-dip layered slope due to excavation by physical modelling. Rock Mech. Rock Eng. 53 (11), 5029–5050. doi:10.1007/s00603-020-02207-y
Keywords: quality assessment of rock mass, K-means, urban underground space, red-bed hilly areas, objective assessment
Citation: Zhou F, Liang H, Lyu T, Li M, Zhang J, Wang B and Hao M (2024) Data driven assessment of rock mass quality in red-bed hilly area: a case study of Guang’an city, SW China. Front. Environ. Sci. 12:1335574. doi: 10.3389/fenvs.2024.1335574
Received: 09 November 2023; Accepted: 18 March 2024;
Published: 05 April 2024.
Edited by:
Yunhui Zhang, Southwest Jiaotong University, ChinaReviewed by:
Anoop Kumar Shukla, Manipal Academy of Higher Education, IndiaChun Zhu, Hohai University, China
Copyright © 2024 Zhou, Liang, Lyu, Li, Zhang, Wang and Hao. This is an open-access article distributed under the terms of the Creative Commons Attribution License (CC BY). The use, distribution or reproduction in other forums is permitted, provided the original author(s) and the copyright owner(s) are credited and that the original publication in this journal is cited, in accordance with accepted academic practice. No use, distribution or reproduction is permitted which does not comply with these terms.
*Correspondence: Hong Liang, lianghong@mail.cgs.gov.cn