Anthropogenic activities dominated the spatial and temporal changes of normalized difference vegetation index (NDVI) in the Hehuang valley in the northeastern Qinghai Province between 2000 and 2020
 Bin Xu
 Xufeng Mao
 Xingyue Li2
 - 1Key Laboratory of Physical Geography and Environmental Process of Qinghai Province, Key Laboratory of Surface Process and Ecological Conservation of Qinghai⁃Xizang Plateau, Xining, China
- 2School of Geography and Resource Science, Neijiang Normal University, Neijiang, China
- 3School of Economics and Management, Qinghai Normal University, Xining, China
- 4Qinghai Province Ecological and Environmental Monitoring Center, Xining, China
- 5Qilian Mountain National Park Qinghai Province Management Bureau, Xining, China
The Hehuang Valley (HV) is a key development area in the Qinghai Province; understanding changes in the vegetation within this area is of great significance if we are to maintain the ecological quality of this regional environment. Based on the 30 m spatial resolution Normalized difference vegetation index (NDVI) time series dataset, this paper analyzes the spatial and temporal characteristics and evolutionary trends of NDVI in the HV from 2001 to 2020 under the influences of climate change and human activities, by applying Mann-Kendall trend analysis, the Hurst index, and residual analysis. Analysis showed that firstly, high NDVI values (>0.5) were distributed in the low elevation areas of the HV except for towns and cropland, while the low NDVI values (<0.5) were mainly distributed in the high elevation regions; the NDVI exhibited an increasing trend over the study period. Second, human activities promoted NDVI growth in the HV by changing land-use types, although there is a risk of vegetation degradation in the future. Third, the proportion of NDVI changes affected by climate change and human activities was determined to be 87.24% of the HV; furthermore, the contribution of human activities was three-fold higher than that of climate change. Fourth, managers should scientifically manage grasslands and forests and implement specific anthropogenic interventions based on the characteristics of regional NDVI degradation, to improve ecosystem resilience. These results can be used to quantitatively analyze the relative contributions of natural and anthropogenic factors to the ecological changes in the HV, and provide reference guidelines for the management of ecological environments.
1 Introduction
Vegetation is an important component of surface ecosystems, playing a crucial role in the material cycle and energy exchange on the Earth’s surface, and is crucial for maintaining the balance of terrestrial ecosystems (Hu et al., 2021; Cai et al., 2022). The drivers of vegetation greening/browning can be categorized into either natural factors or human activities (Wang et al., 2022). Precipitation and temperature are considered to be the two most important climate factors affecting the dynamics of global vegetation (Lehnert et al., 2016; Guo et al., 2022), and largely determine the spatial and temporal heterogeneity of the geographic distribution of vegetation (Fibbi et al., 2019). Over recent decades, there has been a clear trend of warming and humidification on the Qinghai-Xizang Plateau (QZP) (Qin et al., 2016; Yu et al., 2021), and there is a close relationship between precipitation and the dynamics of vegetation (Qin et al., 2021; Sun et al., 2022). Most vegetation in arid and semi-arid regions exhibits strong sensitivity to a humidifying climate (Diao et al., 2021); rising temperatures favor decomposition and the release of soil organic matter and nutrients, and enhance photosynthesis by the vegetation (Li et al., 2017); therefore, warming and humidification are considered to be the main factors driving the restoration of vegetation on the QZP (Qin et al., 2016; Yu et al., 2021). Since 2000, in order to restore degraded environments caused by over-deforestation and soil erosion, China has begun to implement ecological restoration projects (Ouyang et al., 2016); for example, the 3-North Shelter Forest Program plays a crucial role in increasing vegetation cover where annual cumulative precipitation is greater than 300–400 mm (Hu et al., 2021; Li et al., 2023), and has had a significant positive impact on vegetation change (Ouyang et al., 2016; Gao et al., 2022). Increased vegetation cover in China has improved regional ecological conditions (Liu and Xin, 2021), and is also contributing to global greening (Chen et al., 2019). The QZP has been facing serious ecological and environmental problems since the 1980s, including grassland degradation, soil erosion, desertification, and the loss of biodiversity (Xi et al., 2023). The implementation of ecological engineering projects, such as the Three-River Headwaters Region Ecological Protection and Construction Project, has significantly reduced the risk of ecosystem degradation, restored vegetation cover, effectively improved the capacity of water containment in ecologically sensitive and fragile areas (Gao et al., 2022), while restoring the ecological environment via grazing bans and the establishment of national parks. However, the QZP is a vast area; the factors or combination of factors that determine changes in the vegetation are mainly limited by local conditions (Lehnert et al., 2016). It is also uncertain as to whether the contribution of each factor to vegetation change or whether vegetation change is sustainable. Ecological restoration projects play an important role in promoting the growth of vegetation growth, whereas mining, overgrazing, and urban expansion exert negative surface greening, all of which represent regional effects (Wei et al., 2022). Therefore, quantifying trends in vegetation change and the contribution of its drivers can be beneficial for managers to promote regional sustainable development by adjusting environmental policies and developing appropriate strategies (Hu et al., 2021; Pei et al., 2021; Song et al., 2022).
Continuous changes in vegetation can be detected at both the temporal and spatial levels because of their operability and practicability (Piao et al., 2020). The normalized difference vegetation index (NDVI) has been widely used as a common indicator to indicate the state of vegetation cover, and long time-series remote sensing data featuring vegetation indices and environmental factors, such as Global Inventory Modeling and Mapping Studies (GIMMS) NDVI and Moderate Resolution Imaging Spectroradiometer (MODIS) NDVI, have been used effectively in the study of vegetation dynamics (Pei et al., 2021). Large scale NDVI trend analysis, such as national scale, the Silk Road Economic Belt, and the agricultural pastoral ecotone, has received significant attention, with data pixel sizes ranging from 1 to 8 km, thus providing a good global overview of large-scale trends in vegetation change (Liu et al., 2021). However, for local managers, a larger pixel size cannot provide more detailed features. Therefore, it is necessary to combine fine spatial and high temporal resolution remote sensing products to acquire more accurate observations to enhance our understanding of the true state of vegetation greening; low spatial resolution products may fail to identify such information (Pei et al., 2021). The quality of existing NDVI products in QZP including Enhanced Thematic Mapper (ETM+), Operational Land Imager (OLI), MODIS, and Advanced Very High Resolution Radiometer (AVHRR) sensors have been evaluated previously; analysis indicated that OLI slightly outperformed the other sensors in all performance metrics, especially in mosaic natural vegetation, grassland, and cropland (Sajadi et al., 2021). The purposes of this study are four-fold: 1) to analyze the characteristics of spatial and temporal changes in the NDVI from 2001 to 2020 in the HV using the Mann-Kendall trend method based on NDVI time series data and topographic data; 2) to determine the sustainability of the NDVI trend and predict the future trend using the Hurst index; 3) to determine the relative contributions of climate change and human activities to NDVI variations using the residual analysis method; and 4) to propose measures to maintain and improve ecological environment quality based on specific characteristics of the changes in NDVI.
2 Materials and methods
2.1 Study area
The HV (100°52′-103°04′E, 35°01′-37°52′N) is located in the northeast of Qinghai Province, covers a total area of 3.3 × 10⁴ km2 and has altitudes ranging from 1614 m to 5238 m. The HV is formed by the alluvial deposits of the Yellow River and the Huangshui River, accounting for 4.5% of the total area of Qinghai Province. The HV is extremely sensitive to climate change; in particular, the ecological environment is relatively fragile and particularly important at the intersection of the eastern monsoon region, the northwest arid region, and the QZP region. The annual average temperature and precipitation in this region lie between 5°C–9°C and 250–500 mm, respectively. The HV features the most advantageous natural geographical conditions in Qinghai Province; the administrative jurisdiction includes a total of 17 counties and districts. The total population in 2021 was 423.01×10⁴, accounting for 71.40% of the population of the Qinghai province. This region represents the key development area in Qinghai Province and belongs to the Lanzhou Xining Key Development Area (Figure 1).
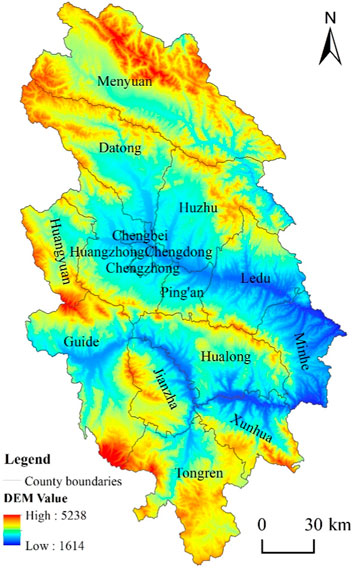
Figure 1. The location of the Hehuang valley.
2.2 Data sources and processing
NDVI time series data (with a spatial resolution of 30 m) of the HV between 2001 and 2020 was downloaded from the Scientific Data Bank (https://www.scidb.cn); this dataset is based on the Integrating ENvironmental VarIable spatiotemporal fusion model (InENVI), which combines environmental variables (including temperature, atmospheric water vapor pressure difference, and downward shortwave radiation), and simulates the non-linear relationship between MODIS (Moderate Resolution Imaging Spectroradiometer) NDVI and Landsat NDVI to reconstruct NDVI data of high spatial resolution (Li et al., 2023). The dataset relating to temperature and precipitation was spatially downscaled from the 30′Climatic Research Unit (CRU) time series dataset with the climatology dataset from WorldClim using delta spatial downscaling and evaluated using observations collected between 1951 and 2016 by 496 weather stations across China (Peng et al., 2019); these data were downloaded from the National Earth System Science Data Center (http://www.geodata.cn). Land-use data (with 30 m spatial resolution) were downloaded from the Resource and Environmental Science and Data Center of the Chinese Academy of Sciences (https://www.resdc.cn). Elevation data (with a spatial resolution of 30 m) were downloaded from the Geospatial Data Cloud (http://www.gscloud.cn). Map data were downloaded from the National Geomatics Center of China (http://www.ngcc.cn).
In 2020, approximately 89.24% of cultivated land in the HV was below 3000 m above sea level, and grasslands were distributed below the snow line. Warm-temperate evergreen coniferous forests can generally form pure forests between 1700 and 2100 m; between 3700 and 3800 m, this region is mountainous and is in transition from cold-temperate coniferous forests to thickets; between 4400 and 5000 m, this region is an Alpine meadow zone; and above 5000 m, the region is a sparse vegetation zone, featuring flowstone and a zone of permanent ice and snow (Zhou et al., 1987); these differences have been used to map different elevation gradients. The “Grain for Green” project was mainly targeted at sloping farmland higher than 15° or 25°; analysis showed that the distribution of vegetation cover in the Qilian Mountains was relatively stable within a range of slope between 15° and 25°(Li and Gong, 2021); when the slope reaches 45°, the vegetation receives the greatest amount of solar radiation energy, which may result in the greatest NDVI value (Yang et al., 2021); this is used as a basis for the delineation of different gradients of slope.
Data processing, including the mosaic, extract, and projection transformation of NDVI, precipitation, and temperature, was carried out in ArcGIS (version 10.8) software provided by Environmental Systems Research Institute (ESRI). To reduce data processing time, the NDVI data was resampled to 90 m by the mean aggregation method, while data relating to precipitation and temperature was resampled to the same size for the NDVI via the cubic convolution algorithm.
2.3 Methods
2.3.1 The Theil-Sen median slope
Spatial variation trends of the NDVI time series were analyzed by applying Theil-Sen analysis. This is a stable trend calculation method for non-parametric statistics with high computational efficiency that is insensitive to measurement error and discrete data due to the fact that it requires a series of mutually independent data (Sen, 1968). This method can indicate changes on the trend of NDVI over a long time series at the pixel scale (Hu et al., 2021; Pei et al., 2021; Wang et al., 2022), and utilizes the following formula:
In this formula, Slope refers to the slope value estimated by the Theil-Sen median; x represents the value of the NDVI for each year in the study; and i and j represent the different years between 2001 and 2020. Slope<0 indicates a decreasing trend in NDVI; in contrast, a Slope>0 indicates an NDVI with an increasing trend.
2.3.2 The Mann-Kendall test
The Mann-Kendall trend test is a non-parametric statistical test that does not require the independence and normality of a time series of data and can effectively detect long-term trends (Mann, 1945; Kendall, 1975). This test method has been widely utilized in trend significance tests for long-term series of data, including meteorological data, climate data and vegetation index data (Qi et al., 2019; Feng et al., 2022); the test statistic Z was calculated as follows:
In these formulae, n represents the length of the time series, NDVIj and NDVIj represent data values at times j and i (j > i), and sgn (NDVIj - NDVIi) represents the symbolic function. Z > 0 and Z < 0 indicate an increasing or decreasing trend, respectively. When n ≥ 8, the test statistic S was approximately normally distributed, and its mean and variance are determined, as follows. Given an α significance level, |Z|>u(1−α)/2 indicates that the assumption that there was no trend was rejected and there was an obvious trend change in NDVI over the time series. In this study, |Z|>1.65 and |Z|>1.96 indicated that the trend passed significance tests at 90% and 95%, and symbolized more significant and significant changes, respectively.
2.3.3 Hurst exponent index
The consistency of sequence trends can be quantitatively assessed using the Hurst Index H) (Hurst, 1951; Mandelbrot and Wallis, 1969), which is widely used for the trend analysis of vegetation indices, including NDVI, Net Primary Productivity (NPP), Fractional Vegetation Cover (FVC), and others (Li et al., 2023; Qin et al., 2016; Xu et al., 2020). The Hurst index is calculated based on the rescaling range analysis method (R/S), which can be used to judge whether a time series of data represents a random walk form or a biased random walk process. This reflects the autocorrelation of a time series, especially with regards to long-term trends that are hidden in the time series. The value of H lies between 0 and 1. An H < 0.5 indicates that the data exhibit anti-persistence within a certain time series; it is possible that the opposite trend may occur in the future. An H = 0.5 indicates that the time series of data is in the state of a random walk, and that the future trend cannot be predicted. An H > 0.5 indicates that the time series of data is persistent and will maintain the current trend in change in the future (Hurst, 1951; Mandelbrot and Wallis, 1969). In the present study, H < 0.49 is defined as anti-sustainability, 0.49 < H < 0.51 as uncertain, and H > 0.51 as a stable trend of NDVI in the future, respectively.
2.3.4 Residual analysis
In this study, we used the residual analysis method to separate and quantify the anthropogenic and climatic impacts on NDVI variations at a grid-scale, so as to further identify the main driver of vegetation changes by comparing the residuals between observed NDVI values and predicted NDVI values (Geerken and Ilaiwi, 2004; Sajadi et al., 2021; Lai et al., 2023). We established a multiple regression model between annual NDVI values and corresponding climatic values (precipitation and temperature); the assumption of this model was that the anthropogenic impact on vegetation could be explained by the residual variations derived from the observed values minus the climate-based predicted values (Geerken and Ilaiwi, 2004; Huang et al., 2023). The equations for this calculation are given below.
in which a and b represented regression coefficients; NDVIci represents the predicted value based on the climatic influence of precipitation (P) and temperature (T); NDVIai represents the residual value, which was determined by the combination of NDVIob (the value of NDVI time series data) and NDVIci. The slopes of NDVIci, NDVIai, and NDVIob correspond to Slopeci, Slopeai, and Slopeob, respectively. The relative contributions of climatic and anthropogenic impacts on vegetation dynamics were calculated with reference to published data (Geerken and Ilaiwi, 2004).
3 Results
3.1 Spatiotemporal variation of NDVI in HV
3.1.1 The temporal variations of NDVI
The NDVI value of the HV between 2001 and 2020 ranged from 0.010 to 0.886, with an average of 0.589. The low value areas (NDVI <0.5) accounted for 29.86% of the study area, and were mainly distributed in high-altitude areas, including the Qilian Mountain (the Northern part of Mengyuan County) and Laji Mountain (from Guide County to the Salar autonomous county of Xunhua), and the Huangshui River Valley (HRV). The different types of land-use in high-altitude areas were mainly non-utilized land, low coverage grasslands, and permanent snow cover, while the HRV mainly featured urban and agricultural areas. Overall, the NDVI in other regions was >0.5, accounting for 70.14% of the HV with scattered low value areas which were mainly forest and grassland (Figure 2).
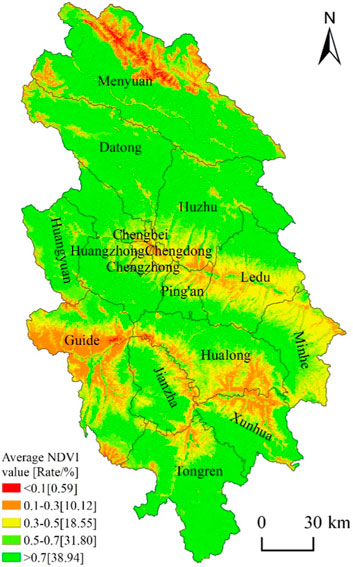
Figure 2. Spatial distribution of the average annual NDVI in the HV between 2001 and 2020.
The NDVI time series reflected temporal changes in the characteristics of vegetation on the HV. The annual average NDVI ranged from 0.548 to 0.638 and exhibited an overall fluctuating rise of 0.0041/yr (p < 0.01) between 2001 and 2020. The increase in NDVI was relatively slow between 2001 and 2005 (0.0042/yr, p < 0.01), with a growth rate of 0.006/yr between 2016 and 2013 (p < 0.01), a decreasing trend between 2013 and 2017 (0.003/yr, p < 0.01), and a relatively fast growth rate between 2017 and 2020 (0.0108/yr, p < 0.01) (Figure 3).
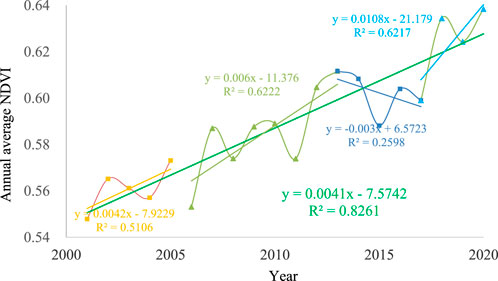
Figure 3. Annual trend in NDVI for the HV between 2001 and 2020.
3.1.2 Spatial variations of NDVI
Theil-Sen Median trend analysis and the Mann-Kendall test showed that the area associated with a significant increase in NDVI accounted for 75.25% of the study area, and that 5.18% of the area exhibited a medium increase; this was mainly concentrated in the region below 3700 m above sea level and a slope between 0° and 35°. This area featured a large amount of grassland, cultivated land and forest; the amount of carbon synthesized by plants increased gradually. In addition, the vegetation cover and the quality of the ecological environment improved under the interaction of human activities and obvious humidification between 2001 and 2020. The areas with a significant and more significant decline of NDVI accounted for 1.96% and 0.43% of the HV, respectively. Spatially, they were situated along the east-west orientation distributed in the HRV from Xining City to the Ledu districts, from Xining City to the north along the valley to Huzhu county, and were sporadically distributed in the remaining parts of the HV. Most of these areas were below 3000 m of the elevation and with a slope of 0°–15°, which were suitable for the layout of towns and industrial facilities, with vegetation degradation and ecological fragility between 2000 and 2020. Furthermore, 17.07% of the NDVI stabilized areas were distributed within the whole study area; 0.11% of the region was not accounted for statistically or was associated with a lack of data (Figure 4; Tables 1, 2).
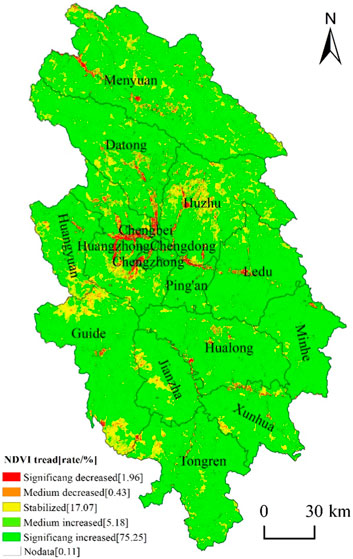
Figure 4. Changing trends in NDVI in the HV between 2001 and 2020.
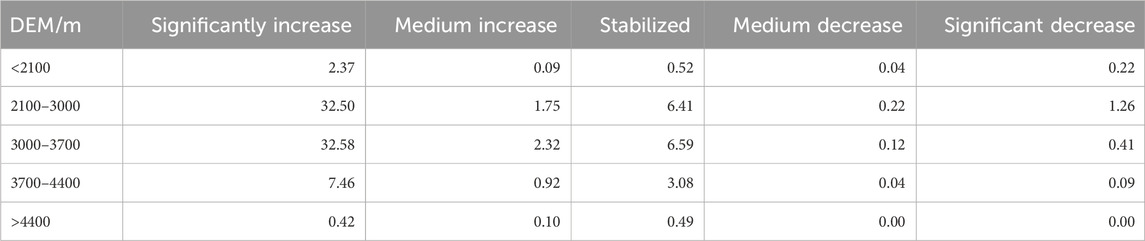
Table 1. The proportion of NDVI change in different elevation gradients (%).
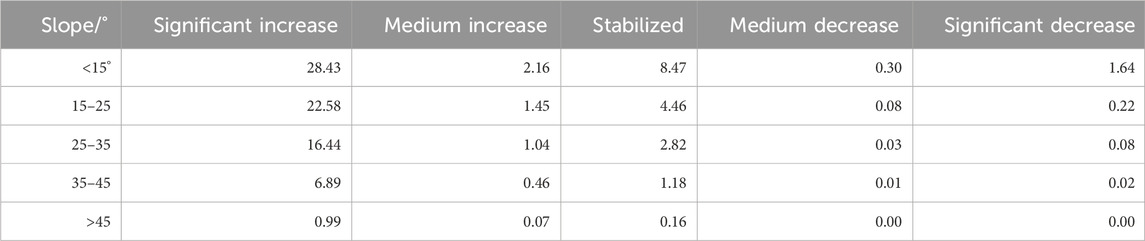
Table 2. Proportion of NDVI change in different terrain gradients (%).
3.2 Drivers of NDVI change in the HV
3.2.1 Synergy between climate change and human activities with NDVI
Within the same period, the average annual temperature in the study area fluctuated between 0.384°C and 1.485°C, increasing at a rate of 0.0151°C/yr (p < 0.01), while the range of annual precipitation was 441–656 mm, increasing at a rate of 4.1138 mm/yr (p < 0.01); these data agreed with the overall increasing trend of NDVI (Figure 5). Firstly, ecological promotion measures, such as the 3-North Shelter Forest Program implemented since 1978 is the largest ecological restoration system project in Qinghai Province, the Greening Project of Nanshan and Beishan in Xining city and Haidong city since 1989, and since 2002, the projects of grazing bans and fencing, Pasture for Grass, livestock reduction, rodent control, ecological migration, and the establishment of nature reserves and national parks were successively implemented in Qinghai Province, were all deployed within the HV. On the other hand, For the existing forest or sand, the measures of setting apart hills (including sand) area for tree growing, forest stand quality conversion, middle-young-growth forest nurturing, and selecting the best to create modern forest farms (including such as Beishan Forest Farm Xining city, Beishan Forest Farm Huzhu county, Xianmi Forest Farm Menyuan county, etc.) were adopted by management. These measures were synergistic with warming and humidification, effectively promoted the growth of NDVI and restored the ecological environment in the HV.
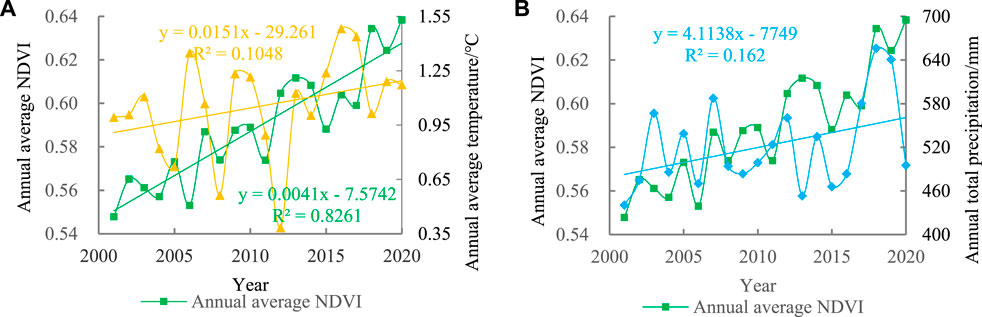
Figure 5. The trends in annual average NDVI, annual average temperature (A), and annual total precipitation (B) in the HV between 2001 and 2020.
3.2.2 The contribution of climate change and human activities to changes in NDVI
According to trends in the observed NDVI, we used predicted NDVI and the residuals of NDVI to analyze the driving mechanisms of NDVI change in the HV between 2001 and 2020. Analysis showed that the proportion of NDVI improved and degraded areas in the HV were 91.80% and 5.70%, respectively, and that the area with no statistics accounted for 2.50%. Of these, 87.24% of the region showed an improvement in NDVI in response to both climate change and human activities; 23.75% and 76.25% of the contributions related to climate change and human activities respectively. These changes occurred in most parts of the study area except for cultivated land; 4.46% of the area was influenced by only human activities; this area was located in the middle and low elevation mountains and along the rivers. Only 0.10% of the area was improved by climate change; these changes were sporadically distributed across the HV. Approximately 88.20% of the area showing an increase in NDVI was concentrated below 3700 m above sea level, thus indicating that most of the area showing vegetation improvement in the HV was not higher than the upper line of the area suitable for the growth of coniferous forest. The relevant greening policy of Qinghai Province shows that the man-made greening activities are mainly distributed around the town, administrative village, water and residential, and besides of roads, as well as planting trees in the ridge to form a forest network. It includes land-use types such as forestable barren land, sandy land, non-utilized land, abandoned and damaged mountains, and degraded grassland. The increased NDVI data indicate that the Grain for Green strategy has been effective in the HV. Furthermore, 89.65% of the area showing an improvement in NDVI was distributed in areas with a slope of less than 35°; these areas featured more human activities, thus indicating that NDVI growth is closely related to human activities (Figure 6; Tables 3, 4).
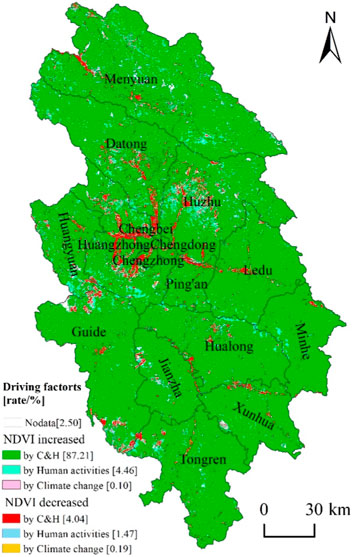
Figure 6. The spatial distribution of factors that influenced NDVI in the HV between 2001 and 2020.
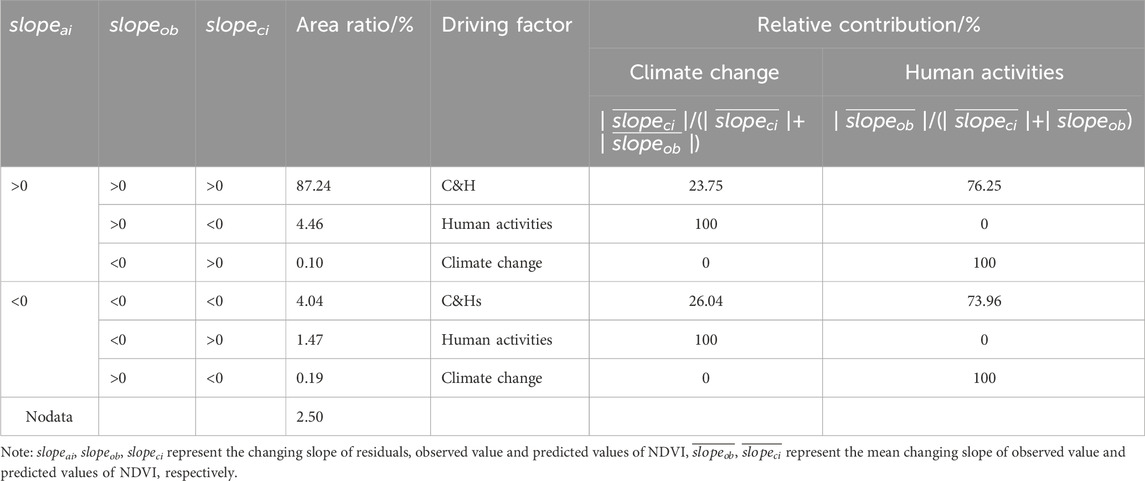
Table 3. The identification of driving factors for NDVI change and the calculation of relative contribution rate.
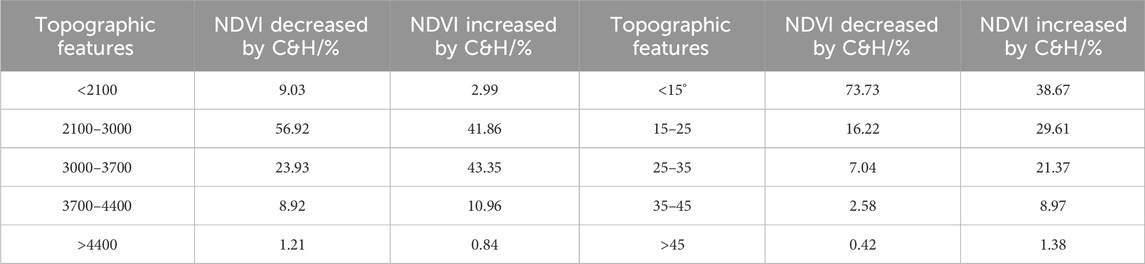
Table 4. The proportion of areas showing changes in NDVI with different topographic features (%).
Analysis showed that 4.04% of the study region was degraded due to climate change and human activities; the relative contributions of climate change and human activities were 26.04% and 73.96%, respectively. The proportions of change driven by climate change or human activities only were 0.19% and 1.47%, respectively. Spatially, the NDVI degraded region was distributed in the HRV, Yellow River Valley, and the central part of the Menyuan county; these areas were dominated by cultivated land and urban land. With regards to vertical gradient, 89.80% of the degraded areas were distributed below 3700 m, particularly between 2100 and 3000 m and between 3000 and 3700 m; furthermore, 89.95% of the NDVI degraded areas had a slope lower than 25°. This was mainly due to occupation of arable land and the expansion of towns, thus representing topographic conditions that are associated with urban development. By weighted summation, the relative contributions of climate change and human activities to NDVI changes over the past 20 years accounted for 23.85% and 76.15% of the jointly influenced area, respectively (Tables 3, 4).
3.3 NDVI sustainability trends in the Hehuang Valley
Next, we used the Hurst index H) to judge the sustainability of the future trend for NDVI changes in the HV; the value of H ranged from 0.04 to 1.0, with a mean value of 0.47 (H < 0.5). Overall, the NDVI was approaching a future trend for degradation. The proportion of the area of anti-sustained changes, sustained changes and stabilization were 61.25%, 31.23%, and 7.36%, respectively; 0.16% of the region was not analyzed due to a lack of data (Figure 7). The region associated with anti-sustained changes was mainly below 3700 m in elevation and below a slope of 35°; the land-use type in this area was dominated by grassland, woodland and cropland.
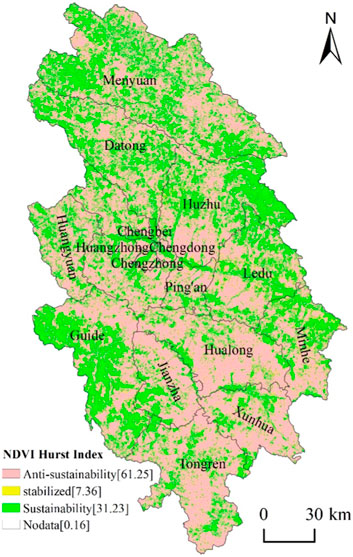
Figure 7. Hurst index for NDVI in the HV between 2001 and 2020.
Next, we used ArcGIS software to overlay and analyze the slope of change with the Hurst index to identify the future trends for NDVI change. Analysis showed that in the future, 52.20% of the HV was likely to experience a trend for NDVI; furthermore, 1.50% of this area will experience a continuous decline and 50.71% of the whole study area will change from a rising to a declining trend. Analysis showed that 24.45% of the area showed NDVI improvement, of which 23.71% showed a continuous increase and 0.75% showed a change from a decreasing to an increasing trend. In total, 23.08% of the area was stable; 0.27% of the area was not associated with any statistical data. Generally, the geographical location at the intersection of the monsoon and arid zones features a fragile ecological background with more grassland, forest and cropland and was classified as anti-sustained. Conflicts between the protection of cropland, the expansion of towns, and economic development were more evident, thus leading to the risk of vegetation degradation in the future (Tables 5, 6).
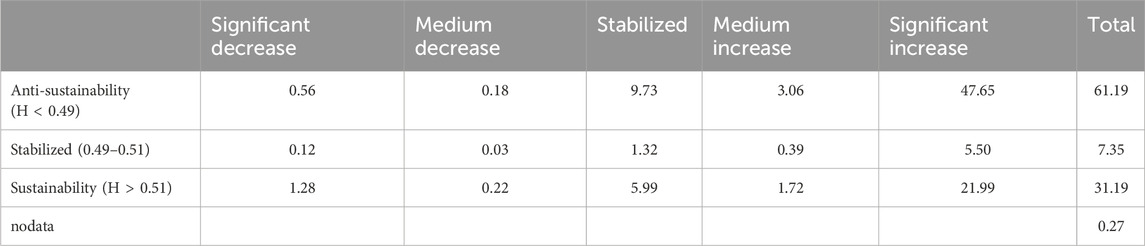
Table 5. Division in trends according to the Hurst exponent (%).
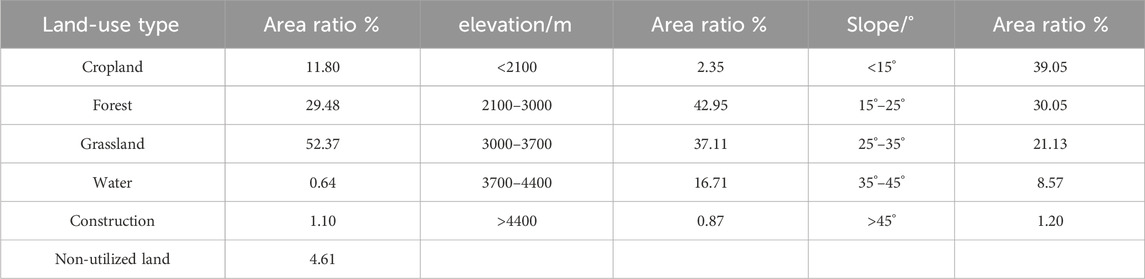
Table 6. The surface characteristics of regions showing anti-sustained changes in NDVI.
3.4 The association between NDVI and changes in land-use
3.4.1 Characteristics of NDVI changes in land-use transfer regions between 2000 and 2020
Statistical analysis of land-use transfer in the HV between 2000 and 2020 showed that the area occupied by non-utilized land, cultivated land, and forest decreased were 524.67 km2, 129.71 km2 and 20.95 km2 in size, respectively. Furthermore, the areas occupied by grassland, construction and water increased by 502.32 km2, 126.61 km2 and 46.47 km2, respectively. Of these, the area of land that was transferred from non-utilized land to grassland was 619.61 km2 in size while the areas of arable land that were degraded to grassland, occupied by construction, and converted to watershed were 165.70 km2, 124.70 km2, and 25.20 km2 in size, respectively. The areas reclaimed from grassland and forest to cultivated land were 137.65 km2 and 161.36 km2 in size, respectively; the extent of transfers between the remaining land categories was generally low (Figure 8; Table 7). With regards to the area experienced by land-use transfer, the average NDVI 0.523 slightly lower than the average NDVI 0.589 in the HV; the NDVI growth area accounted for 99.16% of the area, of which 94.66% and 4.51% of the area experienced significant and more significant increases, respectively. Human activities promoted the growth of NDVI in the HV by changing the use of land (Table 8).
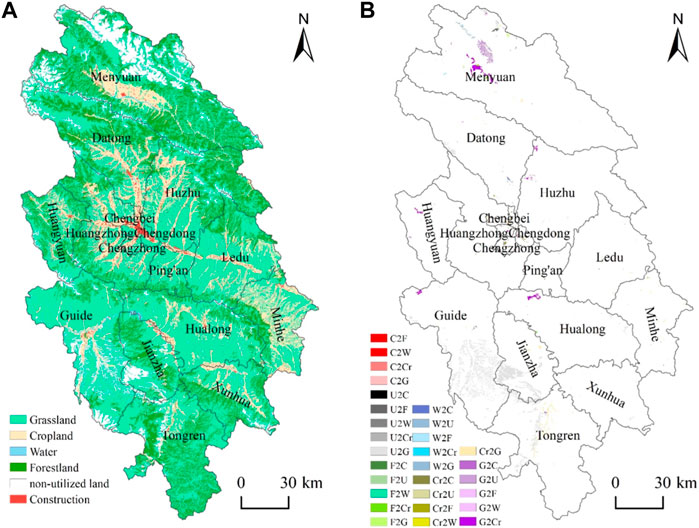
Figure 8. The spatial distribution of land-use in 2000 (A) and transfer between 2000 and 2020 (B) in the HV.
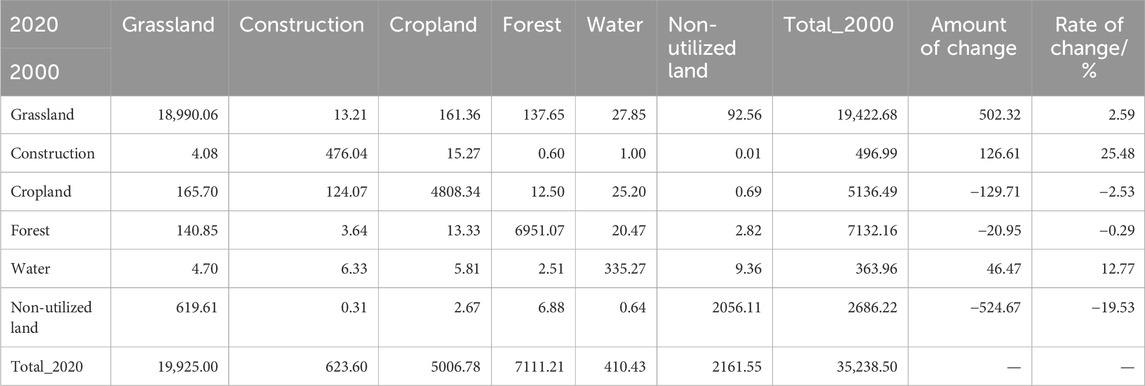
Table 7. Land-use transfer matrix in the HV between 2000 and 2020 (km2).
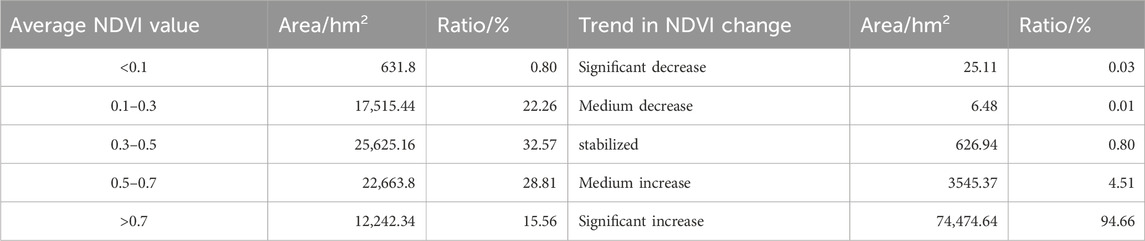
Table 8. NDVI attributes of land-use in transfer areas in the HV between 2000 and 2020.
3.4.2 The characteristics of land-use transfer in regions exhibiting different NDVI changes in the HV between 2000 and 2020
The trend for NDVI change in the HV between 2001 and 2020 was divided into improved areas (including obviously improved areas and mildly improved areas), stabilized areas, and degraded areas (including obviously degraded areas and mildly degraded areas), while land-use transfers were counted separately within each area. Within the NDVI improvement, stabilization and degradation zones, the proportions of reduction for non-utilized land were 94.59%, 5.02% and 0.39%, respectively. The proportions of non-utilized land conversion to grassland were 91.88%, 7.74% and 0.38%, respectively. The proportions showing the reduction of arable land were 11.73%, 28.34%, and 59.93%, respectively. Areas involving construction increased by 18.72%, 26.36%, 54.92%, respectively, while 96.95% and 3.05% of the areas showed an increase in the NDVI improved and stabilized zones (Table 9).
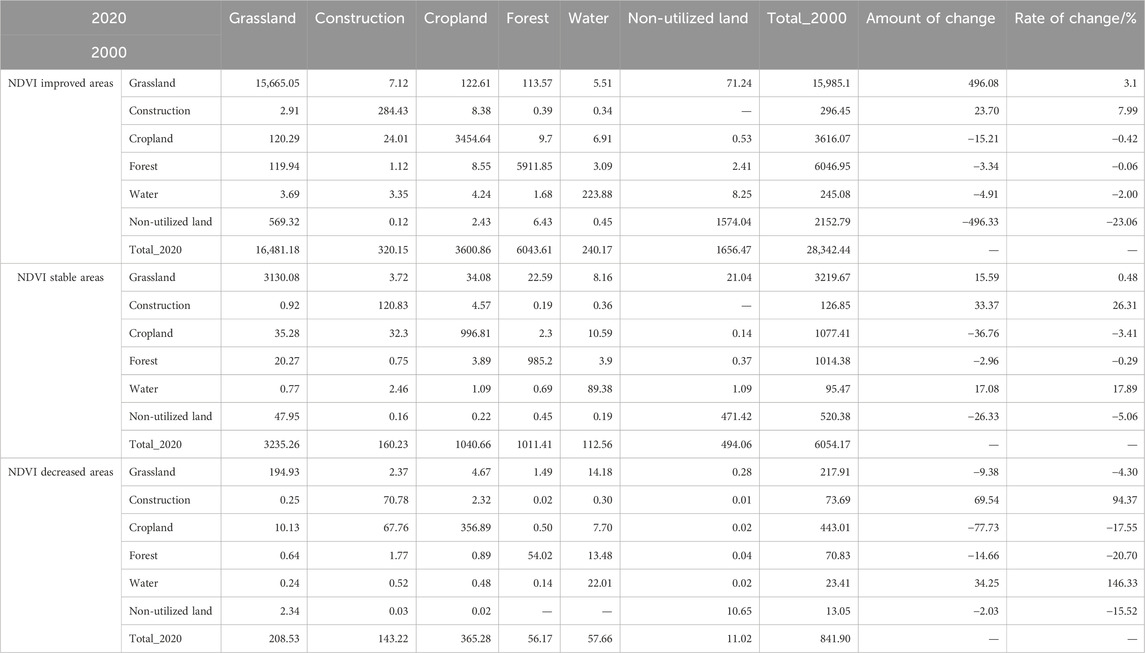
Table 9. Land-use transfer matrix showing different NDVI degraded areas in the HV between 2000 and 2020 (km2).
The area of NDVI improvement was approximately 28,342.44 km2 in size, and land-use transfer was mostly distributed in the north and south of the HV. In the north of the HV (Menyuan County), land-use changes were mainly manifested by the conversion of grassland to cropland and forest land, non-utilized land to grassland, watersheds to grassland, the degradation of forest to grassland, and the degradation of grassland to non-utilized land. The south of the HV (Guide County, Jianzha County, Tongren County, Hualong County) was mainly associated with the transfer of non-utilized land and cropland being converted to grassland. The remainder of NDVI improvement only featured a small proportion of land-use transfers. These changes led to a reduction of non-utilized land by 496.33 km2 and an increase of grassland by 496.08 km2; only small changes were recorded for other types of land-use. The NDVI stabilization zone was 6054.17 km2 in size; the land-use changes in this area showed that cultivated land, non-utilized land and forest decreased by 36.76 km2, 26.33 km2 and 2.96 km2, respectively, while grassland, water and construction increased by 15.59 km2, 17.08 km2 and 33.37 km2, respectively. Overall, the extent of land-use changes was relatively small, therefore implying that the NDVI of the region remained relatively stable. The region exhibiting NDVI degradation was approximately 6841.90 km2 in size, while forest, cultivated land, and non-utilized land decreased by 20.70 km2, 17.55 km2, and 15.52 km2, respectively. Furthermore, watershed and construction increased by 146.33 km2 and 94.37 km2, respectively, thus leading to NDVI degradation in this zone.
4 Discussion
4.1 Response of NDVI to influencing factors in the HV
The spatial and temporal heterogeneity of the geographic distribution of vegetation is obvious, and this distribution is changed more rapidly by climate warming (Fibbi et al., 2019). Climate warming may extend the growing season for vegetation and accelerate greening in the northern regions of China (Piao et al., 2019). Warming and humidification trends are considered to be the main factors responsible for vegetation recovery on the QZP (Qin et al., 2016; Yu et al., 2021). Due to the warm and humid climate environment in this region, vegetation activity was less sensitive to the climate factors in the HV. The lagged correlation between the precipitation in the growing season of the previous year and vegetation activity has been reported to be significant, while a significant positive correlation was detected between precipitation in the spring and vegetation activity in the HV(Hua et al., 2015).
Our analysis found that NDVI increased significantly (0.0041/yr) in the HV between 2001 and 2020; this finding was consistent with the results of previous studies (Wang et al., 2022; Zhu et al., 2022). Temporal variations of moisture content in the surface and middle layers of the soil in alpine meadows and alpine shrubs on the QZP are consistent with precipitation patterns, and negatively correlated with temperature (Dai et al., 2022). Vegetation browning may occur when temperatures increase while precipitation is maintained or decreased (Wang et al., 2022; Wei et al., 2022). Therefore, between 2013 and 2017, with a relatively high mean annual temperature and a relatively low annual precipitation, the annual mean NDVI showed a decreasing trend. Overall, the temperature and precipitation in the HV between 2001 and 2020 showed an increasing trend; however, the greening or degradation of vegetation caused only by climate change factors was sporadically distributed. Climate change factors were mainly coordinated with human activities, such as returning grazing to grasslands, afforestation, and forest protection projects; these gradually improved the photosynthetic efficiency of the vegetation, thus improving NDVI in the HV.
4.2 The response of NDVI to land-use changes in the HV
Since land represents a location for human production and living, a change in land utilization can reflect the impact of human activities on the surface, as well as changes of NDVI. Forests, wetlands, and grasslands exhibit a greater carbon storage capacity than other ecosystems (Pagiola, 2008). Ecological engineering increases carbon storage by increasing the proportion with higher carbon storage land, including woodlands, scrublands, wetlands and high cover grasslands (Zhao et al., 2019). This process significantly reduces the risk of ecosystem degradation in ecologically sensitive and fragile areas and restores vegetation more effectively (Gao et al., 2022). The positive impacts of greening measures on vegetation in the northeastern of QZP are gradually increasing (Chen et al., 2020); these measures are also the main drivers of vegetation greening on the Loess Plateau and the Three-River Headwaters region (contributing to more than 70% of the increase in greening), as well as increasing NPP values in the eastern part of the Hoh Xil Nature Reserve (Naeem et al., 2020). The ecological projects implemented in Qinghai Province include the 3-North Shelter Forest Program, the Greening Project of Nanshan and Beishan, grazing bans and fencing, returning grazing to grass, the prevention and control of rodent infestations, ecological migration, and the establishment of nature reserves and national parks. These measures changed the spatial pattern of land-use in the HV and transferred a large amount of non-utilized land into grassland and forest, and degraded cropland to grassland. As a result, these measures increase the area occupied by ecosystems with a stronger carbon storage capacity such as forest and grassland, enhance ecological quality, and promote the improvement of NDVI. In addition, a small portion of arable land was occupied for construction, and grasslands and forests have been reclaimed as cropland, thus causing the degradation of NDVI.
4.3 Regional territorial management strategies based on NDVI changes
Approximately 52.20% of the NDVI in the HV is expected to experience a trend for degradation in the future; the area undergoing degradation accounted for 50.71% of the HV, and was distributed across the whole region.
The regions showing NDVI improvement was more related to the distribution of grassland, unutilized land, forested land, and the upper limit of elevation and slope of human activities (such as grazing, afforestation, etc.), and NDVI degradation area was more consistent with the conditions of agricultural and economic development in the HV. Thus reflecting that the impact of human activities on vegetation has obvious spatial heterogeneity (Xiong et al., 2021; Zhang et al., 2021). This may corroborate the fact that the contribution of NDVI increase caused by human activities has been greater than climate change over the past 20 years.
In the future, managers should analyze the natural geographic conditions, the background characteristics of the ecological environment, and the main functional orientation of the HV under warm temperatures and humidification. Based on those conditions to evaluate regional environmental carrying capacity and development suitability, distribute urban boundaries more rationally, implement policies related to the economical and intensive utilization of land. It is important that delineating the scope of permanent basic farmland to ensure farmland is not occupied, to mitigate the deterioration of farmland ecosystems caused by a decline in natural recovery capacity. It is important to obey the Ecological Protection Red Line, prevent the infestation of grassland by rodents, and prohibit overgrazing to ensure the self-recovery ability of plants. It is also important to implement corresponding vegetation restoration measures according to different degradation risk levels to improve the recovery capacity of natural ecosystems in regions at potential risk of degradation (Cao et al., 2018; Teng et al., 2020). Furthermore, it is important to increase water conservation areas, construct a regional ecological security pattern, and promote the conservation of biodiversity, so as to ensure regional ecological balance and provide ecosystem services on a larger scale during the process of land development in the HV.
4.4 Uncertainties and limitations
It should be noted that there are some limitations in this paper. Only the two main climatic factors, temperature and precipitation, were considered, whereas NDVI changes are also controlled by various factors such as soil moisture and temperature (Rivas-Tabares et al., 2021), solar radiation, and fertilizer effect, etc (Xie et al., 2022). NDVI changes have a hysteresis effect on rainfall and temperature (Zhe and Zhang, 2021), and it is also not possible to explicitly quantify the impacts of specific human activities, such as urban expansion, returning farmland to forests, and afforestation, on vegetation change (Wang et al., 2023), those may introduce some uncertainty in the results of this paper. Therefore, in the future, it will be necessary to further refine the influencing factors of vegetation or NDVI change, to map the spatial distribution of specific human activities, and to improve the precision of the evaluation results by combining technical means such as field surveys, which may help to understand the specific causes of vegetation change.
5 Conclusion
Based on the InENVI NDVI time series dataset, this paper analyzed characteristics associated with the spatial and temporal changes of NDVI, the sustainability of the evolutionary trend and its influencing factors in the HV between 2001 and 2020 by applying Mann-Kendall trend analysis, the Hurst index, and residual analysis. First, the average multi-year NDVI value between 2001 and 2020 in the HV was generally higher in the low elevation areas except for towns and croplands, but was generally lower in the high elevation areas, towns, and agricultural land. Secondly, NDVI showed an increasing trend between 2001 and 2020; most of the NDVI improvement area was not higher than the upper line of the area suitable for the growth of coniferous forest with a terrain below 35°; this is because the greening of the non-utilized land area was larger than the degradation of NDVI caused by human activities. These data also showed that the efficacy of the strategy of returning farmland to forest and grassland was higher than the negative impacts of urban expansion. Third, the trend of NDVI change between 2001 and 2020 was less influenced by single factors of climate change (e.g., temperature and precipitation) or human activities (e.g., grazing bans, greening projects, or urban construction). The area of common impact accounted for 91.28% of the HV, in which the climate change and human activities were responsible for 23.85% and 76.15% of the effect, respectively. Finally, the NDVI in localized areas was at risk of degradation in response to warm humidification in the HV. Managers should implement different levels of anthropogenic interventions to improve the recovery capacity of the natural ecosystem and ensure regional ecological balance based on the topography and vegetation characteristics in different degraded regions.
Data availability statement
The original contributions presented in the study are included in the article/supplementary material, further inquiries can be directed to the corresponding author.
Author contributions
BX: Conceptualization, Data curation, Methodology, Software, Validation, Writing–original draft, Writing–review and editing. XM: Conceptualization, Funding acquisition, Methodology, Writing–review and editing. XL: Data curation, Methodology, Software, Validation, Writing–original draft. XW: Project administration, Writing–review and editing. ZZ: Writing–review and editing. WT: Data curation, Methodology, Writing–review and editing. HY: Funding acquisition, Writing–review and editing. YW: Writing–review and editing.
Funding
The author(s) declare that financial support was received for the research, authorship, and/or publication of this article. This research was funded by Natural Science Foundation Program of Qinghai Province (2024-ZJ-910); and Qinghai Province Philosophy and Social Science Program (23ZCY042).
Acknowledgments
We are thankful to the editor and reviewers for their suggestions to improve the quality of this article, and the EditSprings (https://www.editsprings.cn) for the expert linguistic services provided.
Conflict of interest
The authors declare that the research was conducted in the absence of any commercial or financial relationships that could be construed as a potential conflict of interest.
Publisher’s note
All claims expressed in this article are solely those of the authors and do not necessarily represent those of their affiliated organizations, or those of the publisher, the editors and the reviewers. Any product that may be evaluated in this article, or claim that may be made by its manufacturer, is not guaranteed or endorsed by the publisher.
References
Cai, Y. F., Zhang, F., Duan, P., Jim, C. Y., Chan, N. W., Shi, J. C., et al. (2022). Vegetation cover changes in China induced by ecological restoration-protection projects and land-use changes from 2000 to 2020. Catena 217, 106530. doi:10.1016/j.catena.2022.106530
Cao, J. J., Li, M. T., Deo, R. C., Adamowski, J. F., Cerdà, A., Feng, Q., et al. (2018). Comparison of social-ecological resilience between two grassland management patterns driven by grassland land contract policy in the Maqu, Qinghai-Tibetan Plateau. Land Use Policy 74, 88–96. doi:10.1016/j.landusepol.2017.07.027
Chen, C., Park, T., Wang, X. H., Piao, S. L., Xu, B. D., Chaturvedi, R. K., et al. (2019). China and India lead in greening of the world through land-use management. Nat. Sustain 2 (2), 122–129. doi:10.1038/s41893-019-0220-7
Chen, J. H., Yan, F., and Lu, Q. (2020). Spatiotemporal variation of vegetation on the qinghai-tibet Plateau and the influence of climatic factors and human activities on vegetation trend (2000-2019). Remote Sens. 12 (19), 3150. doi:10.3390/rs12193150
Dai, L. C., Fu, R. Y., Guo, X. W., Du, Y. G., Zhang, F. W., and Cao, G. M. (2022). Soil moisture variations in response to precipitation across different vegetation types on the northeastern qinghai-tibet plateau. Front. Plant Sci. 13, 854152. doi:10.3389/fpls.2022.854152
Diao, C., Liu, Y., Zhao, L., Zhuo, G., and Zhang, Y. Q. (2021). Regional-scale vegetation-climate interactions on the qinghai-tibet plateau. Ecol. Inf. 65, 101413. doi:10.1016/j.ecoinf.2021.101413
Feng, Z. H., Chen, J. J., Huang, R. J., Yang, Y. P., You, H. T., and Han, X. W. (2022). Spatial and temporal variation in alpine vegetation phenology and its response to climatic and topographic factors on the qinghai-tibet plateau. Sustainability 14 (19), 12802. doi:10.3390/su141912802
Fibbi, L., Moriondo, M., Chiesi, M., Bindi, M., and Maselli, F. (2019). Impacts of climate change on the gross primary production of Italian forests. Ann Sci 76 (2), 59. doi:10.1007/s13595-019-0843-x
Gao, J., Zhang, Y. J., Zheng, Z. T., Cong, N., Zhao, G., Zhu, Y. X., et al. (2022). Ecological engineering projects shifted the dominance of human activity and climate variability on vegetation dynamics. Remote Sens. 14 (10), 2386. doi:10.3390/rs14102386
Geerken, R., and Ilaiwi, M. (2004). Assessment of rangeland degradation and development of a strategy for rehabilitation. Remote Sens. Environ. 90 (4), 490–504. doi:10.1016/j.rse.2004.01.015
Guo, J. T., Wang, K. B., Wang, T. J., Bai, N., Zhang, H., Cao, Y., et al. (2022). Spatiotemporal variation of vegetation NDVI and its climatic driving forces in global land surface. Pol. J. Environ. Stud. 31 (4), 3541–3549. doi:10.15244/pjoes/147194
Hu, Y. G., Li, H., Wu, D., Chen, W., Zhao, X., Hou, M. L., et al. (2021). LAI-indicated vegetation dynamic in ecologically fragile region: a case study in the Three-North Shelter Forest program region of China. Ecol. Indic. 120, 106932. doi:10.1016/j.ecolind.2020.106932
Hua, T., Wang, X. M., Ci, Z., Lang, L. L., and Zhang, C. X. (2015). Responses of vegetation activity to climate variation on the Qinghai-Tibetan Plateau (China) from 1982 to 2011. Clim. Res. 66 (1), 65–73. doi:10.3354/cr01333
Huang, H. X., Xi, G. L., Ji, F. K., Liu, Y. Y., Wang, H. R., and Xie, Y. W. (2023). Spatial and temporal variation in vegetation cover and its response to topography in the selinco region of the qinghai-tibet plateau. Remote Sens. 15 (16), 4101. doi:10.3390/rs15164101
Hurst, H. E. (1951). Long term storage capacity of reservoirs. Trans. Am. Soc. Civ. Eng. 116 (1), 770–799. doi:10.1061/taceat.0006518
Lai, J. L., Qi, S., Liao, R. E., Cui, R. R., Li, P., and Tang, Y. (2023). Vegetation change responses to climate change and human activities in southwest alpine canyon areas of China from 2000 to 2019. Transactions of the Chinese Society of Agricultural Engineering 39 (14), 155–163.
Lehnert, L. W., Wesche, K., Trachte, K., Reudenbach, C., and Bendix, J. (2016). Climate variability rather than overstocking causes recent large scale cover changes of Tibetan pastures. Sci. Rep. 6, 24367. doi:10.1038/srep24367
Li, J., and Gong, C. w. (2021). Effects of terrain factors on vegetation cover change in national park of qilian mountains. Bull. Soil Water Conservation 41 (3), 228–237. doi:10.13961/j.cnki.stbctb.2021.03.031
Li, J., Liu, H., Li, C., and Li, L. (2017). Changes of green-up day of vegetation growing season based on GIMMS 3g NDVI in Northern China in recent 30 years. Sci. Geogr. Sin. 37 (4), 620–629. doi:10.13249/j.cnki.sgs.2017.04.016
Li, M. L., Qin, Y. B., Zhang, T. B., Zhou, X. B., Yi, G. H., Bie, X. J., et al. (2023). Climate change and anthropogenic activity Co-driven vegetation coverage increase in the three-North Shelter forest region of China. Remote Sens. 15 (6), 1509. doi:10.3390/rs15061509
Li, X. Q., Peng, Q. Y., and yuan, W. P. (2023). A 30m fused InENVI NDVI dataset from 2001 to 2020 in China(V1)[DS/OL]. Sci. Data Bank. doi:10.57760/sciencedb.ecodb.00187
Liu, X. Y., and Xin, L. J. (2021). China's deserts greening and response to climate variability and human activities. PLoS One 16 (8), e0256462. doi:10.1371/journal.pone.0256462
Liu, Y. Y., Yang, P. Z., Zhang, Z. X., Zhang, W., Wang, Z. Q., Zhang, Z. Y., et al. (2021). Diverse responses of grassland dynamics to climatic and anthropogenic factors across the different time scale in China. Ecol. Indic. 132, 108341. doi:10.1016/j.ecolind.2021.108341
Mandelbrot, B. B., and Wallis, J. R. (1969). Robustness of the rescaled range R/S in the measurement of noncyclic long run statistical dependence. Water Resour. Res. 5 (5), 967–988. doi:10.1029/WR005i005p00967
Mann, H. B. (1945). Nonparametric tests against trend. Econometrica 13 (3), 245–259. doi:10.2307/1907187
Naeem, S., Zhang, Y. Q., Tian, J., Qamer, F. M., Latif, A., and Paul, P. K. (2020). Quantifying the impacts of anthropogenic activities and climate variations on vegetation productivity changes in China from 1985 to 2015. Remote Sens. 12 (7), 1113. doi:10.3390/rs12071113
Ouyang, Z., Zheng, H., Xiao, Y., Polasky, S., Liu, J., Xu, W., et al. (2016). Improvements in ecosystem services from investments in natural capital. Science 352 (6292), 1455–1459. doi:10.1126/science.aaf2295
Pagiola, S. (2008). Payments for environmental services in Costa Rica. Ecol. Econ. 65 (4), 712–724. doi:10.1016/j.ecolecon.2007.07.033
Pei, H. W., Liu, M. Z., Jia, Y. G., Zhang, H. J., Li, Y. L., and Xiao, Y. X. (2021). The trend of vegetation greening and its drivers in the Agro-pastoral ecotone of northern China, 2000-2020. Ecol. Indic. 129, 108004. doi:10.1016/j.ecolind.2021.108004
Peng, S. Z., Ding, Y. X., Liu, W. Z., and Li, Z. (2019). 1 km monthly temperature and precipitation dataset for China from 1901 to 2017. Earth Syst. Sci. Data 11 (11), 1931–1946. doi:10.5194/essd-11-1931-2019
Piao, S. L., Wang, X. H., Park, T., Chen, C., Lian, X., He, Y., et al. (2020). Characteristics, drivers and feedbacks of global greening. Nat. Rev. Earth Environ. 1 (1), 14–27. doi:10.1038/s43017-019-0001-x
Piao, S. L., Zhang, X. Z., Wang, T., Liang, E. Y., wang, S. P., Zhu, J. T., et al. (2019). Responses and feedback of the Tibetan Plateau’s alpine ecosystem to climate change. Chin. Sci. Bull. 64 (27), 2842–2855. doi:10.1360/tb-2019-0074
Qi, X. Z., Jia, J. H., Liu, H. Y., and Lin, Z. S. (2019). Relative importance of climate change and human activities for vegetation changes on China's silk road economic belt over multiple timescales. Catena 180, 224–237. doi:10.1016/j.catena.2019.04.027
Qin, X., Liu, W. B., Mao, R. C., Song, J. X., Chen, Y. N., Ma, C., et al. (2021). Quantitative assessment of driving factors affecting human appropriation of net primary production (HANPP) in the Qilian Mountains, China. Ecol. Indic. 121, 106997. doi:10.1016/j.ecolind.2020.106997
Qin, X. J., Sun, J., Liu, M., and Lu, X. Y. (2016). The impact of climate change and human activity on net primary production in Tibet. Pol. J. Environ. Stud. 25 (5), 2113–2120. doi:10.15244/pjoes/62986
Rivas-Tabares, D. A., Saa-Requejo, A., Martín-Sotoca, J. J., and Tarquis, A. M. (2021). Multiscaling NDVI series analysis of rainfed cereal in Central Spain. Remote Sens. 13 (4), 568. doi:10.3390/rs13040568
Sajadi, P., Sang, Y. F., Gholamnia, M., Bonafoni, S., Brocca, L., Pradhan, B., et al. (2021). Performance evaluation of long NDVI timeseries from AVHRR, MODIS and Landsat sensors over landslide-prone locations in Qinghai-Tibetan plateau. Remote Sens. 13 (16), 3172. doi:10.3390/rs13163172
Sen, P. K. (1968). Estimates of the regression coefficient based on Kendall's tau. J. Am. Stat. Assoc. 63 (324), 1379–1389. doi:10.2307/2285891
Song, W. Q., Feng, Y. H., and Wang, Z. H. (2022). Ecological restoration programs dominate vegetation greening in China. Sci. Total Environ. 848, 157729. doi:10.1016/j.scitotenv.2022.157729
Sun, C., Xu, X. D., Wang, P. J., Yang, D. A., Zhang, S. J., Wang, C. Z., et al. (2022). The warming and wetting ecological environment changes over the Qinghai-Tibetan Plateau and the driving effect of the asian summer monsoon. J. Trop. Meteorol. 28 (1), 95–108. doi:10.46267/j.1006-8775.2022.008
Teng, Y. M., Zhan, J. Y., Agyemang, F. B., and Sun, Y. X. (2020). The effects of degradation on alpine grassland resilience: a study based on meta-analysis data. Glob. Ecol. Conserv. 24, e01336. doi:10.1016/j.gecco.2020.e01336
Wang, H. H., Zhan, J. Y., Wang, C., Liu, W., Yang, Z., Liu, H. Z., et al. (2022). Greening or browning? The macro variation and drivers of different vegetation types on the Qinghai-Tibetan Plateau from 2000 to 2021. Front. Plant Sci. 13, 1045290. doi:10.3389/fpls.2022.1045290
Wang, S. A., Liu, X. M., and Wu, Y. J. (2023). Considering climatic factors, time lag, and cumulative effects of climate change and human activities on vegetation NDVI in yinshanbeilu, China. Plants-Basel 12 (18), 3312. doi:10.3390/plants12183312
Wei, Y. Q., Lu, H. Y., Wang, J. N., Wang, X. F., and Sun, J. (2022). Dual influence of climate change and anthropogenic activities on the spatiotemporal vegetation dynamics over the Qinghai-Tibetan plateau from 1981 to 2015. Earth Future 10 (5), 23. doi:10.1029/2021ef002566
Xi, G. L., Ma, C. H., Xie, Y. W., Guo, Z. C., Bao, T. N., Zhang, X. Y., et al. (2023). Spatialization method of monitoring grazing intensity: a case-study of the Tibet Selinco basin, Qinghai-Tibet Plateau. Land Degrad. Dev. 34, 1311–1322. doi:10.1002/ldr.4534
Xie, C. H., Wu, S. X., Zhuang, Q. W., Zhang, Z. H., Hou, G. Y., Luo, G. P., et al. (2022). Where anthropogenic activity occurs, anthropogenic activity dominates vegetation net primary productivity change. Remote Sens. 14 (5), 1092. doi:10.3390/rs14051092
Xiong, Q. L., Xiao, Y., Liang, P. H., Li, L. J., Zhang, L., Li, T., et al. (2021). Trends in climate change and human interventions indicate grassland productivity on the Qinghai-Tibetan Plateau from 1980 to 2015. Ecol. Indic. 129, 108010. doi:10.1016/j.ecolind.2021.108010
Xu, D. D., An, D. S., and Guo, X. L. (2020). The impact of non-photosynthetic vegetation on LAI estimation by NDVI in mixed grassland. Remote Sens. 12 (12), 1979. doi:10.3390/rs12121979
Yang, R. R., Cao, G. C., Cao, S. K., Lan, Y., Zhang, Z., and Chen, Z. R. (2021). Temporal and spatial variations of NDVI and analysis of influencing factors in main valleys of southern slope of Qilian Mountains. Guihaia 41 (3), 429–437.
Yu, H. L., Ding, Q. N., Meng, B. P., Lv, Y. Y., Liu, C., Zhang, X. Y., et al. (2021). The relative contributions of climate and grazing on the dynamics of grassland NPP and PUE on the qinghai-tibet plateau. Remote Sens. 13 (17), 3424. doi:10.3390/rs13173424
Zhang, Y., Hu, Q. W., and Zou, F. L. (2021). Spatio-temporal changes of vegetation net primary productivity and its driving factors on the Qinghai-Tibetan plateau from 2001 to 2017. Remote Sens. 13 (8), 1566. doi:10.3390/rs13081566
Zhao, M. m., He, Z. b., Du, J., Chen, L. f., Lin, P. f., and Fang, S. (2019). Assessing the effects of ecological engineering on carbon storage by linking the CA-Markov and InVEST models. Ecological Indicators. Ecol. Indic. 95, 29–38. doi:10.1016/j.ecolind.2018.10.052
Zhe, M., and Zhang, X. Q. (2021). Time-lag effects of NDVI responses to climate change in the yamzhog yumco basin, south Tibet. Ecol. Indic. 124, 107431. doi:10.1016/j.ecolind.2021.107431
Zhou, X. M., Wang, Z. B., and Du, Q. (1987). The vegetation of Qinghai. Xining, PRC: Qinghai People’s Press.
Keywords: spatiotemporal variation, NDVI, climate change, afforestation, the Hehuang valley
Citation: Xu B, Mao X, Li X, Wei X, Zhang Z, Tang W, Yu H and Wu Y (2024) Anthropogenic activities dominated the spatial and temporal changes of normalized difference vegetation index (NDVI) in the Hehuang valley in the northeastern Qinghai Province between 2000 and 2020. Front. Environ. Sci. 12:1384032. doi: 10.3389/fenvs.2024.1384032
Received: 09 February 2024; Accepted: 01 April 2024;
Published: 12 April 2024.
Edited by:
Sawaid Abbas, University of the Punjab, PakistanCopyright © 2024 Xu, Mao, Li, Wei, Zhang, Tang, Yu and Wu. This is an open-access article distributed under the terms of the Creative Commons Attribution License (CC BY). The use, distribution or reproduction in other forums is permitted, provided the original author(s) and the copyright owner(s) are credited and that the original publication in this journal is cited, in accordance with accepted academic practice. No use, distribution or reproduction is permitted which does not comply with these terms.
*Correspondence: Xufeng Mao, maoxufeng@yeah.net