Assessment of tradeoffs between ecosystem services in large spatially constrained forest management planning problems
 Dagm Abate1,2*
  Susete Marques1
  Vladimir Bushenkov3 Jose Riffo4
  Andres Weintraub4 Miguel Constantino5
  Constantino Lagoa6
  Jose G. Borges1
- 1Forest Research Center and Associated Laboratory TERRA, School of Agriculture, University of Lisbon, Tapada da Ajuda, Lisbon, Portugal
- 2College of Agriculture and Environmental Sciences, University of Gondar, Gondar, Ethiopia
- 3Research Centre for Mathematics and Applications, University of Évora, Colégio Luis Verney, Évora, Portugal
- 4Department of Industrial Engineering, University of Chile and Institute for Complex Engineering Systems (ISCI), Santiago, Chile
- 5Center for Mathematics, Fundamental Applications and Operational Research, Faculty of Sciences, University of Lisbon, Lisbon, Portugal
- 6School of Electrical Engineering and Computer Science, The Pennsylvania State University, University Park, PA, United States
Forests provide multiple ecosystem services, some of which are competitive, while others are complementary. Pareto frontier approaches are often used to assess the trade-offs among these ecosystem services. However, when dealing with spatial optimization problems, one is faced with problems that are computationally complex. In this paper, we study the sources of this complexity and propose an approach to address adjacency conflicts while analyzing trade-offs among wood production, cork, carbon stock, erosion, fire resistance and biodiversity. This approach starts by sub-dividing a large landscape-level problem into four smaller sub-problems that do not share border stands. Then, it uses a Pareto frontier method to get a solution to each. A fifth sub-problem included all remaining stands. The solution of the latter by the Pareto frontier method is constrained by the solutions of the four sub-problems. This approach is applied to a large forested landscape in Northwestern Portugal. The results obtained show the effectiveness of using Pareto frontier approaches to analyze the trade-offs between ecosystem services in large spatial optimization problems. They highlight the existence of important trade-offs, notably between carbon stock and wood production, alongside erosion, biodiversity and wildfire resistance. These trade-offs were particularly clear at higher levels of these optimized services, while spatial constraints primarily affected the magnitude of the services rather than the underlying trade-off patterns. Moreover, in this paper, we study the impact of the size and complexity of the spatial optimization problem on the accuracy of the Pareto frontiers. Results suggest that the number of stands, and the number of adjacency conflicts do not affect accuracy. They show that accuracy decreases in the case of spatial optimization problems but it is within an acceptable range of discrepancy, thus showing that our approach can effectively support the analysis of trade-offs between ecosystem services.
1 Introduction
Worldwide demographic, socio-economic and environmental changes over the last three decades have led to a shift in forestry from a purely timber production focus toward the consideration of a broader range of ecosystem services. Simultaneous provision of multiple services in forest management is a complex problem where many trade-offs need to be considered. Some objectives are competitive, while others are complementary (Tóth et al., 2006). As a result, harmonizing ecological, economic, and sociocultural values of forest ecosystems and simultaneously managing multiple services poses a considerable challenge to forest managers (Baskent et al., 2020).
The complexity of this problem prompted the development of decision support tools to examine trade-offs among objectives. In the literature, one can find examples of the application of several multiple-criteria decision analysis (MCDA) approaches to help solve multiple objective forest management planning problems (e.g., Mendoza and Martins, 2006; Ananda and Herath, 2009; Borges et al., 2014, 2017). Moreover, several MCDA-based decision support tools are available that can help users and scientific researchers both to learn and understand the impacts of management plans on the provision of forest ecosystem services (Baskent and Jordan, 2002; Baskent et al., 2014).
A Pareto frontier approach does not require the definition of ecosystem service targets a priori, i.e., does not information about potential supply values or trade-offs among those services. The approach provides the decision-maker with information about (i) the production possibilities (i.e., the potential of the landscape to provide ecosystem services) and (ii) the extent to which increasing the supply of an ecosystem service requires accepting reduction in the provision of others (Borges et al., 2017). This method thus provides decision-makers with the information needed to assess the trade-offs between ecosystem services and to set supply targets aligned with their preferences. The approach integrates the functionality of both mathematical programming and interactive decision-maps techniques to compute and display the Pareto frontier when considering two or more ecosystem services (Borges et al., 2014). In particular, the Pareto frontier approach discussed in Tóth and McDill, (2009), Borges et al. (2014) is a linear programming-based technique that can consider both continuous and integer variables. Nevertheless, the generation of Pareto frontiers of integer or mixed integer optimization problems requires a substantial computation effort (Marques S, et al., 2021). Most applications of Pareto frontier techniques in forest management consider continuous variables (e.g., Tóth and McDill, 2009; Borges et al., 2014, 2017; Marques et al., 2017, 2020; Abate et al., 2022). There are very few applications to forest management problems with integer variables (e.g., Tóth et al., 2006; Marques S, et al., 2021). Furthermore, addressing forest management questions related to a wider range of ecosystem services requires spatial optimization models (Borges and Hoganson, 2000). The latter considers both integer variables as well as spatial constraints (e.g., adjacency constraints) but the end result is a computationally complex optimization problem (e.g., McDill et al., 2002; Murray and Weintraub, 2002; Constantino et al., 2008; Könnyu and Tóth, 2013; Constantino and Martins, 2018).
Computational complexity of spatial optimization problems is the limiting factor for the use of Pareto frontier methods that are based on solving of integer or mixed integer programs (Tóth et al., 2006; Marques S, et al., 2021). When addressing large and complex problems, decomposition methods are commonly employed to circumvent this problem. Existing techniques such as the Branch and Price decomposition (Barnhart et al., 1998) and the more recent method by Meselhi et al. (2022) known as the Decomposition of Overlapping Functions (DOV) method have been exploited to solve such problems. However, these have only been applied to single-objective optimization rather than to the generation of the Pareto frontier in scenarios involving multiple objectives. Recent work by Marques S, et al. (2021) showcased an approach for constructing the Pareto frontiers of large integer problems derived from the Pareto frontier of smaller sub-problems. Riffo (2020) emphasized the challenge in creating Pareto frontiers for integer problems that incorporate adjacency constraints. While he suggested decomposing large problems into smaller, more manageable components, his approach produces infeasible optimization problems when applied to the construction of the Pareto frontier for large landscape problems bound by adjacency constraints. Hence, the challenge remains, namely, how to address the adjacencies between stands bordering the sub-problems. Our study aims at addressing this challenge. It proposes an approach that builds from information about trade-offs of ecosystem services in smaller spatial optimization sub-problems that may be solved independently. The emphasis is thus on building the frontier from smaller sub-problems that are designed so that there are no violations of adjacency constraints. A case study in the Northwest of Portugal is used for testing and demonstration purposes.
2 Methods
2.1 Case study area
A forested landscape located in Paiva County in northwest Portugal (Figure 1) was used for testing our approach. Its area extends over 7,487 ha and was partitioned into 686 homogeneous units, each of which is a forest stand with the same cover type (e.g., forest species), age and productivity. The stands are mainly pure eucalypt (Eucalyptus globulus L.) covering 6,428 ha, with some stands being a mixture of eucalypt and maritime pine (Pinus pinaster Ait.). The latter extends over 611 ha. The landscape includes too pure chestnut (Castanea sativa Mill.) and cork oak (Quercus suber L.) stands extending over 23 ha. Moreover, some of the land (347 ha) is currently bare and available for new plantations. A recent wildfire has burned about 46% of the area. The landscape has the potential to provide several ecosystem services. In the work described in this paper, we leverage the information on the preferences of stakeholders reported in Marques M, et al. (2021) and consider wood as well as cork production, biodiversity conservation, erosion protection, carbon storage, and wildfire prevention as objectives to be taken into consideration. We also rely on the work developed by Marques M, et al. (2021) to simulate species conversions and changes in the area occupied by each species that might reflect the preferences of stakeholders outlined by these authors.
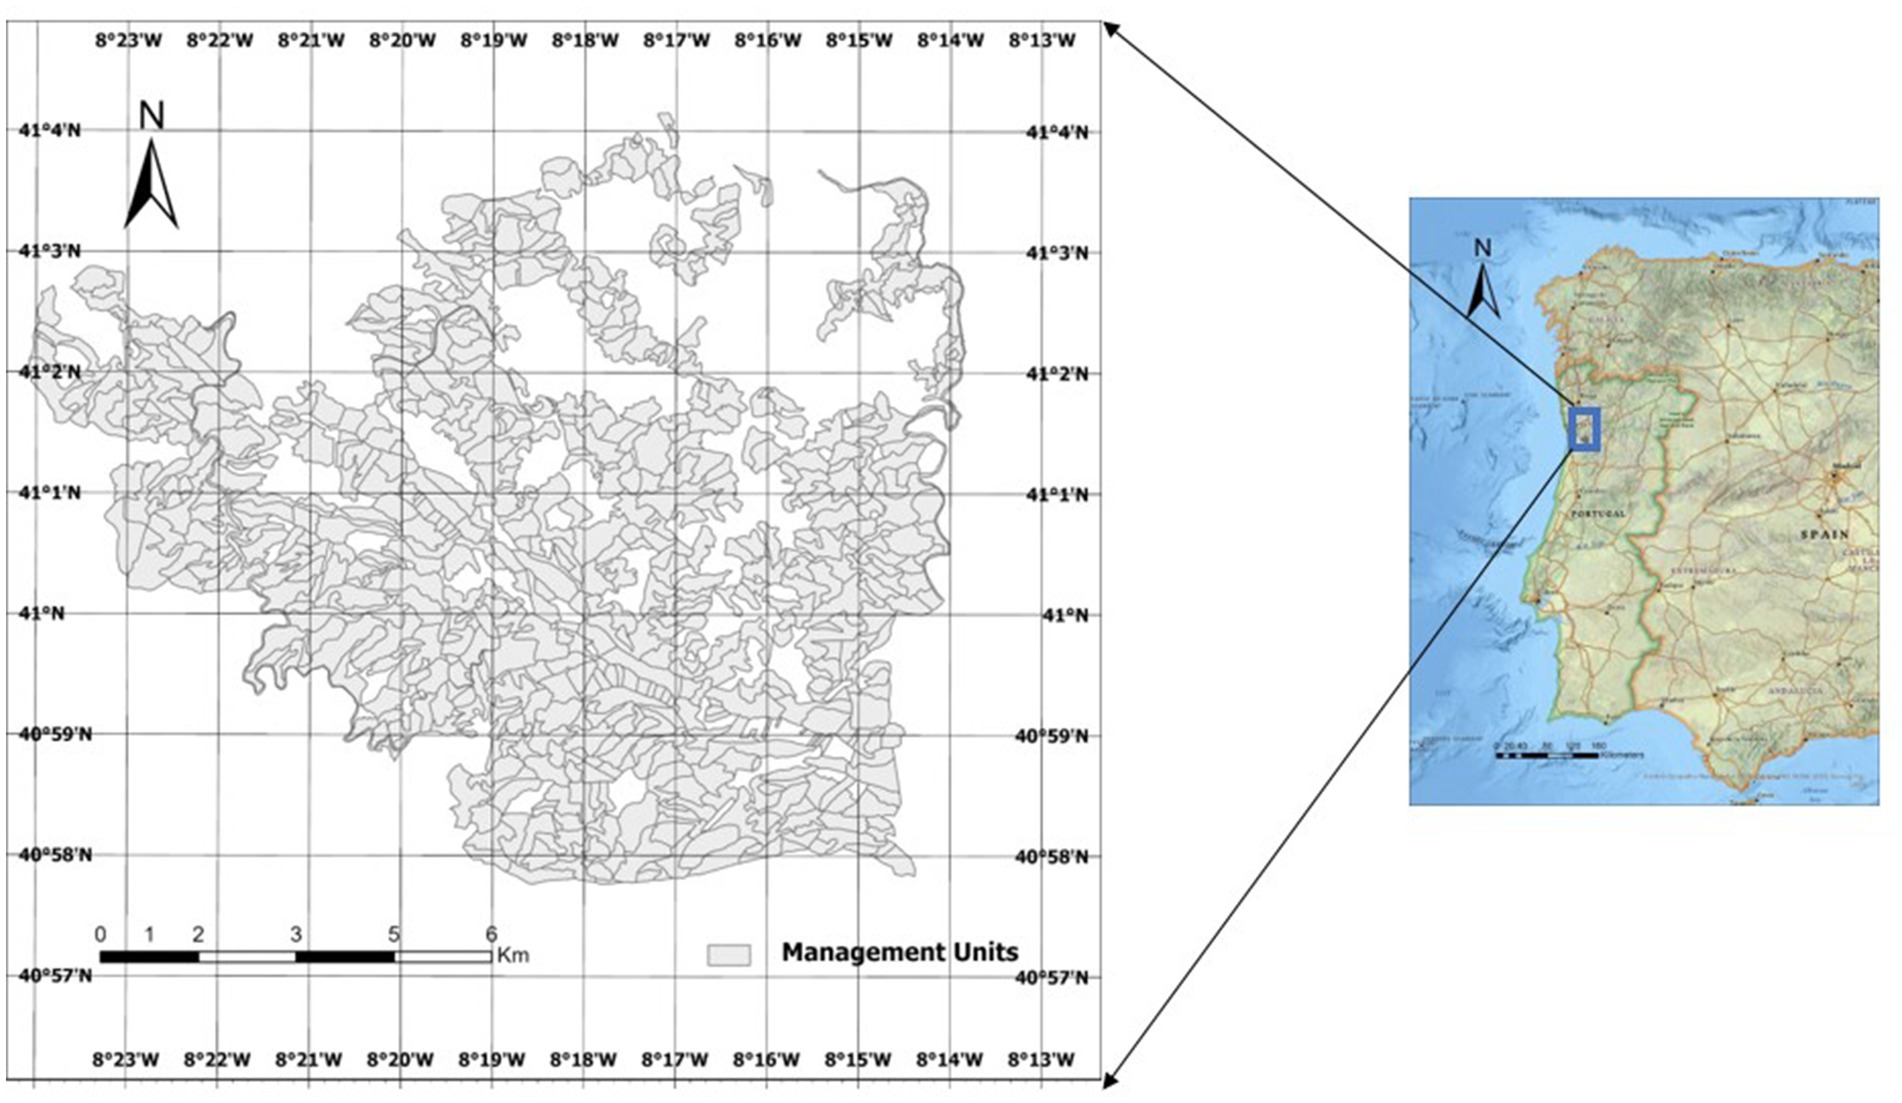
Figure 1. Location of the case study area.
2.2 Forest management prescriptions, simulations, and ecosystem services estimation
The 686 homogeneous land units were assigned to different management prescriptions based on a forest inventory coordinated by the authors and conducted by the Forest Owner Association [Associação Florestal de Vale do Sousa (AFVS)], an association responsible for the development of a joint management plan for the forested landscape. The definition of the silvicultural options to be considered when simulating prescriptions that can be used to manage each homogeneous unit was made in cooperation with AFVS. This involved the definition of rotation ages, thinning regimes, shrub cleaning periodicity, and cork oak extraction schedules (only for cork oak). Specifically, according to AFVS, eucalypt stands are to be managed through coppicing, encompassing three cutting cycles, each cycle spanning over 10 to 12 years. Rotations of pine and chestnut stands extend from 40 to 55 years and from 35 to 50 years, respectively, and include different levels of thinning intensity. Pedunculate oak (Quercus robur L.) management includes clear-cut ages from 40 to 60 years, along with different thinning ages and intensities. Cork oak silviculture involves thinning at different ages, without harvesting options. In the case of homogeneous units with eucalypt and pine, the prescriptions also include species conversion options, e.g., conversion to maritime pine (from eucalypt), chestnut, cork oak, or pedunculate oak. Bare land units may be converted into pure maritime pine stands, pure pedunculate oak stands, pure chestnut stands and pure cork oak stands. The landscape includes riparian buffers along water streams. All possible management prescriptions, including harvesting ages and species conversion options, have been identified through collaborative discussions sponsored by AFVS with relevant stakeholders. The combination of management alternatives and land units resulted in a total of 47,448 prescriptions.
The study focuses on six ecosystem services or indicators thereof: wood, cork, carbon, biodiversity, fire resistance and soil erosion. Wood and cork are examples of provisioning services. Carbon stock is considered as an indicator for the climate regulation service, while fire resistance and soil erosion are among the indicators of regulatory services. Furthermore, biodiversity stands as the foundational element underpinning all these services.
Several approaches were employed for estimating these ecosystem services. Specifically, growth models and simulation tools were used to estimate wood and cork production and carbon stocks (Marques S, et al., 2021). Other ecosystem services were estimated using the approaches by Ferreira et al. (2015; fire resistance), Rodrigues et al. (2021; soil erosion), and Botequim et al. (2015; biodiversity). In summary, a wildfire resistance indicator, crafted by Ferreira et al. (2015), was used to gauge the vulnerability of forest stands to wildfires. This indicator integrates wildfire occurrence and damage models developed for the most important forest species in Portugal (Ferreira et al., 2015). It considers further spatial information such as the configuration of the stand as well as stand adjacency relations (Ferreira et al., 2015). The values of this indicator range from 1 (low resistance) to 5 (highest resistance). For soil erosion assessment, the methodology (Rodrigues et al., 2021) considers the yearly fluctuations in the cover-management factor (C) within the Revised Universal Soil Loss Equation (RUSLE) to estimate the annual soil loss. The C factor is a function of average crown diameter and other biometric characteristics of the stand. The biodiversity indicator considers the tree species composition (e.g., maritime pine, eucalypt, chestnut, pedunculate oak, cork oak, and riparian trees), stand age, and understory coverage (Botequim et al., 2015). The biodiversity score ranges from 0 (indicating minimal biodiversity or barren land) to 8 (representing the highest level of biodiversity). The reader is referred to Ferreira et al. (2015), Rodrigues et al. (2021), and Botequim et al. (2015) for further detail about these indicators.
The stand and landscape level values of the aforementioned ecosystem services indicators were estimated for a 50-year planning horizon, subdivided into five planning periods of 10 years each.
2.3 The optimization model
This research considered a Model I (Johnson and Scheurman, 1977) integer problem formulation, with an integer decision variable Xjkp (which takes the value 1 if prescription p (1, 2, …, P) is assigned to species k (1, 2, …, K) in stand j (1,2, …, J) and 0 otherwise). The equations that characterize the optimization problem:
Where,
J: Set of stands (j = 1,2,3, …, 686 stands).
K: Set of species (k = 1,2, …, 6 tree species).
T: Set of periods in the planning horizon (t = 1, 2, …, 5).
P: Set of management schedules (prescriptions).
Xjkp: binary decision variable which takes the value 1 if prescription p (1, 2, …, P) is assigned to species k (1, 2, …, K) in stand j (1,2, …, J) and 0 otherwise.
TWOOD: the total wood production over the planning horizon.
VTHINkt: Volume of wood from thinning of species k in period t.
VHARVkt: Volume of wood from harvesting (clearcutting) of species k in period t.
Thinjkpt: Volume of thinning of species k in stand j in period t where prescription p is applied.
Hjkpt: Volume of wood from harvesting species k in stand j in period t where prescription p is applied.
CARB: Average carbon stock over the planning horizon.
Ckt: Carbon stock of each species k in period t.
Cjkpt: Carbon stock in period t that results from applying prescription p on species k in stand j.
CORK: Total amount of cork produced over the planning horizon.
Corkt: Cork produced in period t.
Zjkpt: Cork produced in period t that results from applying prescription p on species k (in this case Cork species) in stand j.
EROSION: Total soil erosion (in ton) over the planning horizon.
erosionkt: total soil loss in period t from stands covered by species k.
Fjkpt: soil loss in period t that results from applying prescription p on species k in stand j.
FIRE: The average fire resistance indicator in the planning horizon.
Raitkt: The total fire resistance indicator from species k in period t.
Rjkpt: Fire resistance indicator in period t that results from assigning prescription p to species k in stand j. Values range from 1 (less resistance) to 5 (highest resistance).
BIOD: The average biodiversity score in the planning horizon.
Biokt: The total biodiversity score from species k in period t.
Bjkpt: Biodiversity indicator in period t that results from assigning prescription p to species k in stand j. Values range from 0 (bare land or no biodiversity) to 8 (highest level of biodiversity).
ajk: area (in ha) covered by each species k in stand j.
A: Total area of the landscape (ha).
Equation 1 represents the total wood production from all species over the planning horizon. This is computed by adding Equation 2 (volume from thinning) and Equation 3 (volume from clear-cuts). The last equation (Equation 14) is used to ensure that a stand (and any species in a stand) is assigned only to one prescription over the planning horizon. The remaining equations represent the provision of other ecosystem services: carbon (Equations 4, 5), cork (Equations 6, 7), erosion (Equations 8, 9), fire resistance (Equations 10, 11), and biodiversity (Equations 12, 13).
The equations above define the integer program resource capability model used to generate the Pareto frontier of the forested landscape. The latter depicts trade-offs among ecosystem services such as wood (TWOOD), cork (CORK), biodiversity (BIOD), carbon stock (CARB), fire resistance (FIRE), and erosion (EROSION). The provision of the first five is to be maximized while erosion is to be minimized.
2.3.1 Wood flow constraints
The total wood production across consecutive periods was regulated by constraining the model
where TWOODt is the total wood production in period t, and is the allowable fluctuation in percentage (20–25% was considered for the current case study).
2.3.2 Formulation of the adjacency constraints
The adjacency constraint limits the size of clear-cut areas resulting from the harvesting of contiguous (adjacent) stands. We limit the maximum clear-cut area to not exceed 50 ha (as declared by the Portuguese law for the Integrated Management System for Rural Lands). The path algorithm proposed by McDill et al. (2002) was used to generate the corresponding Area Restriction Model (Murray, 1999). The algorithm starts by defining a binary variable Yjt, for each stand which takes a value 1 if it is to be harvested in period t and a value 0 if not. In order to apply the algorithm to our problem, this binary variable was created as a function of the original decision variable Xjkp using Equation (Equation 17) for pure stands and Equations (Equations 18, 19) for mixed stands:
where hjpt is a parameter that takes the value one if the assignment of prescription p to stand j involves a clear-cut in period t. Equations 18, 19 stipulate that clear-cutting is considered only to stand j if all its species are subject to clear-cutting in the same period.
Afterwards, the path algorithm proceeds with the enumeration of minimal infeasible clusters C ∈ A+ (A+ is a set of all minimal infeasible clusters, i.e., infeasible clusters that would become feasible if one stand is excluded from it) and prohibits cutting of contiguous stands exceeding the harvest limit, i.e., 50 ha:
Where|C| is the number of stands in the cluster.
Python code (Python version 3.11) was developed to enumerate minimally infeasible clusters (Appendix I). Respective equations (constraints) were generated for the whole case study area.
2.4 Decomposition approach and the generation of Pareto frontier
The large number of adjacency constraints (176,955) complicates the process of generating the Pareto frontier. Initial attempts aimed at solving a single objective problem (e.g., wood) did not produce an optimal solution even after 24 h. To address computational complexity issues, a strategy was implemented that involved subdividing the problem. A first try involving just two sub-problems had negligible impact on the computational complexity. Hence, the problem was partitioned into four sub-areas (Figure 2), named East Paiva_1, East Paiva_2, West Paiva_1 and West Paiva_2.
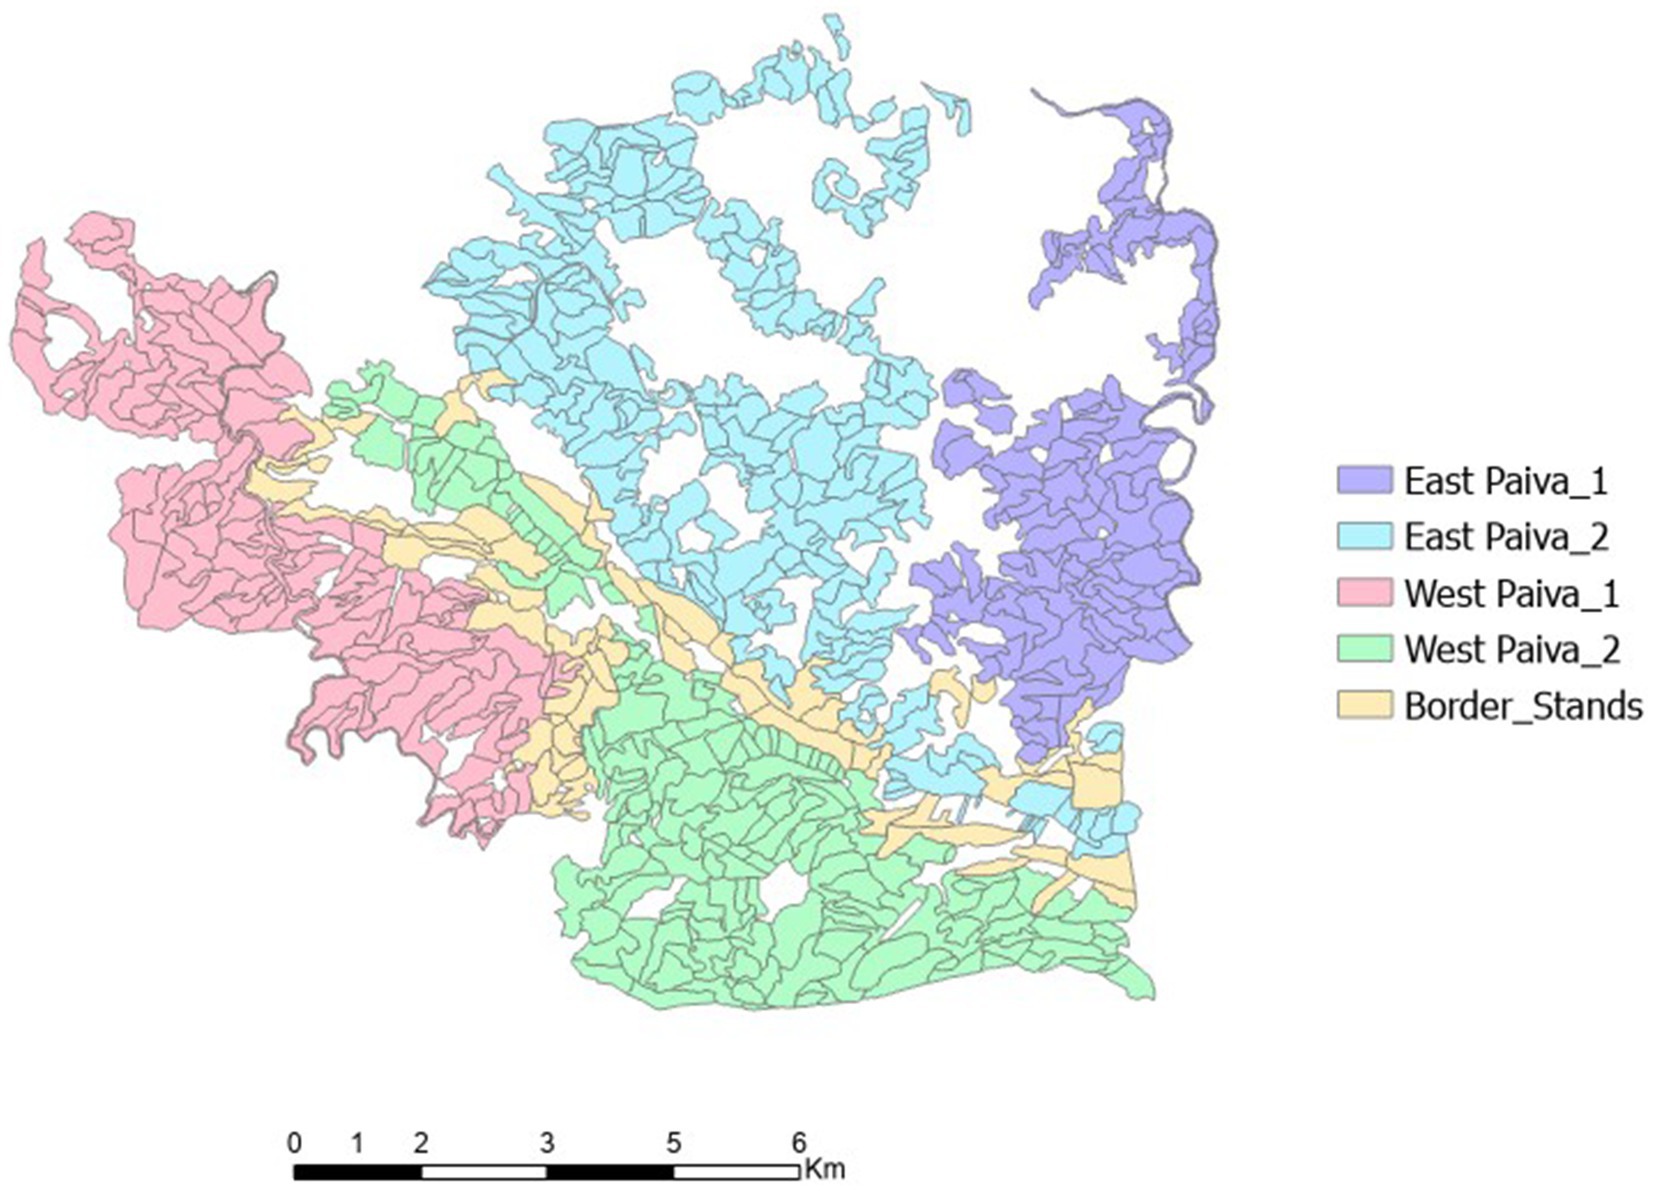
Figure 2. The four sub-areas and the border stands (stands bordering the sub-areas).
The sub-areas were created using ArcGIS, ensuring that the number of stands in each sub-area was roughly equal. Besides, efforts were made to minimize the number of stands bordering the sub-areas. This was done by selecting a boundary line that touched as few stands as possible. Nevertheless, to prevent the violation of the adjacency constraint along the border between the sub-areas, stands adjacent to this border were first removed from the sub-area problem and included in the set of border stands (Figure 2).
Two different models were used for generating the Pareto frontier for each sub-problem. The first only considered Equations 1–16 while the second added the adjacency constraints, Equations 17–20. The frontier was generated using the approach outlined in Borges et al. (2017) and Marques S, et al. (2021). Each Pareto frontier provided information about the trade-offs between the criteria, which corresponds to the levels of provision of ecosystem services, e.g., wood, cork, carbon stock, biodiversity, fire resistance, and soil erosion, in the corresponding sub-problem. Afterward, we proceeded with the selection of points in each frontier, i.e., the selection of ecosystem service values to be provided by each sub-problem that included adjacency constraints. Points representing the Pareto frontier for each sub-problem were selected purposively to maintain consistency among sub-problems. These points aimed to approximate the average between the maximum and minimum values of the ecosystem services indicators. Achieving this consistency involved leveraging the tool used to generate the Pareto frontier, which provided minimum and maximum achievement levels for the optimized criteria. For each sub-problem, the tool retrieved these minimum and maximum values of the optimized criteria. From this range, a point positioned at (Max – Min) /2 was selected. The corresponding management plans were then used to constrain the models representing the border sub-problem. Specifically, we eliminated from the latter the stand-level prescriptions that had an adjacency conflict with the prescriptions in those management plans. We then developed a Pareto frontier for the border sub-problem (Equations 1–20). Within all four sub-problems, the wood flow constraint allowed a 20% variation between consecutive periods (refer to Equations 15, 16). However, to maintain the feasibility specifically for the border sub-problem, adjustments were made to the wood flow constraint.
2.5 The Edgeworth–Pareto hull (EPH) and its approximation
The approach we followed to generate the Pareto frontier involved approximating the actual Edgeworth–Pareto hull (EPH). The EPH is the envelope or boundary formed by the set of solutions that are not outperformed by other solutions. In integer optimization problems, it is important to note that the non-dominated points forming the EPH may not necessarily form a convex hull (Marques S, et al., 2021). As a result, there is a need to approximate the EPH with a surrogate Edgeworth–Pareto hull (cEPH; see the visual illustration in Figure 3). The cEPH serves as an approximation of the non-convex EPH, allowing for a more tractable representation. In our research, we conducted an assessment of the accuracy of this approximation technique, evaluating how well the cEPH represents the original EPH. For this purpose, the retrieval and comparison of the values was done for six randomly selected points (just for the sake of illustration) representing different levels of the optimized criteria. Moreover, we also analyzed the impact of problem size (e.g., number of stands and decision variables) and complexity (e.g., with and without adjacency constraints) on the accuracy of the generation of the Pareto frontier.
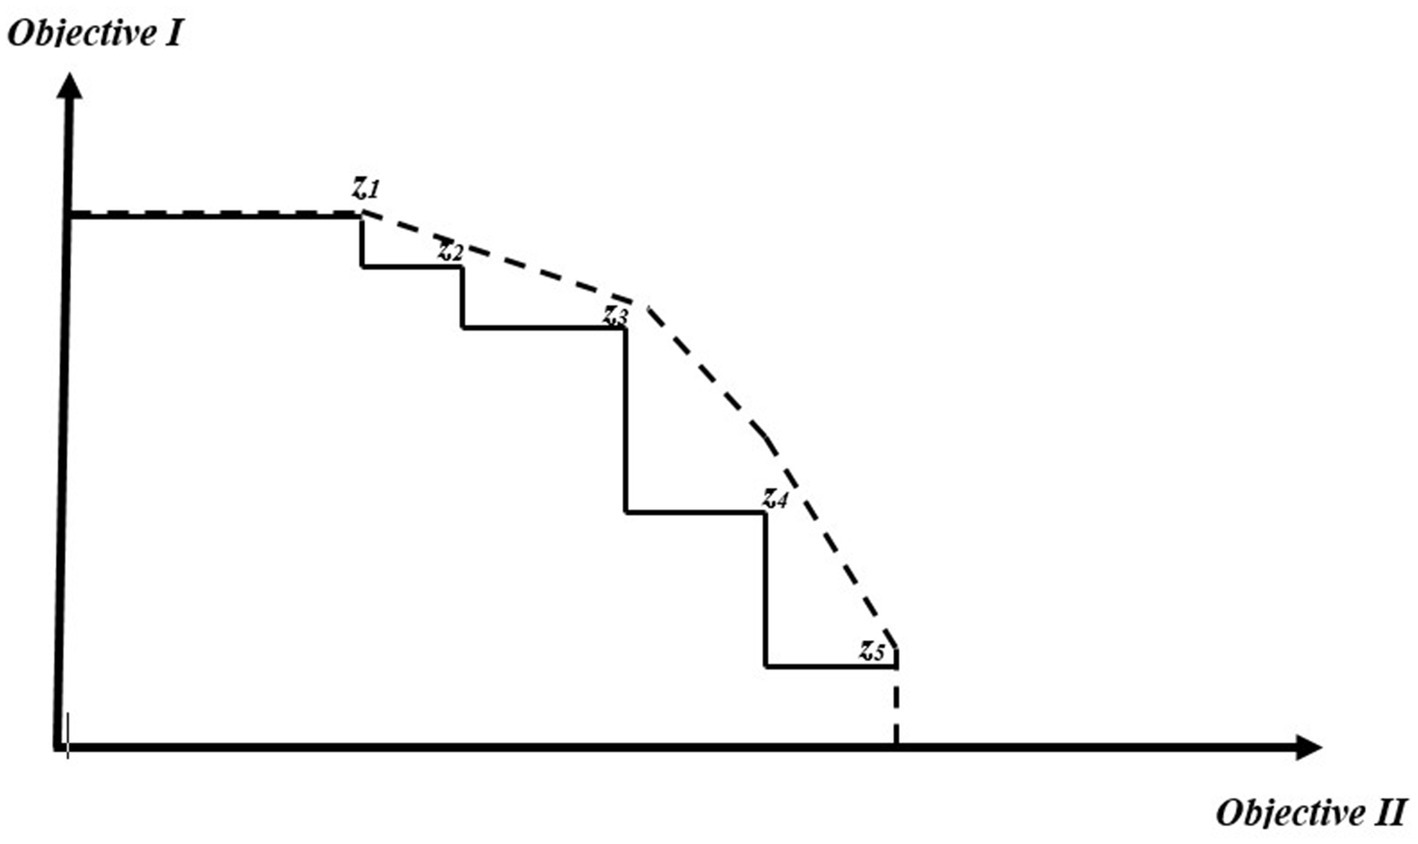
Figure 3. Visual illustration of the actual Pareto frontier (EPH), indicated in solid line, and the approximated surrogate frontier (cEPH), indicated in dashed line when two objectives are being optimized. The points (Z1–Z5) represent Pareto optimal integer solutions (Modified from Marques S, et al., 2021).
The computations were performed on a personal computer with an Intel® Core™ i7-4790 processor with a 3.6 GHz frequency and 20 GB memory, using the CPLEX(R) Interactive Optimizer 12.6.3.0.
3 Results
3.1 Pareto frontier for sub-problems
By dividing the larger problem into sub-problems, it was possible to generate the Pareto frontier of each of the four sub-problems even for the case where they included adjacency constraints (i.e., the maximum harvest patch size). The frontiers depicted trade-offs among the optimized objectives: Total wood (TWOOD), Cork (CORK) carbon stock (CARB), erosion (EROSION), fire resistance (FIRE) and biodiversity (BIOD). The mean generation time for sub problems with adjacency constraints extended over 1,271 s, while the mean generation time was about 340 s if no adjacency constraints were considered (Table 1). This is a significant improvement given that it was not even possible to generate Pareto frontier for the whole landscape without subdivision. The effect of constraints on generation time was more pronounced for problems with more decision variables (Table 1).
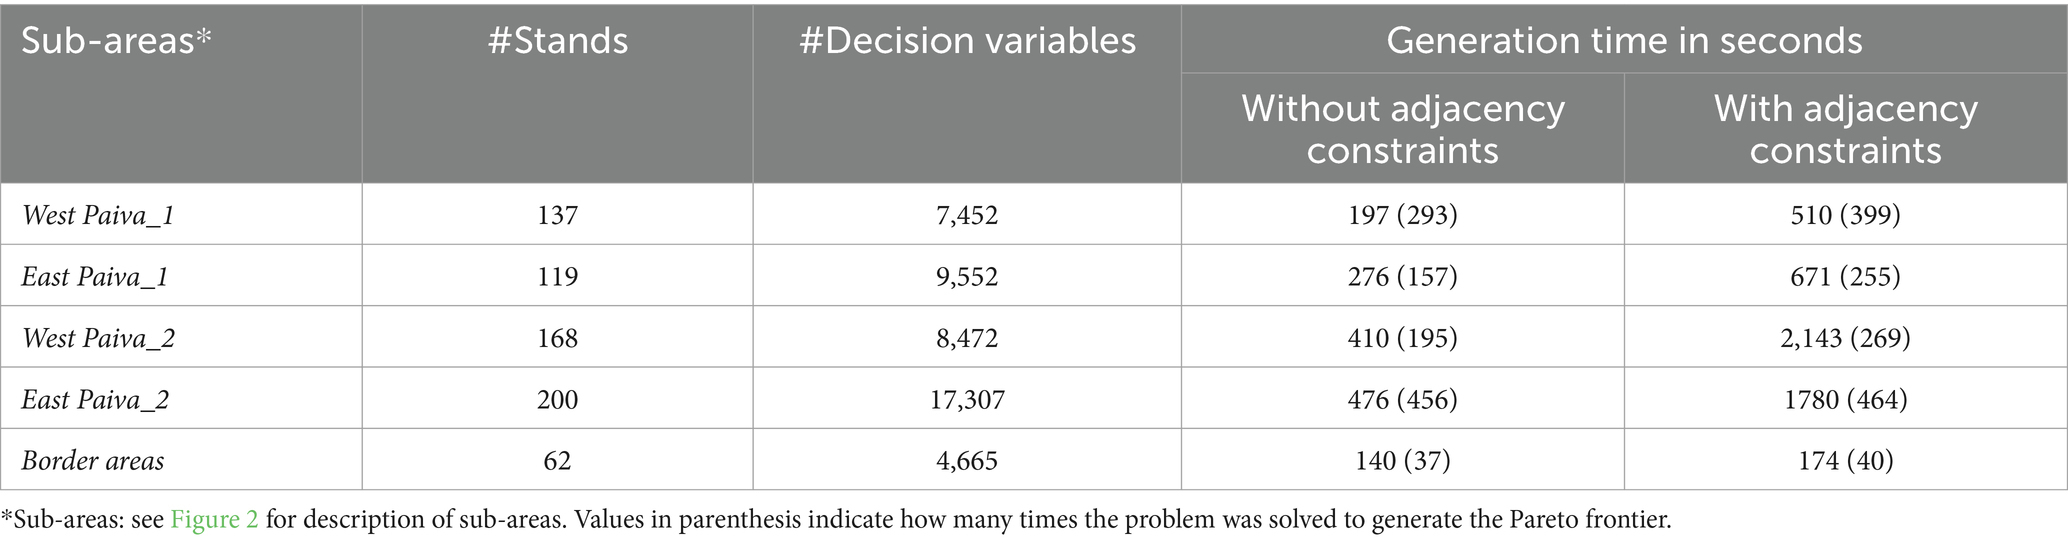
Table 1. Problem size and Pareto frontier generation time for the four sub-areas and border problem.
The tool we have used to build the Pareto frontier is capable of generating a variety of decision maps, depending on the number of criteria (ecosystem services indicators) under optimization. The challenge arises when trying to effectively convey these maps to readers, especially when dealing with more than three criteria. In our current study, we created a six-dimensional set of decision maps for a specific sub-problem, illustrating trade-offs among all six criteria (i.e., levels of provision of the ecosystem services; Figure 4). Within the six-dimensional map, each segment or section reflects varying values of the fire resistance indicator (displayed horizontally) and biodiversity score (displayed vertically). A specific segment or set of decision maps, based on a combination of fire and biodiversity values, highlights the trade-offs between carbon and timber at different levels of soil erosion (represented by different colors, each associated with a decision map). These decision maps show that an increase in timber production is associated with a reduction in carbon stock, particularly at higher levels, illustrating the trade-offs involved.
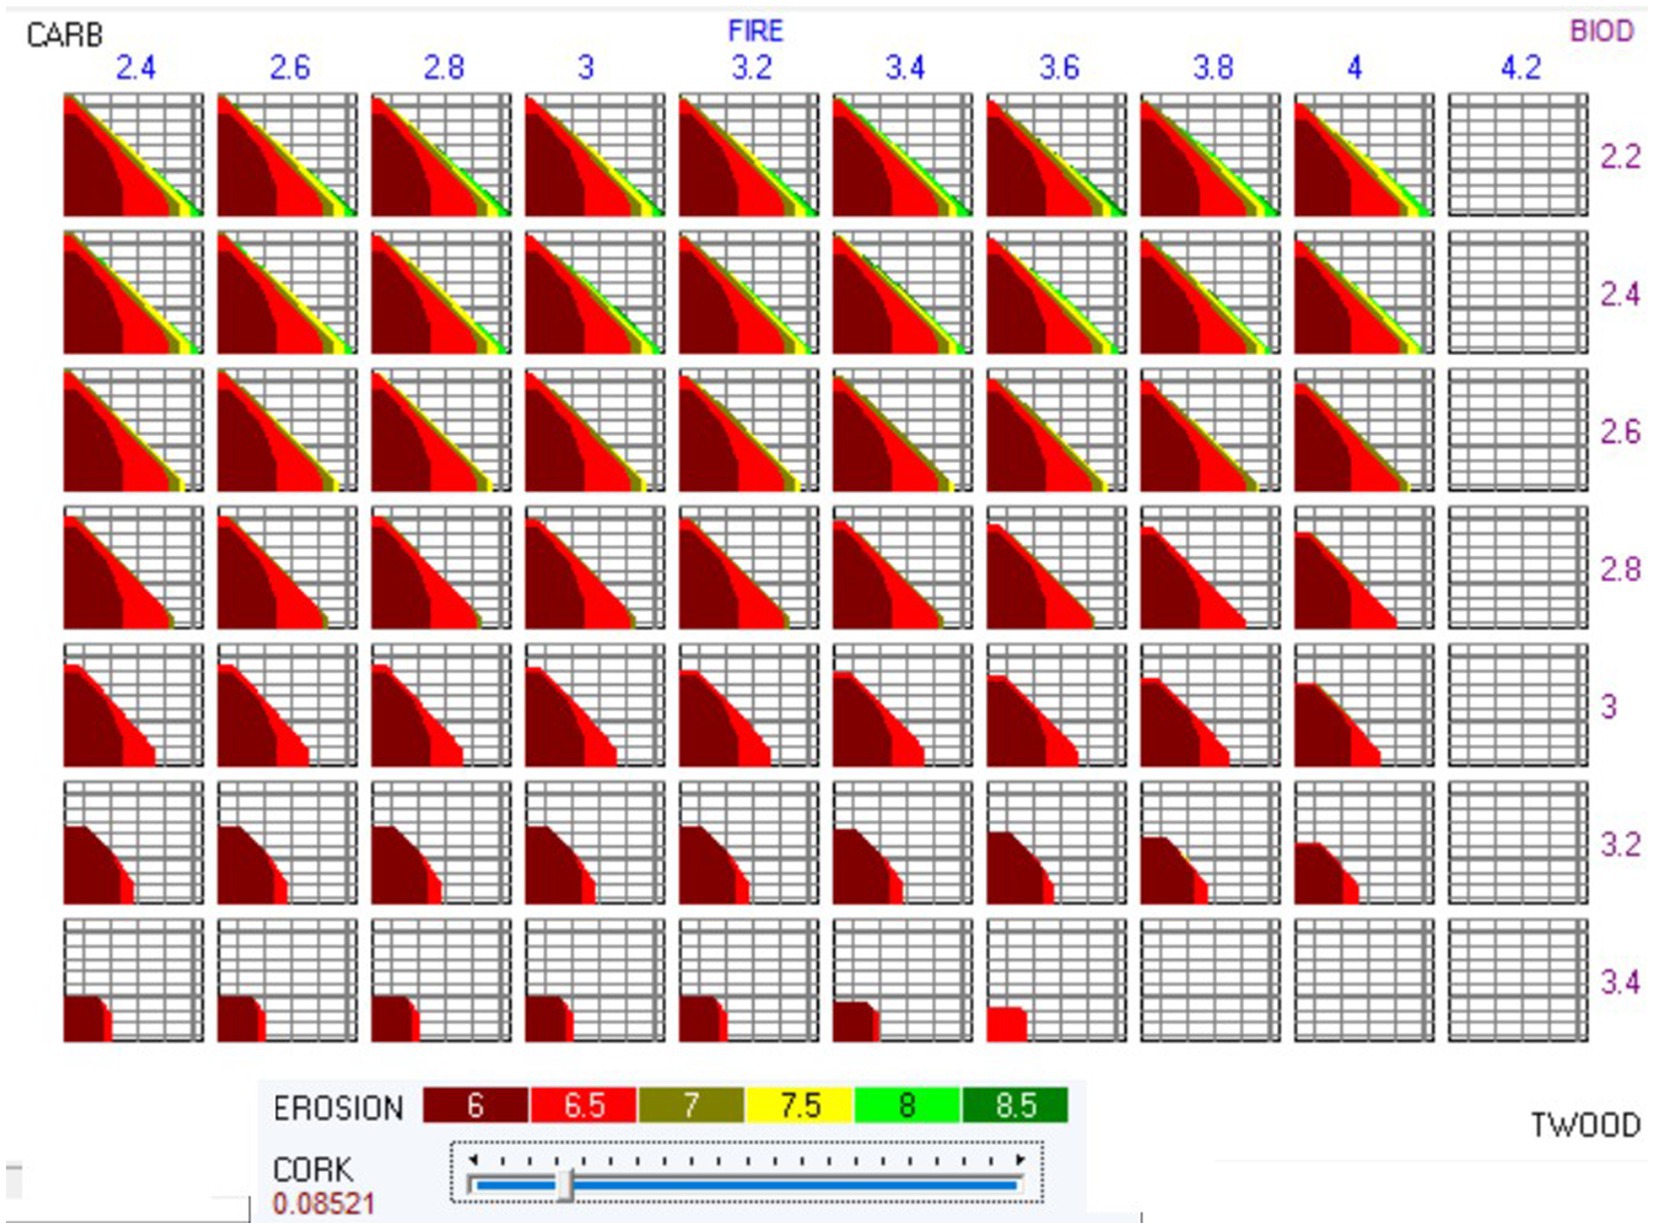
Figure 4. Six dimensional set of decision maps, Pareto frontier, showing trade-off among ecosystem services, for the West Paiva_2 sub-area. TWOOD: total amount of wood harvested and thinned (106 m3); CARB: carbon stock (104 ton); EROSION: the total soil erosion (106 ton); FIRE: the average fires resistance indicator (value range from 1 to 5); BIOD: the average biodiversity score; CORK: the total cork production (106 arrobas. Arroba = 14.7 kg).
To enhance readability and comprehension, subsequent interpretation and discussion of results for each sub-problem were conducted using three-dimensional decision maps, focusing on three ecosystem services (Figures 5A–D). The Pareto frontier, along with the associated decision maps for the four sub-problems, highlight the trade-offs between ecosystem services in each sub-problem (Figures 5A–D). The optimized criteria present a range of minimum and maximum values that vary across these sub-problems, likely attributable to differences in the total land area. Despite an overall similarity in trade-off patterns among the sub-problems, some disparities are noticeable between the East and West Paiva sub-problems (Figures 5A–D). Notably, the Eastern sub-problems (5A and 5B) exhibit a relatively steeper slope in the trade-off compared to their Western counterparts (5C and 5D), particularly at a higher level of the optimized criteria.
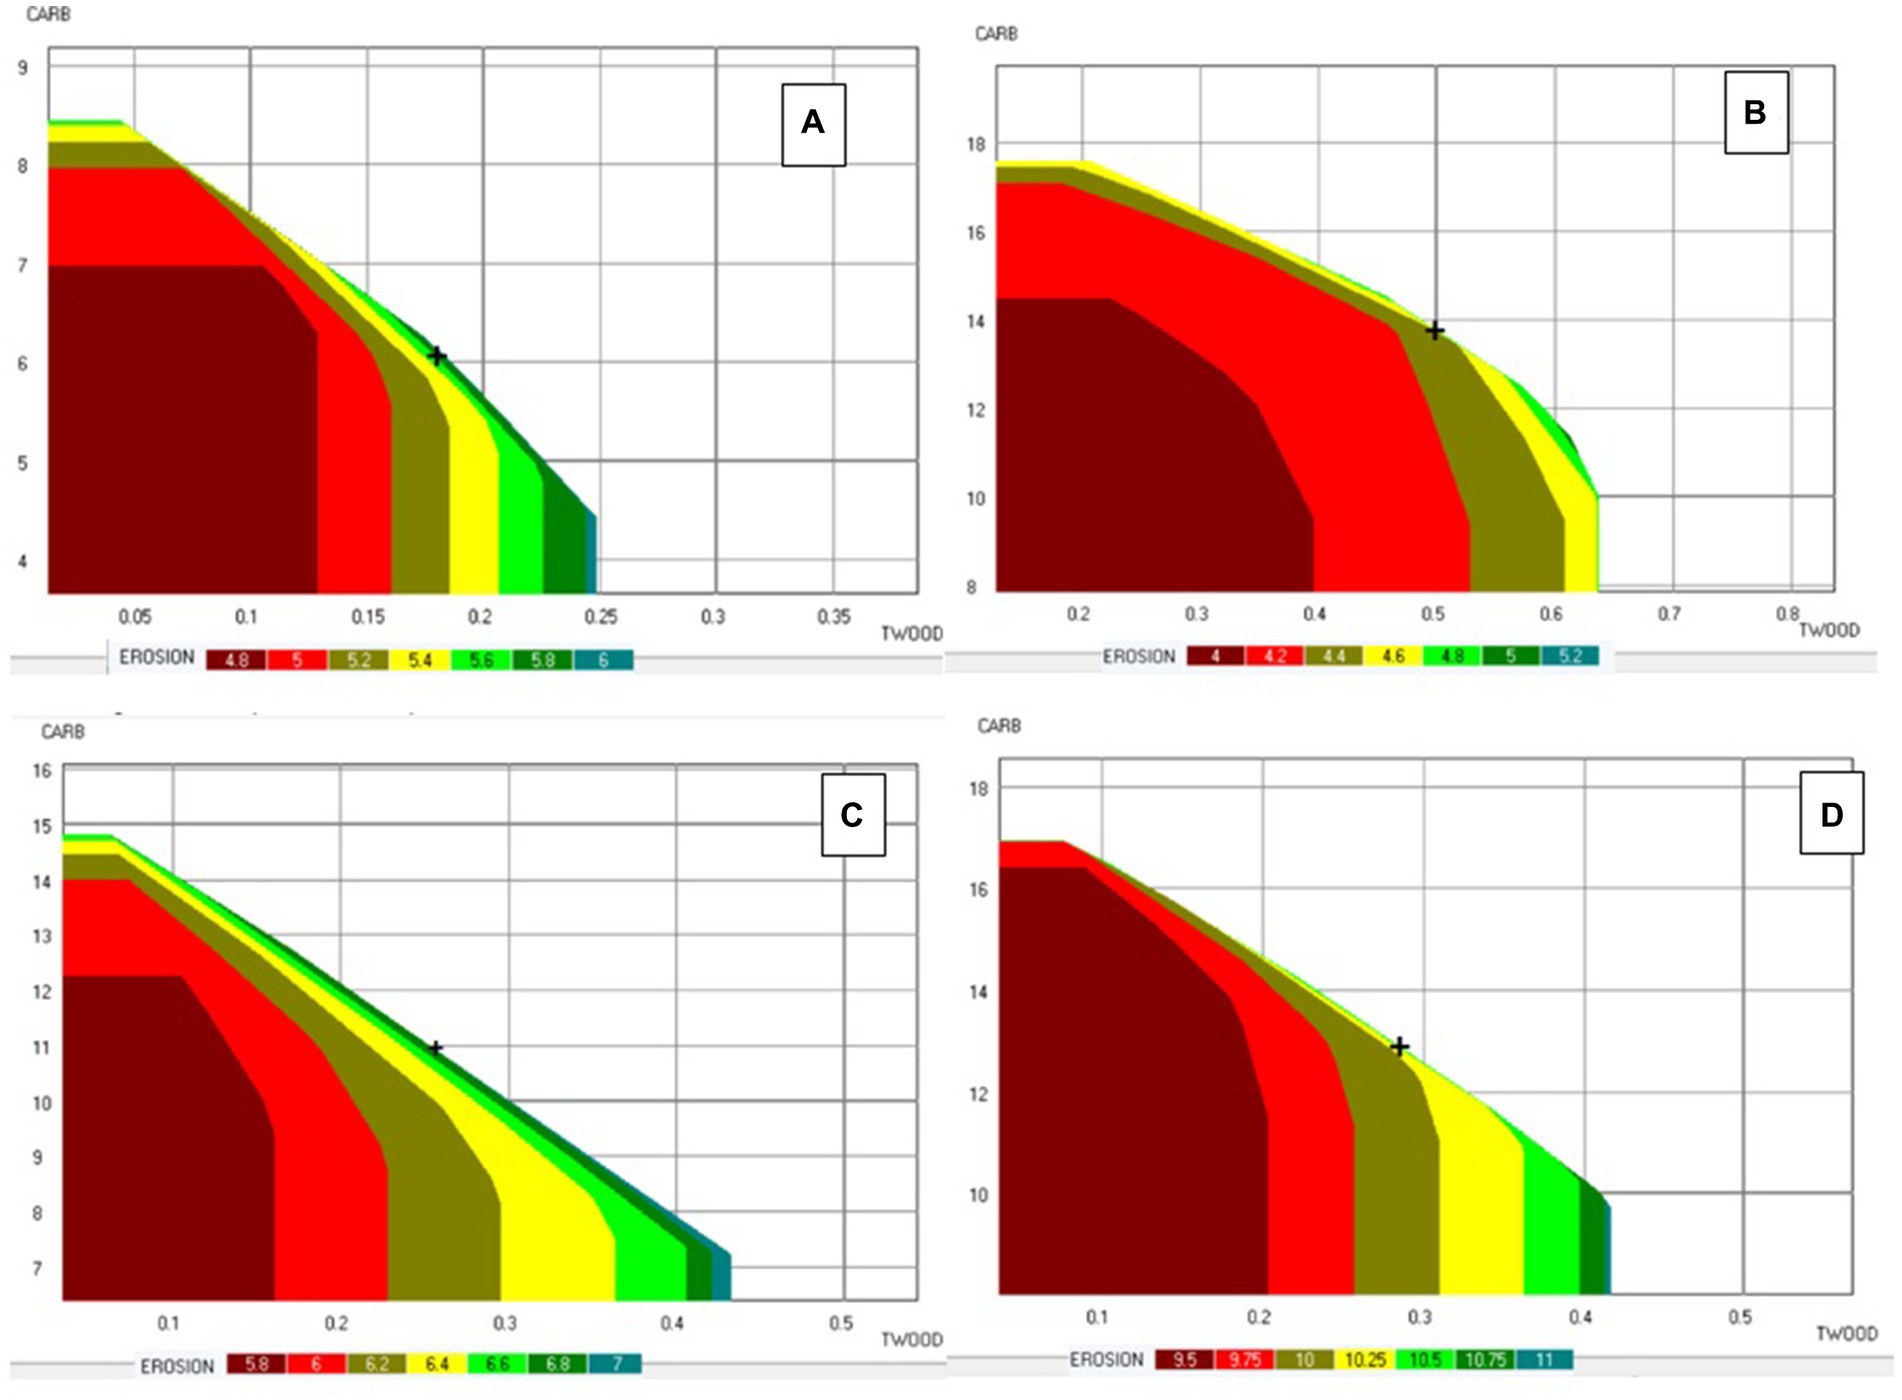
Figure 5. Pareto frontier showing trade-offs between three ecosystem services in the case of East Paiva_1 (A), East Paiva_2 (B), West Paiva_1 (C) and West Paiva_2 (D). TWOOD: total amount of wood harvested and thinned (106 m3); CARB: carbon stock (104 ton); EROSION: the total soil erosion (106 ton). NOTE: the levels of other ecosystem services (e.g., BIOD, FIRE) are fixed.
3.2 Pareto frontier for the border problem: addressing the adjacency conflicts between sub-problems
Selection of a single point from the Pareto front of each sub-problem was undertaken, with these points indicated by a ‘+’ sign in Figures 5A–D. These points represent approximate average (of maximum and minimum) values of each optimized criterion (Table 2). From these points, solutions, i.e., management plans were derived and used to generate the Pareto frontier for the border problem. The latter encompasses all stands in the landscape and yet considers only decisions to be made in the stands along the border (Figure 6). All other stands are to be managed according to the solutions to the four earlier sub problems.
Table 2. Values of the optimized criteria in each of the solutions selected from the four sub-problems.
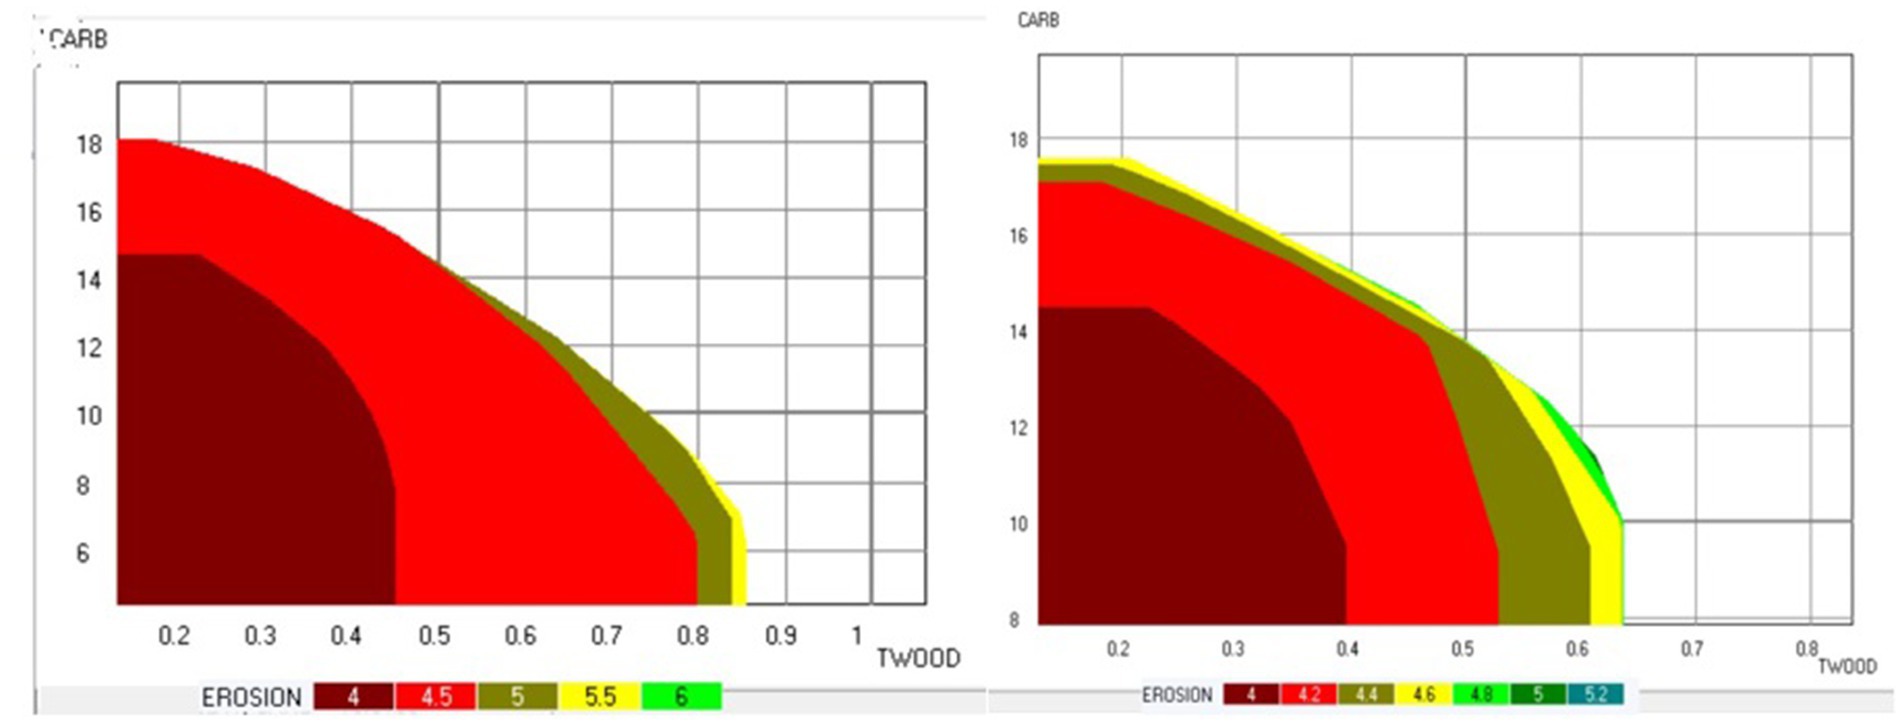
Figure 6. Pareto frontier showing trade-offs between ecosystem services in the case of the East Paiva_2 sub-area, without (left) and with (right) adjacency constraint. TWOOD-total amount of wood harvested and thinned (106 m3); CARB-carbon stock (104 ton); EROSION-the total soil erosion (106 ton). The values of fire resistance and biodiversity score were fixed at 3.6 and 2.6 in both decision maps.
Using this process, the decisions to be made in the stands along the border are constrained by the management plans selected for each sub-problem. As a result, out of the 4,665 alternatives available for these stands (Table 1), 883 were eliminated. The border Pareto frontier highlights thus the trade-offs among ecosystem services that result from the integration of the four management plans with the decisions to be made in the stands over the border (Figure 6).
3.3 Approximation of the EPH and its accuracy
Results show that a relatively larger discrepancy (larger difference-in the values of the optimized criteria-between the actual EPH and the surrogate cEPH) was observed when constraints were added to the larger sub-problem (East Paiva_2) compared to the no-constraint counterpart (Table 3). In the latter, the minimum and maximum percentages of discrepancy were 0 and 0.03 in the case of the EROSION criteria in point 1 and the case of the CARBON criteria in point four, respectively. On the other hand, when adjacency constraints were added to the problem, the minimum and maximum discrepancy percentages were 0.001 and 0.19, respectively, in the case of the value of the EROSION criteria in point one and the value of the CARBON criteria in point six. In both constrained and unconstrained problems, a higher discrepancy was observed in the case of the CARBON criteria, indicating the higher sensitive of carbon stock to changes in the number of decision variables or in the number of constraints as compared to other criteria such as wood production.
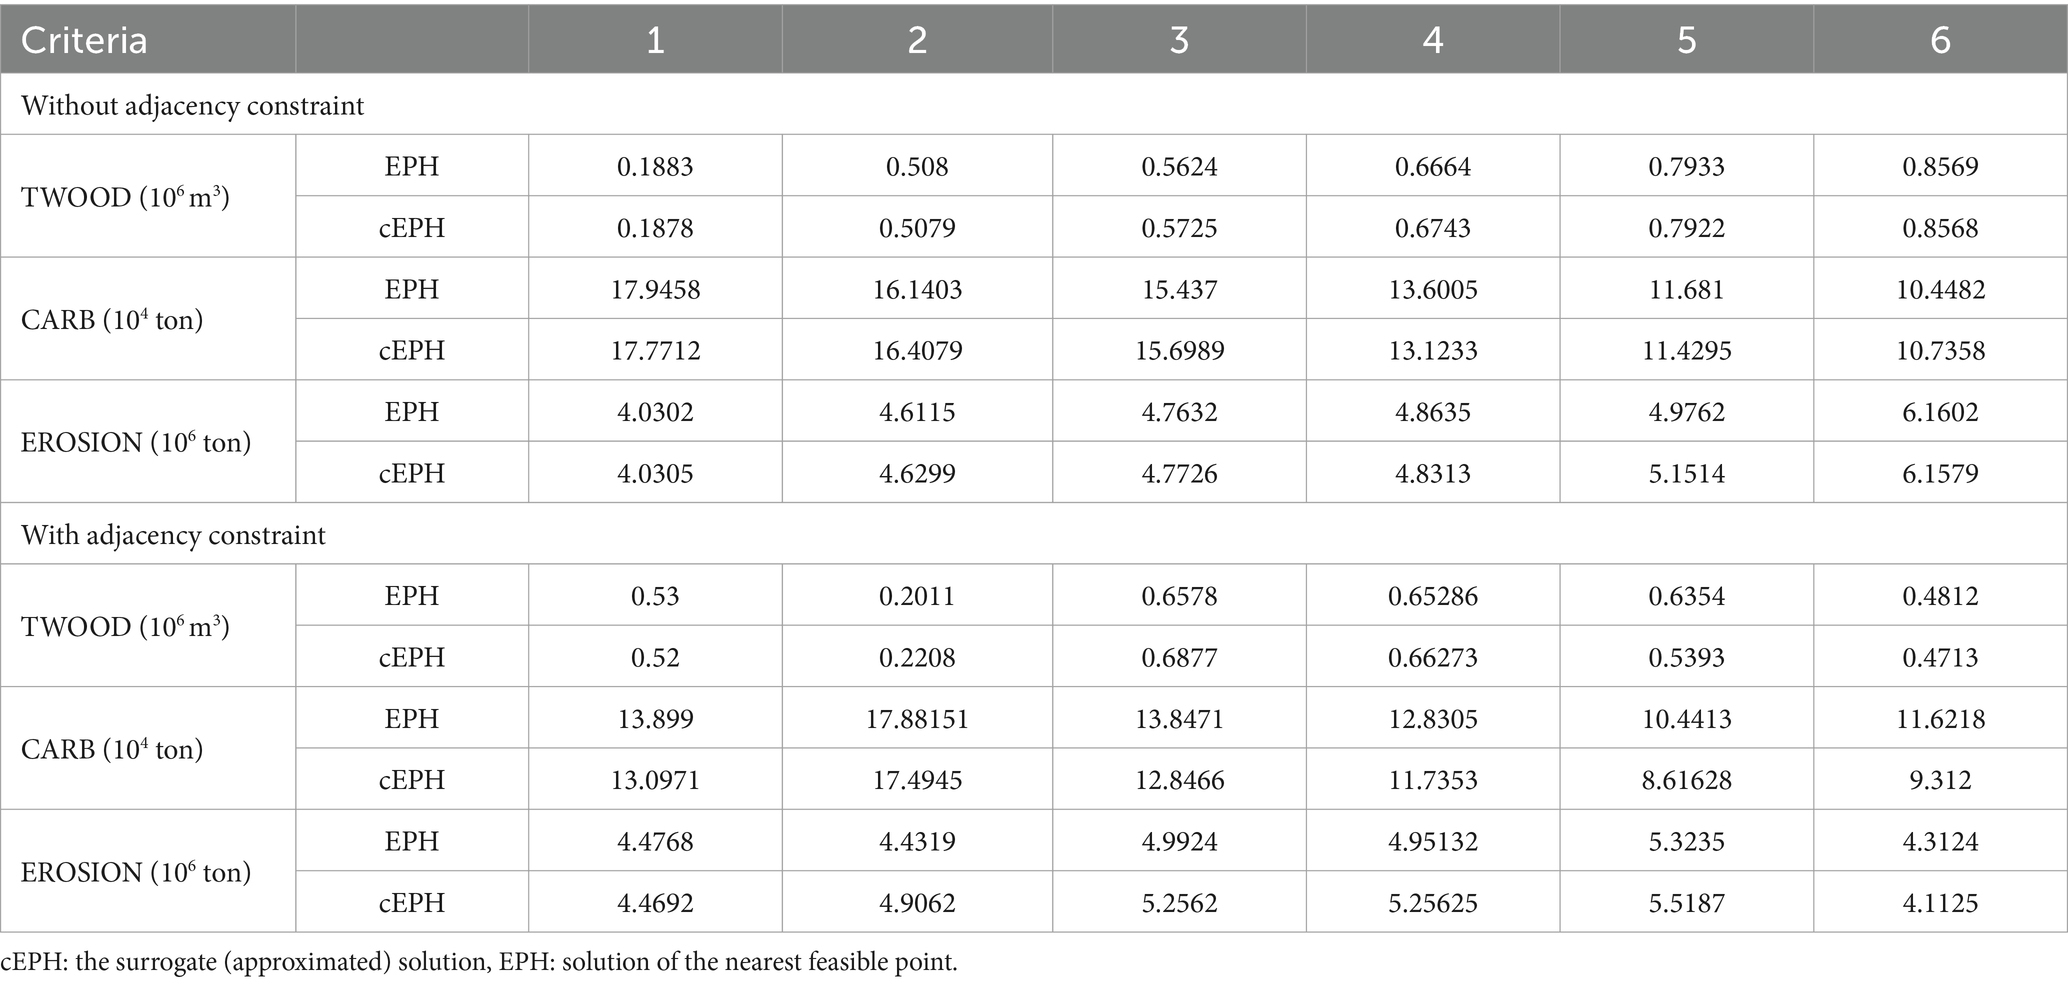
Table 3. Solution of EPH and cEPH retrieved from six random points for East Paiva_2.
To examine how sensitive the approximation is with respect to problem size, the discrepancy was also evaluated for the smallest sub-problem, East Paiva_1 (Table 4). It can be hypothesized that as the number of decision variables increases, the optimization problem becomes more complex, and it may be more difficult for the optimization solver to find the optimal solutions. With a higher number of decision variables, the number of possible combinations of the decision variables increases exponentially, making it more difficult to accurately generate the Pareto frontier curve. However, in this study, we did not find a significant difference in the discrepancies among solutions to the small and large problems.
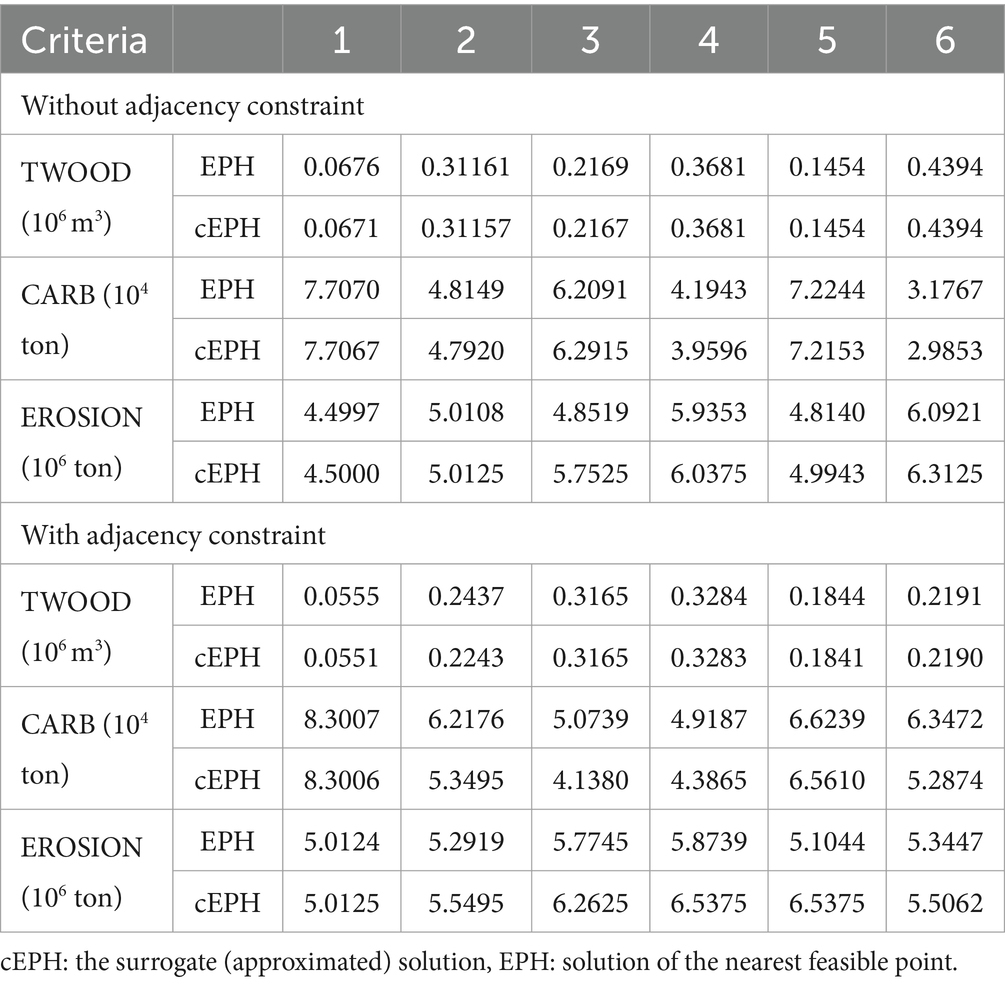
Table 4. Solution of EPH and cEPH retrieved from six random points for East Paiva_1.
This was also observed when we evaluated the discrepancy between the EPH and the cEPH solution for the border sub-problem, whose Pareto frontier was generated by retrieving solutions from the sub-problems. The result shows that the discrepancy between the actual feasible solution (EPH) and the one approximated by the Pareto frontier tool was very low (Table 5).
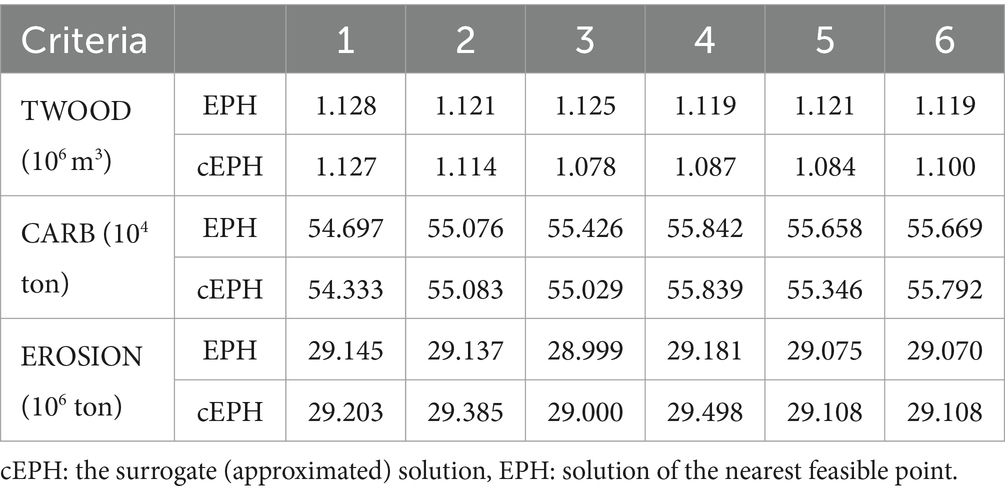
Table 5. Solution of EPH and cEPH retrieved from six randomly chosen points for the border sub-problem.
3.4 Impact of spatial constraint on ecosystem service trade-offs
In order to assess the potential influence of spatial constraints on trade-off curves and patterns, an in-depth analysis was conducted to scrutinize variations. This was done by taking the East Paiva_2 sub-area as an example and fixing the values of the fire resistance and biodiversity score at 3.6 and 2.6, respectively (basically the median values shown in the decision map) for both scenarios, i.e., with and without the adjacency constraints. Upon examining the resulting trade-off maps (depicted in Figure 7), a noteworthy observation emerged: the spatial constraint showed limited influence on trade-offs. Across both representations, the trade-off between carbon and wood quantity remained prominent, especially evident at higher levels of annual soil loss. This persistent trade-off signifies that the impact of the spatial constraint appeared to be minimal in altering this relationship.
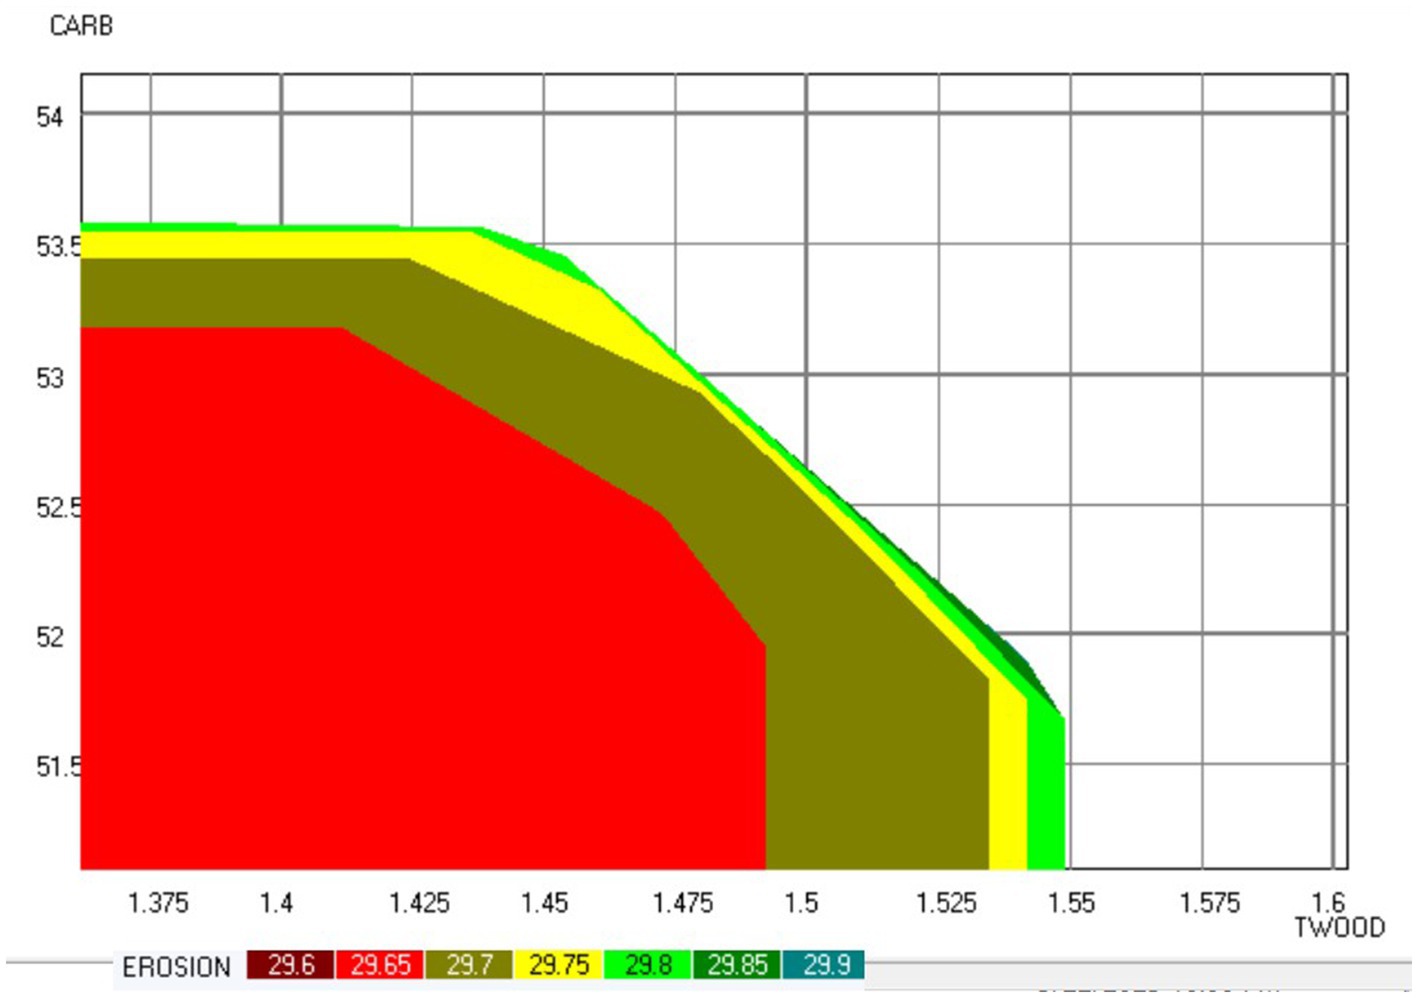
Figure 7. Pareto frontier showing trade-offs between ecosystem services in the case of the border sub-problem. TWOOD-total amount of wood harvested and thinned (106 m3); CARB-carbon stock (104 ton); EROSION-the total soil erosion (106 ton).
However, a clear consequence of the spatial constraint was identified: it impacted the ecosystem services provision possibilities. As expected, the constraint visibly restricted the range of attainable wood quantities. While the spatial constraint impacted negatively the wood production, it did not influence the broader trade-off pattern between carbon and wood quantity at any level of soil loss. Consequently, this analysis suggests that decision-makers retain the flexibility to set specific targets for ecosystem service achievements while remaining coherent with harvesting area constraints imposed by the spatial considerations.
4 Discussion
Decomposing large problems into some sub-problems has been a common approach for dealing with the computational difficulties of solving large optimization problems (e.g., Hoganson and Rose, 1984; Borges et al., 1999). The application of this approach to generate Pareto frontiers is, however, limited to a few studies; e.g., see Riffo (2020) and Marques S, et al. (2021). By following the approach proposed in Lotov (2015), the study of Marques S, et al. (2021) has shown the potential application of the decomposition approach for generating Pareto frontiers of multiple ecosystem services of a forest landscape. Our study extends these findings. It proposes an approach to address the fact that it is not computationally feasible to build the Pareto frontier of large landscape-level problems with adjacency constraints and that the decomposition approach proposed by Marques S, et al. (2021) is not capable of addressing adjacency across sub problems. The main success of this research is the demonstration that it is feasible to generate Pareto frontiers displaying the trade-offs between ecosystem services in the case of very large forest management problems that include adjacency constraints.
We opt for a comprehensive subdivision of the landscape-level problem, followed by a systematic workflow to generate the Pareto frontier for the entire landscape. This is achieved by incorporating the plans selected for each sub-problem and considering a restricted decision space for border stands. Specifically, this restriction entails the removal of management alternatives for border stands that are in conflict with the plans selected for the sub-areas. Though this approach may result in sub-optimal solutions, it effectively integrates spatial constraints into a Pareto frontier method. Despite sub-optimality (“sub-optimality” in our context refers to the compromise made in achieving the global optimal solution; given that our approach hinges on solving sub-problems individually, the final solution represents a compromise based on these sub-problem solutions), the study has illustrated how one can incorporate spatial constraints into a Pareto frontier method. Our approach may thus provide useful information on the trade-offs among different management objectives when adjacency conflicts are a concern. This in turn can be used to inform forest management decisions. By understanding the different trade-off patterns that emerge based on different management decisions, forest managers can make more informed choices about managing forest resources while complying with harvest regulations.
Previously, to the best of our knowledge, there are no results on the generation of Pareto frontiers when spatial constraints are included. Adjacency constraints pose a computational challenge to the analysis of trade-offs between ecosystem services. The approach implemented in the current study suggests that while ecosystem service supply possibilities may decrease as a consequence of the adjacency constraints, the trade-offs pattern themselves remain largely unaffected. This insight by our innovative approach underscores the importance of understanding how spatial considerations may impact those supply possibilities, while affirming the underlying trade-off patterns in multi-objective optimization scenarios. This insight may be useful to forest managers. It suggests that they might combine information provided by Pareto frontier approaches that ignore spatial constraints with information about the impact of the latter on supply possibilities provided by standard spatial optimization approaches (e.g., exact and heuristic (genetic algorithms, simulated annealing approaches) Baskent et al., 2020).
An important aspect that merits discussion is what are the advantages and disadvantages associated with our approach. On the one hand, our approach offers distinct advantages in cases where solving the entire landscape problem as a whole is computationally infeasible. For instance, even in the context of single-objective optimization, obtaining a solution for the entire landscape was often beyond the computational limits, requiring extensive computation times that exceeded 24 h. A vast body of literature has highlighted the large computational burden required to solve the resulting combinatorial optimization problems (e.g., Weintraub and Murray, 2006). Our study reaffirms this, shedding light on the computational complexity of the resulting mixed-integer problems, especially when one has multiple objectives.
To address this computational bottleneck, we proposed to break down the master problem into more manageable sub-problems. However, grappling with spatial constraints complicates this straightforward decomposition. Merely segmenting the problem and solving them independently poses challenges, primarily because these sub-problems share units or variables, potentially intertwining their solutions. There is no guarantee that solving one sub-problem adheres to the global spatial constraint, complicating the aggregation of solutions. Recently, Meselhi et al. (2022) delved into optimization strategies, proposing a decomposition approach involving overlapping sub-problems sharing certain variables. Their methodology tackled these sub-problems independently, employing three strategies-information sharing, mean value adaptation, and random selection-for handling overlapping variables. However, their approach does not seamlessly align with multiple objective optimizations, particularly in scenarios encompassing spatial constraints where units are interconnected across adjacent stands and clusters. While this avenue could merit exploration in future research, our approach of removing stands that share borders between sub-problems has shown to be a practical method of adhering to spatial constraints. This approach aims to navigate the spatial intricacies by eliminating stands that straddle the borders between sub-problems, mitigating the challenges posed by spatial constraints in multi-objective optimizations.
However, there are inherent disadvantages and limitations that we need to acknowledge. First, the removal of management alternatives from border stands due to adjacency conflicts may inadvertently introduce bias and impact the optimization of the master problem objective function. Second, quantifying the exact impact of these removed alternatives can be a complex undertaking, warranting further research. Lastly, the approach’s sensitivity to different sub-divisions may lead to divergent solutions, potentially undermining its robustness in different scenarios. It is crucial to recognize the potential biases introduced by the removal of management alternatives due to adjacency conflicts and to further investigate the exact implications of these removals on the optimization process.
Regardless of the problem size and whether or not there is a need to decompose a large problem, generating the Pareto frontier for the integer-type optimization problem is further complicated by the fact that the feasible domains (integer solutions) are disconnected, making it nonconvex. As a result, Pareto frontier generations are based on the approximation of the EPH (Lotov et al., 2004; Lotov, 2015). A study by Burachik et al. (2021) applied for a small problem found insignificant differences between the approximated and real optimal solution, and by Marques S, et al. (2021) applied for a larger forest management problem also found acceptable discrepancies. In the current study, even though the discrepancies were found to be relatively higher for some ecosystem services than the previous studies (might be related to the nature of the problem or of sensitivity of the criteria being optimized), the approach was still able to provide a reasonable approximation.
An interesting finding in this regard is the fact that the accuracy of the approximation varies depending on the characteristics of the problem, such as the presence of constraints. For larger problems with many decision variables, adding constraints led to a larger discrepancy between the surrogate solution and the Pareto frontier solution. We assume that adding constraints reduces the feasible region and could make the optimization problem more complex and may make it more difficult for the solver to find the optimal solution. Furthermore, the study also found that the level of discrepancy did not vary significantly between small and large problems, which suggests that our approach is able to handle problems of different sizes reasonably well (Marques S, et al., 2021). The fact that the accuracy of the approximation is influenced by problem characteristics, particularly the presence of constraints, underscores the need for robust optimization techniques capable of handling diverse problem sizes and complexities.
Our study highlights further that the impact of spatial constraint in forest management planning optimization problems is more pronounced when the latter has a larger number of decision variables. Nevertheless, the complexity of the solution process may vary with the algorithm used to formulate the spatial constraints (path algorithm was used in our study). Future research should explore the potential for using different algorithms such as the bucket algorithm, the clique approach, branch and cut algorithm etc. (Constantino et al., 2008; Könnyu and Tóth, 2013; Constantino and Martins, 2018) to enhance the efficiency and effectiveness of landscape-level optimization in forest management planning.
5 Conclusion and future research directions
In conclusion, our study sheds light on the critical issue of spatial constraints in forest management and optimization. Spatial constraints pose a significant challenge in effectively balancing multiple objectives in forest management planning, and our research tackles this challenge head-on. The contribution of our study lies in our approach to decomposing large forest management optimization problems into smaller, more manageable sub-problems, and depict trade-offs among multiple ecosystem services. The information about these trade-offs is important to stakeholders (e.g., Tóth et al., 2006; Borges et al., 2017; Marques S, et al., 2021), namely in the case of forested landscapes that involve several decision-makers. As highlighted by these authors, it supports the development of participatory negotiation processes to come up with consensual ecosystem services target levels.
This partitioning not only ensures the adherence to harvest patch size constraint but also effectively addresses the complexities of spatial constraints. Moreover, our research successfully approximates the EPH with remarkable accuracy, although it is worth noting that spatial constraints can slightly increase the discrepancy between approximated and actual Pareto optimal solutions. While we acknowledge the limitations and challenges associated with our approach, from a management perspective, our study provides practical solutions and valuable insights for forest planners to design effective strategies tailored to meet both ecological and economic objectives while addressing spatial harvest regulations. Moreover, the practicability of the use of the Pareto frontier tool by AFVS and relevant stakeholders has been demonstrated by several authors (e.g., Borges et al., 2017; Marques S, et al., 2021). This research highlights thus the potential for practical use of this tool to address emerging forest ecosystem management problems that include spatial constraints. Its effectiveness will rely on outreach strategies as outlined by Borges et al. (2017) and Marques S, et al. (2021). Future work will focus on its use to address similar problems in other contexts.
An important point for future improvement of the proposed approach is that the partitioning of the problem into sub-problems may not be straightforward, as it can be difficult to determine how to partition the landscape in a way that is both meaningful and effective for the optimization process. Moreover, as the optimal solution for the border stands depends on the specific solutions generated for the sub-problems, the final solution is not robust. Therefore, new approaches need to be developed that do not need partitioning or where the partitioning is optimal. Neural network-based technique and reinforcement learning approaches that have recently been applied to the solution of large integer problems (e.g., Tang et al., 2020; Huang et al., 2022) could be possible avenues for future research. Finally, our study, while providing valuable insights, does not consider climate change scenarios. When process-based models are available to project forest growth under climate change in the study area’s forested landscape, research may explore these scenarios for a more comprehensive understanding of their potential influence on trade-off patterns and the respective computational complexities. Nevertheless, our approach to generate Pareto frontiers can be as useful and applicable in this context as it is independent of the models used to make projections.
Data availability statement
The raw data supporting the conclusions of this article will be made available by the authors, without undue reservation.
Author contributions
DA: Conceptualization, Formal analysis, Investigation, Methodology, Software, Writing – original draft, Writing – review & editing. SM: Methodology, Software, Supervision, Writing – review & editing. VB: Methodology, Software, Visualization, Writing – review & editing. JR: Conceptualization, Methodology, Writing – review & editing. AW: Supervision, Writing – review & editing. MC: Methodology, Software, Supervision, Writing – review & editing. CL: Methodology, Writing – review & editing. JB: Conceptualization, Formal analysis, Funding acquisition, Methodology, Software, Supervision, Writing – review & editing, Writing – original draft.
Funding
The author(s) declare financial support was received for the research, authorship, and/or publication of this article. This study was partially funded by the Forest Research Centre, a research unit funded by Fundação para a Ciência e a Tecnologia I.P. (FCT) by project reference UIDB/00239/2020 (DOI identifier 10.54499/UIDB/00239/2020) and the Ph.D. grant of Dagm Abate (UI/BD/151525/2021); in the scope of Norma Transitória—DL57/2016/CP1382/CT15 (UIDB/00239/2020); as well as by the projects ref. H2020-MSCA-RISE-2020/101007950, with the title “DecisionES - Decision Support for the Supply of Ecosystem Services under Global Change,” funded by the Marie Curie International Staff Exchange Scheme and ref. H2020-LC-GD-2020-3/101037419, with the title “FIRE-RES—Innovative technologies and socio-ecological-economic solutions for fire resilient territories in Europe,” funded by the EU Horizon 2020—Research and Innovation Framework Program,” and the project MODFIRE—A multiple criteria approach to integrate wildfire behavior in forest management planning with the reference PCIF/MOS/0217/2017.
Conflict of interest
The authors declare that the research was conducted in the absence of any commercial or financial relationships that could be construed as a potential conflict of interest.
The author(s) declared that they were an editorial board member of Frontiers, at the time of submission. This had no impact on the peer review process and the final decision.
Publisher’s note
All claims expressed in this article are solely those of the authors and do not necessarily represent those of their affiliated organizations, or those of the publisher, the editors and the reviewers. Any product that may be evaluated in this article, or claim that may be made by its manufacturer, is not guaranteed or endorsed by the publisher.
Supplementary material
The Supplementary material for this article can be found online at: https://www.frontiersin.org/articles/10.3389/ffgc.2024.1368608/full#supplementary-material
References
Abate, D., Borges, G. J., Marques, S., and Bushenkov, B. (2022). An ecological-economic approach to assess impacts of the expansion of eucalyptus plantations in agroforest landscapes of northern Ethiopia. Forests 13:686. doi: 10.3390/f13050686
Ananda, J., and Herath, G. (2009). A critical review of multi-criteria decision making methods with special reference to forest management and planning. Ecol. Econ. 68, 2535–2548. doi: 10.1016/j.ecolecon.2009.05.010
Barnhart, C., Johnson, E. L., Nemhauser, G. L., Savelsbergh, M. W., and Vance, P. H. (1998). Branch-and-price: column generation for solving huge integer programs. Oper. Res. 46, 316–329. doi: 10.1287/opre.46.3.316
Baskent, E. Z., Borges, J. G., Kašpar, J., and Tahri, M. (2020). A design for addressing multiple ecosystem services in forest management planning. Forests 11:1108. doi: 10.3390/f11101108
Baskent, E. Z., and Jordan, G. A. (2002). Forest landscape management modeling using simulated annealing. For. Ecol. Manag. 165, 29–45. doi: 10.1016/S0378-1127(01)00654-5
Baskent, E. Z., Keles, S., and Kadiogullari, A. (2014). Challenges in developing and implementing a decision support systems (ETcAP) in forest management planning: a case study in Honaz and Ibradi Turkey. Scand. J. For. Res. 29, 121–131. doi: 10.1080/02827581.2013.822543
Borges, J. G., Garcia-Gonzalo, J., Bushenkov, V., McDill, M. E., Marques, S., and Oliveira, M. M. (2014). Addressing multicriteria forest management with Pareto frontier methods: an application in Portugal. For. Sci. 60, 63–72. doi: 10.5849/forsci.12-100
Borges, J. G., and Hoganson, H. M. (2000). Structuring a landscape by forestland classification and harvest scheduling spatial constraints. For. Ecol. Manag. 130, 269–275. doi: 10.1016/S0378-1127(99)00180-2
Borges, J. G., Hoganson, H. M., and Rose, D. W. (1999). Combining a decomposition strategy with dynamic programming to solve spatially constrained forest management scheduling problems. For. Sci. 45, 201–212.
Borges, J. G., Marques, S., Garcia-Gonzalo, J., Rahman, A. U., Bushenkov, V., Sottomayor, M., et al. (2017). A multiple criteria approach for negotiating ecosystem services supply targets and forest owners’ programs. Forest Sci. 63, 49–61. doi: 10.5849/FS-2016-035
Botequim, B., Zubizarreta-Gerendiain, A., Garcia-Gonzalo, J., Silva, A., Marques, S., Fernandes, P. M., et al. (2015). A model of shrub biomass accumulation as a tool to support management of Portuguese forests. iForest-Biogeosci. Forestry. 8, 114–125. doi: 10.3832/ifor0931-008
Burachik, R. S., Kaya, C. Y., and Rizvi, M. M. (2021). Algorithms for generating Pareto fronts of multi-objective integer and mixed-integer programming problems. Eng. Optim. 54, 1413–1425. doi: 10.1080/0305215X.2021.1939695
Constantino, M., and Martins, I. (2018). Branch-and-cut for the forest harvest scheduling subject to clearcut and core area constraints. Eur. J. Oper. Res. 265, 723–734. doi: 10.1016/j.ejor.2017.07.060
Constantino, M., Martins, I., and Borges, J. G. (2008). A new mixed-integer programming model for harvest scheduling subject to maximum area restrictions. Oper. Res. 56, 542–551. doi: 10.1287/opre.1070.0472
Ferreira, L., Constantino, M., Borges, J., and Garcia-Gonzalo, J. (2015). Addressing wildfire risk in a landscape-level scheduling model: an application in Portugal. For. Sci. 61, 266–277. doi: 10.5849/forsci.13-104
Hoganson, H. M., and Rose, D. W. (1984). A simulation approach for optimal timber management scheduling. For. Sci. 30, 220–238. doi: 10.1093/forestscience/30.1.220
Huang, Z., Wang, K., Liu, F., Zhen, H. L., Zhang, W., Yuan, M., et al. (2022). Learning to select cuts for efficient mixed-integer programming. Pattern Recogn. 123:108353. doi: 10.1016/j.patcog.2021.108353
Johnson, K. N., and Scheurman, H. L. (1977). Techniques for prescribing optimal timber harvest and investment under different objectives—discussion and synthesis. For. Sci. 18, 31.
Könnyu, N., and Tóth, S. F. (2013). A cutting plane method for solving harvest scheduling models with area restrictions. Eur. J. Oper. Res. 228, 236–248. doi: 10.1016/j.ejor.2013.01.020
Lotov, A. V. (2015). Decomposition methods for the Edgeworth-Pareto hull approximation. Comput. Math. Math. Phys. 55, 1653–1664. doi: 10.1134/S0965542515100152
Lotov, A. V., Bushenkov, V. A., and Kamenev, G. K. (2004). Interactive decision maps: approximation and visualization of Pareto frontier. Kluwer Academic Publishers: Norwell, MA, USA. p. 319.
Marques, S., Bushenkov, V., Lotov, A., and Borges, G. (2021). Building Pareto frontiers for ecosystem services trade-off analysis in forest management planning integer programs. Forests 12:1244. doi: 10.3390/f12091244
Marques, S., Bushenkov, V. A., Lotov, A. V., Marto, M., and Borges, J. G. (2020). Bi-level participatory forest management planning supported by Pareto frontier visualization. For. Sci. 66, 490–500. doi: 10.1093/forsci/fxz014
Marques, S., Marto, M., Bushenkov, V., McDill, M., and Borges, J. (2017). Addressing wildfire risk in forest management planning with multiple criteria decision making methods. Sustain. For. 9:298. doi: 10.3390/su9020298
Marques, M., Reynolds, K. M., Marques, S., Marto, M., Paplanus, S., and Borges, J. G. (2021). A participatory and spatial multicriteria decision approach to prioritize the allocation of ecosystem services to management units. Landscape 10:747. doi: 10.3390/land10070747
McDill, M. E., Rebain, S. A., and Braze, J. (2002). Harvest scheduling with area-based adjacency constraints. Forest Sci. 48, 631–642. doi: 10.1093/forestscience/48.4.631
Mendoza, G. A., and Martins, H. (2006). Multi-criteria decision analysis in natural resource management: a critical review of methods and new modelling paradigms. For. Ecol. Manag. 230, 1–22. doi: 10.1016/j.foreco.2006.03.023
Meselhi, M., Sarker, R., Essam, D., and Elsayed, S. (2022). A decomposition approach for large-scale non-separable optimization problems. Appl. Soft Comput. 115:108168. doi: 10.1016/j.asoc.2021.108168
Murray, A. T. (1999). Spatial restrictions in harvest scheduling. For. Sci. 45, 45–52. doi: 10.1093/forestscience/45.1.45
Murray, A. T., and Weintraub, A. (2002). Scale and unit specification influences in harvest scheduling with maximum area restrictions. For. Sci. 48, 779–789. doi: 10.1093/forestscience/48.4.779
Riffo, J. (2020). Disen˜ O de Un Programa De Optimizacio’ N Multiobjetivo Para La Planificacio’ N Forestal En El Valle De Sousa, Portugal. MSc Thesis, Universidad De Chile.
Rodrigues, A. R., Marques, S., Botequim, B., Marto, M., and Borges, J. G. (2021). Forest management for optimizing soil protection: a landscape-level approach. Forest Ecosyst. 8, 1–13. doi: 10.1186/s40663-021-00324-w
Tang, Y., Agrawal, S., and Faenza, Y. (2020). Reinforcement learning for integer programming: learning to cut. In International conference on machine learning (pp. 9367–9376). PMLR.
Tóth, S. F., and McDill, M. E. (2009). Finding efficient harvest schedules under three conflicting objectives. For. Sci. 55, 117–131. doi: 10.1093/forestscience/55.2.117
Tóth, S. F., McDill, M. E., and Rebain, S. (2006). Finding the efficient frontier of a bi-criteria, spatially explicit, harvest scheduling problem. For. Sci. 52, 93–107.
Keywords: spatial-optimization, integer-programming, forest management, Pareto frontier, ecosystem services
Citation: Abate D, Marques S, Bushenkov V, Riffo J, Weintraub A, Constantino M, Lagoa C and Borges JG (2024) Assessment of tradeoffs between ecosystem services in large spatially constrained forest management planning problems. Front. For. Glob. Change. 7:1368608. doi: 10.3389/ffgc.2024.1368608
Edited by:
Walter Mattioli, Council for Agricultural and Economics Research (CREA), ItalyReviewed by:
Antonio Tomao, University of Udine, ItalyGiovanni Santopuoli, University of Molise, Italy
Copyright © 2024 Abate, Marques, Bushenkov, Riffo, Weintraub, Constantino, Lagoa and Borges. This is an open-access article distributed under the terms of the Creative Commons Attribution License (CC BY). The use, distribution or reproduction in other forums is permitted, provided the original author(s) and the copyright owner(s) are credited and that the original publication in this journal is cited, in accordance with accepted academic practice. No use, distribution or reproduction is permitted which does not comply with these terms.
*Correspondence: Dagm Abate, dagmabate@isa.ulisboa.pt