Monitoring Spatial-Temporal Transition Dynamics of Transport Infrastructure Space in Urban Growth Phenomena: A Case Study of Lagos—Nigeria
 Suleiman Hassan Otuoze
 Dexter V.L. Hunt
 Ian Jefferson
- 1Department of Civil Engineering, University of Birmingham, Birmingham, United Kingdom
- 2Department of Civil Engineering, Ahmadu Bello University, Zaria, Nigeria
Lagos is one of the fastest growing world mega-cities with a huge urban mobility crisis, the traditional aggregate city’s development model could not provide reliable scientific solutions to monitor the competing demands of various land-use components and the urbanization’s effects on transport infrastructure space. This study uses a disaggregated predictive spatial modeling approach to investigate the evolutionary dynamics of transportation infrastructure space to address the fragmented urban chain process. The methodology involves analysis and modeling of the land-use spatial transition changes that have occurred over the past three decades using three Landsat imagery epochs (1984, 2013, and 2019) in remote sensing ARC-GIS 10.7. Furthermore, the prediction of the two-temporal milestones (2030 and 2050) using hybrid cellular automata-Markov (CA-Markov) implemented in IDIRISI SELVA 17.0 software when the tides of social-demographic factors were expected to bring about significant urban spatial transformation. The forecast results are expected to increase the area for transport infrastructure spaces by 93 km2 (7.3%) in 2030 and 157 km2 (12.4%) in 2050. The model’s kappa reliability coefficient estimates for the three temporal scales (k1984 = 85%; k2013 = 88% and k2019 = 89%) are higher than the 80% minimum adjudged strong agreement between the ground truth and prediction classified images in literature. The model provides efficient tool in urban development planning and sustainable transport decisions.
Introduction
Globalization has not only brought about the transformation of human activities through the alignment of the economy, trade, investment, employment, industry and technology beyond regions, countries and continents. However, it has also triggered uncontrolled migration and urbanization because of the attraction offered by the aforementioned activities. Many cities in the developing countries are currently facing an uncertain future due to high urbanization rates and poor infrastructure. The most critical aspect of local, regional and global relations is transportation, and the poorly rated and dysfunctional state of infrastructure in developing countries has aggravated many social, economic and environmental issues about the viability of the fast-agglomerating urban centers of Africa and Asia (Njoh, 2008; Goryakin et al., 2015). Urbanization includes regular land surfaces being changed over into different land use/land cover (LULC), (i.e. Houses, transport, built areas, parks, and other impermeable surfaces) which results in dramatic transition in the consistency of the urban landscape with its toll on human habitation and urban areas (Cai et al., 2019). Rapid urbanization, population growth and economic developments are the main causes of LULC change with numerous consequences on urban settings, not least in terms of ecological processes and increased environmental footprints (Wang et al., 2018).
Urban chain process is thought to usher in positive improvements in living quality, the advancement of human civilization and economic accomplishment in developed countries. Many African cities are hybrid urban and peri-urban slums inundated by the massive influx of people hardly able to cope with its inadequate and fragmented infrastructure and planning developments (Xu et al., 2019). Reckoning with some of the recent pressures and disruptions in cities caused by increasing urbanization, lack of timely and credible information on urban spatial-temporal transition in developing countries has constantly been a strong barrier to the deployment and implementation of suitable planning policies for city management.
In the last centuries, societies continued to exploit and transform the environment leading to tremendous improvements (and dis-improvements) to landscape and land Geo-morphology. This dramatic alteration has had a profound effect on the natural environment, sometimes, leading to abuse, over-exploitation and disruption over time (Adhikari and de Beurs, 2017). When reflecting on the direct consequences of over-exploitation and related human activities on land resources, some researchers have stressed that the biophysical properties of the land are over-exploited and the purpose on which it is based or the reason for which the land is used (land-use) must be moderated and made sustainable (Turner et al., 2001; Ojima et al., 2005; Peters et al., 2016).
There is no stop button to urban growth, development and complex spatial-temporal transformation, not least when the economic prospects remain the strongest impetus. Therefore, keeping tabs on the transition through modeling, simulating and forecasting the future city growth and scenarios would be beneficial as an effective planning tool for grasp the interactions between the natural environment and the anthropogenic challenges of rapid urbanization. Accordingly, the estimation of LULC transitions is a necessary step to gain holistic and ethical insights needed for management of natural resource and sustainable development tracking (Cobbinah and Aboagye, 2017).
The extent of spatial-temporal land use change varies with time, geographic area and most significantly, the land cover nature. Land cover is the bio-physical areas observed from the Earth, which includes vegetation, bare lands, soils, rock outcrops and water catchments (Panagos et al., 2015). Information on LULC cannot easily be obtained without the aid of applied remote sensing technologies and techniques. For example, geographic information systems (GIS) and remote sensing (RS) are powerful tools for capturing reliable and timely information on the spatial distribution of LULC changes across large areas. In addition, GIS provides a versatile framework to track changes for digital data collection, storage, display and analysis (Dragicevic et al., 2001).
Remote sensing imagery and GIS have proven to be useful tools in determining LULC changes, for geodetic probing and interpretation of geophysical changes of the Earth’s surface. The application of GIS-RS in urban and environmental planning has resulted in the tremendous development of spatial modeling methods, not least when used in decision and planning support modeling tools such as Markov chain (MC) (Jokar Arsanjani et al., 2013) and hybrid Cellular Automata-Markov (CA-Markov) (Basse et al., 2014). Other decision support tools are Logistical Regression (LR) (Hu and Lo, 2007), Artificial Neural Network (ANN) (Pijanowski et al., 2002) and the dynamic Conversion of Land Use and its Effects (CLUE) models. Also, many studies have shown that integrated multilayer perception-Markov chain analysis approach with GIS could be effectively used for measuring and modeling changes in spatial-temporal LULC changes (Mishra and Rai, 2016).
These models have proven their ability to provide a quantitative approach to tackle multi-dimensional problems of cities and as an environmental planning decision-making technique. Therein, it can be used to assess land suitability for development–both crucial and necessary for effective management of large cities. Similarly, a number of researchers have regularly highlighted the shortcomings of these types of individual models (Guan et al., 2008; Basse et al., 2014). To overcome the perceived shortcomings, hybridized integrated modeling approaches are commonly used for simulating and projecting LULC - see for example, (Triantakonstantis and Mountrakis, 2012).
In the last decades, remote sensing (RS) and geographic information systems (GIS) have been successfully used for land and other natural resources management and for updating spatial data. It is effective both in terms of offering a much lower cost than conventional ground survey methods and the efficacy of rapid routine LULC data acquisition (Araya and Cabral, 2010). Understanding the growth, shape and pattern of complex dynamics require robust RS techniques and tools including GIS and CA-Markov for decision modeling (Barredo et al., 2004).
Since 1972, satellite data and images from the Landsat Multispectral Scanner (MSS), Thematic Mapper (TM) and Enhanced Thematic Mapper Plus (ETM+) have been widely used because of their rich spectral resolutions in land cover studies in many diverse agricultural, forestry and built environment fields (Reis, 2008). Landsat is one of the most widely used remote sensing data for satellites, and its continuous long-term availability, cost-effectiveness and timeliness have made it an invaluable resource for monitoring LULC change. Vast literature has provided general technical information on Landsat data (Chander et al., 2009; Markham and Helder, 2012; Roy et al., 2014).
Tracking the change process is necessary to identify land use properties of interest between two or more temporal dates on digital images. Most common techniques described in the literature involve comparison and classification of key components based on temporal images at various referenced dates. Some of the familiar methods include traditional image distinction, image regression, post-classification-comparison, image ratio, and change on-screen manual digitization by a review of key components and classification of multi-date images. Research Synopsis have proven that the post-classification-comparison (pixel-by-pixel) analysis is the most reliable approach and has the benefit of evidence the magnitude of the changes (Leao et al., 2001; Jat et al., 2017).
In the current study, the main objective is to simulate LULC changes using RS-GIS and hybrid transition CA-Markov techniques which are applied to satellite imagery to monitor past development dynamics and to predict future scenarios affecting urban mobility and supporting infrastructure space in the most evolving Nigerian mega-city of Lagos. In this study, urbanization is monitored in Nigeria from two significant time-steps (1984 and 2013) to the current research year in 2019. In 1983, the country’s return to civil rule returned activated economic growth, which immediately birthed the era of high urbanization due to the attractiveness of the city in 1984 (Blei et al., 2018). For the first time in 2013, population indices hit an urban population of 58.3 percent, bringing more Nigerians in cities than in rural areas (Farrell, 2018). Furthermore, likely scenarios for 2030 and 2050 milestones, decades of worst population booms were predicted to better understand the roles of land-use processes and necessity of sustainable development in terms of planning and policy implementation.
Methodology
The methodology of this study is focused on LULC potential change modeling and prediction of transport infrastructures in the main Lagos are using arc-GIS 10.7 and hybrid cellular automata-Markov (CA-Markov) in IDIRISI SELVA 17.0. A number of pre-processing steps were performed on Landsat imageries before applying LULC change detection algorithms, including, image registration, geometric rectification, atmospheric, radiometric and topographic corrections, introduction of confusion matrix for change detection analysis and evaluation of accuracies (Gašparović et al., 2019; Phiri et al., 2020). The methodological steps involved in LULC modeling are shown Figure 1.
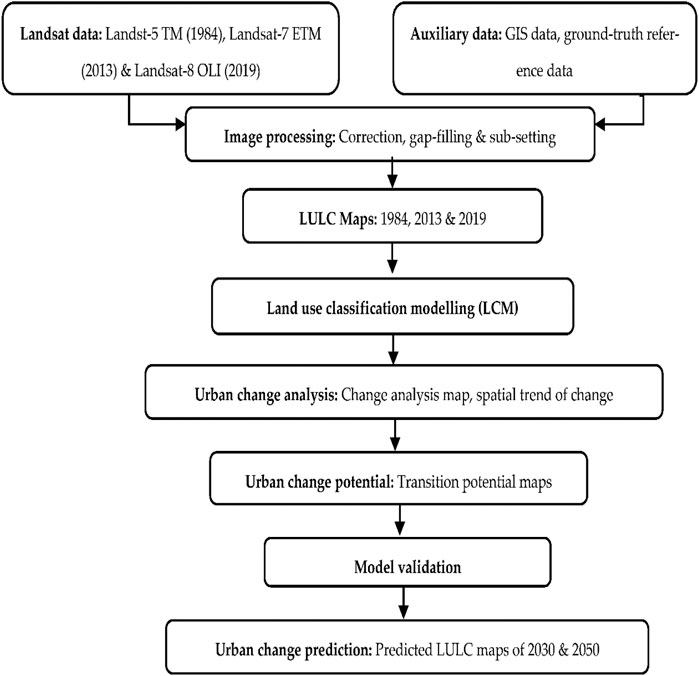
FIGURE 1. Methodology of simulation of urban LULC change modeling.
The Study Area
Lagos is situated approximately at latitude 6° 27′N and longitude 3° 24′E in the south-west of Nigeria. It is both Nigerian commercial and industrial headquarters. Lagos state covers an area of about 3577.28 km-square, but the main Metropolitan Lagos is about 1,171.28 km-square comprises 16 out of 20 Local Government Areas (LGAs) as shown in (Figure 2). The current estimated population is about 13.9 million and the urban agglomeration density is about 6,871 residents per km-square (UNDESA-PD, 2019). It is the most populous city in sub-Saharan Africa (SSA) and currently ranking sixteenth largest city in the world with the pinnacle of urban growth rate of about 5.8 percent (Aliyu and Amadu, 2017).
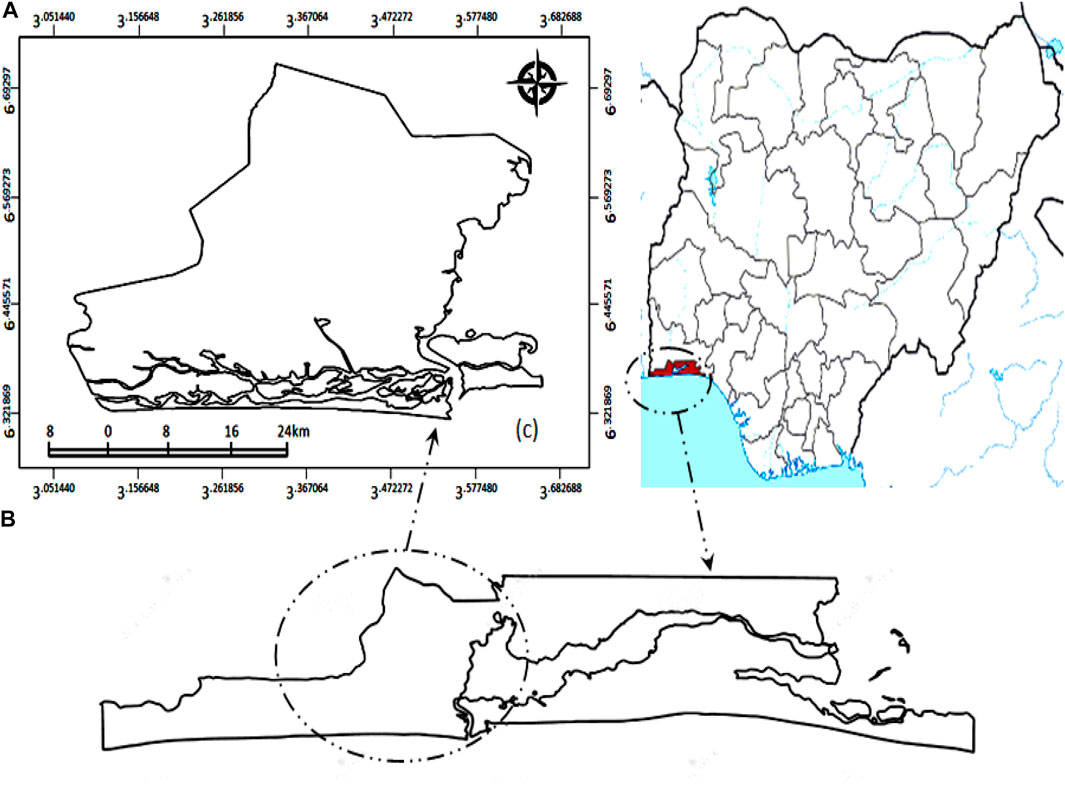
FIGURE 2. Location map showing: (A) Nigeria (B) Lagos State (C) Metropolitan study area.
Lagos is experiencing one of the fastest paces of urbanization because of its economic and industrial importance spinning high demand and devolution of land with resultant rapid LULC changes over the past decades. The city is plagued by perennial traffic congestion, safety issues and mobility frustration due to the nexus of problems of heavy motorization and continuing traffic of people to the city from all parts of Nigeria as well as neighboring countries, high population density and inadequate infrastructure (Olajide et al., 2018). Figure 3 shows the major transport infrastructure map of the study area.

FIGURE 3. Major transport network map in Lagos.
Data Source and Processing of Image
The US Geological Society Landsat1 image data—Thematic Mapper (Landsat—5 TM), Enhanced Thematic Mapper (Landsat—7 ETM) and Operational Land Imager (Landsat—8 OLI) used for the study was obtained respectively for 1984, 2013, and 2019. Other ancillary data and infrastructures used for verifying accuracy and referencing are the major maps for roads, airports, rail lines obtained from Nigerian National Space Research and Development Agency (NASRDA)2, high—resolution Google Earth images and the coordinates of physical landmarks based on field experience. Specific attributes and descriptions of Landsat RS data resources used for Lagos metropolis LULC change are listed in Table 1.
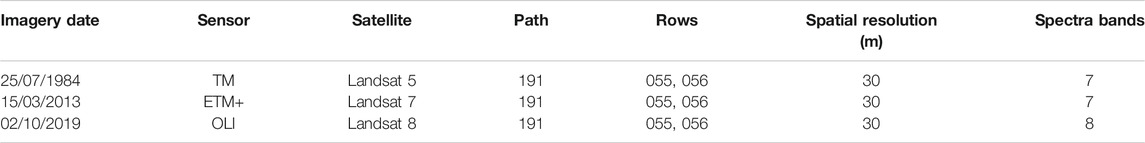
TABLE 1. Description of Landsat data resources used for analysis in Lagos metropolis.
A series of pre-processing steps, including atmospheric correction, atmosphere and cloud shadow identification and composite/fusion/metrics techniques were performed on Landsat images prior to implementation of algorithms for change detection (Chander et al., 2009). Data files were extracted with less than 10 percent cloud coverage in tagged image file format and imported to ERDAS IMAGINE 2014 as raster imageries. The image is registered picture-to-picture and re-samples at 30 × 30 metres spatial resolution based on a similar projection method. Processing of digital images involves the atmospheric correction, radiometry error, geometry, image gap filling, the sub-setting field and band selection.
Cloud is a crucial obstacle for optical remote sensing in land use dynamics, particularly in certain humid tropical areas. In order to ensure the accuracy of cloud effects, geometric and radiometric pre-corrected Landsat imagery from the USGS Earth explorer with a linear factor for conversion to surface reflectance is obtained at level 2 atmosphere. The Global Digital elevation model (DEM) dataset of land areas at 30 m spatial resolution postings used in elevation surface and topography analysis were obtained from Advanced Space-borne Thermal Emission and Reflection Radiometer (ASTER) repository at the USGS website (http://earthexplorer.usgs.gov/). In May 2003, scan line corrector (SLC) in Landsat—7 ETM satellite completely failed to compensate for the forward motion of the satellite, creating image scenes data gap scenario or “fill-no-data” status particularly in heterogeneous scenes. Henceforth, it is appropriate to fill gaps for Landsat 7 ETM + SLC-off. For this study, dynamic data language IDL 7.0 gap-filling software was used (https://glovis.usgs.gov/). Consequently, the “non-data” areas needed three additional pictures: 1) an image anchor fills 2) an image taken prior to May 2003 and 3) the post-anchor image.
An image manual registration that used Landsat 5TM 1984) as master control points to synchronize images from various satellite images from the same scene was carried out as a spatial transition. The matching of image scene involving stacking the control points with other satellite pictures (Landsat-7 ETM and Landsat-OLI) is compared with referenced auxiliary data. The average error of transformation-matched points (RMSE = 0.18 pixels) at 30 m resolution produced a good iteration as it satisfied RMSE <0.5 pixels in literature (Sheng et al., 2008).
Due to its importance in identifying the anthropogenic and ecological effects of human activities, predictive modeling of LULC change is an increasingly growing research area. The factors transforming LULC changes, including urbanization, water and biological cycles, biodiversity, anthropogenic and ecological processes, exert significant effects on global change. The ecological footprint of human over-exploitation and over-dependence on the Earth’s resources is increasing due to increasing anthropogenic influences, including urbanization, oil and mineral explorations, deforestation, industrialization, intensive agriculture, and overgrazing. The contribution of natural phenomena, including extreme climate events, earthquakes and tsunamis, solar and cosmic radiations to changes in global and LULC transformations is also prominent. Scientists have established an international LULC organization linked to the International Geosphere Biosphere Program (IGBP) and the International Human Dimensions of Global Change Program (IHDGCP), both formed in 1987, in view of the strategic significance of global change (Halmy et al., 2015).
Several different modeling techniques were applied in the study of LULC transformation, land use conversion and the debates were dominated by the stochastic assessment of where potential changes might occur by understanding the factors driving them (Srivastava et al., 2012; Halmy et al., 2015). Predictive LULC modeling techniques are computer implemented algorithms for ease of speed, accuracy and handling large data and are classified into optimization, stochastic, empirical–statistical and dynamic or process-based techniques (Lambin et al., 2000). Cellular automata (CA) features within the category of discrete time and space dynamic system-based algorithm which obeys the specific rules of the uniformly spaced grids.
In particular, CA is most preferred for LULC modeling because of its illustrative capability to depict a complex system based on a collection of sets of rules and states used for dynamic transition prediction and detection of both spatial-temporal dimensions. For the study of the various complex phases of land use transition problems at different spatial and temporal multi-scales, Markov chain analysis (MCA) is applicable as a stochastic modeling technique based on the premise that if an earlier physical state is known, the next state can be calculated. Since neither of the two models can fulfill the need for effective prediction, a hybrid CA-Markov algorithm was compiled and implemented in IDRISI SELVA software as a veritable tool for spatial modeling, simulation and prediction with visual qualitative and quantitative scales (Aburas et al., 2016).
LULC Classification
The reliability of different LULC mapping implementation algorithms is important to the dynamic change prediction modeler as LULC transformation tracking is precision-driven in both qualitative and quantitative dimensions. Researchers have applied the following land use classification algorithms—artificial neural networks (AAN), genetic algorithms, support vector machine (SVM), decision tree (DT), random forest (RF), FUZZY ART-MAP, Mahalanobis distance (MD) and maximum likelihood classifier (MLC) with Kappa accuracies greater than 84% (Talukdar et al., 2020). MLC is commonly adopted due to its fast parametric convergence as many other classifiers require time to optimize (Keuchel et al., 2003). MLC presupposes that the data are normally distributed and estimates a high probability that a certain pixel belongs to the correct category it is classified into. Also, the algorithm has been chosen because of its higher likelihood to quantify minority classes into their specific category of pixel spectral, without being overfilled or subsumed by major classes during sampling image training.
The distribution maps have been grouped into the four LULC groups, including their spatial area, based on the features specifically seen in the remote sensing imageries, (e.g., shape, size, hue, and texture etc.). A well-established approach of supervised maximum likelihood classification (MLC) was employed to produce the respective land use groups and to assess the urban spatial expansion, including transport evolution. The classification of the Landsat imagery was performed using ARC-GIS 10.7 software based on supervised classification of maximum likelihood where each pixel was categorized into one of the following classes: transport infrastructure, built-up areas, vegetation and water respectively. To carry spatial and temporal shift predictions, a post-classification, transformation detection was carried out using IDRISI Selva 17 pro software. The process involves “from-to” perception details of two classified images to arrive at pixel-based change information comparison (Otuoze et al., 2021b). Here, classified images of two different time-shifts, (i.e. 1984–2013) using cross-tabulation to assess the spatial quantitative dimensions are assessed.
Accuracy Assessment
To assess the overall accuracy of the classification, a confusion matrix was created, and accuracy assessment consists of accuracy of the producer, user, overall accuracy and kappa value. Cohen’s Kappa value is a measure of agreement of two raters which gives a comparison between the predefined ratings of the producer and that of the user. Some researchers have emphasized the necessity to perform accuracy assessments for individual classification if the data set is to be used for the study of change detection and for classification accuracy as the test will account for all ambiguity matrix elements including diagonal elements (Halmy et al., 2015). According to (Weng, 2010) and (Yusuf et al., 2014), the minimum level of accuracy assessment acceptable should be at least 85 percent when defining LULC categories in remote sensing results while model reliability checks with Kappa values of 80% minimum is adjudged to be reasonably good.
A full “ground truth” pixel by pixel map is not feasible; it is critical that adequate selection or sampling pixels are given to ensure that a classification is robustly assessed. Suitable methodology of sampling must be used to respond to statistical reliability. According to (Jensen and Lulla, 1987), the optimum amount of reference pixel necessary for the precision assessment depends on the required minimum level of accuracy; for example, moderate to good accuracy requires 80–85% Kappa index of agreement
where N = Total number of sampled pixel points; p = Expected accuracy (%);
The total sample was further delineated by thematic classification into at least 30 pixels per LULC class in order to prevent any form of bias. To attain a minimum 85% accuracy; 20 minimum pixel points per land-use class and 20 pixels per referenced LULC class for 90% accuracy of classification were recommended (Van Genderen and Lock, 1977). Out of the 204 sample sites chosen, 122 pixel points (60 percent) were used for training based on the key image recognition and validated on a basis of 82-pixel points (40% reference points) with Kappa reliability assessments. The general patterns in LULC maps showed an evolving rate of various LULC classes within the period of analysis.
As previously described, four categories of LULC classes which includes transport Infrastructure, built-up areas, vegetation and water could be delineated perhaps, due to the geography and climate of the area. While user accuracy describes the probability that a pixel will actually represent a class on the ground on the image, product accuracy defines the likelihood that a pixel or region is classified correctly (Pontius Jr and Millones, 2011). The empirical definition of Kappa statistics is given in Equation 2, a value above 0.8 indicates a strong-to-perfect agreement or precision between two maps (Liping et al., 2018). The Kappa tests were for 1984, 2013, and 2019 images were estimated to determine the predictive quality of input data.
where
Markov chain Transition Analysis
Markov chain model (MCM) was developed by (Ulam, 1962) for solving stochastic processes and land use modeling. MCM has also been used for LULC modeling and simulation changes and patterns. Researchers have applied MCM in dynamic systems for predicting LULC future state based on the preceding state (Jianping et al., 2005; Li et al., 2018). The Markov chain process could be defined as a systematic process of changing state sets,
where
According to Guan et al. (2008), Eq. 4 can converge under three conditions: 1) first, that
Markov stochastic process theory can be used to measure the state transition probabilities from initial state to
CA-Markov chain Model and Prediction
Cellular Automata has many conceptual applications to land use modifications, spatial modeling and land use prediction. It is demonstrated by a grid space called raster that characterizes or describes the cell neighborhood structure. As a function of the location and sequent time stages of the neighboring cells, it’s a number of transition policies to determine the state transitions for each cell space at the same time to adjust its structure and configuration. This fundamental property of CA implies that LULC changes can be clarified by the current state and changes in adjacent cells for any area (cells) (Mishra and Rai, 2016).
Although, a Markov chain model might have good categorical transfer probabilities, but there is a lack of spatially referred overall performance and distribution parameters for land use application (Arsanjani et al., 2013). The addition of CA to a Markov model results in the possibility of spatial transitions taking place over a period of time in a specific location. In different terms, Geo-referenced and spatial changes from the Markov Chain model are then made by using cellular automata giving rise to the hybrid model—CA-Markov model (Parsaie, 2016). The CA-Markov model implemented in IDIRIS SELVA is equipped to develop a spatial weighting on specific areas that are roughly the same as existing land use, making it very reliable in spatial-temporal dynamics and quantitative estimation of LULC change modeling (Wang et al., 2018).
The outputs of Markov chain analysis are used by the CA-Markov model, specifically the transition area file, to apply a contiguity filter or matrix that enables other land-use characteristics to be created from time to time (Basse et al., 2014). The transport infrastructure areas and other land use transition in Lagos can be estimated using the Markov simulation model S(n) in Eq. 7 based on the initial state matrix
Results
LULC Transition Maps
The retrospective pattern of the LULC transition is shown by the spatial-temporal changes from 1984–2019 in Figure 4. Table 2 shows LULC change the city recorded in the respective time steps (1984–2013 and 2013–2019). The margins of LULC transition gains from 1984–2013 showed increments of 103 km-square (8.1%) and 106 km-square (8.3%) for transport infrastructure and built-up area respectively marked the momentous land conversion birthed economic growth within the period. By the same time period, vegetation and water recorded losses of −115 km-square
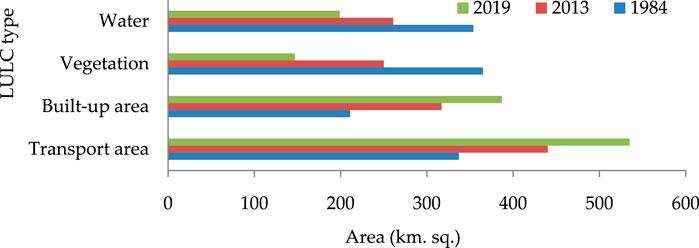
FIGURE 4. Spatial-temporal changes of LULC classes from 1984 to 2019.
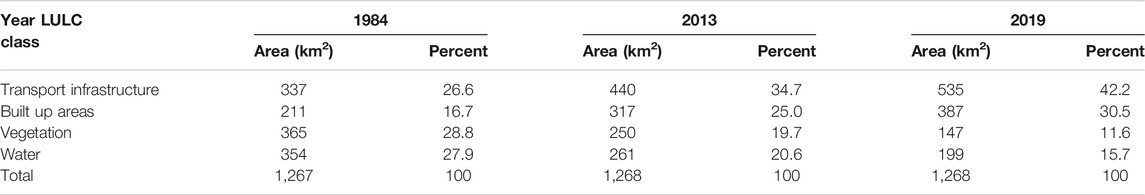
TABLE 2. Statistics of LULC areas in Lagos from 1984 to 2019.
Validating Model Accuracy
Validation involves checking the reliability of agreement between the actual and predicted LULC classified image maps using the Kappa Index of Agreement
• Producer accuracy (PA) is the ratio of the pixels correctly classified samples in a particular delineated class category to the row total number of referenced pixel samples in the class. Alternatively, it estimates the number of the ground image observed features omitted on the predicted classified maps. That is,
• User accuracy (UA) removes commission error from classification by measuring the ratio of the pixels correctly classified samples in a particular delineated class category to the column total number of referenced pixel samples in that class. Alternatively, the UA is a measure of the margin of the wrong classification between the referenced ground images and the predicted images, otherwise called commission error. That is,
• Overall accuracy (OA) is the ratio of the total number of correctly classified pixel samples in the main cells of diagonal matrix to the total number of pixel samples
• Kappa statistics (KS) check the classification accuracy by measuring the level of agreement remote sensed data and reference ground truth imageries.
On the correctly classified LULC map, a confusion matrix measures the recognizable land-use areas simulated as a row matrix, the field reference images being the column matrix, and the pixel sample points as the diagonal matrix cells. Table 3 shows that the various accuracy assessments for the Landsat images of the three temporal times series. The classification attained overall accuracies ranging from 87% 1984)–92% (2019) respectively, while Kappa indices of agreement values of 85% 1984)–89% (2019) respectively indicated satisfactory validation for the classified LULC imageries.
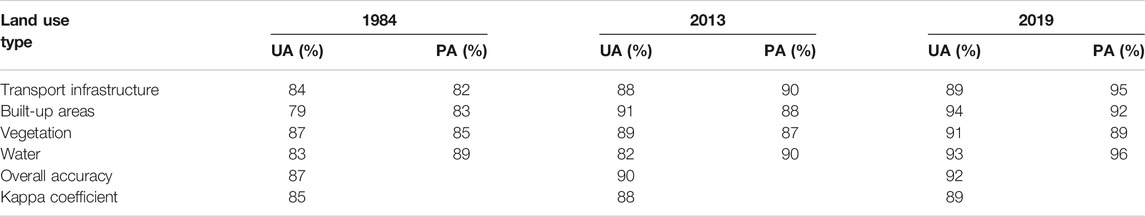
TABLE 3. LULC maps for accuracy assessment.
The degree of agreement between the simulated areas and the ground reference map is a measure of reliability on which both the qualitative and quantitative dimensions of the estimation of the Markov chain transition probability of future scenarios in Lagos could be scaled. The values guarantee that minimal errors were encountered, thus, the prediction model could give accurately specify location and quantity. The Kappa statistics for 1984, 2013, and 2019 are evidence of good to perfect calibration model for conducting transition analysis for 2030–2050 and agrees with 80% minimum recommended in literature sources (Weng, 2010; Liping et al., 2018).
Application of CA-Markov chain Model
Initial State
MCA is a probability experiment which estimates and transfers probability matrix of the expected LULC changes. The second aspect is the conditional probability images of the predicted time series (2030 and 2050) respectively. Table 4 shows the initial original state matrix [S (0)] which is integrated into mutually changing land use areas defined by Eq. 8 based on 1984 LULC classes—transport infrastructure, built-up area, vegetation and water respectively
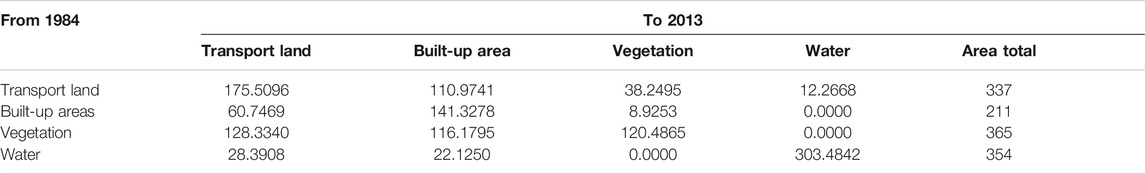
TABLE 4. Areas of initial state transition matrix for 29years —1984 to 2013.
The Transition State Probability Matrix
Tables 5 and 6 display the summaries of the various likelihood of LULC transition probability matrices for the time steps—(1984–2013) and (2013–2019) respectively. For examples, the probabilities for transport infrastructure in 1984 remaining transport infrastructure in 2013 is 52.08%, while vegetation in 1984 becoming transport infrastructure in 2013 is 35.16%. In the second period (2013–2019), Markov transition probabilities of changes from vegetation in 2013 to transport infrastructures and the built-up area in 2019 are 19.00 and 24.35% respectively. Other land-use classes’ probabilities are lower and have less likelihood in the transition dynamics.
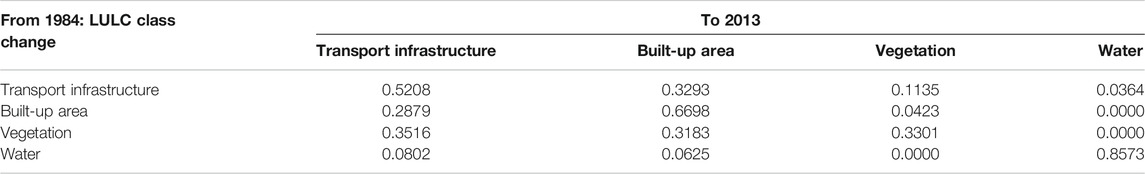
TABLE 5. Transition probability matrix of LULC changes from 1984 to 2013.
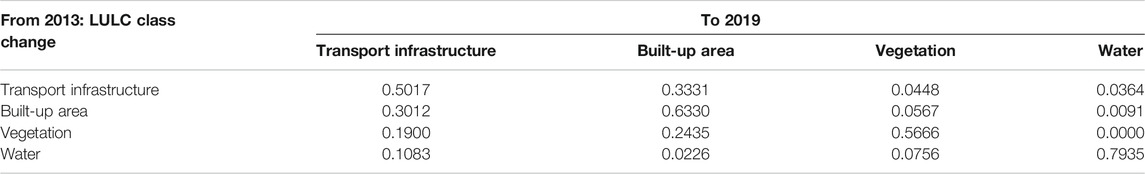
TABLE 6. Transition probability matrix of LULC changes from 2013 to 2019.
Not only is the efficiency of the visible change and shifting faces of the transport region week, but the rapid urbanization and population growth cannot keep pace with it. Nigerian cities are dependent on road transport with menacingly poor life cycle and maintenance issues besetting many urban transport facilities (Ojo et al., 2018; Otuoze et al., 2021b). The study has established the major constraint posed by transport infrastructure problems to competitiveness, growth and development of the Nigerian cities. Implementation of land-use integration, modeling, calibration and spatial statistics could allow piloting of a comparative system for evaluating good practice, quality and commitment to good ethics in the development and management of transport infrastructure.
Markov Land-Use Prediction (MLP)
Table 7 shows the various area statistics showing changes in LULC based on 2030 and 2050 predictions. The transition area for LULC changes in Table 7 shows that transport infrastructure space will increase from 535 km2 in 2019 to 628 km2 in 2030 and to 692 km2 in 2050. Also, built-up area will grow from 387 km2 in 2019 to 501 km2 in 2030 and then, to 535 km2 in 2050. Based on the analysis of spatial trends, land use conversion trends are expected to deplete vegetation and water catchment to recede from 147 km2 and 199 km2 in 2019 respectively to 15 km2 and 25 km2 in 2050 due to over-exploitation triggered by demand and could exacerbate the unsustainable urban situation of the city.
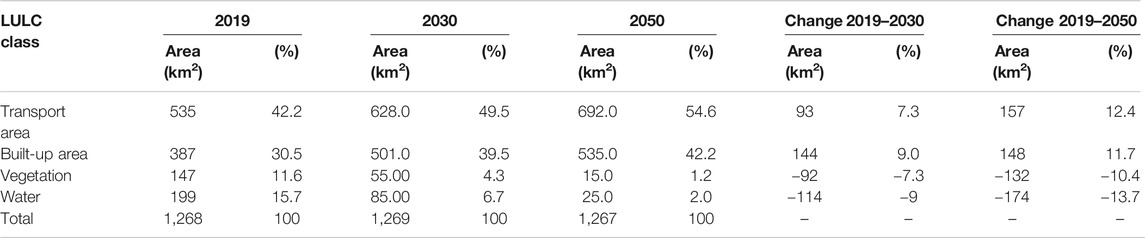
TABLE 7. Transition area statistics of predicted LULC areas in 2030 and 2050.
Discussion
Classified LULC Imageries
Figures 5–7 display land-use classification maps generated for the 1984, 2013, and 2019 time series in Lagos respectively. The continuously growing urban agglomeration in Lagos spatially transformed the transport and urban landscapes as evident in the land area gains in the respective time series. Transport growth and influence of rapid urban chain increased the significant gains in the two land use classes 1984–2019 and are largely the transition gainers of receding green vegetation and water catchments. It can be observed that LULC gain in both transport infrastructure and built-up area are evidences of increasing urbanization trend as new ventures into land reclamation, sand filling of lagoons, floating islands and other water bodies were triggered by increasing land demand and conversion. For example, the most prominent case of urban chain projects triggered by dire land demand in Lagos is the ambitious Victoria Garden City (VGC), built entirely on the reclaimed sea and lagoon land, rendering the city vulnerable to constant weather events and the preeminence of existential flooding threats.
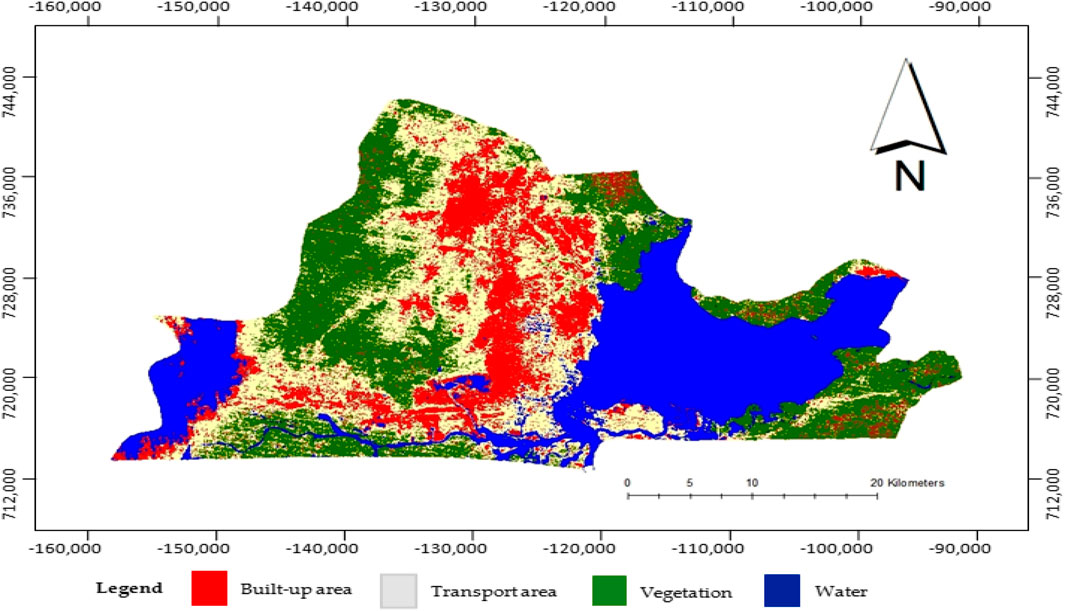
FIGURE 5. Classified LULC map of Lagos Metropolis in 1984.
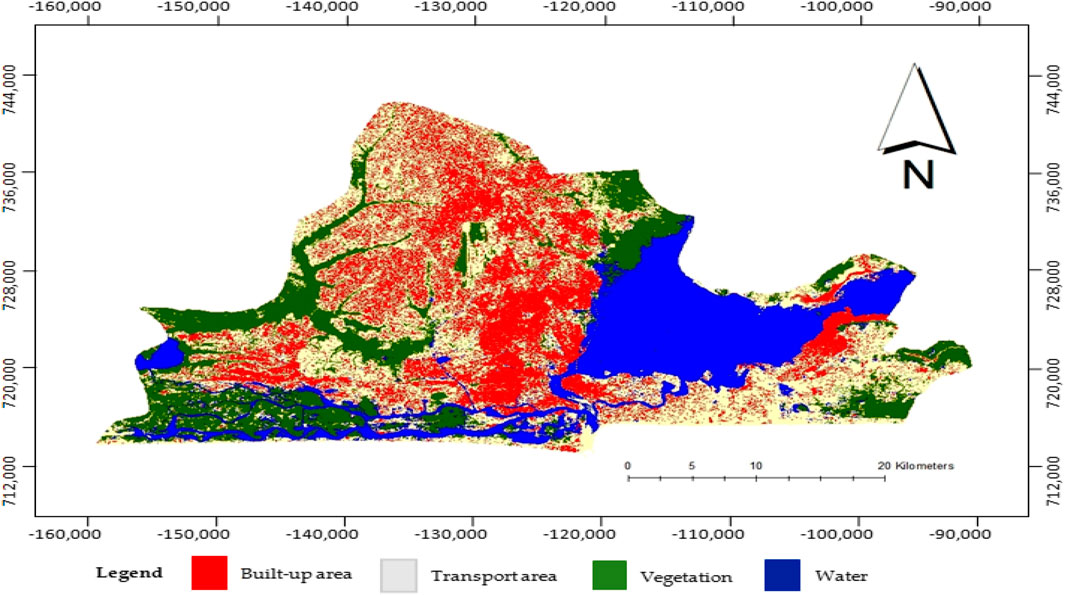
FIGURE 6. Classified LULC map of Lagos Metropolis in 2013.
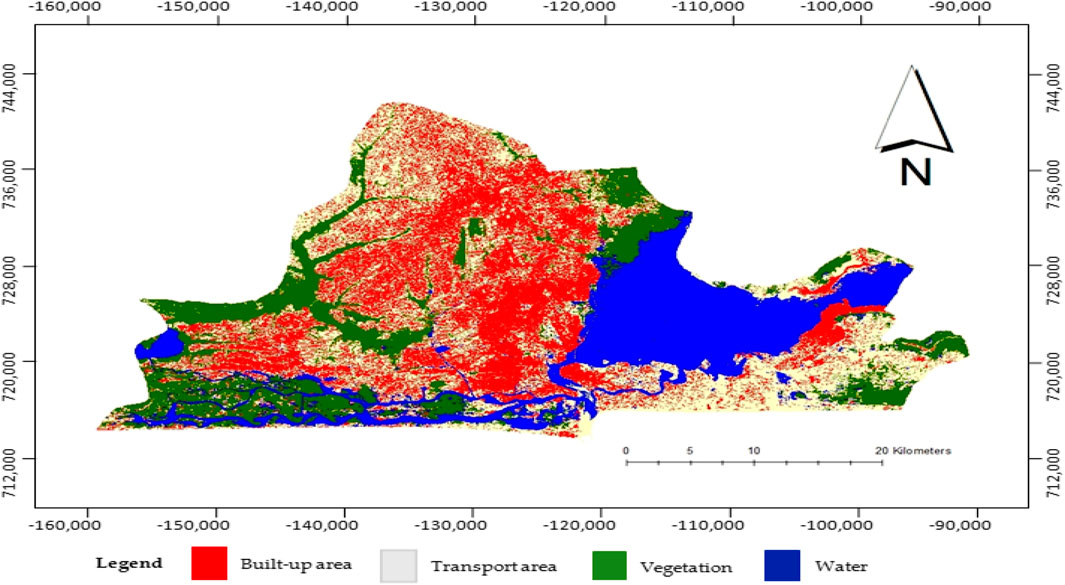
FIGURE 7. Classified LULC map of Lagos Metropolis in 2019.
The spatial-temporal changes in the urban environment are due to higher natural population growth factors, (i.e. higher fertility and low mortality rates), migration and the city’s regional economic and industrial strategic influences. The magnitude of these individual factors’ contributions is debatable; however, among researchers, there is a preponderance of views in favor of natural population as the dominant driver of urban spatial evolution (Bloch et al., 2015; Ojo and Ojewale, 2019). As Nigeria began the early accelerated phase of urban transition, natural population and urban migration accounting for 48 and 37% respectively, are the major contributors to the evolutionary phase of urban demographic statistics while 15% of rural areas are reclassified into towns and urban centers (Fox et al., 2018).
Nigeria has regional dimensions to its demography and urban process–the conurbations of northern countries show higher fertility rates and lower rural-urban migration propensity, while the southern states exhibit the reverse. Farrell (2018) concluded that urban natural population growth factors represent about 60% of the exponentially rising share of the overall urban agglomeration in the developing countries, whereas rural-urban drift and reclassification represent the remainder.
While favorable natural demographic statistics are the driving force behind urbanization, there is also a strong causal relationship between the recent migration surge and the long-running insurgency war and other security crises. Nigeria is currently beset by instability, including Boko Haram and ISWAP Islamist insurgencies, banditry, and the herders-farmers crisis, all of which have worsened the country's segregated socioeconomic structure, increased poverty and has offset the dynamics of urban migration chains. According to Farrell (2018, p. 288), “increasing insecurity in the northeast due to the emergence of Boko Haram has also been linked to the recent intensification of rural to urban migration.” The number of internally displaced people (IDPs) in war-torn Northern Nigeria has risen to 3.3 million (Olanrewaju et al., 2019).
The International Organization for Migration (IOM) documented 1,491,706 internally displaced persons (IDPs) living in critical conditions in displacement camps across the affected state's urban fringes and the remaining swelling urbanization (Itumo and Nwefuru, 2016). Insecurity has hampered rural reclassification which would have stemmed down urbanization migration tides based on equitable share of socioeconomic development and infrastructure allocation. Critical infrastructure and social amenities have been lost to the insurgency and many rural communities within the restive northern regions of Nigeria have been uprooted.
The cities continue to be the facto economy even as the country’s indigenous economies are underperforming or rather tanking in some sectors due to low productivity, industrial decline, infrastructure failure, unemployment, inequitable growth and development, and a lack of social inclusion. The economic viability of the city amid this chaos creates an attraction for urban migration, the annual population rise of Lagos stands at about 5.8% (Aliyu and Amadu, 2017). Over the last few decades, Nigeria’s urban population and spatial expansion have steadily increased, while socio-demographic, economic, and security indicators in rural settings have dwindled. A similar correlation between high urbanization rates and economic growth has been identified by researchers to be responsible for gaps in urban planning and basic infrastructures including transport facilities in many Sub-Saharan African cities (Njoh, 2008; Otuoze et al., 2021a). This inequitable development continues to cause a significant threat to the urban dwellers who navigate the daily traffic congestion and crumbling transport infrastructure.
Urban development continues to produce a manifest poor relationship between transport, land use and travel habits that cause mobility and congestion problems within and outside Lagos metropolitan areas. There is a causal connection between unsustainable urban growth and the problem of accessibility in Lagos due to the leading role of the city as national economic and industrial hub. Also, post-colonial Land Use Act 1978) minimized government authority and lent local lease holders, private individuals and informal players unhinged power of influence, the variables that resulted in weak land management, sub-optimal development planning, and mosaics of urban sprawls and slums with persistent mobility issues (Oluwatayo et al., 2019; Kanyepe et al., 2021).
Land-Use Prediction by Markov chain
The previous Kappa statistics validation enables another soft prediction to classify the grid cell level position and growth of future LULC potential changes further from 2019–2030 and 2050 respectively (Figures 8, 9). After calibration and validation, Markov land-use prediction (MLP) is used to forecast future growth and evolution of land use dynamics. The measures after calibration and validation include the so-called Markov land-use prediction (MLP). The steps include the definition, standardization and aggregation of specified criteria in IDRISI Selva 17.0 decision wizard module map the LULC transition shifts.
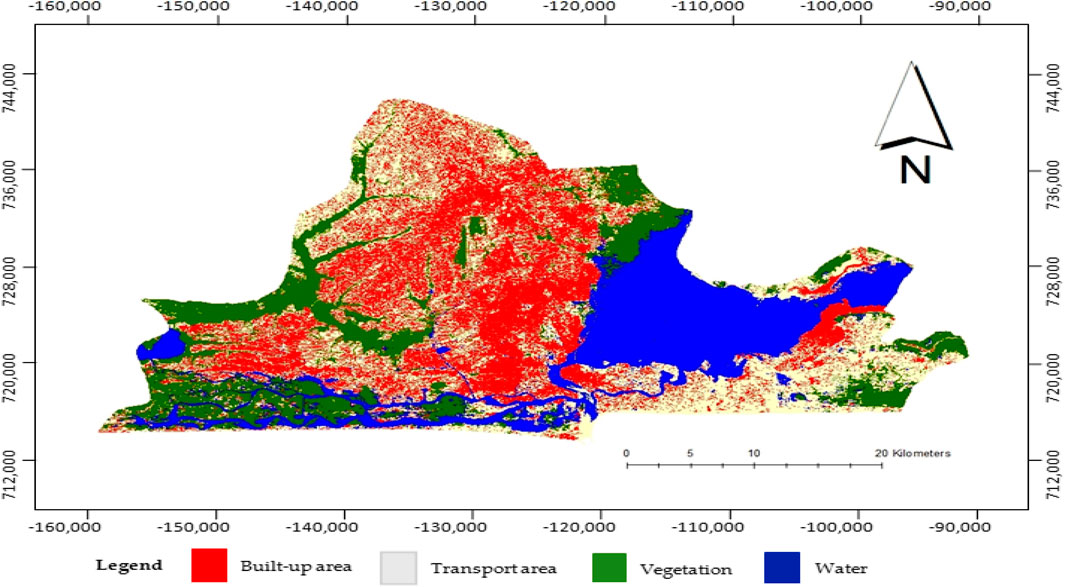
FIGURE 8. Predicted LULC map in 2030.

FIGURE 9. Predicted LULC map in 2050.
These increasing trends of urbanization and the transport infrastructure area will exert proportional demand for the transport system, expanding including roads, railways, bridges, jetties, airfields, parking place and other terminal facilities, sustainable travel corridors and recreational parks. The various classes of LULC transition gains and losses encountered by different land use changes were analyzed and the gains and losses as well as the net changes are shown in Figure 10. The predict demands in land area for transport will rise from 535 km2 in 2019 to 698 km2 in 2050 while built environment would have from 387 km2in 2019 to 535 km2 in 2050. Land consumption being the main factor of urban growth chains has shown evidence that vegetation and reclamation from lagoons are the main sources of these land conversions. For example, vegetation lands would have been depleted from 147 km2 in 2019 to 15 km2 in 2050.
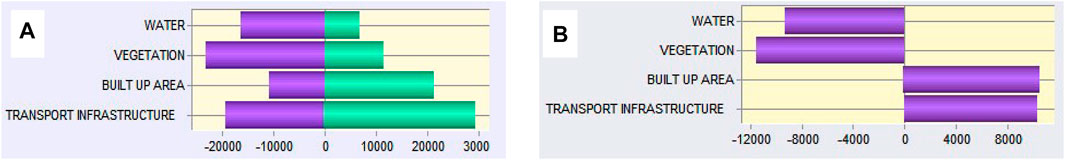
FIGURE 10. (A) Gain and loss chart (B) net change chart.
By the same token, water catchments would have been devolved or reduced from 199 km2 in 2019 to 25 km2 in 2050. The pre-eminence of extreme weather-related events—flooding, hurricane and inundation on critical infrastructure in coastal cities including Lagos are sad realities of land reclamation. The scale of urban transport resilience and the strength of resistance are constantly shifting in the past decades due to disruptions and must be adequately planned (Douglas et al., 2008). Although, transport infrastructure and built-up areas are the two predicted LULC change modeling winners, while other LULC classes are expected to retreat; the prospect of delivering quality transportation is doubtful as many Nigerian cities have been beset by dilapidated and inadequate infrastructure. A more holistic approach to solving the city’s ongoing transportation problems will include a vision for improving both the quality and quantity of transportation infrastructure, efficiency, traffic demand management (TDM) and resilient thinking for future urban challenges.
The future prospect of a possible spatial-temporal growth measure for built-up areas may be more promising than for transport networks, as government, with little to no private involvement, is the sector’s key policy maker. In terms of planning, visions, aspirations, priorities, jurisdictions and management techniques, the legally binding roles of various municipal authorities representing different jurisdictional interests-federal, state and local authorities wholly morphed into urban government - have created complex bureaucratic bottlenecks (Atufu and Holt, 2018). Nigeria’s poor transport systems—roads, bridges, airports and railway infrastructure continued to decline due to the non-aligning policies of the various levels of government, political whims and multi-level corruption (Ojo et al., 2018).
The traditional infrastructure policy of Nigerian cities hardly differentiated the needs assessments of any infrastructures (transport, communication, water, housing, electricity, health, etc.), leaving gaps in the development of some critical infrastructure. Bureaucratic bottleneck, planning problems and defective spatial analysis have remained part of the investment portfolios and management of the transport sector, which was a unit of the Lagos State Ministry of Works and Housing till 2019 when the section attained a full ministry status. Communities around Lagos and the government are locked in a constant fight for compensation for any damaged assets along the route corridors of new transportation infrastructure projects due to policy misalignment and a lack of genuine spatial evaluation. Lagos’ current “aggregate” development policy ignores the long-term consequences of spatial change patterns in land resources, as well as how to accommodate future transportation infrastructure spatial allocation. This research is intended to contribute to the analysis of spatial transformation characteristics and future planning analysis in a developing country urbanism.
A new Frontier of knowledge of the urban growth phenomenon involving “disaggregate” spatial transition potential change model has been applied to analyze spatial-temporal demand of transport infrastructure, oppose to the current lump-up “all-in aggregate” model used. Although the research model is spatially explicit for predicting current and future transport and LULC change scenarios, the scope of the study is only limited to the extent of Lagos imagery data and the ground truth references collected for analysis. Due to a lack of data and knowledge, the roles of sprawling communities in the urban, peri-urban and rural fringes in terms of connectivity, accessibility and mobility, as well as the impacts of other regional states, could not be captured. It is hoped that future research will also highlight the impacts of urban sprawl and regional effects in transport spatial transition study.
Suitability Quality of Transition Maps
ArcGIS applied to develop LULC classified images took account of the urban peculiarities including important factors and constraints driving the evolution. Further analysis was carried out by importing into IDRISI wherein the CA-Markov chain analysis uses Multi-Criteria Evaluation (MCE) to generate decision rules in the form of suitability maps for determining the feasibility and viability qualities of prediction. MCE provides a predictive decision methodology that incorporates an element of spatial contiguity, transition analysis and distribution in the processing of the Markov chain. It is a multi-criteria evaluation (MCE) and pre-requisite for prediction based on an aggregation of various decision constraints into a single evaluation index (Mishra and Rai, 2016).
The various constraints are criteria which limit LULC appropriate expansion are expressed in Boolean maps where suitable transition areas were set at one 1) while unsuitable areas have their visual indicators set at zero (0). Boolean overlays are used to minimize requirements for logical statements of suitability and combine statements by logical operators, i.e., union (OR) and intersection (AND). Factors (criteria) and trade-offs are integrated into the modules to construct suitability maps and to resolve multi-objective decisions. In order to create a single evaluation index, different factors (rules) and constraints were used (El-Hallaq and Habboub, 2014). The steps involve developing identified criteria, standards and aggregation. And finally, the decision wizard module in IDRISI Selva 17.0 generates the suitability maps. The closer a value is to zero, the less suitable the area and vice-versa (Liping et al., 2018).
The research took cognizance of the range of variables or criteria, including transportation networks, population density, settlement, forest, urbanization, marketplace, economic and business agglomerations, industries and agriculture etc., affecting the LULC transition rule. Construction of infrastructure including transport and buildings and water bodies is set as constraints and the Fuzzy function was applied to evaluate the standard factors at various functions and control levels combined with Weighted Linear Combination (WLC). Factors or parameters are standardized into identical numerical sets by means of weighted mean and are generated from the AHP function in the WLC module. In order to extract a suitability map of land use forms, the MCE module used factors, constraints and weights, while suitability atlas was generated by IDRISI Collection Editor. The suitability maps in Figures 11, 12 displayed the feasibility of CA-Markov transition prediction. Furthermore, transition potential maps of 2030 and 2050 have transition area indicators visibly far from one (1), which is evident that LULC changes are generally unsuitable and unsustainable.
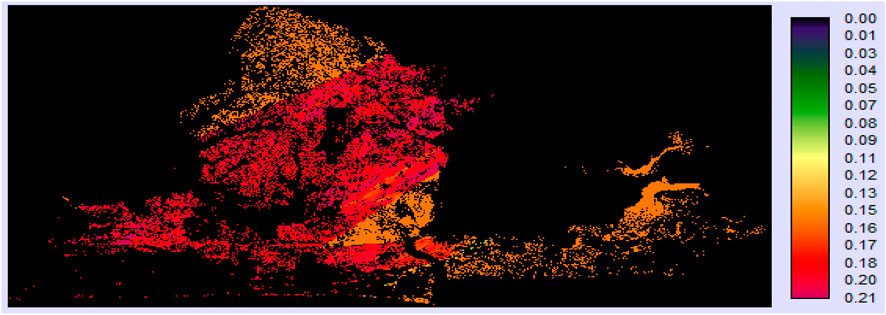
FIGURE 11. Transition potential map for 2030.
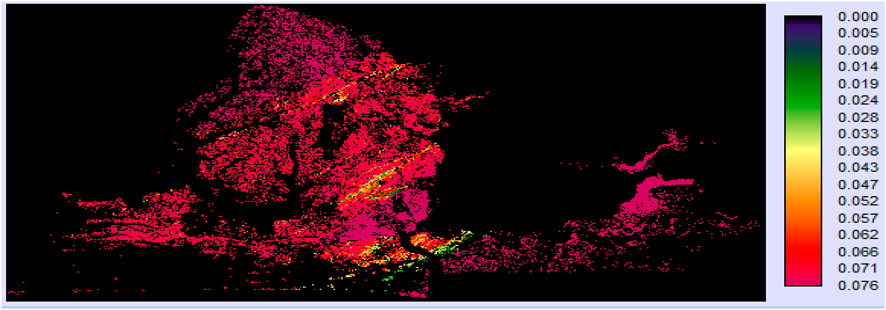
FIGURE 12. Transition potential map for 2050.
While it is obvious that Lagos city, like many cities in the developing countries will experience future population and urbanization booms, the imperative of improving transport infrastructure, public transit services and non-motorized commuting could reduce land conversion and rapid LULC change. Urban areas in Lagos, as with many Nigerian cities are constantly dotted with low-quality construction portfolios, deteriorated and uncompleted transport infrastructure projects due to inadequate funding, corruption and governmental bureaucratic bottlenecks (Ojo et al., 2018; Olajide et al., 2018). The study finds the imperative holistic and sustainable approach reduce transport infrastructure gaps, multi-level policy and planning synergy, modal enable provision of smart and resilient infrastructure and transport demand management (TDM) to make the city livable, accessible, economically viable and to reduce perennial urban congestion.
Conclusion
The following deductions were made from the research:
The study has isolated the transition dynamics of urban transport facility demand from the traditional aggregate urban planning model which slowed the development of many critical infrastructure and established a lack of congruence between urban chain and declining transport systems in Lagos metropolis. First, with combined approaches of remote sensing, GIS and CA-Markov with Landsat TM/ETM+/OLI satellite images, this study recorded growth in transport infrastructure and built-up land use classes while LULC classes for vegetation cover and water receded in 1984–2013—2019 time series. For predicted future LULC changes in the city, repeated trends of increasing gains in land use areas were recorded for both transport and built-up areas while vegetation and water reduced in the order of time steps from 1984 to 2013—2019.
The results of LULC classification produced Cohen’s Kappa agreement statistics ranging from 85–89%, which are greater than the minimum of 80% suggested in literature. The analysis shows a clear picture of spatial-temporal growth disparities and unsustainable location and quantitative LULC changes which require policy reorientation and planning to handle urban growth. The study forecasted that transport infrastructure demand and land conversion will increase by 93 km2 (7.3%) in 2030 and 157 km2 (12.4%) in 2050. Similarly, built-up areas will increase by 144 km2 (9.0%) and 148 km2 (11.7%) respectively in the two prediction periods with increasing socio-demographics, urban and peri-urban slums and frustration.
In the globalized world, the strategic socio-economic offered in terms job opportunities, social amenities and critical infrastructure have increased the attractiveness of cities to all sections of human society. Urbanization imposes anthropogenic chains on the natural world and is arguably the key driver to the transformation of global land use. LULC change shapes the dynamic process that changes natural ecology, climate and environmental conditions, and is a major challenge to biodiversity, water cycle and “flora and fauna” of ecological environment. Poverty, lack of infrastructure and economic opportunities and insecurity as a result of the insurgency, banditry and kidnapping in rural Nigeria have increased the scale of urban migration (Abbass, 2012; Bulus et al., 2020).
The nexus of socioeconomic variables, climatic and ecological constraints and security problems in the rural areas have constituted “push-and-pull” factors motivating urban migration. The drifts and sprees of migrants into the main Nigeria urban hubs have not only impacted the economy but have increased security and infrastructure problems. According to the World-Bank (2016, p. 3), “Stagnating agricultural productivity and substantial conflict, particularly in the north, have spurred (urban) migration, not urban jobs or services”.
Although, the forecast on increasing transport infrastructure could ameliorate mobility frustration, congestion and quality of life in the city; a sustained increase in urbanization rate is likely to worsen the problem. Lagos being a low-lying coastal city is facing a pre-eminence of serious anthropogenic and ecological problems including flooding if the current spate of land reclamation continues unabated. The study contributes to the evolutionary dynamics of transport space and offers a means of tracking spatial and temporal dimensions in order to reinforce the relationships between change in land use, smart resilient cities and sustainable delivery of transport services. It is suggested that the future may explore the variables, causes, impacts and contributions made to the evolutionary chains of urban transport space by socio-demographic, economic and environmental factors to achieve the goals of sustainable and accessible Lagos city.
The disaggregate model applied for the analysis of urban transport chain process and the prediction is spatially explicit and reliable for forecasting current and future urban scenarios. However, due to a lack of continuous data on various rural and urban demographics, as well as discrepancies in the history of spatial transformation, the available choice involves an estimation of urban growth indicators using national population and urbanization indices. The urban population estimates in this study's time series (1984, 2013, and 3019) were either back calculated or extrapolated using data for Nigeria's three 3) national census results from 1963, 1991, and 2006 respectively.
Due to chains of estimations and disaggregate into urban growth components, it is difficult to completely vouchsafe the accuracy of the estimates due to uncertainties in urban chain trajectories, human factors and the likelihood of over-estimation or under-estimation of the figures of the predicted time series. The current indicators and projected outcomes point to challenging future realities, the simulated spatial transformation has negative consequences and repercussions for urban environments, demographics, and the vast population of city dwellers. The growth indicators will create pressure in the economy, housing, employment, poverty reduction strives, transport and other infrastructure, land resources, security, crime and violence. It is expected that future study will push the discourse and explore means to further resolve these underlining problems.
Data Availability Statement
The data analyzed in this study is subject to the following licenses/restrictions: The imageries data were obtained from Nigeria National Space Research and Development Agency -NSRDA (https://nasrda.gov.ng) under strict permission for the research and not to be made public. Requests to access these datasets should be directed to National Space Research and Development Agency -NSRDA (https://nasrda.gov.ng).
Author Contributions
The authorship contribution CRediT taxonomy are “Conceptualization, SHO, DH, and IJ; methodology, SHO; software, SHO; validation, SHO; formal analysis, SHO; investigation, SHO; resources, SHO, DH, and IJ; data curation, SHO, DH, and IJ; writing–original draft preparation, SHO; writing–review and editing, DH, and IJ; visualization, SHO; supervision, DH, and IJ; project administration, SHO, DH, and IJ; funding acquisition, SHO, DH, and IJ.
Funding
The APC was funded by the United Kingdom Engineering and Physical Sciences Research Council (EPSRC) under grant EP/J017698/1 (Transforming the Engineering of Cities to Deliver Societal and Planetary Wellbeing) and EP/P002021 (From Citizen to Co-innovator, from City Council to Facilitator: Integrating Urban Systems to Provide Better Outcomes for People, known as Urban Living Birmingham) in support of DH. This research was funded by the Petroleum Trust Development Fund (PTDF), Nigeria (https://ptdf.gov.ng/), who sponsored the doctoral study fellowship of SO.
Conflict of Interest
The authors declare that the research was conducted in the absence of any commercial or financial relationships that could be construed as a potential conflict of interest.
Acknowledgments
The authors would like to thank the staff and management of University of Birmingham, United Kingdom for the various support during the fellowship experience. Also, we wish to appreciate the management of Ahmadu Bello University, Zaria in debt for granting full study fellowship to SO.
Footnotes
1https://earthexplorer.usgs.gov/
References
Abbass, I. M. (2012). Trends of Rural-Urban Migration in Nigeria. Eur. Scientific J. 8 (3), 97–125. doi:10.3109/10673229.2012.677347
Abd El-Kawy, O. R., Rød, J. K., Ismail, H. A., and Suliman, A. S. (2011). Land Use and Land Cover Change Detection in the Western Nile Delta of Egypt Using Remote Sensing Data. Appl. Geogr. 31 (2), 483–494. doi:10.1016/j.apgeog.2010.10.012
Aburas, M. M., Ho, Y. M., Ramli, M. F., and Ash’aari, Z. H. (2016). The Simulation and Prediction of Spatio-Temporal Urban Growth Trends Using Cellular Automata Models: A Review. Int. J. Appl. Earth Observation Geoinformation 52, 380–389. doi:10.1016/j.jag.2016.07.007
Adhikari, P., and de Beurs, K. M. (2017). Growth in Urban Extent and Allometric Analysis of West African Cities. J. Land Use Sci. 12 (2-3), 105–124. doi:10.1080/1747423x.2017.1280550
Aliyu, A., and Amadu, L. (2017). Urbanization, Cities, and Health: The Challenges to Nigeria - A Review. Ann. Afr. Med. 16 (4), 149–158. doi:10.4103/aam.aam_1_17
Araya, Y. H., and Cabral, P. (2010). Analysis and Modeling of Urban Land Cover Change in Setúbal and Sesimbra, Portugal. Remote Sensing 2 (6), 1549–1563. doi:10.3390/rs2061549
Arsanjani, J. J., Helbich, M., Kainz, W., and Darvishi, B. A. (2013). Integration of Logistic Regression, Markov Chain and Cellular Automata Models to Simulate Urban Expansion. Int. J. Appl. Earth Observation Geoinformation 21, 265–275. doi:10.1016/j.jag.2011.12.014
Atufu, C. E., and Holt, C. P. (2018). Evaluating the Impacts of Flooding on the Residents of Lagos, Nigeria. WIT Trans. Built Environ. 184, 81–90. doi:10.2495/FRIAR180081
Barredo, J. I., Demicheli, L., Lavalle, C., Kasanko, M., and McCormick, N. (2004). Modelling Future Urban Scenarios in Developing Countries: An Application Case Study in Lagos, Nigeria. Environ. Plann. B Plann. Des. 31 (1), 65–84. doi:10.1068/b29103
Basse, R. M., Omrani, H., Charif, O., Gerber, P., and Bódis, K. (2014). Land Use Changes Modelling Using Advanced Methods: Cellular Automata and Artificial Neural Networks. The Spatial and Explicit Representation of Land Cover Dynamics at the Cross-Border Region Scale. Appl. Geogr. 53, 160–171. doi:10.1016/j.apgeog.2014.06.016
Blei, A. M., Angel, S., Civco, D. L., Liu, Y., and Zhang, X. (2018). “Re: Accuracy Assessment and Map Comparisons for Monitoring Urban Expansion: The Atlas of Urban Expansion and the Global Human Settlement Layer,”. (Working Paper WP18AB1). Available from: https://www.lincolninst.edu/sites/default/files/pubfiles/blei_wp18ab1.pdf (Accessed on 02 13, 2020).
Bloch, R., Monroy, J., Fox, S., and Ojo, A. (2015). “Urbanisation and Urban Expansion in Nigeria,”. Urbanisation Research Nigeria (URN) Research Report (London: ICF International). Creative Commons Attribution-Non- Commercial-ShareAlike CC BY-NC-SA. Available from: https://assets.publishing.service.gov.uk/media/57a0897bed915d3cfd00027a/61250-URN_Theme_A_Urbanisation_Report_FINAL.pdf (Accessed on 03 03, 2021).
Bulus, K., Gubak, H. D., and Gubam, D. S. (2020). Youth Unemployment, Empowerment and Self Reliance in Nigeria: A Panacea for Self Employment. Int. J. Scientific Res. Publications (Ijsrp) 10 (12), 167–182. doi:10.29322/IJSRP.10.12.2020.p10816
Cai, G., Ren, H., Yang, L., Zhang, N., Du, M., and Wu, C. (2019). Detailed Urban Land Use Land Cover Classification at the Metropolitan Scale Using a Three-Layer Classification Scheme. Sensors 19 (14), 3120. doi:10.3390/s19143120
Chander, G., Markham, B. L., and Helder, D. L. (2009). Summary of Current Radiometric Calibration Coefficients for Landsat MSS, TM, ETM+, and EO-1 ALI Sensors. Remote Sensing Environ. 113 (5), 893–903. doi:10.1016/j.rse.2009.01.007
Cobbinah, P. B., and Aboagye, H. N. (2017). A Ghanaian Twist to Urban Sprawl. Land Use Policy 61, 231–241. doi:10.1016/j.landusepol.2016.10.047
Douglas, I., Alam, K., Maghenda, M., Mcdonnell, Y., McLean, L., and Campbell, J. (2008). Unjust Waters: Climate Change, Flooding and the Urban Poor in Africa. Environ. Urbanization 20 (1), 187–205. doi:10.1177/0956247808089156
Dragicevic, S., Marceau, D. J., and Marois, C. (2001). Space, Time, and Dynamics Modeling in Historical GIS Databases: A Fuzzy Logic Approach. Environ. Plann. B Plann. Des. 28 (4), 545–562. doi:10.1068/b2567
El-Hallaq, M. A., and Habboub, M. O. (2014). Using GIS for Time Series Analysis of the Dead Sea from Remotely Sensing Data. Ojce 04 (04), 386–396. doi:10.4236/ojce.2014.44033
Farrell, K. (2018). An Inquiry into the Nature and Causes of Nigeria's Rapid Urban Transition. Urban Forum 29 (3), 277–298. doi:10.1007/s12132-018-9335-6
Fox, S., Bloch, R., and Monroy, J. (2018). Understanding the Dynamics of Nigeria's Urban Transition: A Refutation of the 'stalled Urbanisation' Hypothesis. Urban Stud. 55 (5), 947–964. doi:10.1177/0042098017712688
Gašparović, M., Zrinjski, M., and Gudelj, M. (2019). Automatic Cost-Effective Method for Land Cover Classification (ALCC). Comput. Environ. Urban Syst. 76, 1–10. doi:10.1016/j.compenvurbsys.2019.03.001
Goryakin, Y., Lobstein, T., James, W. P. T., and Suhrcke, M. (2015). The Impact of Economic, Political and Social Globalization on Overweight and Obesity in the 56 Low and Middle Income Countries. Soc. Sci. Med. 133, 67–76. doi:10.1016/j.socscimed.2015.03.030
Guan, D., Gao, W., Watari, K., and Fukahori, H. (2008). Land Use Change of Kitakyushu Based on Landscape Ecology and Markov Model. J. Geogr. Sci. 18 (4), 455–468. doi:10.1007/s11442-008-0455-0
Halmy, M. W. A., Gessler, P. E., Hicke, J. A., and Salem, B. B. (2015). Land Use/land Cover Change Detection and Prediction in the North-Western Coastal Desert of Egypt Using Markov-CA. Appl. Geogr. 63, 101–112. doi:10.1016/j.apgeog.2015.06.015
Hu, Z., and Lo, C. P. (2007). Modeling Urban Growth in Atlanta Using Logistic Regression. Comput. Environ. Urban Syst. 31 (6), 667–688. doi:10.1016/j.compenvurbsys.2006.11.001
Jat, M. K., Choudhary, M., and Saxena, A. (2017). Urban Growth Assessment and Prediction Using RS, GIS and SLEUTH Model for a Heterogeneous Urban Fringe. Egypt. J. Remote Sensing Space Sci. 10 (3), 1–19. doi:10.1016/j.ejrs.2017.02.002
Jensen, J. R., and Lulla, K. (1987). Introductory Digital Image Processing: A Remote Sensing Perspective. Geocarto Int. 2 (1), 65. doi:10.1080/10106048709354084
Jianping, L., Bai, Z., and Feng, G. (2005). RS-and-GIS-supported Forecast of Grassland Degradation in Southwest Songnen Plain by Markov Model. Geo-spatial Inf. Sci. 8 (2), 104–109. doi:10.1007/bf02826848
Jokar Arsanjani, J., Helbich, M., Kainz, W., and Darvishi Boloorani, A. (2013). Integration of Logistic Regression, Markov Chain and Cellular Automata Models to Simulate Urban Expansion. Int. J. Appl. Earth Observation Geoinformation 21, 265–275. doi:10.1016/j.jag.2011.12.014
Kanyepe, J., Tukuta, M., and Chirisa, I. (2021). Urban Land-Use and Traffic Congestion: Mapping the Interaction. Jcua 5 (1), 77–84. doi:10.25034/ijcua.2021.v5n1-6
Keuchel, J., Naumann, S., Heiler, M., and Siegmund, A. (2003). Automatic Land Cover Analysis for Tenerife by Supervised Classification Using Remotely Sensed Data. Remote Sensing Environ. 86 (4), 530–541. doi:10.1016/s0034-4257(03)00130-5
Lambin, E. F., Rounsevell, M. D. A., and Geist, H. J. (2000). Are Agricultural Land-Use Models Able to Predict Changes in Land-Use Intensity? Agric. Ecosyst. Environ. 82 (1), 321–331. doi:10.1016/s0167-8809(00)00235-8
Leao, S., Bishop, I., and Evans, D. (2001). Assessing the Demand of Solid Waste Disposal in Urban Region by Urban Dynamics Modelling in a GIS Environment. Resour. Conservation Recycling 33 (4), 289–313. doi:10.1016/s0921-3449(01)00090-8
Li, X., Wang, M., Liu, X., Chen, Z., Wei, X., and Che, W. (2018). MCR-modified CA-Markov Model for the Simulation of Urban Expansion. Sustainability 10 (9), 3116. doi:10.3390/su10093116
Liping, C., Yujun, S., and Saeed, S. (2018). Monitoring and Predicting Land Use and Land Cover Changes Using Remote Sensing and GIS Techniques—A Case Study of a Hilly Area, Jiangle, China. PLOS ONE 13 (7), e0200493. doi:10.1371/journal.pone.0200493
Markham, B. L., and Helder, D. L. (2012). Forty-year Calibrated Record of Earth-Reflected Radiance from Landsat: A Review. Remote Sensing Environ. 122, 30–40. doi:10.1016/j.rse.2011.06.026
Mishra, V. N., and Rai, P. K. (2016). A Remote Sensing Aided Multi-Layer Perceptron-Markov Chain Analysis for Land Use and Land Cover Change Prediction in Patna District (Bihar), India. Arabian J. Geosciences 9 (4), 249. doi:10.1007/s12517-015-2138-3
Njoh, A. J. (2008). Implications of Africa's Transportation Systems for Development in the Era of Globalization. The Rev. Black Polit. Economy 35 (4), 147–162. doi:10.1007/s12114-008-9032-0
Ojima, D., Moran, E., McConnell, W., Stafford Smith, M., Laumann, G., Morais, J., et al. (2005). Re: Global Land Project. Science Plan and Implementation Strategy:International Geosphere-Biosphere Programme (IGBP). Stockholm: IGBP Secretariat. Report No. 53/IHDP Report No. 19. Available from: www.glp.colostate.edu (Accessed on 02 15, 2020).
Ojo, A., and Ojewale, O. (2019). “Nigeria's Urbanisation History, Trends, Drivers and Implications,” in Urbanisation and Crime in Nigeria (Cham: Palgrave Macmillan), 13–58. doi:10.1007/978-3-030-19765-0_2
Ojo, A., Papachristodoulou, N., and Ibeh, S. (2018). The Development of an Infrastructure Quality Index for Nigerian Metropolitan Areas Using Multivariate Geo-Statistical Data Fusion. Urban Sci. 2 (3), 59. doi:10.3390/urbansci2030059
Olajide, O. A., Agunbiade, M. E., and Bishi, H. B. (2018). The Realities of Lagos Urban Development Vision on Livelihoods of the Urban Poor. J. Urban Manage. 7 (1), 21–31. doi:10.1016/j.jum.2018.03.001
Olanrewaju, F. O., Olanrewaju, A., Omotoso, F., Alabi, J. O., Amoo, E., Loromeke, E., et al. (2019). Insurgency and the Invisible Displaced Population in Nigeria: A Situational Analysis. SAGE Open 9 (2), 2158244019846207. doi:10.1177/2158244019846207
Oluwatayo, I. B., Omowunmi, T., and Ojo, A. O., and (2019). “Land Acquisition and Use in Nigeria: Implications for Sustainable Food and Livelihood Security,” in Land Use: Assessing the Past, Envisioning the Future. Editors L. C. Loures, 91–110. doi:10.5772/intechopen.7999
Otuoze, S. H., Hunt, D. V. L., and Jefferson, I. (2021a). Neural Network Approach to Modelling Transport System Resilience for Major Cities: Case Studies of Lagos and Kano (Nigeria). Sustainability 13 (3), 1371. doi:10.3390/su13031371
Otuoze, S. H., Hunt, D. V. L., and Jefferson, I. (2021b). Predictive Modeling of Transport Infrastructure Space for Urban Growth Phenomena in Developing Countries’ Cities: A Case Study of Kano—Nigeria. Sustainability 13 (3), 308. doi:10.3390/su13031371
Panagos, P., Borrelli, P., Meusburger, K., Alewell, C., Lugato, E., and Montanarella, L. (2015). Estimating the Soil Erosion Cover-Management Factor at the European Scale. Land Use Policy 48, 38–50. doi:10.1016/j.landusepol.2015.05.021
Parsaie, A. (2016). Analyzing the Distribution of Momentum and Energy Coefficients in Compound Open Channel. Model. Earth Syst. Environ. 2 (1), 15. doi:10.1007/s40808-015-0054-x
Peters, C. J., Picardy, J., Darrouzet-Nardi, A. F., Wilkins, J. L., Griffin, T. S., and Fick, G. W. (2016). Carrying Capacity of U.S. Agricultural Land: Ten Diet Scenarios. Elementa: Sci. Anthropocene 4 (1), 1–15. doi:10.12952/journal.elementa.000116
Phiri, D., Simwanda, M., Salekin, S., Nyirenda, V., Murayama, Y., and Ranagalage, M. (2020). Sentinel-2 Data for Land Cover/Use Mapping: A Review. Remote Sensing 12 (14), 2291. doi:10.3390/rs12142291
Pijanowski, B. C., Brown, D. G., Shellito, B. A., and Manik, G. A. (2002). Using Neural Networks and GIS to Forecast Land Use Changes: a Land Transformation Model. Comput. Environ. Urban Syst. 26 (6), 553–575. doi:10.1016/s0198-9715(01)00015-1
Pontius, R. G., and Millones, M. (2011). Death to Kappa: Birth of Quantity Disagreement and Allocation Disagreement for Accuracy Assessment. Int. J. Remote Sensing 32 (15), 4407–4429. doi:10.1080/01431161.2011.552923
Reis, S. (2008). Analyzing Land Use/land Cover Changes Using Remote Sensing and GIS in Rize, North-East Turkey. Sensors 8 (10), 6188–6202. doi:10.3390/s8106188
Roy, D. P., Wulder, M. A., Loveland, T. R., Wooddcock, C. E, Allen, R. G., Anderson, M. C., et al. (2014). Landsat-8: Science and Product Vision for Terrestrial Global Change Research. Remote Sensing Environ. 145, 154–172. doi:10.1016/j.rse.2014.02.001
Sheng, Y., Shah, C. A., and Smith, L. C. (2008). Automated Image Registration for Hydrologic Change Detection in the Lake-Rich Arctic. IEEE Geosci. Remote Sensing Lett. 5 (3), 414–418. doi:10.1109/LGRS.2008.916646
Srivastava, P. K., Han, D., Rico-Ramirez, M. A., Bray, M., and Islam, T. (2012). Selection of Classification Techniques for Land Use/land Cover Change Investigation. Adv. Space Res. 50 (9), 1250–1265. doi:10.1016/j.asr.2012.06.032
Talukdar, S., Singha, P., Mahato, S., Shahfahad, S., Pal, S., Liou, Y.-A., et al. (2020). Land-Use Land-Cover Classification by Machine Learning Classifiers for Satellite Observations-A Review. Remote Sensing 12 (7), 1135. doi:10.3390/rs12071135
Triantakonstantis, D., and Mountrakis, G. (2012). Urban Growth Prediction: A Review of Computational Models and Human Perceptions. J. Geogr. Inf. Syst. 04 (06), 555–587. doi:10.4236/jgis.2012.46060
Turner, B. L., Villar, S. C., Foster, D., Geoghegan, J., Keys, E., Klepeis, P., et al. (2001). Deforestation in the Southern Yucatán Peninsular Region: an Integrative Approach. For. Ecol. Manage. 154 (3), 353–370. doi:10.1016/s0378-1127(01)00508-4
Ulam, S. (1962). On Some Mathematical Problems Connected with Patterns of Growth in Figures. Proc. Symposia Appl. Math. 14, 215–224. doi:10.1090/psapm/014/9947
UNDESA-PD (2019). Re: World Urbanization Prospects 2018: Highlights (ST/ESA/SER.A/421). United Nations Department of Economic and Social Affairs Population Division (UN DESA-PD). Available from: https://population.un.org/wup/Publications/Files/WUP2018-Highlights.pdf [Accessed on 15/04/2019].
Van Genderen, J., and Lock, B. (1977). “Testing Land-Use Map Accuracy,” Paper presented at the Photogrammetric Engineering and Remote Sensing (PE and RS). Available from: https://research.utwente.nl/en/publications/testing-land-use-map-accuracy (Accessed on 12 23, 2020).
Wang, R., Derdouri, A., and Murayama, Y. (2018). Spatiotemporal Simulation of Future Land Use/cover Change Scenarios in the Tokyo Metropolitan Area. Sustainability 10 (6), 2056. doi:10.3390/su10062056
Weng, Q. (2010). Remote sensing and GIS integration: theories, methods, and applications. Available from: http://repository.fue.edu.eg/xmlui/bitstream/handle/123456789/3958/6926.pdf?sequence=1; [Accessed on 20/10/2020].
World-Bank (2016). From Oil to Cities: Nigeria's Next Transformation. Washington, USA: International Bank for Reconstruction and Development / The World Bank. doi:10.1596/978-1-4648-0792-3
Xu, G., Dong, T., Cobbinah, P. B., Jiao, L., Sumari, N. S., Chai, B., et al. (2019). Urban Expansion and Form Changes across African Cities with a Global Outlook: Spatiotemporal Analysis of Urban Land Densities. J. Clean. Prod. 224, 802–810. doi:10.1016/j.jclepro.2019.03.276
Keywords: transport infrastructures, land-use land cover change, urban growth phenomena, dynamic transition modeling, sustainable mobility
Citation: Otuoze SH, Hunt DV and Jefferson I (2021) Monitoring Spatial-Temporal Transition Dynamics of Transport Infrastructure Space in Urban Growth Phenomena: A Case Study of Lagos—Nigeria. Front. Future Transp. 2:673110. doi: 10.3389/ffutr.2021.673110
Received: 26 February 2021; Accepted: 23 April 2021;
Published: 07 May 2021.
Edited by:
Ruimin LI, Tsinghua University, ChinaReviewed by:
Adegbola Ojo, University of Lincoln, United KingdomJunfang Tian, Tianjin University, China
Copyright © 2021 Otuoze, Hunt and Jefferson. This is an open-access article distributed under the terms of the Creative Commons Attribution License (CC BY). The use, distribution or reproduction in other forums is permitted, provided the original author(s) and the copyright owner(s) are credited and that the original publication in this journal is cited, in accordance with accepted academic practice. No use, distribution or reproduction is permitted which does not comply with these terms.
*Correspondence: Suleiman Hassan Otuoze, HSO647@student.bham.ac.uk