 Marialisa Nigro
 Antonio Comi
 Rosita De Vincentis
 Marisdea Castiglione
- 1Department of Civil, Computer and Aeronautical Engineering, University of Rome Tre, Rome, Italy
- 2Department of Enterprise Engineering, University of Rome Tor Vergata, Rome, Italy
Electric micromobility, both as a private option and as a shared service, can represent an alternative to cars, particularly for given user groups (market segments) and specific classes of travel distance. The paper explores the potential for shifting from cars to electric micromobility (specifically, e-bikes and e-scooters) for commuting trips, investigated through floating car data (FCD). The methodology combines the calibration of random utility models (RUMs) and the subsequent simulation through the adoption of FCD spanning the entire city of Rome (Italy). The data used for the calibration of RUM models have been sourced from an online revealed preferences and stated preferences survey carried out between November 2020 and January 2021. Socioeconomic factors, along with transport features (travel time, access time, monetary costs, and perceived safety levels), enter into the definition of the mode choice probability. The first results showed that in Rome, the potential demand for electric micromobility could range between 14% of the FCD sample in the best case (low cost, high accessibility, and road infrastructures with a high perceived level of safety) and about 2% in the worst case (high cost, low accessibility, and a low perceived level of safety).
1 Introduction
In recent years, sustainable mobility options have become widespread in cities, driven by both national and international mobility policies and heightened user awareness. For example, the European Commission recently presented its “Sustainable and Smart Mobility Strategy,” consisting of 82 initiatives across 10 flagships (i.e., key areas for action) that should guide the evolution of mobility within Europe for the next years. The aim is to cut 90% of pollutant emissions by 2050 as well as to have more smart, competitive, safe, accessible, and affordable transport (European Commission, 2019). In this context, several directives and policies about urban mobility have encouraged the potential shift to electric and active mobility and the development of a sustainable approach to multimodality (Eltis, 2019; Gössling, 2020).
Then, to enhance the quality of life, city planners must devise, support, and implement measures that satisfy the mobility needs of people and enterprises within cities and surrounding areas. Promoting public transport is one strategy that can be used to mitigate the reliance on cars and favour more environmentally friendly modes of transport in urban areas. Public transportation should be the cornerstone of sustainable urban mobility, and the only way to achieve this is through the integration of services into a multimodal network, encouraging interchanges between different transportation modes (Russo and Rindone, 2023). In this context, micromobility can play a key role in facilitating the modal shift, especially in urban contexts, where it could be integrated into a broader mobility platform to balance “the right to access and mobility on the one hand, and the right to clean air and living quality on the other hand” (Musolino et al., 2022; Cirianni et al., 2023).
At the same time, the recent impacts of the COVID-19 pandemic highlight the need for an increasing number of individual mobility options. As shown by some studies (Paydar and Kamani Fard, 2021; Cirianni et al., 2022), several cities worldwide have expanded their cycling/walking infrastructures to increase their resilience in the face of the COVID-19 pandemic. Additionally, travel behaviours have been significantly influenced by the perceived risk of infection, leading to a shift in demand towards active mobility and micromobility. Therefore, in this fast-evolving transport environment, micromobility can be seen as a potential solution to moving people more efficiently around cities, particularly when replacing trips made in private cars. Electric micromobility (e-micromobility), characterized by electric micro-vehicles that are small in size and reach moderate speeds, may thus help in covering both short single-mode trips and longer trips, when combined with public transport (i.e., as a multimodality option), contributing to alleviating car use (Abduljabbar et al., 2021).
Due to the heterogeneity of electric micro-vehicles (Sandt, 2019), for the purposes of this study, a micromobility device is defined as a light motorized vehicle used for transporting people and goods, not subject to type-approval for on-road use, in accordance with the definition provided by Holve et al. (2020). Given the high diffusion of e-bikes and e-scooters, especially in the European Union and Italy (Nigro et al., 2022; Comi and Polimeni, 2024), only these last two electric micro-vehicles have been considered in this study.
In this context, understanding the potential demand and the factors and features defining the choice of electric micro-vehicles is essential to evaluate the effectiveness of sustainable mobility policies as well as the strategies of the involved operators (sharing e-micromobility operators, transport agencies, and energy providers). In fact, the e-micromobility challenge lies in finding the right equilibrium that meets the needs of cities and citizens while ensuring that the interests of service providers can be respected.
Therefore, the aim of this paper is to assess the potential shift from cars to e-micromobility, applying the proposed methodology to commuting trips in Rome, Italy. The approach combines the simulation of commuting car trips performed through floating car data (FCD) for characterizing the car trips and the traditional discrete choice modelling for the identification of the potential shift of each car trip. FCD are obtained from vehicle tracking and are currently provided by owners (or administrators) of vehicle fleets, such as taxi fleets, private vehicle tracks, or ride-hailing services (Neun et al., 2023). According to Nigro et al. (2022), FCD covering the entire city of Rome are assumed to be a representative sample of private mobility, at least in terms of travelled distances and times.
Preliminary results of the potential shift from private transport to e-micromobility have been developed to investigate urban freight delivery. In particular, the potential for crowdshippers to use micromobility devices has been investigated through probabilistic-behavioural models. The reader can refer to Castiglione et al. (2022) for more details. This article, moving from such first results, proposes further models that allow us to consider further types of micromobility devices calibrated using different techniques. The potential benefits of shifting commuting trips from private cars to e-micromobility are assessed through the developed models, which allow us to evaluate the stability of the estimates and the benefits that can be obtained through the e-micromobility shift.
The article is organized as follows: in Section 2, the state of the art about e-micromobility is presented, while Section 3 outlines the proposed methodology. This section begins with a presentation of the survey and its results, followed by an explanation of how the calibration database was organized. Additionally, it includes a concise introduction to random utility models (RUMs) and details the process of performing simulations using FCD. In Section 4, the developed models are presented, along with the estimated potential shift towards e-micromobility in Rome, Italy. The paper concludes with Section 5, which discusses the conclusions and potential future developments.
2 The state of the art
The number of scientific works on e-micromobility is growing alongside their widespread adoption. While most studies focus on e-bikes, literature about e-scooters is increasing rapidly. E-micromobility is studied both as a solution for first- and last-mile trips in the case of multimodal transport and as a single-mode option for shorter journeys.
Distances and related travel times can greatly influence the choice of e-micromobility. Scott Smith and Schwieterman (2018) suggest that e-scooters are used as a single mode for trips up to 3 km; beyond this distance, they can become an option for multimodal transport. Porsche Consulting (2019) found that the travelled distances by e-scooters were between 1 km and 4 km, and the travelled distances by e-bikes were between 1.5 km and 9 km. Chang et al. (2019) analysed shared e-scooter data from Austin, Louisville, Minneapolis, and Washington D.C. in the United States, stating that around 95% of users travelled up to 5 km. If we consider that in the United States, about 60% of car trips are less than 10 km (FHWA, 2017), while in Europe, 50% of trips by car are less than 5 km (UNECE, 2020), the potentiality of e-micromobility as a substitute for a car, at least in terms of travelled distances, becomes clear.
Surveys conducted by Baek et al. (2021) showed that travel time is significantly important for last-mile trips using e-micromobility; in Axhausen and Reck (2021), travel time is reported as the main factor influencing the choice of shared e-micromobility.
Additional factors to be considered for replacing short car trips with e-micromobility include trip purpose, the complexity of trip chains, the travel environment, the road infrastructure conditions, the safety perception, and certain socioeconomic characteristics and user attitudes. Fan and Harper (2022) estimated that approximately 18% of short car trips could be replaced by e-micromobility in Seattle when considering commuter age, tour and trip purposes, time of day, and weather limitations. McKenzie (2019), Jiao and Bai (2020), and Christoforou et al. (2021) found that shared e-scooters are used mainly for recreational purposes. Caspi et al. (2020) observed that trips on shared e-scooters involved road infrastructures whose characteristics are compatible with micromobility.
Road infrastructures with low speeds, such as local or tertiary roads, are perceived as more compatible with e-micromobility (Portland Bureau of Transportation, 2019; Zhang et al., 2021). Bike lanes and multi-use paths are indeed the most used by e-scooter users (Zhang et al., 2021); moreover, sidewalks are considered attractive for e-scooters, but these are usually off-limits to ensure pedestrian safety (James et al., 2019).
Safety perception is one of the most deterrent features in the choice of micromobility (Sanders et al., 2020; Bao and Lim, 2022). Cubells et al. (2023) showed that e-micromobility route choices are impacted by urban elements related to safety, accessibility, and aesthetics, pointing out the importance of considering the surrounding environment to ensure user safety. In this regard, several studies confirmed that dedicated infrastructures (Greibe and Buch, 2016; Park and Abdel-Aty, 2016; Hossein Sabbaghian et al., 2023) that can be shared by both cyclists and e-scooter users, as well as pavement conditions (López-Molina et al., 2023; Mitropoulos et al., 2023) are key elements to micromobility safety perception and, consequently, to e-micromobility adoption. A tailored, suitable infrastructure that enables cyclists and e-micromobility users to be separated from motorists is much more likely to be chosen when compared to other safety measures. However, the safety perception is not only related to the interaction with motorists; Wang et al. (2023) highlight public concerns regarding interactions between e-scooter riders and pedestrians, further underscoring the need for adequate road space and infrastructure to promote e-micromobility services effectively.
Regarding socioeconomic factors, sharing e-micromobility users are mostly young, male individuals, with high incomes and high education levels (Axhausen and Reck, 2021; Christoforou et al., 2021; Nikiforiadis et al., 2021). Non-functional factors such as environmental concern, innovativeness, and a sense of belonging associated with using that particular transport mode can be even more important for users in choosing e-micromobility (Axhausen and Reck, 2021; Bretones and Marques, 2022); additionally, lifestyle and cultural norms may also impact mode substitution (Fukushige et al., 2021).
According to the literature review presented above, e-micromobility is seen as a potential solution to moving people more efficiently around cities and replacing trips done by cars. These new services are well received by users, as clearly demonstrated by their large and rapid adoption. Consequently, there is a growing need to investigate these new transport modes as a competitive alternative to cars. In addition, given the desirability of a forecasting tool for modal share to be used in city planning, this article presents various mode choice models for estimating the potential shift from cars to e-micromobility among commuters. Indeed, exploration of mode substitution for commute trips is explicitly required in the literature (Fukushige et al., 2021). The opportunity offered by telematics is used here to infer commuters’ trips in a real case study (Rome, Italy) and assess the potential mode shift, providing an operative tool for city planners to evaluate the reduction in reliance on private car use and, thus, support the modal shift.
3 The proposed methodology
The paper employs revealed preference (RP) and stated preference (SP) surveys to investigate, through RUM models applied to FCD, the potential for shifting from cars to e-micromobility, in particular e-bikes and e-scooters, for commuting (Home–Work and Home–School) trips. Different scenarios are considered (e.g., individual e-micromobility vehicle ownership or e-micromobility sharing service usage), with a focus on Rome, Italy.
The general framework is designed to be used as a tool for estimating the potential demand that can shift from private cars to e-micromobility. In particular, it provides the shift potential to e-bikes and e-scooters for commuting trips as an output. Its key features include the use of RP and SP surveys to investigate user behaviours and the use of GPS-based data (i.e., FCD) to identify and characterize car trips. Home-based commuting trips by car are highlighted as these types of trips do not usually entail significant changes in travel attitudes and operations when shifting from private cars to e-micromobility (unlike trip chains or multi-daily activity travels).
Once the study area is defined, the procedure consists of the following steps (Figure 1):
• Revealed and stated preference (RP and SP) surveys: allow us to 1) reveal the current travel behaviours by users; 2) evaluate user behaviour when users are faced with different possible e-micromobility scenarios;
• RUM development: based on the RP and SP results, panel data are set up, and RUM models are calibrated (i.e., coefficients of the models and their statistical significance are estimated) and validated (i.e., the capacity of the models in reproducing the sample choices is assessed as well as their potentiality to be applied to further scenarios);
• Floating car data (FCD): two sets of floating car data from the study area for the years 2015 and 2019 are analysed to identify and characterize commuting car trips;
• Shift potential: based on the characteristics of car trips derived from FCD analysis and the developed RUM models, the potential shift from cars to e-micromobility is estimated;
• Comparison and validation: we argue that if the main attributes describing users’ mode choice behaviour have remained consistent between 2015 and 2019, applying RUM models to the two different FCD datasets should yield similar results. This consistency allows the entire methodological approach to be validated.
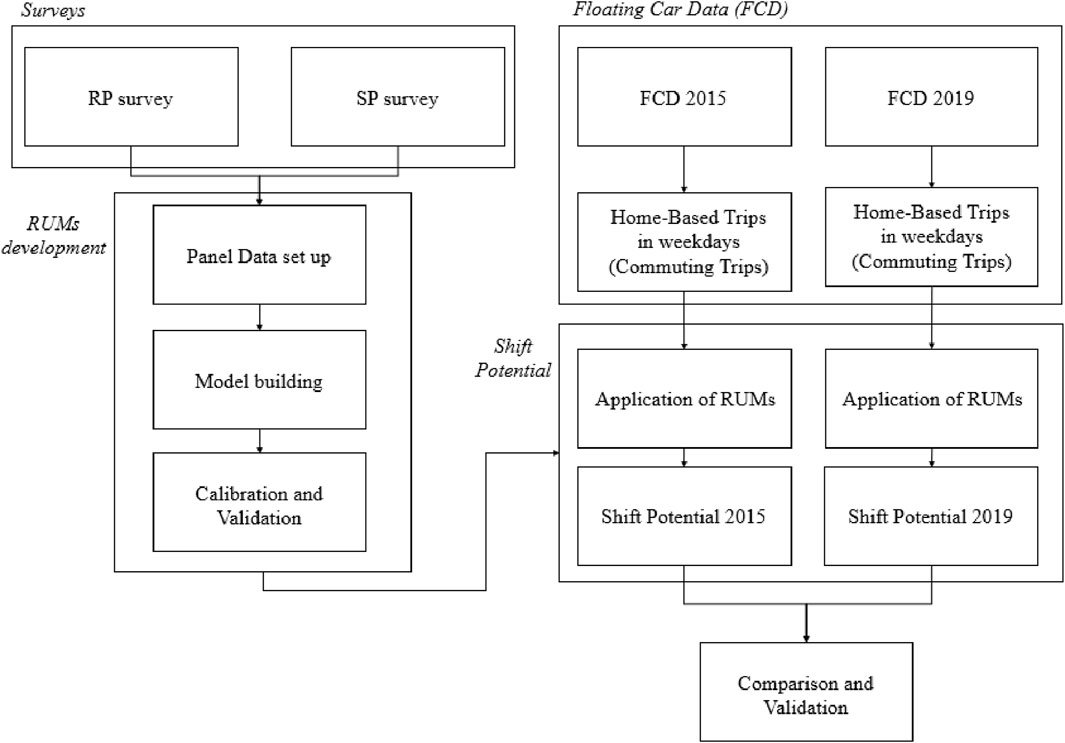
Figure 1. Proposed methodology.
3.1 Surveys
The first stage of the methodology is investigating user travelling habits and mode choices. The survey design and the selected attributes and levels used in the SP survey were based on a comprehensive literature review related to travel behaviour on e-micromobility (Guo and Zhang, 2021; Nikiforiadis et al., 2021; Weikl and Mayer, 2023) and on previous research experience and knowledge in this field (Nigro et al., 2021; Comi et al., 2022; Nigro et al., 2022; Comi et al., 2024). The following subsections describe the survey design and present the main results obtained.
3.1.1 The survey design
The data used for developing the choice models were gathered through the administration of a survey of about 300 inhabitants of Rome between November 2020 and January 2021. The message of the questionnaire emphasized the importance of collecting data on commuting trips and mentioned that the respondents would be introduced to the use of e-micromobility options for their commuting trips. The survey was distributed via various channels, including social media networks, instant messaging apps, and email. Despite the potential impact on the response rate as well as on the overall representativeness of the sample, incentives were not offered to respondents due to budget constraints and to overestimate younger people’s participation, given that younger people are more sensitive to incentives. The survey consists of four sections:
(i) A personal data section to collect data on age, gender, and employment status. This section was used to select users having personal characteristics that are compatible with the study and to filter out those who do not engage in regular Home–Work or Home–School commuting, such as retirees or unemployed individuals. The remaining users were split into three categories: Workers, Students, and Working Students;
(ii) A sociodemographic data section to collect further data on the users and their households, such as level of education, place of residence, number of household members, and drivers’ licence ownership;
(iii) A commuting trips data section to investigate trip destination (workplaces or schools/universities), ownership and availability of private vehicles (car, moped/motorbike, bike/e-bike, and e-scooter), transport mode mainly used to carry out the specific commuting trip, travel times, parking availability, and public transport subscription ownership;
(iv) Hypothetical e-micromobility scenarios to be evaluated through SP scenarios;
(v) Potential e-bike or e-scooter ownership, considering willingness to purchase the micro-vehicle, travel times, and perceived road safety level;
(vi) Potential e-bike or e-scooter sharing service usage, considering service costs, walking time to access the shared micro-vehicle, and perceived road safety level.
3.1.2 Survey sample and data collected
The obtained survey data were cleaned and processed to identify missing data or inconsistencies within the dataset. From the original survey, 239 valid respondents were suitable for this study. Table 1 shows the sociodemographic characteristics of the user pool (data gathered through the earlier described questionnaire Sections 1, 2). It emerged that the sample has a higher share of younger people comprising population segments that are affected by a higher interest towards such a survey and segments with a potential to be e-micromobility users (Axhausen and Reck, 2021; Christoforou et al., 2021; Kwak and Radler, 2002). Such features were taken into account in discrete choice model development, using adequate weights for age strata.
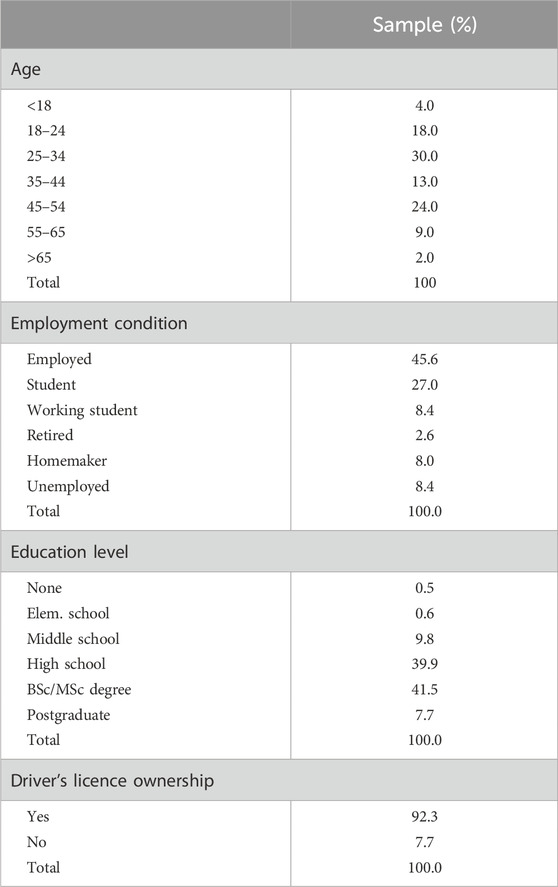
Table 1. Personal and sociodemographic data.
Section 3 investigated regular Home–Work and Home–School trip characteristics. The respondents were questioned about the frequency (with the option to choose between always, often, rarely, and never) of availability of different private vehicles: 64% of respondents always had a car available to use, and 11% of respondents always had either a moped or motorcycle available to use (compared to the 72% of the entire population who always had a car plus a moped/motorcycle available; RSM, 2020). As for private micromobility vehicle availability, 34% of users always have a bike available (compared to 29% of the entire population; RSM, 2020), and a further 41% of participants consider having a bike often/rarely. The percentage of users who have a private e-scooter available to use is much lower (6%), and the percentage of users who never have an e-scooter available is 64%.
Then, users were questioned about the transport mode used most of the time to carry out their regular trips to work or school. The recorded results were vastly different between workers and students, with the car being by far the most prevalent transport mode among workers (76%). As for students, 43% choose the car as their preferred mode of transport to reach their school/university, whereas 48% use public transport (either subway, train, or bus). Only 3% of workers and 2% of students picked bikes or e-scooters as their transport mode of choice.
All respondents were asked about the average travel time to reach their regular destination using their chosen mode of transport: 72% of respondents take less than 30 min to reach their destination using either private cars (or motorcycles) or public transport, with the majority taking between 16 min and 30 min on average; 92% of respondents claimed that parking for private vehicles was available at their destination, and most had free parking. Lastly, 27% of respondents (47% of students) have either a monthly or annual public transport subscription.
In the last section of the survey, the respondents were presented with a series of questions assessing the perceived safety level when travelling by an e-bike/e-scooter, maximum usage time, and willingness to purchase an e-micro-vehicle that would allow the users to consider using e-micromobility as a potential transport mode.
In terms of safety concerns, the users were given several scenarios with different infrastructural/traffic conditions and were asked to pick the one in which they would be willing to use an e-bike or an e-scooter. The presented scenarios investigating safety concerns were inspired by the level of traffic stress (LTS), which is an indicator that quantifies the stress experienced by cyclists or pedestrians on segments of a road network (Furth et al., 2016). Results showed that 44% of respondents were willing to use an e-bike only if bike lanes fully separated from car traffic were available, 21% only if bike lanes of any type, even not physically separated from traffic, were available; 23% of users were willing to use an e-bike even if bike lanes were not available but only on roads with low levels of traffic, whereas 4% declared to be willing to use an e-bike on roads with any traffic condition. Lastly, 8% of users were not willing to use an e-bike in any of the conditions mentioned above. For e-scooters, 39% would be willing to use them on bike lanes physically separated from traffic, and 16% would use them on any type of bike lane. Then, 10% of users were willing to use e-scooters on low-traffic roads, and only 3% were willing to use them on roads with any level of traffic. Compared to e-bikes, a much higher percentage of users (32%) were not willing to use an e-scooter in any of the safety conditions mentioned above. This result confirms what can be found in the literature, where e-scooter riders usually perceive a higher risk potential (Useche et al., 2022).
In terms of willingness to purchase an e-micromobility vehicle, 11% of respondents claimed to be willing to purchase an electric bike, and 41% would be willing to purchase an e-scooter. Lastly, the maximum travel time that users would be willing to spend on an e-micromobility vehicle was investigated: 74% of the respondents were willing to ride an e-scooter for up to 30 min; respondents were willing to ride an e-bike for a longer time (48% for more than 30 min, Figure 2).
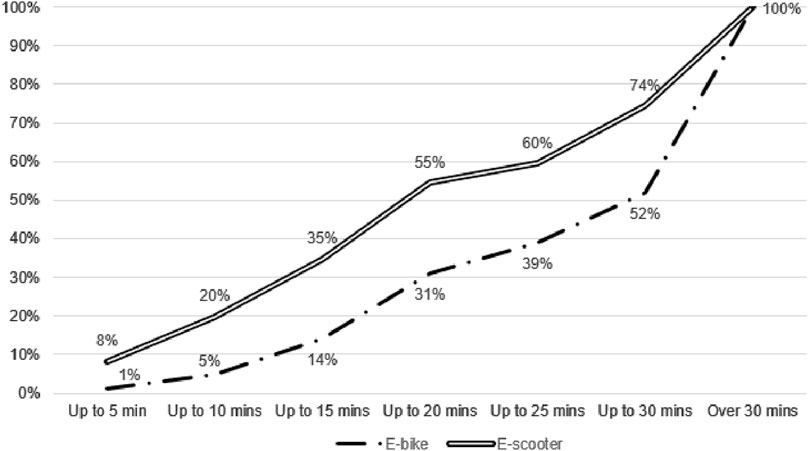
Figure 2. Maximum usage time for e-bikes and e-scooters.
Two additional factors were considered to investigate users’ willingness to use an e-micromobility sharing service: access time and service costs (Guo and Zhans, 2021). The access time impacts the service quality because shared e-scooters and e-bikes are mostly accessed on foot (Ham et al., 2021). Thus, guaranteeing the presence of e-vehicles within walking distance is crucial for promoting modal shift. Indeed, most users (87%) would only consider walking for up to 5 min to reach a shared vehicle. Service cost is a common explanatory variable in mode choice models and is one of the main barriers to using e-micromobility services, especially for low-income users (Rodriguez-Roman et al., 2022). The respondents were presented with several fare options inspired by the e-micromobility sharing services currently active in Rome (Figure 3). These were presented as a function of travel time (for 5 min trips, 15 min trips, and 30 min trips): 20%–22% of respondents were not willing to use an e-bike sharing service given the presented costs (22% for 5 min trips and 20% for 15-min and 30-min trips), whereas 34%–38% of respondents were not willing to use an e-scooter sharing service (35% for 5-min trips, 34% for 15-min trips, and 38% for 30-min trips). However, of the users who showed interest in using an e-micromobility sharing service, the majority selected the lowest cost presented in the survey (boxes in Figure 3).
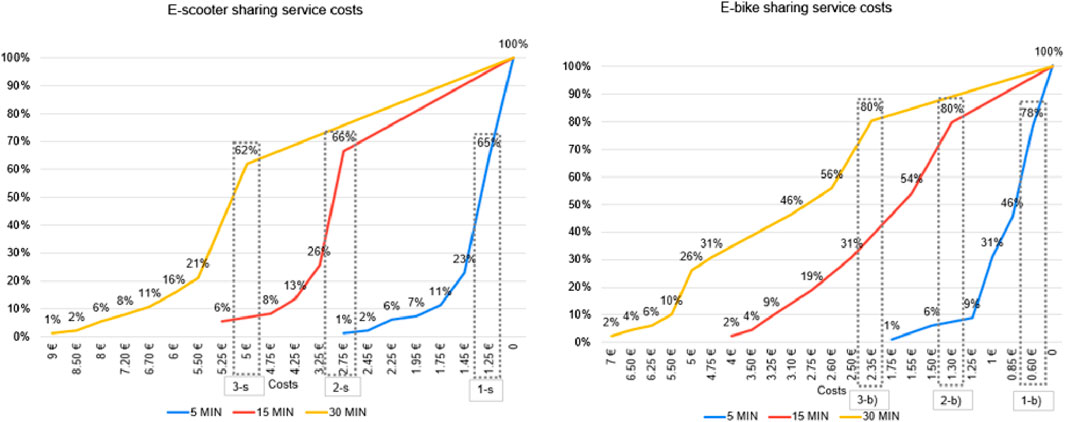
Figure 3. Cumulative trend of adopting e-micromobility shared services as a function of service cost and travel time.
3.2 RUM development
According to the data collected, the RUMs were developed, as summarized in the following subsections.
3.2.1 Model building and set up of the panel data
The procedures implemented for developing the RUMs are described below. The models aim to investigate the potential usage of e-bikes and e-scooters. Specifically, the main objective was to develop a model capable of evaluating the potential choice among the following three alternatives:
• use their own e-micro-vehicle, that is, the user is interested in buying their own e-micro-vehicle;
• use an e-micromobility sharing service, that is, the user is interested in using shared services;
• keep using the current transport mode (not-alternative), that is, the user is not interested in using e-micromobility (whether owned or shared), preferring to travel as usual.
As depicted in Figure 4, when choosing an e-micro-vehicle, the two alternatives of e-scooter and e-bike are assessed, with each of them considering its possible adoption or not.
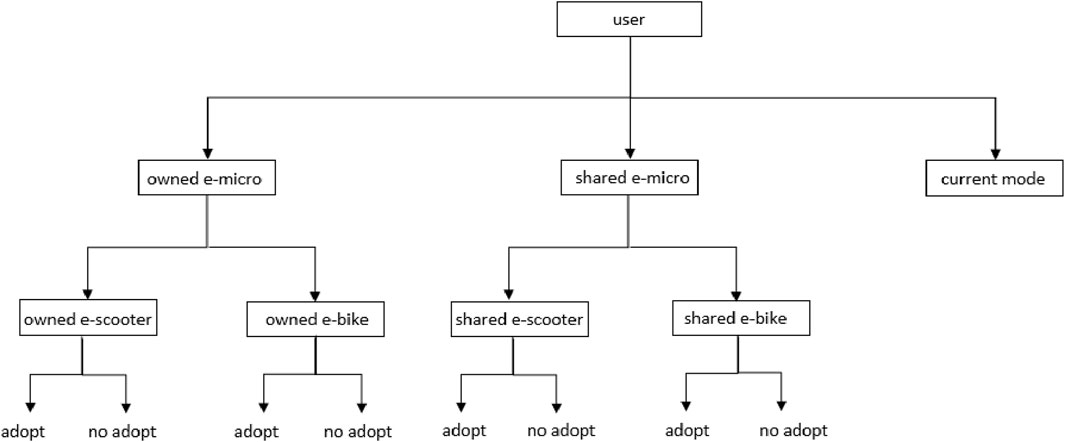
Figure 4. Decision tree for choosing an electric micromobility option.
The decision structure results in a complex nested structure. To simplify the process, we decided to follow a sequential approach in building the models, moving from the bottom of the decision tree to the upper level. As a consequence, we started from the following simple binomial logit:
1. adopting an owned e-bike/not adopting (i.e., keep using the current transport mode),
2. adopting an owned e-scooter/not adopting (i.e., keep using the current transport mode),
3. adopting e-bike sharing service/not adopting (i.e., keep using the current transport mode),
4. adopting e-scooter sharing service/not adopting (i.e., keep using the current transport mode).
Finally, we progressed to a trinomial model evaluating the following choices:
1. acquiring an owned micro-vehicle,
2. using an e-micromobility sharing service,
3. continuing with the current transport mode.
Following the approach of Fukushige et al. (2021), we identified travel time as a basic trip attribute in studying mode substitution for commuting trips. However, because travel times using e-micromobility were not collected during the survey, this information has been simulated as the ratio between the origin-destination distance and the average e-micromobility vehicle speed. We assumed average speeds of 20 km/h for e-bikes and 10 km/h for e-scooters based on literature and experimental values provided by the e-scooter sharing service Dott in Rome (Nigro et al., 2022). However, travel times and other network features can be derived from FCD, as shown in the literature (Alonso et al., 2023). The sharing service options are considered unavailable to the users if their travel times are either less than 5 min or more than 30 min. This criterion is based on the assumption that for trips with travel times lower than 5 min, the user would prefer walking, whereas, for trips with a travel time longer than 30 min, the service would be too taxing and expensive for the user.
Just like e-micromobility travel times, certain other features or behaviours were not explicitly requested from users. Therefore, these have been appropriately simulated and processed in order to be included in the calibration process. For instance, considering the simulated e-micromobility travel times and the costs that users were willing to accept for commuting with a shared micro-vehicle, potential pricing options were computed by giving the users two scenarios to choose from. In the first scenario, the trip cost is calculated by increasing the current price by the standard deviation of the proposed costs, whereas in the second scenario, the price of the trip is decreased by the same amount.
Two scenarios were also presented for access time, which refers to the duration users are willing to walk to reach a particular shared e-micro-vehicle. In the first, the users are presented with an access time that has been halved from the declared expected time, whereas in the second, we presented them with an access time increased by half of the expected access time declared.
Regarding safety concerns, similar to the level of traffic stress (LTS) classification by Furth, Mekuria and Nixon (2016), e-micromobility safety is assessed using a Likert scale ranging between 0 and 4, where 0 represents the user’s willingness to use an e-micromobility vehicle in any road safety condition, 3 represents a user’s willingness to use an e-micromobility vehicle only on bike lanes physically separated from traffic, and, lastly, 4 denotes a user who would never use an e-micromobility vehicle regardless of infrastructural conditions. In scenarios where the perceived safety is extremely low, the vehicle is not considered to be an available choice for the user.
Some features were defined as binary or ordinal variables to simplify the segmentation of the market. These include the following:
• gender, as a binary attribute (1 if female, 0 otherwise);
• age, as an ordinal variable with six classes (18–24, 25–34, 35–44, 45–54, 55–65, >65);
• age_bis, as a binary attribute (1 if age ≤34 years, 0 otherwise);
• level of education, as an ordinal variable (ranging from 0 if the user has no education to 5 if the user has a postgraduate degree).
Micromobility vehicle ownership, along with the user’s propensity to eventually purchase a micro-vehicle, are both factored into the ownership-based models. This means that if a user neither owns an e-micromobility vehicle nor intends to buy one, then the ownership-based alternative is not available to them, and they are excluded from the sample for the ownership-based models.
The users’ choices are then determined by comparing the information they declared with the hypothetical scenarios presented. For example:
• if the travel time with an e-micro-vehicle does not exceed the user’s maximum acceptable travel time, and the perceived infrastructural safety of the proposed scenario is at least equal to the user’s minimum requirement, then owning an e-micro-vehicle is considered to be a feasible option;
• in addition to the conditions mentioned above, if the time needed to access a sharing e-micromobility service does not surpass the maximum duration the user is willing to walk to reach it, and the cost of the service presented in the given scenario is within the user’s acceptable range for their specific commuting trip, then the shared service is considered to be a viable option.
3.2.2 Model specification, calibration, and validation
Multinomial logit models belong to the family of random utility models (Train, 2002). The basic hypothesis is that the user (decision maker) i assigns to each alternative j in their choice set a perceived utility or “attractiveness”
The logit model assumes that the random elements εj are distributed independently and identically with a Gumbel distribution with a scale parameter ϑ. This hypothesis allows the computation of the probability of choice p with a closed form (Eq. 2):
The systematic utility part V is the mean perceived utility among all individuals who have the same characteristics. It is expressed as a function of explanatory variables (attributes
In all binomial logit models, which represent the lower level of the decision tree in Figure 4, the systematic utility V of not adopting e-micromobility (both owned and shared) is set as the reference alternative and is, therefore, set equal to 0. The main attribute considered in all the other systematic utility functions is the travel time, while additional attributes were sequentially added or removed, and their statistical significance was tested.
For thoroughness, attitudes such as individual needs, values, tastes, and capabilities (Eccarius and Lu, 2020; Nikiforiadis et al., 2021) are indirectly captured in the proposed model through socioeconomic characteristics or by alternative specific constants due to possible difficulties in their definition.
The estimation of the coefficients occurs through the maximization of the natural logarithm of the likelihood function, formed by the sum of the natural logarithm of the probability of the chosen alternative (j′) of each user i (Eq. 4):
Beyond the “standard” logit model, a variant has also been investigated: the penalized logit (also called weighted logit; Bierlaire, 2018; Train, 2002; Cascetta, 2009). In this model, a number of market segments are defined based on either the socioeconomic characteristics of the users or the transport mode chosen to carry out the trip. The weight w assigned to the user segment g can either increase or decrease the significance of that segment’s probability within the maximization of the log-likelihood function, as can be observed in Eq. 5:
Thus, the penalized logit can be beneficial when a segment of users is disproportionately represented in the sample. In our study, this occurs with users opting for shared e-micromobility services. Once the models have been specified and calibrated, the reasonableness and significance of the estimated coefficients are verified. Additionally, the model’s capacity to replicate the choices made by the sample of users is evaluated. The assumptions underlying the model’s functional form are also tested.
In particular, preliminary (or informal) tests refer to the expectations regarding the signs of the estimated coefficients and the relationships between their values. Subsequently, the asymptotic properties of maximum likelihood estimates are exploited to test different assumptions on the estimated parameters (formal tests). The null hypothesis that the true value of a coefficient is equal to zero and its estimate differs from zero due to sampling errors has been checked through the t-test and the p-value tests. The model’s ability to reproduce the choices made by the sample of users has been measured by using the rho-square statistic ρ2. Another informal statistic has been used: the %-of-right. This statistic relates to the percentage of observations in the sample for which the chosen alternative is the one with the maximum probability as predicted by the model. Other synthetic statistics used are the choice percentage observed and predicted by the model for each alternative. The former is given by the ratio between the number of users choosing each alternative and the total number of users to whom it is available (i.e., market share). The latter is obtained as the average of choice probabilities given by the model for the users to whom the alternative is available (i.e., simulated probabilities; Cascetta, 2009).
3.3 Floating car data and shift potential
The article focuses on integrating new data sources, such as FCD, with traditional behavioural-based RUM models. FCD are recorded from probe vehicles that are equipped with a device, the on-board unit (OBU), that tracks the vehicle position and collects information at high spatial coverage. The OBU records the sequences of location points during the trips, in addition to the start and stop points, thus storing all the characteristics of the vehicle’s path. The recording frequency of the vehicle’s position is currently set as follows (Liberto et al., 2018): 1) every 30 s when the vehicle is located along the motorway network or some main roads in metropolitan areas; 2) every 2 km on the remaining roads.
In this paper, the calibrated models have been applied to an FCD dataset, referred to as the 2015 Floating Car Dataset, that spans the entire metropolitan area of Rome to evaluate the potential e-micromobility demand within the city. The dataset refers to 243,784 monthly monitored vehicles, with more than 300 million trips recorded and a 7% penetration rate (Nigro et al., 2022). The FCD were collected in November 2015 and have been analysed to filter out potential errors, that is, by eliminating trips whose travel times and distances are inexplicably long (or short) considered the study area. A trip concatenating process is also conducted to filter out brief stops (less than 10 min long) in order to avoid errors due to loss of GPS signal or functionality issues of the engine.
The residence location procedure of Nigro et al. (2021) was implemented to determine whether the start/end point of each probe vehicle’s trip is the home. This approach utilizes GIS tools for spatial analysis and employs clustering techniques based on the number and duration of overnight stops. The filtered-out, refined database consists of 9,148,710 records, of which 43.45% are home-based and occurred on weekdays.
Another floating car database, focussing on the municipality of Rome and collected in October 2019, was utilized for validation purposes. The number of trips is around three million, involving 43,270 vehicles. The same filtering criteria applied to the 2015 Floating Car Dataset were used here, enabling a comparative analysis between the two datasets. The final 2019 Floating Car Dataset consists of 808,370 records, of which 44.20% are home-based trips on weekdays. Both the 2015 and 2019 datasets have been previously used in other studies (Nigro et al., 2021; Nigro et al., 2022).
Given our interest in the potential modal shift towards e-micromobility options for commuting trips, we focused solely on weekday trips classified as home-based in the FCD, as these have the highest likelihood of being commuting trips. For each record and for each possible scenario presented to the users beforehand, the utility of the considered alternatives, as well as the choice probabilities, are computed. Then, for each alternative, all the computed probabilities are averaged over the total number of FCD records to obtain the average choice probability. These average choice probabilities give the proportion of potential demand in the Floating Car Dataset.
Some model attributes are not detected by the OBU, so they must be computed and hypothesized through several scenarios for each record of the dataset. The travel time by micro-vehicle is computed knowing the trip length and assuming, as introduced above, average speeds of 20 km/h for e-bikes and 10 km/h for e-scooters. The cost of the sharing service is assumed to be a function of the resulting micro-vehicle travel time and the different fees adopted by the sharing companies in Rome, considering, in particular, the cheapest, the most expensive, and the average fee. Infrastructural safety level and access time are unrelated to the Floating Car Datasets; therefore, they are defined according to different scenarios.
The collected data show that 4% and 32% of respondents are not willing to use an e-bike or an e-scooter, respectively, regardless of the safety conditions presented. However, 28% of users stated their willingness to purchase a micro-vehicle (24% said they would buy an e-bike, and 32% said they would buy an e-scooter). It is apparent that the willingness to use a micro-vehicle and the willingness to buy, despite safety concerns, are intertwined. Given the collected observations, we argue that users who are not willing to use a micro-vehicle in any safety condition are also not willing to purchase it. Therefore, The willingness to purchase a vehicle is implicitly included by considering the alternative to be available only for 28% of records.
The willingness to purchase a micro-vehicle is irrelevant in models that inquire about user interest in sharing service use; thus, only the willingness to use the vehicle despite safety concerns is considered, and the availability of the micromobility alternative is adjusted based on the percentage of the sample that is not willing to use the micro-vehicle under any safety circumstance.
For clarity, a step-by-step description of the simulation methodology is presented:
1. for each home-based trip in the FCD dataset, the independent variables are extracted;
2. for sharing models, a travel time constraint is considered for each trip (i.e., when travel time is either lower than 5 min or higher than 30 min, there is no chance for the sharing option to be chosen);
3. for each trip and for each scenario, the probability for each alternative is computed. The average probability for each scenario is then obtained;
4. for ownership models, the availability of the alternative is adjusted by taking into account the percentage of users who are willing to purchase the vehicle (28% on average);
5. for sharing models, the availability of the alternative is adjusted by taking into account the percentage of users who are not willing to use the micro-vehicle under any safety circumstance;
6. the results of the simulation are validated using a different FCD dataset.
4 Modelling results and discussion
4.1 Calibration results
The calibrated RUMs are presented in this section. The models are structured to address different levels of the decision tree. For the lower level of the decision tree, we have calibrated the following binomial logit models:
• model 1—adopt an owned e-bike vs. not adopt (i.e., keep using the current transport mode);
• model 2—adopt an owned e-scooter vs. not adopt (i.e., keep using the current transport mode);
• model 3 (penalised logit)—adopt e-bike sharing service vs. not adopt (i.e., keep using the current transport mode);
• model 4 (penalised logit)—adopt e-scooter sharing service vs. not adopt (i.e., keep using the current transport mode);
At the upper level of the decision tree, we have developed a trinomial penalised logit model. This model evaluates the choice of owning a micro-vehicle, using an e-micromobility sharing service, and sticking with the current transport mode. All these models were calibrated using Biogeme, an open-source software application designed for the estimation of discrete choice models, as in Bierlaire (2023).
4.2 Model 1—adopt owned e-bike
The expression of the systematic utility V related to the calibrated model is based on Eq. 6. The features and factors considered by the model are the travel times by e-bike, the dummy variable age_bis (as described in Section 3.2), and the infrastructural safety level.
Multiple observations were obtained from each respondent; specifically, four infrastructural safety level scenarios are defined, thus obtaining 956 total observations and 740 cases (i.e., the total number of observations minus the not-available ones; Table 2). The systemic utility to choose the alternative “adopt e-bike” was expressed as follows:
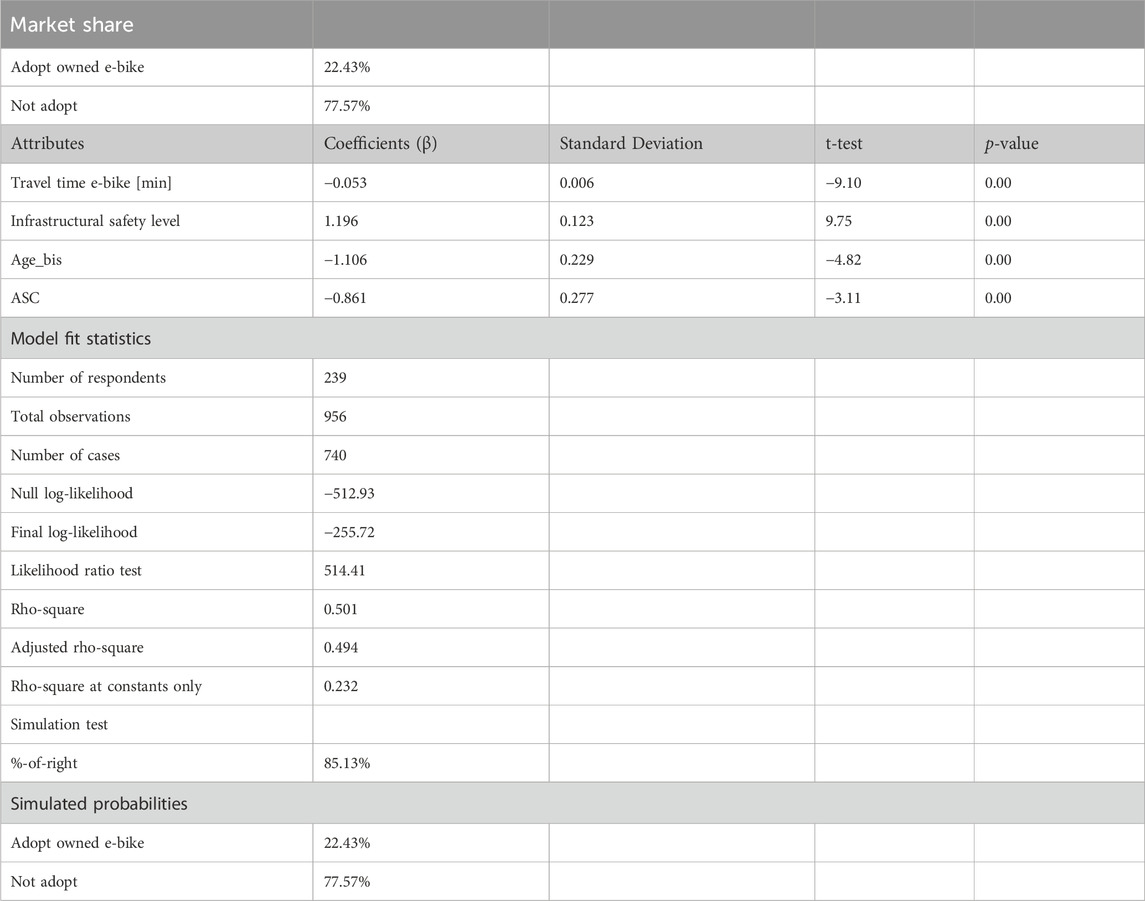
Table 2. Adoption of owned e-bike.
The calibrated coefficients and the model evaluation tests are highlighted in Table 2. As expected, the probability of using e-bikes decreases if travel time increases; that is, the user prefers to continue to travel as usual. For increasing infrastructural safety levels, there is a higher propensity to switch to e-bikes (positive sign of the coefficient β). A negative coefficient for age_bis means that owned e-bikes are mostly chosen by users with age >34 years: older people may be better able to afford an e-bike and also have less energy to use an e-scooter. Older people could also be more familiar with bikes (and, thus, with e-bikes) than e-scooters.
4.3 Model 2—adopt owned e-scooter
The systemic utility to choose the alternative “adopt owned e-scooter” is expressed as follows:
As in model 1, features and factors influencing the choice probability are travel times, infrastructural safety level, and age. However, age is adopted as an ordinal variable with six classes, and, as reported in Table 3, its negative coefficient β means that young users are more inclined to adopt e-scooters. This result replicates the findings of the scientific literature as reported in Axhausen and Reck (2021) and Christoforou et al. (2021). As in the previous model, four infrastructural safety level scenarios are defined, thus obtaining 956 total observations (Table 3). In Table 3, the coefficients obtained from the calibration and the model evaluation are shown.
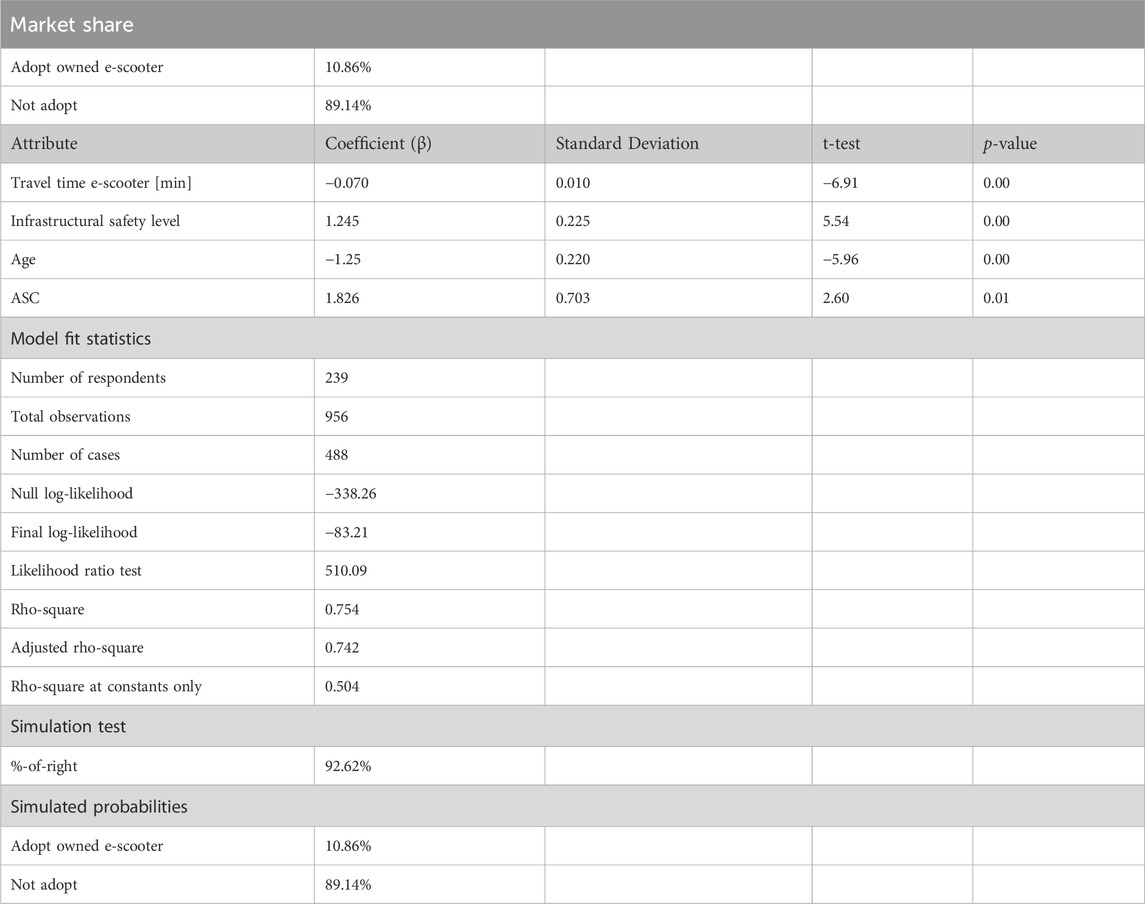
Table 3. Adoption of owned e-scooter.
4.4 Model 3 (penalized logit)—adopt the e-bike sharing service
Penalized logit models have been adopted to evaluate the sharing e-micromobility services. In both cases (e.g., shared e-bikes and shared e-scooters), a weight higher than one has been assigned to the group of users choosing the shared service because this is the most unbalanced choosing set (only 8.84% of the records in the panel data are potentially interested in shifting to shared e-bikes, and only 6.88% are interested in shifting to shared e-scooters).
Correctly setting the weight wg of Eq. 5 is fundamental: if we increase the weight too much, it can over-increase the probability of choosing a shared e-bike with respect to the sample probability and also reduce the statistical significance of some parameters. To this aim, we performed a sensitivity analysis for different wg values: a value equal to 1.80 represents a good compromise between the accuracy in replicating the two choosing options and the statistical significance of the model parameters.
Compared to the previous factors in the sharing services-based models, two additional factors are included in the systematic utility: the cost of the service and the time to access the e-micro-vehicle. Then, the systemic utility to choose the alternative “adopt the e-bike sharing service” was expressed as follows:
The ASC has been omitted in the final model, given that its estimated value was found to be significantly close to zero. Here, four infrastructural safety level scenarios, two service cost scenarios, and two access time scenarios generated 3,792 total observations (Table 4).
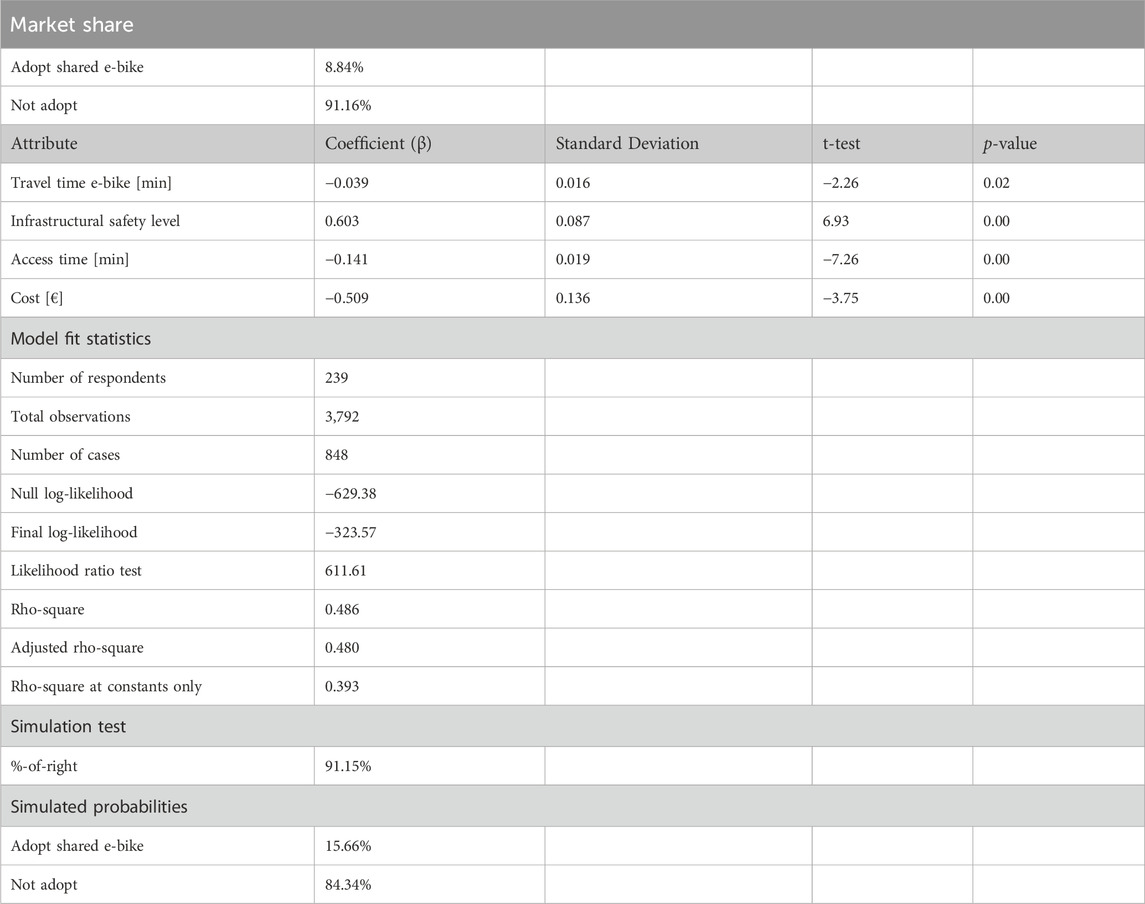
Table 4. Adoption of the e-bike sharing service (penalised logit).
4.5 Model 4 (penalised logit)—adopt the e-scooter sharing service
A penalised model was also calibrated for the e-scooter sharing service, where a weight higher than one has been assigned to the group of users choosing the shared e-scooter service. Specifically, the value wg for the penalised log-likelihood function in Eq. 5 has been set equal to 2.40.
As in the previous model, four infrastructural safety level scenarios, two service cost scenarios, and two access time scenarios generated 3,792 total observations (Table 5). However, e-scooter sharing is considered to be not available to the users if their travel times are either less than 5 min or longer than 30 min. Moreover, 32% of the sample were not willing to use an e-scooter under any conditions. These factors generated a strong reduction in terms of the number of available cases for calibration. In this penalized model, the travel time was not found statistically significant because travel times and cost of the e-scooter sharing service were found to be highly correlated (Pearson coefficient R equal to 0.81). Then, the systemic utility of choosing the alternative “adopt the e-scooter sharing service” was expressed as follows:
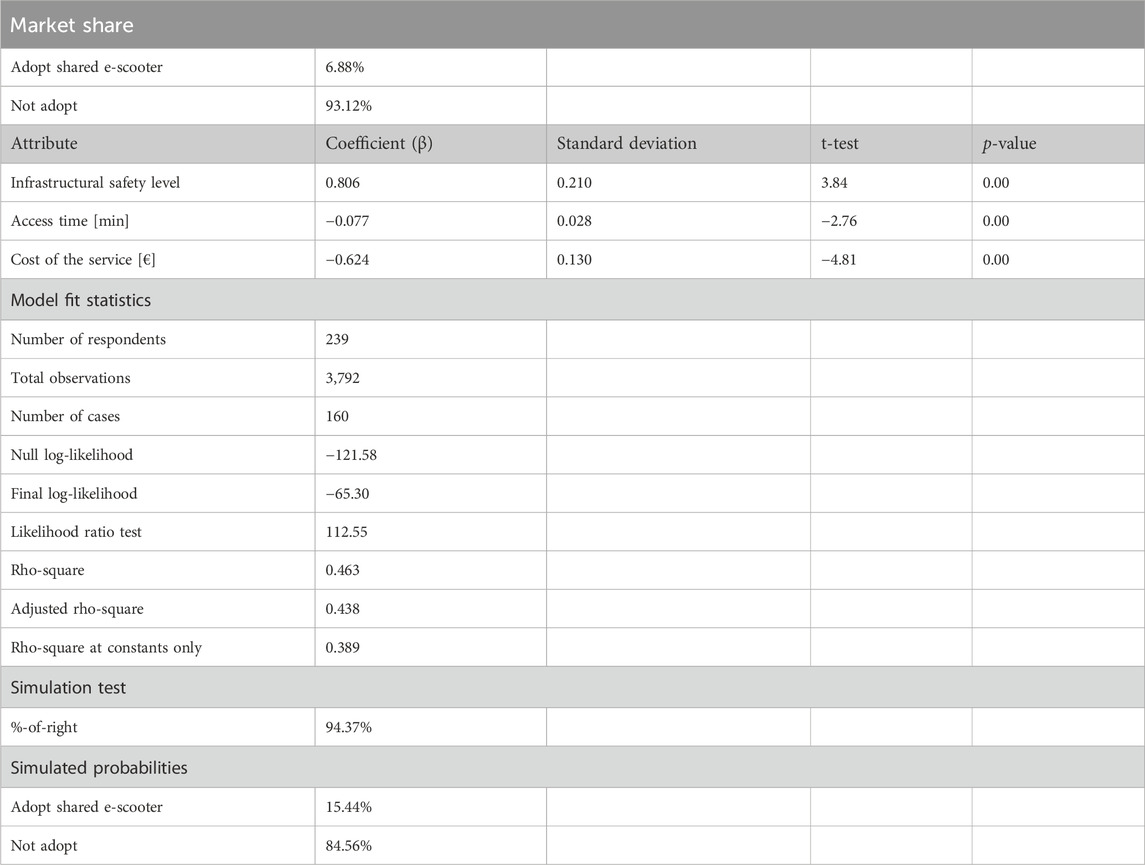
Table 5. Adoption of the e-scooter sharing service (penalised logit).
4.6 Model 5—trinomial penalized logit
All three alternatives contain the respective travel times (alternatives 1 and 2 by an electric micro-vehicle, that is, e-bike plus e-scooter; alternative 3 by the current transport mode). E-micromobility-based alternatives (1 and 2) also consider the infrastructural safety level, with alternative 2 (the shared one) considering the cost of the service and the access time. In the final model specification, only the estimated ASC corresponding to alternative 3 was found to be significantly different from zero and was, therefore, included.
A weight higher than one has been assigned to the group of users choosing the shared e-micromobility. Specifically, the value wg for the penalized log-likelihood function in Eq. 5 has been set equal to 1.80.
The total observations increased with respect to the other calibration set due to the need to join both scenarios related to shared e-scooters and shared e-bikes and the possibility of shifting or not to an owned e-micro-vehicle. Then, the systemic utilities to choose the three identified alternatives were expressed as follows:
The calibrated coefficients and an evaluation of the model that shows a high level of prediction accuracy are shown in Table 6.
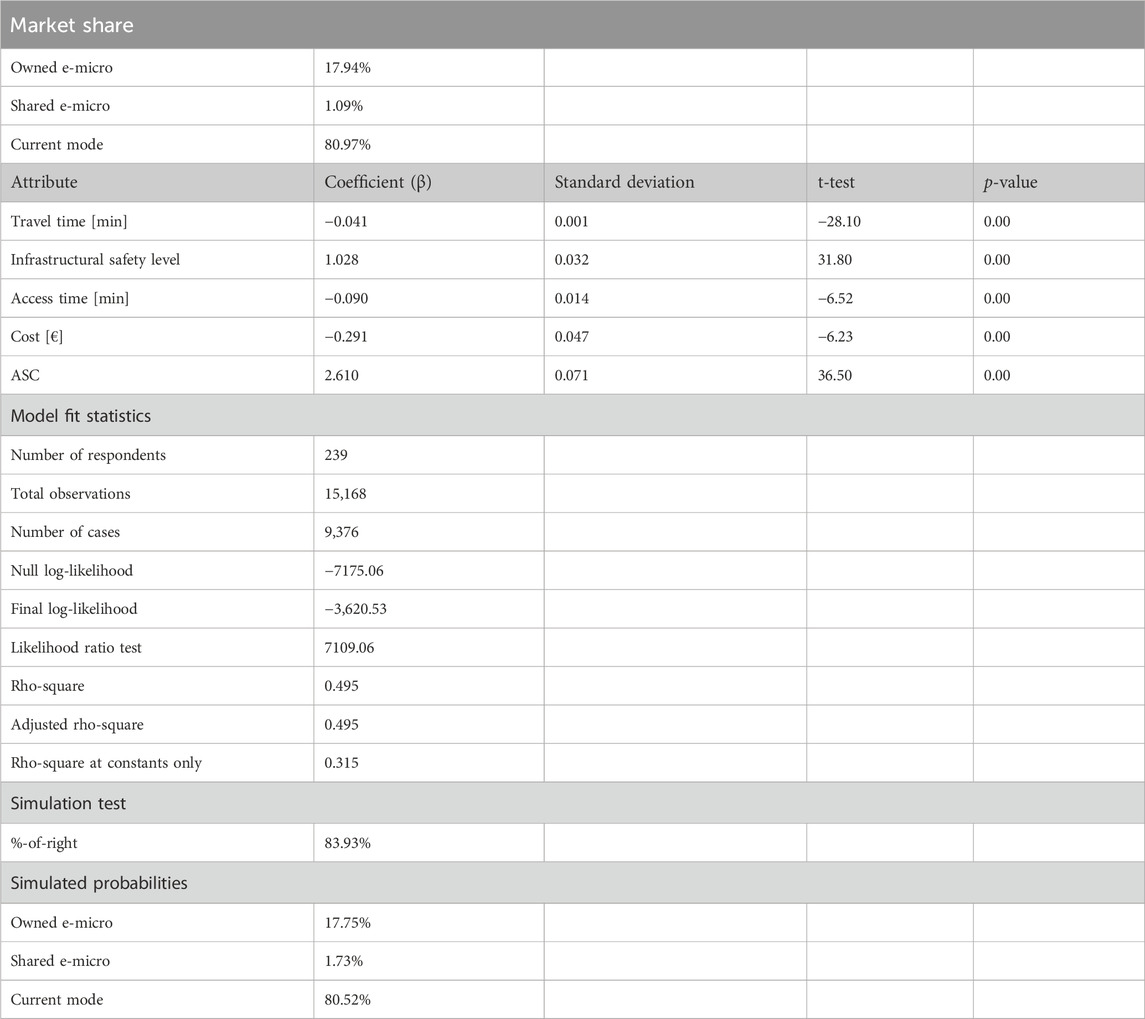
Table 6. Trinomial penalized logit model.
4.7 Simulation by FCD 2015 and discussion
The simulation is realized by applying the RUM models to the 2015 Floating Car Dataset. As reported in the methodology section, the only FCD trips considered are the weekday, home-based trips (the method adopted to derive home-based FCD trips can be found in Nigro et al., 2021).
The potential demand for owned e-micromobility vehicles is first computed through the “standard” binomial logit models (Models 1 and 2). Because both models require the age feature, in the simulation, an age was assigned to each FCD trip through a roulette wheel selection method (Lata and Asha, 2017), thus ensuring the data reflected the distribution of Rome’s population age (considering only the population of driving age). The results show how the potential demand can vary as a function of the infrastructure safety level (Table 7): ensuring separated lanes with respect to vehicular flows (infrastructural safety levels 2 and 3) allows reaching a potential demand of 4%–7%. That demand decreases to 1%–3% when the interaction with other flows is mandatory (infrastructural safety levels 0 and 1).
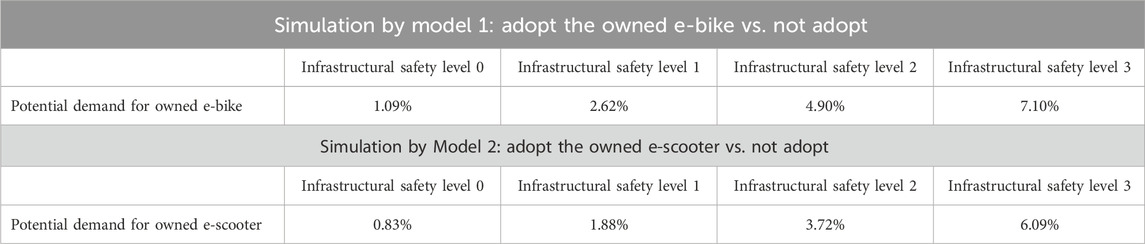
Table 7. Simulation of the potential demand for owned e-micromobility vehicles.
Lower values of the potential demand for e-scooters with respect to e-bikes seem to confirm a lower propensity to use an e-scooter due to its driving mode differences. The penalized binomial logit models (Models 3 and 4) are adopted to compute the potential demand for shared electric micro-vehicles. In this case, it is possible to analyse how the potential demand can vary as a function of the infrastructural safety level, the access time, and the service cost. Therefore, a sensitivity analysis for each one of the previous factors is performed, fixing the remaining factors to their most favourable values (mono-dimensional sensitivity analysis).
The potential demand (Table 8) ranges from about 3% to 12% for shared e-scooters and from 6% to 16% for shared e-bikes. The highest impact on the demand derives from the infrastructural safety level that shows the highest variations between the best and the worst scenario (about 10 percentage points of difference). The service cost shows an important impact on the demand for shared e-scooters, while its impact for shared e-bikes is similar to the impact of the access time.
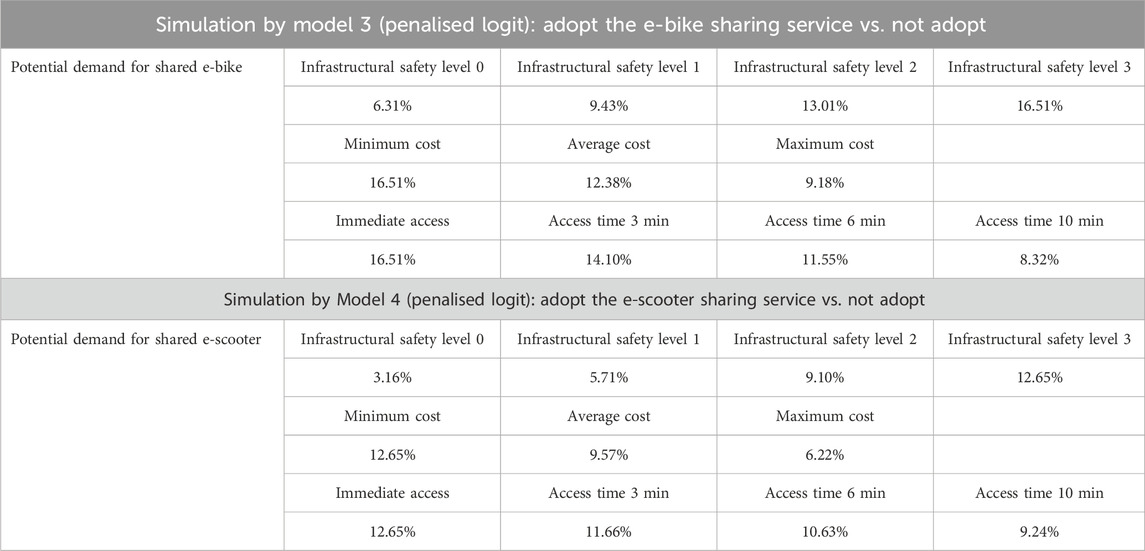
Table 8. Simulation of the potential demand for shared e-micromobility services.
Finally, the penalized trinomial model (Table 9) is applied, reporting the total potential demand (both owned and shared) and performing a mono-dimensional sensitivity analysis. The trinomial model seems to be more “cautious” than the binomial models because it reaches lower values of the potential demand; indeed, the potential demand has a maximum value of about 14% with respect to the 16% reached by the simplest binomial models. Service cost and access times affect the potential demand similarly; the infrastructural safety level again has the highest impact as the potential demand can range from 1.60% in the worst condition (level 0: any road condition) to about 14% in the best condition (level 3: only on bike lanes physically separated from traffic).
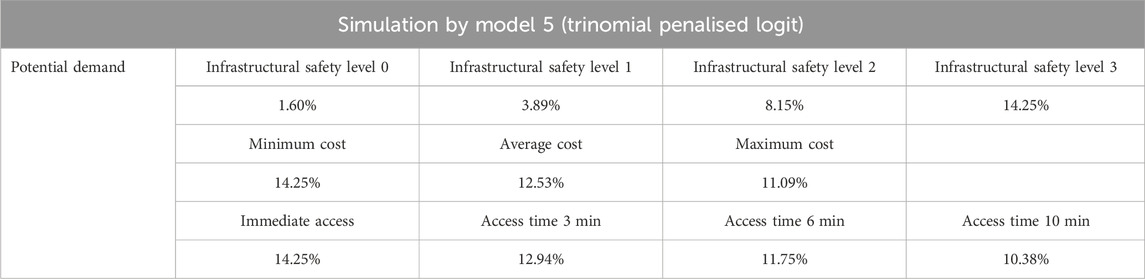
Table 9. Simulation of the potential demand for e-micromobility (both shared and owned).
We can glean several insights by applying the modelling results to the specific policy context of Rome. The city’s Bike Plan is currently in development, with preliminary analyses indicating a potential to shift 11% of car trips to bikes. This estimation, based on average trip distance, travel time (when comparable to car travel), and the average daily kilometres travelled by car users, does not account for factors such as infrastructural conditions. Our models emphasize the necessity of considering infrastructural conditions to set realistic targets for planning tools.
Regarding features related to sharing options, while shared e-micromobility is widely available in Rome due to equity policies by the public authority, access to e-micro-vehicles varies across different areas. Our approach allows for an investigation of potential demand changes as a function of access time. For instance, increasing access time to 10 min could decrease the adoption of shared e-scooters by 3.41 percentage points (and by 8.19 points for shared e-bikes). This is a global estimate that can also be analysed at the level of individual origin–destination pairs.
Lastly, the impact of service cost is worth noting, especially in the context of developing Mobility as a Service (MaaS) packages. Rome is currently piloting a MaaS project that includes shared e-micromobility operators. A strategy focussing on reducing access time rather than increasing standard service costs could be highly beneficial, particularly from a service integration perspective.
4.8 Validation by FCD 2019
The FCD 2019 simulation is adopted mainly for validation. Results in terms of the potential demand (Tables 10–12) are approximately the same as those obtained by FCD 2015: indeed, if car trips exhibit comparable behaviour in terms of the distribution of travelled distances (Figure 5), similar results are expected. This consistency also underscores the versatility of the proposed mixed method. Because it can be transferred to other cities, provided that the necessary data are available, it can assist in evaluating the advantages and disadvantages of various strategies for both transportation planners and service operators. However, it is important to note that these results are difficult to generalize as they depend on specific trip attributes and the infrastructural conditions at the network level.

Table 10. Simulation of the potential demand for owned e-micromobility vehicles (validation).
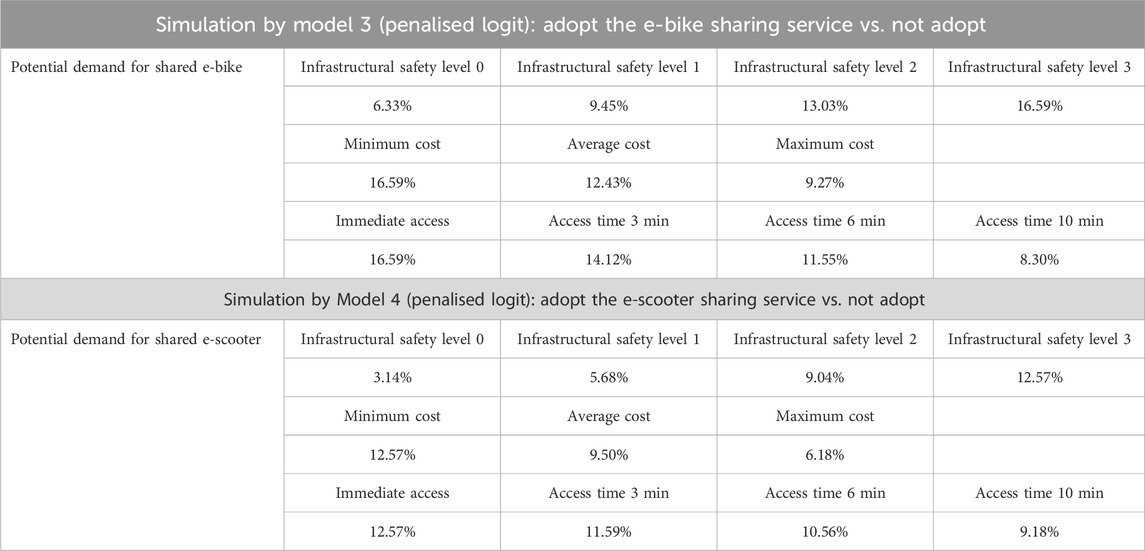
Table 11. Simulation of the potential demand for shared e-micromobility services (validation).
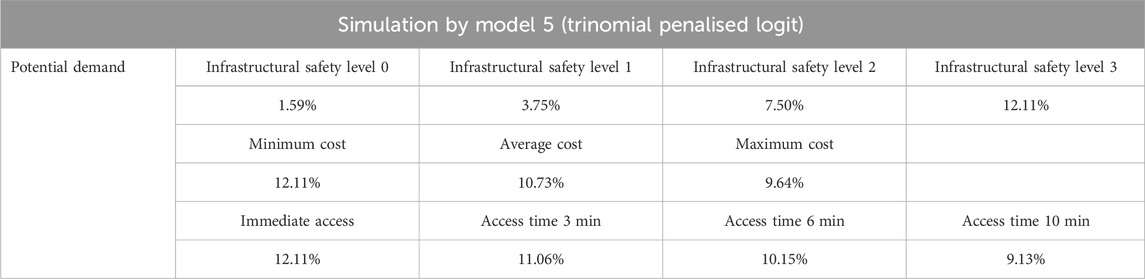
Table 12. Simulation of the potential demand for e-micromobility (both shared and owned, validation).
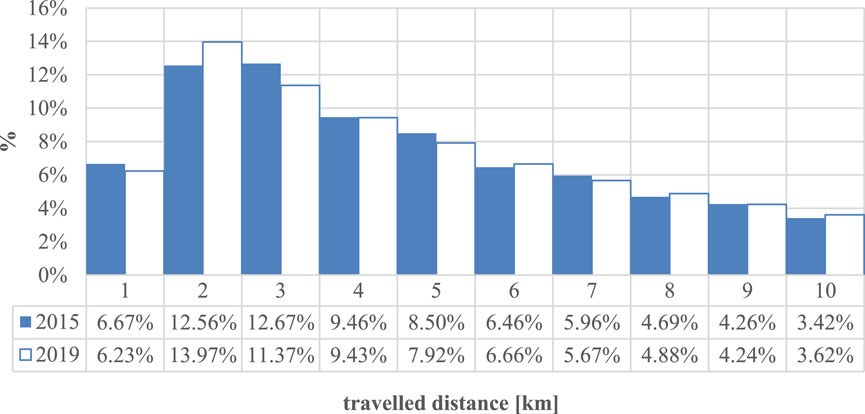
Figure 5. Distribution of travelled distances by FCD 2015 and FCD 2019 (up to 10 km).
5 Conclusion
This paper presents a methodological framework that calibrates and applies random utility models (RUMs) to floating car data (FCD) trips, aiming to estimate the potential shift in demand from cars to e-micromobility for commuting purposes. Thus, it effectively merges traditional probabilistic-behavioural approaches with a data-driven strategy that incorporates FCD.
The framework is primarily composed of four stages: 1) conducting revealed preferences (RP) and stated preferences (SP) surveys on commuting habits and the inclination to switch to e-micromobility, 2) calibrating RUM models, 3) simulating scenarios using FCD, and 4) validating the outcomes. This approach can be readily implemented in other cities with access to FCD or similar data sources that capture the characteristics of car trips.
The RUMs were developed sequentially, beginning with the fundamental aspect of a modal shift model (travel time) and progressively incorporating additional features. These models differentiate between types of micro-vehicles (e-bikes and e-scooters) and ownership types, culminating in a trinomial model that evaluates three choices: take the owned micro-vehicle, use an e-micromobility sharing service, or continue using the current transport mode. The calibrated models have been used to simulate the potential shift from cars to e-micromobility, indicating that the potential e-micromobility demand can range between 14% in the best-case scenario (low costs, high accessibility, and high road safety level) to about 2% in the worst case scenario (high costs, low accessibility, and low road safety level). A key influencing factor is the infrastructural safety level, particularly the presence of bike lanes (whether physically separated or temporary). For effective e-micromobility policies, it is crucial to address supply-related aspects like separating different traffic flows and connecting fragmented bike networks. Additionally, access time and service cost influence the demand for shared e-micromobility services, although less significantly than infrastructural safety. Service cost is particularly impactful for shared e-scooters, while its effect on shared e-bikes is comparable to that of access time.
Future research could build upon the methods used in this framework. During the survey phase, expanding the sample size could mitigate potential biases arising from the response rate. Because RUMs are calibrated using panel data, examining correlations among responses from the same individuals using mixed logit models could be insightful. Regarding the simulation phase, while FCD are generally representative of car trips (Comi and Polimeni, 2021), further investigation into the identification of travel purposes and trips within daily trip chains is necessary.
Lastly, the rapid expansion of e-micromobility presents additional research opportunities, such as its potential for enhancing first- and last-mile connectivity to public transport. Promoting multimodality in commuting could aid in reducing traffic congestion and encouraging active mobility, thus contributing to the development of sustainable and liveable cities.
Data availability statement
The datasets presented in this article are not readily available because they contain private data. Requests to access the datasets should be directed to bWFyaWFsaXNhLm5pZ3JvQHVuaXJvbWEzLml0.
Author contributions
MN: conceptualization, methodology, supervision, writing–review and editing, and visualization. AC: methodology, supervision, writing–review and editing, and visualization. RD: data curation, formal analysis, and writing–original draft. MC: writing–original draft and writing–review and editing.
Funding
The authors declare that financial support was received for the research, authorship, and/or publication of this article. The authors acknowledge funding from the Italian Ministry of Economic Development, in the frame of the National Research Project on Electric System 2019–2021, attributed to the Department of Engineering of Roma Tre University by the Enea Research Center.
Acknowledgments
The authors thank Dott Company for sharing information about the average speed of e-scooters in Rome.
Conflict of interest
The authors declare that the research was conducted in the absence of any commercial or financial relationships that could be construed as a potential conflict of interest.
The authors declared that they were an editorial board member of Frontiers, at the time of submission. This had no impact on the peer review process and the final decision.
Publisher’s note
All claims expressed in this article are solely those of the authors and do not necessarily represent those of their affiliated organizations, or those of the publisher, the editors, and the reviewers. Any product that may be evaluated in this article, or claim that may be made by its manufacturer, is not guaranteed or endorsed by the publisher.
References
Abduljabbar, R. L., Liyanage, S., and Dia, H. (2021). The role of micromobility in shaping sustainable cities: a systematic literature review. Transp. Res. Part D Transp. Environ. 92, 102734. doi:10.1016/j.trd.2021.102734
Alonso, B., Musolino, G., Rindone, C., and Vitetta, A. (2023). Estimation of a fundamental diagram with heterogeneous data sources: experimentation in the city of santander. ISPRS Int. J. Geo-Inf. 12, 418. doi:10.3390/ijgi12100418
Axhausen, K., and Reck, D. (2021). Who uses shared micromobility services? Empirical evidence from Zurich, Switzerland. Transp. Res. Part D Transp. Environ. 94, 102803. doi:10.1016/j.trd.2021.102803
Baek, K., Lee, H., Chung, J.-H., and Kim, J. (2021). Electric scooter sharing: how do people value it as a last-mile transportation mode? Transp. Res. Part D 2021, 102642. doi:10.1016/j.trd.2020.102642
Bao, H. X. H., and Lim, Y. (2022). Behavioural interventions for micro-mobility adoption: low-hanging fruits or hard nuts to crack? Transp. Res. Part F Psychol. Behav. 84, 423–441. doi:10.1016/j.trf.2021.12.011
Bierlaire, M. (2018). Calculating indicators with PandasBiogeme. Available at: https://transp-or.epfl.ch/documents/technicalReports/Bier18a.pdf.
Bierlaire, M. (2023). A short introduction to Biogeme. Technical report TRANSP-OR 230620. Transport and Mobility Laboratory. ENAC: EPFL.
Bretones, A., and Marquet, O. (2022). Sociopsychological factors associated with the adoption and usage of electric micromobility. A literature review. Transp. Policy 127, 230–249. doi:10.1016/j.tranpol.2022.09.008
Caspi, O., Smart, M. J., and Noland, R. B. (2020). Spatial associations in dockless shared e-scooter usage, paper presented at the 99th annual meeting of the transportation research board, Washington, 2020
Castiglione, M., Comi, A., De Vincentis, R., Dumitru, A., and Nigro, M. (2022). Delivering in urban areas: a probabilistic-behavioral approach for forecasting the use of electric micromobility. Sustainability 14, 9075. 202. doi:10.3390/su14159075
Chang, A., Miranda-Moreno, L., Clewlow, R., and Sun, L. (2019). Trend or fad? Deciphering the enablers of micromobility in the U.S., A report of sae international.
Christoforou, Z., De Bortoli, A., Gioldasis, C., and Seidowsky, R. (2021). Who is using e-scooter and how? Evidence from Paris. Transp. Res. Part D Transp. Environ. 2021, 92.
Cirianni, F., Comi, A., and Luongo, A. (2022). A sustainable approach for planning of urban pedestrian routes and footpaths in a pandemic scenario. TeMA – J. Land Use, Mobil. Environ. 15 (1), 125–140. doi:10.6093/1970-9870/8629
Cirianni, F. M. M., Comi, A., and Quattrone, A. (2023). Mobility control centre and artificial intelligence for sustainable urban districts. Information 14 (10), 581. doi:10.3390/info14100581
Comi, A., Hriekova, O., and Nigro, M. (2024). Exploring road safety in the era of micro-mobility: evidence from Rome. Transp. Res. Procedia 78, 55–62. doi:10.1016/j.trpro.2024.02.008
Comi, A., and Polimeni, A. (2024). Assessing potential sustainability benefits of micromobility: a new data driven approach. Eur. Transp. Res. Rev. doi:10.1186/s12544-024-00640-6
Comi, A., Polimeni, A., and Nuzzolo, A. (2022). An innovative methodology for micro-mobility network planning. Transp. Res. Procedia 60, 20–27. doi:10.1016/j.trpro.2021.12.004
Cubells, J., Miralles-Guasch, C., and Marquet, O. (2023). E-scooter and bike-share route choice and detours: modelling the influence of built environment and sociodemographic factors. J. Transp. Geogr. 111, 103664. doi:10.1016/j.jtrangeo.2023.103664
EC (2020). Sustainable and smart mobility strategy – putting European transport on track for the future. Communication from the commission to the European parliament, the council, the European economic and social committee and the committee of the regions. Belgium: Brussels.
Eccarius, T., and Lu, C. C. (2020). Adoption intentions for micro-mobility – insights from electric scooter sharing in Taiwan. Transp. Res. Part D Transp. Environ. 84, 102327. doi:10.1016/j.trd.2020.102327
Eltis (2019). Guidelines for developing and implementing a sustainable urban mobility plan, rupprecht consult. Available at: https://www.eltis.org/mobility-plans/sump-guidelines.
European Commission (2019). The future of cities. Available at: https://ec.europa.eu/jrc/en/facts4eufuture/future-of-cities.
Fan, Z., and Harper, C. D. (2022). Congestion and environmental impacts of short car trip replacement with micromobility modes. Transp. Res. Part D Transp. Environ. 103, 103173–173. doi:10.1016/j.trd.2022.103173
FHWA (2017). National household travel survey, 2017. Available at: https://nhts.ornl.gov/vehicle-trips.
Fukushige, T., Fitch, D. T., and Handy, S. (2021). Factors influencing dock-less E-bike-share mode substitution: evidence from Sacramento, California. Transp. Res. Part D 99, 102990. doi:10.1016/j.trd.2021.102990
Furth, P. G., Mekuria, M. C., and Nixon, H. (2016). Network connectivity for low-stress bicycling. Transp. Res. Rec. J. Transp. Res. Board 2587, 41–49. doi:10.3141/2587-06
Gössling, S. (2020). Integrating e-scooters in urban transportation: problems, policies, and the prospect of system change. Transp. Res. Part D Transp. Environ. 79, 102230. doi:10.1016/j.trd.2020.102230
Greibe, P., and Buch, T. S. (2016). Capacity and behaviour on one-way cycle tracks of different widths. Transp. Res. Procedia 15, 122–136. doi:10.1016/j.trpro.2016.06.011
Guo, Y., and Zhang, Y. (2021). Understanding factors influencing shared e-scooter usage and its impact on auto mode substitution. Transp. Res. Part D (99), 2021.
Ham, S. W., Cho, J., Park, S., and Kim, D. (2021). Spatiotemporal demand prediction model for E-scooter sharing services with latent feature and deep learning. Transp. Res. Rec. 2675 (11), 34–43. doi:10.1177/03611981211003896
Holve, V., Borgato, S., and Bosetti, S. (2020). Safe use of micromobility devices in urban areas. DG MOVE, silvia maffii (TRT)
Hossein Sabbaghian, M., Llopis-Castelló, D., and García, A. (2023). A safe infrastructure for micromobility: the current state of knowledge. Sustainability 15, 10140. doi:10.3390/su151310140
James, O., Swiderski, J. I., Hicks, J., Teoman, D., and Buehler, R. (2019). Pedestrians and E-scooters: an initial look at E-scooter parking and perceptions by riders and non-riders. Sustain. MDPI 11 (20), 5591. doi:10.3390/su11205591
Jiao, J., and Bai, S. (2020). Understanding the Shared E-scooter Travels in Austin, TX. ISPRS Int. J. Geo-Inf. 9 (2), 135. doi:10.3390/ijgi9020135
Kwak, N., and Radler, B. A. (2002). Comparison between mail and web surveys: response pattern, respondent profile, and data quality. J. official statistics 2002 (18), 257–273.
Lata, Y. S., and Asha, S. (2017). Comparative study of different selection techniques in genetic algorithm. Int. J. Eng. Sci. Math. 6, 174–180.
Liberto, C., Valenti, G., Orchi, S., Lelli, M., Nigro, M., and Ferrara, M. (2018). The impact of electric mobility scenarios in large urban areas: the Rome case study. IEEE Trans. Intell. Transp. Syst. 19, 2018. 3540–3549. doi:10.1109/TITS.2018.2832004
López-Molina, M., Llopis-Castelló, D., Pérez-Zuriaga, A. M., Alonso-Troyano, C., and García, A. (2023). Skid resistance analysis of urban bike lane pavements for safe micromobility. Sustainability 15, 698. doi:10.3390/su15010698
McKenzie, G. (2019). Spatiotemporal comparative analysis of scooter-share and bike-share usage patterns in Washington, D.C. J. Transp. Geogr. 78, 19–28. doi:10.1016/j.jtrangeo.2019.05.007
Mitropoulos, L., Stavropoulou, E., Tzouras, P., Karolemeas, C., and Kepaptsoglou, K. (2023). E-scooter micromobility systems: review of attributes and impacts. Transp. Res. Interdiscip. Perspect. 21, 100888. doi:10.1016/j.trip.2023.100888
Musolino, G., Rindone, C., and Vitetta, A. (2022). Models for supporting mobility as a service (MaaS) design. Smart Cities 5, 206–222. doi:10.3390/smartcities5010013
Neun, N., Eichenberger, C., Xin, Y., Fu, C., Wiedemann, N., Martin, H., et al. (2023). Metropolitan segment traffic speeds from massive floating car data in 10 cities. IEEE Trans. Intelligent Transp. Syst. 24 (11), 12821–12830. doi:10.1109/TITS.2023.3291737
Nigro, M., Castiglione, M., Colasanti, F. M., De Vincentis, R., Valenti, G., Liberto, C., et al. (2022). Exploiting floating car data to derive the shifting potential to electric micromobility. Transp. Res. Part A Policy Pract. 157, 78–93. doi:10.1016/j.tra.2022.01.008
Nigro, M., Ferrara, M., De Vincentis, R., Liberto, C., and Valenti, G. (2021). Data driven approaches for sustainable development of E-mobility in urban areas. Energies 14 (13), 3949. doi:10.3390/en14133949
Nikiforiadis, A., Paschalidis, E., Stamatiadis, N., Raptopoulou, A., Kostareli, A., and Basbas, S. (2021). Analysis of attitudes and engagement of shared e-scooter users. Transp. Res. Part D Transp. Environ. 94, 102790. doi:10.1016/j.trd.2021.102790
Park, J., and Abdel-Aty, M. (2016). Evaluation of safety effectiveness of multiple cross-sectional features on urban arterials. Accid. Anal. Prev. 92, 245–255. doi:10.1016/j.aap.2016.04.017
Paydar, M., and Kamani Fard, A. (2021). The contribution of mobile apps to the improvement of walking/cycling behavior considering the impacts of COVID-19 pandemic. Sustainability 13, 10580. doi:10.3390/su131910580
Porsche Consulting (2019). Deconstructing the Micromobility Phenomenon. A strategic analysis of crucial success factors. Available at: https://www.porsche-consulting.com/fileadmin/docs/04_Medien/Publikationen/SRX03976_Deconstructing_the_Micromobility_Phenomenon/Deconstructing_the_Micromobility_Phenomenon_C_2019_Porsche_Consulting.pdf.
Portland Bureau of Transportation (2019). E-scooter findings report. Available at: https://www.portland.gov/sites/default/files/2020-04/pbot_e-scooter_01152019.pdf.
Rodriguez-Roman, D., Camacho, B., Andrés, G., Yáñez González, G., Pérez, A., del Valle González, C. A., et al. (2022). Travel patterns and spatial access in a dockless e-scooter service in Puerto Rico. Case Stud. Transp. Policy 10 (2), 915–926. doi:10.1016/j.cstp.2022.03.005
Russo, F., and Rindone, C. (2023). Smart city for sustainable development: applied processes from SUMP to MaaS at European level. Appl. Sci. 13, 1773. doi:10.3390/app13031773
Sanders, R. L., Branion-Calles, M., and Nelson, T. A. (2020). To scoot or not to scoot: findings from a recent survey about the benefits and barriers of using E-scooters for riders and non-riders. Transp. Res. Part A Policy Pract. 139, 217–227. doi:10.1016/j.tra.2020.07.009
Sandt, L. (2019). The basics of micromobility and related motorized devices for personal transport. Available at: https://trid.trb.org/view/1663933.
Scott Smith, C., and Schwieterman, P. (2018). E-scooter scenarios. Evaluating the potential mobility benefits of shared dockless scooters in Chicago. Chaddik Inst. Policy Ser. 2018.
UNECE (2020). Handbook on sustainable urban mobility and spatial planning - promoting active mobility - a handbook on sustainable urban mobility and spatial. Geneve: United Nations Economic Commission for Europe.
Useche, S. A., O’Hern, S., Gonzalez-Marin, A., Gene-Morales, J., Alonso, F., and Stephens, A. N. (2022). Unsafety on two wheels, or social prejudice? Proxying behavioral reports on bicycle and e-scooter riding safety – a mixed-methods study. Transp. Res. Part F Psychol. Behav. 89, 168–182. doi:10.1016/j.trf.2022.06.015
Wang, K., Qian, X., Taylor Fitch, D., Lee, Y., Malik, J., and Circella, G. (2023). What travel modes do shared e-scooters displace? A review of recent research findings. Transp. Rev. 43 (1), 5–31. doi:10.1080/01441647.2021.2015639
Weikl, S., and Mayer, P. (2023). Data-driven quality assessment of cycling networks. Front. Future Transp. 27 March 2023, Sec. Transp. Syst. Model. 4. doi:10.3389/ffutr.2023.1127742
Keywords: e-micromobility, e-scooters, e-bikes, mode choice, floating car data, behavioural model, discrete choice model
Citation: Nigro M, Comi A, De Vincentis R and Castiglione M (2024) A mixed behavioural and data-driven method for assessing the shift potential to electric micromobility: evidence from Rome. Front. Future Transp. 5:1391100. doi: 10.3389/ffutr.2024.1391100
Received: 24 February 2024; Accepted: 26 March 2024;
Published: 26 April 2024.
Edited by:
Luigi Dell’Olio, University of Cantabria, SpainReviewed by:
Rubén Cordera, University of Cantabria, SpainCorrado Rindone, Mediterranea University of Reggio Calabria, Italy
Copyright © 2024 Nigro, Comi, De Vincentis and Castiglione. This is an open-access article distributed under the terms of the Creative Commons Attribution License (CC BY). The use, distribution or reproduction in other forums is permitted, provided the original author(s) and the copyright owner(s) are credited and that the original publication in this journal is cited, in accordance with accepted academic practice. No use, distribution or reproduction is permitted which does not comply with these terms.
*Correspondence: Antonio Comi, Y29taUBpbmcudW5pcm9tYTIuaXQ=