 Marianne Allanic1
 Pierre-Yves Hervé2,3,4
 Cong-Cuong Pham5
 Myriam Lekkal1,2,3,4,5
 Alexandre Durupt5
 Thierry Brial1Arthur Grioche1Nada Matta6
 Philippe Boutinaud1
 Benoit Eynard5
 Marc Joliot2,3,4*
- 1CADESIS Group, Courbevoie, France
- 2GIN, IMN, UMR 5293, CNRS, Bordeaux, France
- 3GIN, IMN, UMR 5293, Université de Bordeaux, Bordeaux, France
- 4GIN, IMN, UMR 5293, CEA, Bordeaux, France
- 5Sorbonne Universités, Université de Technologie de Compiègne, Department of Mechanical Systems Engineering UMR7337 Roberval CNRS, Compiègne, France
- 6Université de Technologie de Troyes, ICD, UMR CNRS 6281, Troyes, France
The data management needs of the neuroimaging community are currently addressed by several specialized software platforms, which automate repetitive data import, archiving and processing tasks. The BIOMedical Imaging SemanTic data management (BIOMIST) project aims at creating such a framework, yet with a radically different approach: the key insight behind it is the realization that the data management needs of the neuroimaging community—organizing the secure and convenient storage of large amounts of large files, bringing together data from different scientific domains, managing workflows and access policies, ensuring traceability and sharing data across different labs—are actually strikingly similar to those already expressed by the manufacturing industry. The BIOMIST neuroimaging data management framework is built around the same systems as those that were designed in order to meet the requirements of the industry. Product Lifecycle Management (PLM) systems rely on an object-oriented data model and allow the traceability of data and workflows throughout the life of a product, from its design to its manufacturing, maintenance, and end of life, while guaranteeing data consistency and security. The BioMedical Imaging—Lifecycle Management data model was designed to handle the specificities of neuroimaging data in PLM systems, throughout the lifecycle of a scientific study. This data model is both flexible and scalable, thanks to the combination of generic objects and domain-specific classes sourced from publicly available ontologies. The data integrated management and processing method was then designed to handle workflows of processing chains in PLM. Following these principles, workflows are parameterized and launched from the PLM platform onto a computer cluster, and the results automatically return to the PLM where they are archived along with their provenance information. Third, to transform the PLM into a full-fledged neuroimaging framework, we developed a series of external modules: DICOM import, XML form data import web services, flexible graphical querying interface, and SQL export to spreadsheets. Overall, the BIOMIST platform is well suited for the management of neuroimaging cohorts, and it is currently used for the management of the BIL&GIN dataset (300 participants) and the ongoing magnetic resonance imaging-Share cohort acquisition of 2,000 participants.
Introduction
Provenance Complexity in Neuroimaging Studies
Cognitive neuroscience is multidisciplinary “by its very nature” (Van Horn et al., 2001) and relies on a large set of complementary approaches for probing brain function and behavior. Different combination of methods, such as computerized experimental psychology, magnetic resonance imaging (MRI), electro and magneto encephalography (EEG/MEG), functional near-infrared spectroscopy, eye tracking, genetics, etc., can be used during a scientific project and require an active interaction between many specialties—physics, medicine, mathematics, and engineering among others. Resulting data are complex, and neuroscience researchers have to deal with many data sources, natures, and types of processing (Goble and Stevens, 2008).
One can only expect the heterogeneity of the tools and data formats involved in research to increase over time. With more and more studies—neurogenetic, neuroepidemiology, and longitudinal—requiring large cohorts and therefore producing huge amounts of data in a multicentric context. Besides, these large-scale studies may need to be aggregated into meta-analyses to reach the adequate level of statistical power, given the staggering number of hypotheses being tested. This implies the frequent reuse of pre-existing data, for validation of new findings. In addition, the high cost of data (both acquisition and processing) and the need for reproducibility make data reuse and sharing a necessity (Yarkoni et al., 2010; Poline et al., 2012).
The information of what a piece of data is, when, where, and how it was produced, why and for whom it was performed is called provenance—the origin and history of a set of data (Simmhan et al., 2005). The provenance in BioMedical Imaging studies is complex: acquisition devices and parameters impact raw data, processing algorithm, parameters, and tools impact on derived data, processing input traceability is intricate. All this information is required to be able to reproduce scientific results and also to share data and understand how specific data were obtained.
Sharing study data between scientific teams—inside and outside the institutions that produced the data—implies to ensure consistency of data and their provenance on one side, and data security on the other side, particularly on studies involving human subjects.
The lifecycle of a study can be described by four stages: (1) study specifications define the purpose of the study, what data will be acquired, stored, and analyzed, (2) raw data are acquired with appropriate devices and following protocols, (3) derived data are generated from raw data by analytical means, and (4) results are published and the data may be shared with the community. Figure 1 summarizes the links between the stages with examples of data at each stage along with required provenance information.
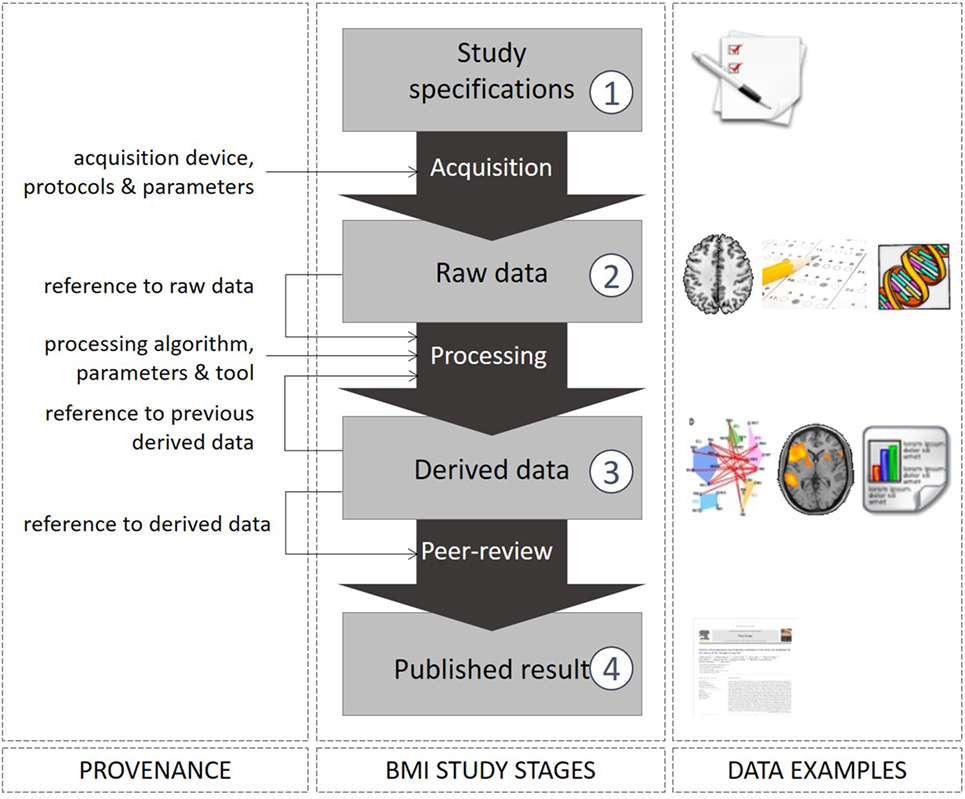
Figure 1. The four stages of the lifecycle of a scientific study.
Existing Systems for the Management of the Provenance of Neuroimaging Studies
So far, this challenging need for neuroscience data sharing has been met by the emergence of dedicated systems, especially for modalities that were made affordable to researchers because they were so widely used in hospitals, and this chiefly applies to MRI. In this case, the best solution was to build upon the pre-existing medical standard, namely, Digital Imaging and COmmunications in Medicine (DICOM), with the development of research-dedicated picture and archival communication systems (PACS). Compared with traditional clinical PACS, neuroimaging data management systems can manage research projects involving large sets of subjects instead of being confined to the individual patient, storing data from other sources than DICOM entities and controlling access to the data in a fine-grained way. They also include procedures to clean patient health information from the data to comply with human research ethical norms, visual and/or automated quality control procedures, and are capable of interacting with computing clusters or workflow managers for data processing.
Existing neuroimaging data management systems so far—XNAT (Marcus et al., 2007a), LORIS (Das et al., 2012), COINS (Scott et al., 2011), IDA (Crawford et al., 2016), MIDAS (Kitware Inc.), HID (Keator et al., 2016), NIDB (Book et al., 2013), SHANOIR (Barillot et al., 2015), etc.—were implemented using the standard web technologies, in the form of J2EE or PHP web applications, with a browser-based graphical frontend and a relational database backend, and some also provide means to automate interactions through application programing interfaces (APIs; REST or SOAP). Such web systems leverage DICOM libraries such as dcm4che or DICOM toolkit to implement at least a DICOM receiver and offer separate upload services for non-DICOM data, over HTTP. This scalable web architecture makes it possible to serve brain imaging and associated data to distant users over the web or store data in the cloud, as best exemplified with XNAT at the Human Connectome Project. Naturally, with this multiplication of like-minded, yet idiosyncratic web applications for neuroimaging data management, came the need for database federation and interoperability, and for a common lexicon across different systems, such as shared ontologies (Gupta et al., 2008).
A detailed comparison of 18 neuroimaging data management systems is presented in (Allanic et al., 2017). Criteria of comparison are:
– Type of managed data: which disciplines (imaging, genetics, psychology, clinical, etc.) and which level of data (raw, derived, and published) can be managed in the system. Most of the existing data management systems focuses on one or two levels (raw and derived or derived and published) and most of them manage only imaging data [except HIS (Keator et al., 2009), LORIS (Das et al., 2011), XNAT (Marcus et al., 2007b), and fMRIDC (Van Horn et al., 2001)].
– Provenance strategy: how is the provenance described and made available to enable data sharing and reuse. It appears that data provenance is sometimes more precise and complete in systems managing published results, as users must provide additional metadata that describe how data were produced to be allowed to submit their data (Fox et al., 2005); openfMRI (Poldrack et al., 2013), fMRIDC, and BrainMap (Fox and Lancaster, 2002) are good examples.
– Data model flexibility: how the system can be adapted to new types of data, new protocols. Few data management systems allow to customize their data model; among them REDCap, COINS (Scott et al., 2011), XNAT, CVT (Gerhard et al., 2011), NiDB (Book et al., 2013), DFBIdb (Adamson and Wood, 2010), and Neurolog (Dojat et al., 2011).
– Integration of processes and existing tools: how pipelines, quality workflow, and visualization software can be integrated to the system. Some neuroimaging data management systems allow to launch pipelines and to visualize results directly from the database interface.
There is to our knowledge no existing data management system that allows to manage and to analyze study data from study specifications to publication; we aim at providing such an environment.
Product Lifecycle Management (PLM) Systems: A Key to Provenance Management
The main assumption in our work is to reuse a proven data management system designed for manufacturing industry to the management of data from neuroimaging studies at every stage, ensuring full provenance.
Regarding data management, the manufacturing industry is confronted with the same issues as neuroimaging: heterogeneous product data must be tracked throughout the product lifecycle—product requirement, design, manufacturing, maintenance, and end of life. Products are made from the collaboration of multidisciplinary teams, not always working on the same site. PLM system has been designed since the 1990s to answer the needs of the manufacturing industry and enable the storage, versioning, and collaborative work on computer-aided design (CAD) data, with a strong focus on traceability. The aim of PLM systems could be summarized by providing the right data at the right person and at the right moment: they facilitate collaborative and concurrent work, in addition to multi-sites data sharing, answering the imperative need to exchange data seamlessly between various geographic locations within a worldwide company (Kiritsis et al., 2003; Terzi et al., 2010).
Although the design of PLM software is not oriented toward neuroimaging data, or any kind of scientific data in particular, their inherent properties make them a very compelling IT solution for scientific laboratories, and neuroimaging labs in particular (Allanic et al., 2017).
Outlines of the Paper
We present in the paper the BIOMedical Imaging SemanTic data management (BIOMIST) platform, whose aim is to respond to the need of data management, sharing, reuse, and reproducibility of the neuroimaging domain by ensuring automated provenance tracking throughout the lifecycle of a study and access to analysis software in a unique environment.
The targets of the BIOMIST platform are new neuroimaging studies from small (100 subjects) to medium (5,000 subjects) cohort, with multimodal, longitudinal, and multi-sources acquisitions requiring complex pipelines, quality controls, and efficient access management.
Section “Design: The BIOMIST Platform” presents the BIOMIST platform and the integration of its components. The technical details of the implementation of the platform are developed in Section “Implementation.” The benefits of the platform were tested on the BIL&GIN dataset and the I-Share study: results are presented in Section “Application.” This paper closes with a discussion and leads for future work toward the BIOMIST platform in Section “Discussion.”
Design: The Biomist Platform
This section presents the BIOMIST platform, whose purpose is to manage heterogeneous data of neuroimaging cohorts, from study specifications to published results, in order to ensure data reproducibility, sharing, and reuse. Section “Design Method” explains our design method, and then sections “Key Principles of PLM,” “The BMI-LM Data Model to Manage Data and Provenance,” “Mapping Strategy for Data Import,” “The DIMP Method for Integration of Processing Pipelines,” and “Querying Strategies” develop the characteristics of each component of the platform: the core PLM system is customized by the BioMedical Imaging—Lifecycle Management (BMI-LM) data model, data are imported into the PLM thanks to mapping strategies and processed with the data integrated management and processing (DIMP) method, to end with, users query data managed by the PLM through two interfaces, graphical and Open Database Connectivity (ODBC). Figure 2 shows the integration of the components of the BIOMIST platform.
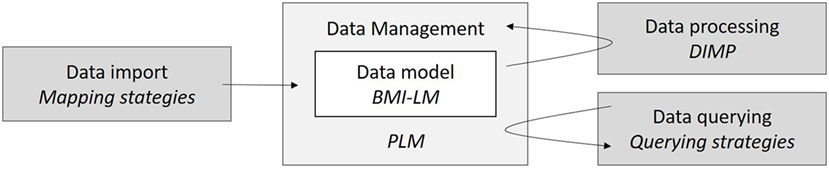
Figure 2. The components of the BIOMedical Imaging SemanTic data management platform and their integration, arrows indicating the direction of data flows. Each component is developed in indicated subsections.
Design Method
To understand the concerns of daily neuroimaging research work and the associated data management issues, we studied the literature and interviewed the staff of a representative neuroimaging laboratory (GIN, from the University of Bordeaux, France). Ongoing projects at this laboratory rely on structural and functional MRI acquisitions performed over hundreds of participants, as well as smaller scale task-based functional MRI projects. Over the 2006–2009 period, this group designed its own relational database (GINdb, based on SQL technology) in order to manage experiments: processing data, subject data and paths to files stored on disks of their IT system (Joliot et al., 2009).
Eleven members of the research group (eight tenured researchers, two research engineers, and one post doc) were interviewed, by small groups of two or three people to avoid group effects. They were asked to express their needs: what was missing in GINdb and what would be their ideal system. They mainly highlighted that the data model should feel natural for the users, especially regarding the queries, and that it should be flexible enough to allow future changes. Besides, they would like to launch analyses batch directly from the database and to label data with one or several statuses, such as “valid exam” or “checked data.”
From these interviews and the review of the literature, four main axes are defined:
1. Provenance: manages all the data generated during a study, from its specifications to published results, and track the associated provenance to be able to share and reuse data optimally. The PROVenance Data Model (PROV-DM) standard is developed by the World Wide Web (W3) consortium to help exchanging data, a main objective is to comply with it.
2. Heterogeneity: accepts all data formats and manage the concepts of the disciplines involved in a neuroimaging study.
3. Integration: allows automated data import, processing launch, data analysis, and visualization from the platform.
4. Flexibility: allows data model changes without consequences on existing data to handle new data format, as well as semantic changes, evolution of acquisition protocols.
To validate the resulting BIOMIST platform, we tested it with two use cases from the GIN: (1) the 300 subjects BIL&GIN and (2) the I-Share study. Results are presented in Section “Application.”
Key Principles of PLM
PLM systems supports multisite sharing and collaborative work, by managing product data throughout its lifecycle along with advanced access management features that guarantee data security and with file and database replication mechanisms that allows multisite collaboration even through low latency or low-bandwidth networks.
Product Lifecycle Management systems do not only manage data (i.e., documents/files + metadata) but concepts, thanks to its object-oriented data model. Concepts at every phase of the product lifecycle are represented by objects instantiated as items whose versions are tracked. Items can be classified with a fully flexible hierarchy of concepts and vocabulary. Any kind of file types and formats are allowed and are stored in objects called datasets. Every event on an item is tracked: it is possible to know who created, modified, updated or validated it, when and why. Automated or manual workflows can be launched by users from the system; these workflows can be customized and can be used to implement a process with validation from several users (e.g., validating an acquired dataset) and to perform automated actions on items or datasets (create new version, add status, update metadata, comment, classify, etc.). A typical application in manufacturing industry would be a workflow that follows validations of a design change in a product. Query facilities complete the features of PLM systems: queries can be customized, both to retrieve items and datasets and to generate reports. Data can be accessed from the web and visited directly into the PLM interface, as soon as a suitable visualization software is integrated, or downloaded on users’ computer, automatically opened in the right software. For managing large set of data, the PLM infrastructure includes various replication strategies that enables access to sites that may have low latencies or low-bandwidth network connections.
Data security is ensured in PLM systems through their infrastructure and an advanced module for access management. The infrastructure of PLM systems is composed of four tiers (resource, enterprise, web application, and client tiers) that are presented in Figure 3. In resource tier, the SQL database manages data instances and metadata, and one or several volumes contain data files that may be encrypted according to users’ needs. This organization implies that data (files and instances) can only be accessed through a client who ensures data consistency. An account is required to connect to the client: users are associated to roles and belong to group and projects, which determine their level access to the data stored in the PLM system (none, read, write, export, promotion, validation, etc.).
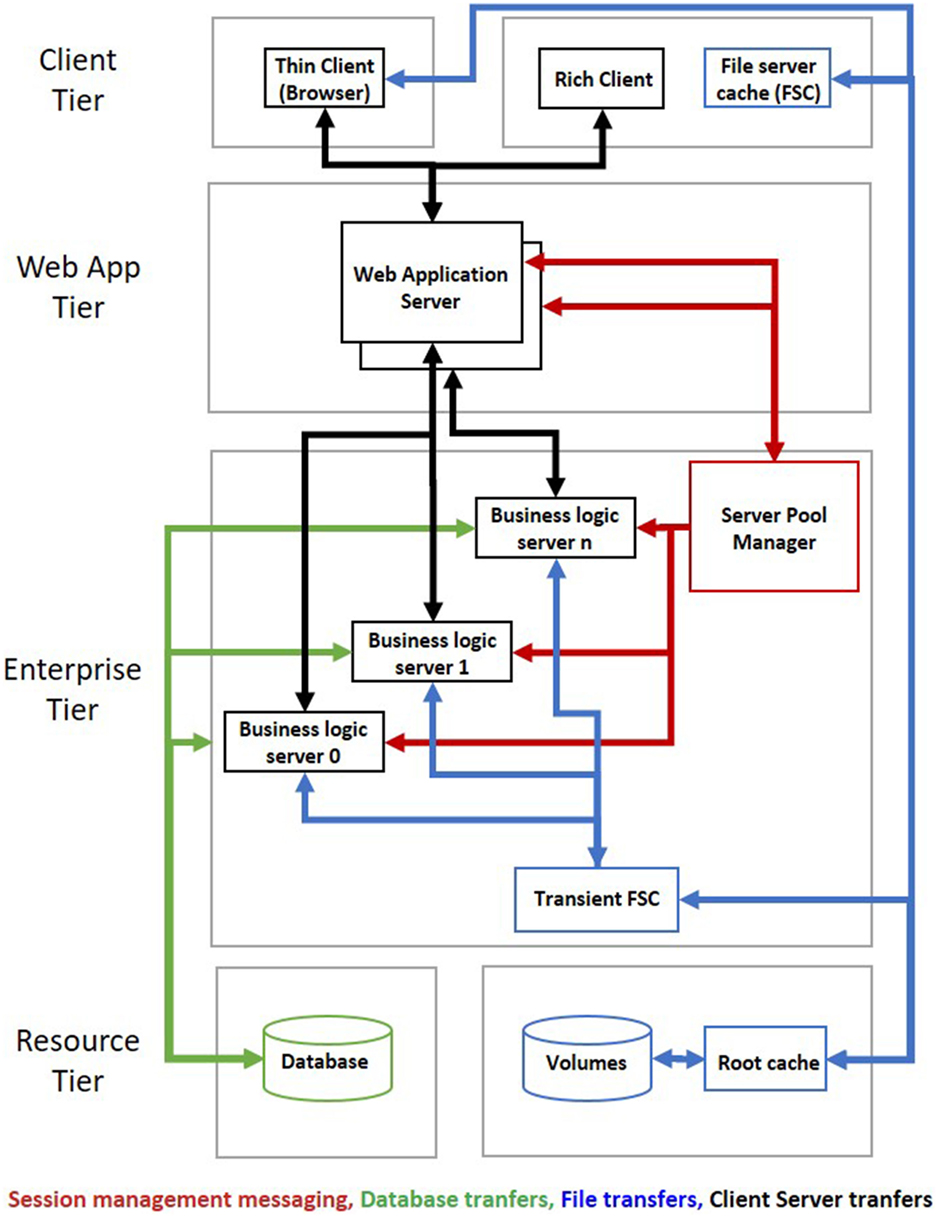
Figure 3. The four tiers of a Product Lifecycle Management system with data flows.
The compatibility of PLM features with the four axes required for neuroimaging data management—that were highlighted in Section “Design Method”—is presented in Table 1. The basic features of PLM systems allow (1) to fulfill context and traceability of the provenance axis, (2) to manage every data types and formats, which fulfill part of the heterogeneity axis, and (3) the integration of visualization software and the possibility to connect to external software, web services, etc. These features do not cover all parts of the perimeter of the four axes. Therefore, we developed a data model to complete provenance, heterogeneity, and flexibility axes, as the data model of a PLM system can be easily modified.
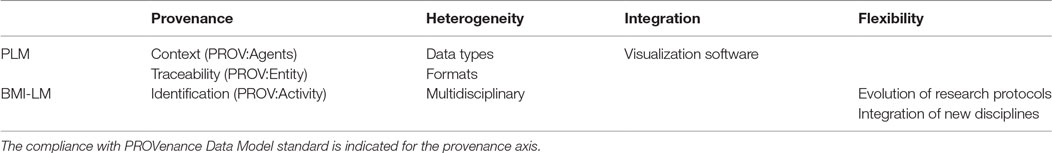
Table 1. Features of Product Lifecycle Management (PLM) systems and the BioMedical Imaging—Lifecycle Management (BMI-LM) data model against the four axes required for the management of neuroimaging studies.
The BMI-LM Data Model to Manage Data and Provenance
The stages of a neuroimaging study can be modeled as a cycle that constitutes the lifecycle of a research study, from study specifications to published results (see Figure 1).
First, the BMI-LM developed for the BIOMIST platform is presented from its two aspects: generic objects (see Generic Objects to Manage Heterogeneity) and specific classes (see Specific Classes to Bring Flexibility). To end with, the BMI-LM data model is compared with PROV-DM specifications (see Conceptual Equivalence Between the BMI-LM Data Model and the PROV-DM Standard).
Generic Objects to Manage Heterogeneity
The BMI-LM data model is composed of generic objects representing concepts related to a study. The 17 generic concepts (see Table 2 below) are divided into three categories:
1. Definition objects: they described how result objects were obtained and can be reused from one study to another. They are part of the provenance strategy.
2. Result objects: they store data of a study, raw and derived, in shape of datasets (files) and metadata.
3. Ambivalent objects: depending on the context, these objects can be used as a definition object or a result object. They are part of the provenance strategy.
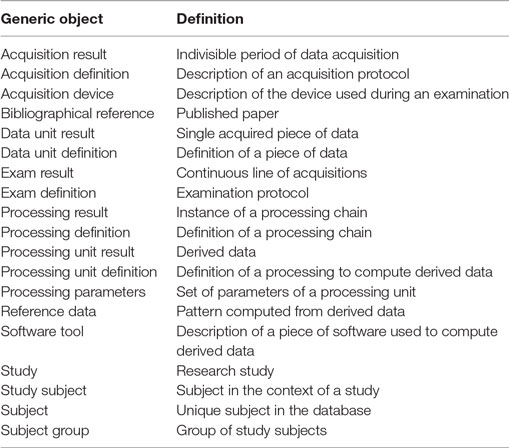
Table 2. Generic objects of the BioMedical Imaging—Lifecycle Management (BMI-LM) data model.
The generic objects are presented in Table 3 according to their category and their stage in the study lifecycle. Figure 4 presents a UML model of BMI-LM with the relationships between objects and related cardinalities.
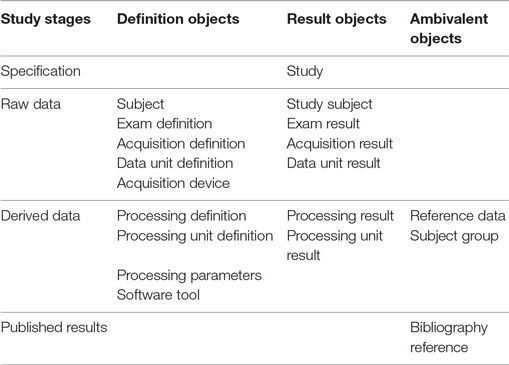
Table 3. Generic objects of the BioMedical Imaging—Lifecycle Management data model according to study stages and categories.
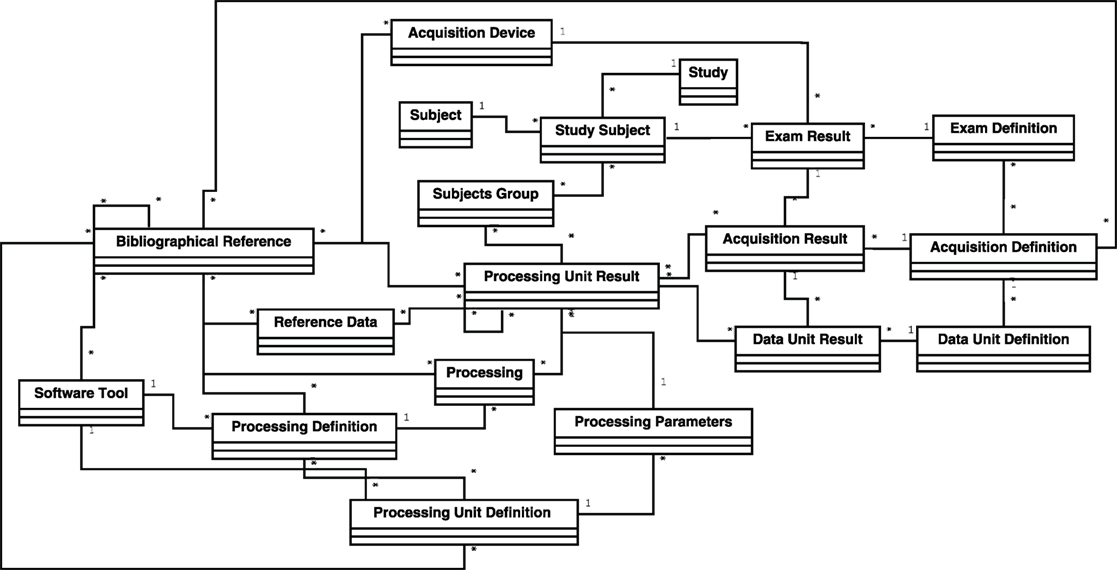
Figure 4. UML representation of the generic objects of the BioMedical Imaging—Lifecycle Management data model.
Specific Classes to Bring Flexibility
To enable flexibility in the semantic definition of the objects, “classes” may be associated with instances of the data model. A class in the context of the PLM system is a name (hopefully with a meaning for the end user: names were issued from ontologies of the application domain, see Section “Domain Classification for Neuroimaging”). A class has typed attributes that allows values to be associated with items. All the classes are organized in a standard inheritance hierarchy tree and attributes are inherited. Every item of the BMI-LM data model can be classified, and the root structure of the classification is organized by object categories: definition branch, result branch, and ambivalent branch, which are themselves divided into subcategories. The classes play the role of subtypes of objects; for example, an exam result object can be classified as an imaging, psychology, or genetic examination.
The different domains involved in neuroimaging studies do not use the same vocabularies, as well as acquisitions and processing tools. Such information is stored in the attributes of the classes, so a classification is domain dependent. The highest level of the classification (the main categories) will be used in every deployment of BMI-LM, the lower-level branches may be deployed where needed; and new classes/attributes may be easily created.
Conceptual Equivalence between the BMI-LM Data Model and the PROV-DM Standard
A representation of provenance is proposed by the World Wide Web (W3) consortium, who develop standards to support the expansion of the web. According to the PROV-DM standard, the provenance is defined “as a record that describes people, institutions, entities and activities involved in producing a piece of data or thing in the world” (Moreau and Missier, 2013). An entity can be physical, numeric, or conceptual. An activity occurs on a time period and act with or on one or many entities. This includes consumption, processing, transformation, modification, using, or generation of entities. An agent is responsible in the execution of an activity. Entities, activities, and agents are modeled by seven relationships, which are given in Figure 5A.
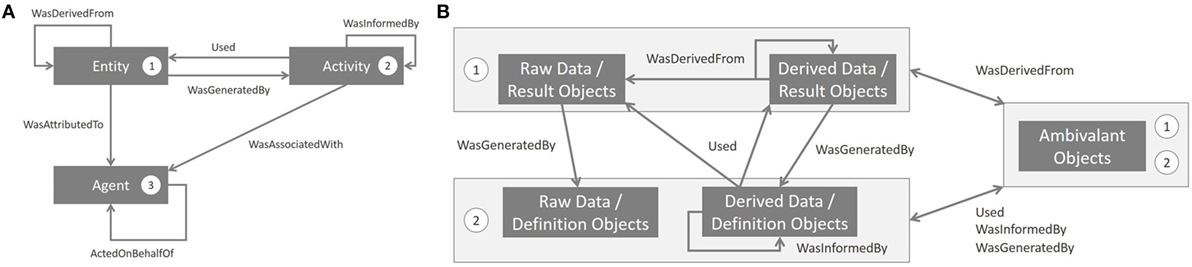
Figure 5. Links between the PROV standard and the BioMedical Imaging—Lifecycle Management (BMI-LM) data model. (A) Organization of the PROVenance Data Model (PROV-DM) standard developed by the W3 consortium (http://www.w3.org/TR/2013/REC-prov-dm-20130430/). Numbers represents categories shown in panel (B). (B) PROV relationships between categories of objects of the BMI-LM data model. The Agent concept of PROV-DM is not mentioned on the figure, because Product Lifecycle Management (PLM) features naturally fulfill agent provenance: Agent is represented by a PLM user (real person or robot), WasAssociatedWith by a workflow order, ActedOnBehalf by the project organization, and WasAttributedTo by the owner of the resulting data (Entity).
Figure 5B shows how the BMI-LM data model and the PROV-DM standard are equivalent in a conceptual way: result objects are entities, definition objects are activities and some PLM features (users, workflows) are agents.
Mapping Strategy for Data Import
The strategy for data import is essential to ensure that the BIOMIST platform will be integrated as a study data management tool. Import processes must stay flexible and easy enough for any data format or acquisition process. In order to set up automatically the provenance, a mapping between the data to import and the data model of the platform must be efficient. First, we present two key principles of our mapping strategy to import data, and then, this strategy is exemplified for the import of form and DICOM data.
Key Mapping Principles
To import data with complete provenance, its context must be known—at least the project and the subject it belongs to, its future owner—and its definition. For the BIOMIST platform, it means that the PLM system must know what kind of item to create (result item), how to classify it, and how to link it with existing items in the database (definition items and other result items).
Our strategy is to define an XML structure to map imported data and its associated metadata to an item of the data model, a class associated with the item and class attributes. An example of XML mapping is given as Part S1 in Supplementary Material: a DICOM series is imported as a data unit in an existing exam and in a new acquisition.
The XML mapping file is associated to definition items (e.g., an exam definition item since this particular mapping is specific to this examination protocol), with two objectives in mind: to understand how the data was imported and to reuse the mapping for another study.
Form Data Import
A form is a set of simply typed data (set of answers, tracings, parameters, etc.) that needs to be acquired for every subject in a study. For instance, it may be the result of a behavioral survey, or an electronic case report form. The definition of the form is an Acquisition Definition item, and the questions are defined by Data Unit Definition items. Therefore, the result of the import of a form for a subject is an Acquisition Result item with all the related Data Unit Result (the answer by a subject to a question).
DICOM Import
Digital Imaging and COmmunications in Medicine (DICOM) is a worldwide used protocol for exchanging data between imaging modalities, archival systems, and visualization workstations (Mildenberger et al., 2002). A DICOM instance usually contains images to which is associated a series of attributes (tags), selected from a dictionary described in part three of DICOM standard specifications. The standard tags that are used by imaging devices to store modality-specific imaging parameters, patient, institution, and device information, as well as date and time information. Beside the standard fields, the DICOM standard allows for proprietary fields in dedicated parts of the DICOM header. A same DICOM tag will not have the same meaning depending on the vendor, and vendor-specific dictionaries are required. Our mapping strategy allows tackling this issue as the definition of import mapping from DICOM attributes dictionary to BIOMIST classification attributes dictionary can be adjusted for every exam definition if needed.
A basic mapping between equivalent concepts of the DICOM and the BMI-LM data model is given in Table 4. The main difficulty we face is that there is no equivalent for the definition objects in the DICOM standard: if a same scan generates five DICOM different images series, we get five seemingly unrelated DICOM series. In order to tell the PLM system which series derive from which acquisition, we first have to group the DICOM series derived from a single scan, based on the contents of several different DICOM attributes.

Table 4. Basic mapping between DICOM protocol and BioMedical Imaging—Lifecycle Management (BMI-LM) data model concepts.
The DIMP Method for Integration of Processing Pipelines
Studies in neuroimaging require complex pipelines for the processing of images: registration, segmentation, temporal or spatial filtering, etc. The pipelines may include many different steps and algorithms, parameters, and software that are regularly evolving as research progresses. Their structure varies according to the image acquisition techniques employed and the nature of the endpoints that are needed to test the studies hypotheses. The neuroimaging community has developed elaborate pipeline management systems, such as LONI pipeline (Rex et al., 2003; Dinov et al., 2010) or Nipype (Gorgolewski et al., 2011). With such systems, Command Line Interfaces tools are wrapped by structures describing each of their inputs, options flags and outputs, and storing the name of the executable, enabling the software to build proper command lines. These structures can be linked together into a processing graph with a node representing a processing unit and an edge representing an input and output relationships. The graph is then analyzed to optimize the parallelization of jobs on grid computers.
Some neuroimaging software suites, such as XNAT, come with an integrated pipeline management system, by allowing users to launch processing pipelines directly from the database. In this case, imaging sessions are launched one by one. When processing data in large batches, it is more convenient to push and pull the data in and out of the database (Schwartz et al., 2012). However, if the pipelines are launched externally, the inputs and parameters become more difficult to track. In order to ensure research reproducibility, traceability of statistical models used for prediction, data sharing with peers and data reuse, the provenance information of the processing pipelines must be properly managed. Because of the complexity of pipelines, provenance information has to be generated automatically by the pipeline management system and then stored in the database. We developed the DIMP method with these two objectives in mind: ensuring full provenance and facilitating the launch of processing pipelines by users.
Specifying the Inputs to an Image Processing Pipeline
To launch a pipeline, users must select: (1) the items to process, (2) a processing pipeline to apply, and (3) parameter settings. The multiplicity of the parameters involved in image processing in neuroimaging studies create a major issue: all the parameters involved in the generation of the derived data need to be tracked to ensure the reproducibility of results, both on same data and on new data. Furthermore, in longitudinal imaging studies, subjects undergo imaging sessions regularly over a long period of time (up to several years), and exactly the same processing chains must be applied so that the data can be compared. Users may also want to store concurrent versions of the derived data, differing over a few processing parameters or processing steps to understand their impact on the results.
To implement this functionality, one needs to add a generic object to the BMI-LM data model: the WorkFlow Input object. Its role is to gather all the definition items needed to launch a processing pipeline: the processing pipeline itself (object: Processing Definition), processing parameters for every step (object: Processing Parameters), and the definitions of input data (objects: Data Unit Definition for raw data, Processing Unit Definition for derived data). These last data are crucial: they allow the PLM system to query the right data, for the subjects selected by the user. Figure 6 shows how using a Workflow Input object is particularly valuable to reproduce same processing chain several times on new data (acquisitions on the fly, longitudinal studies, new studies).
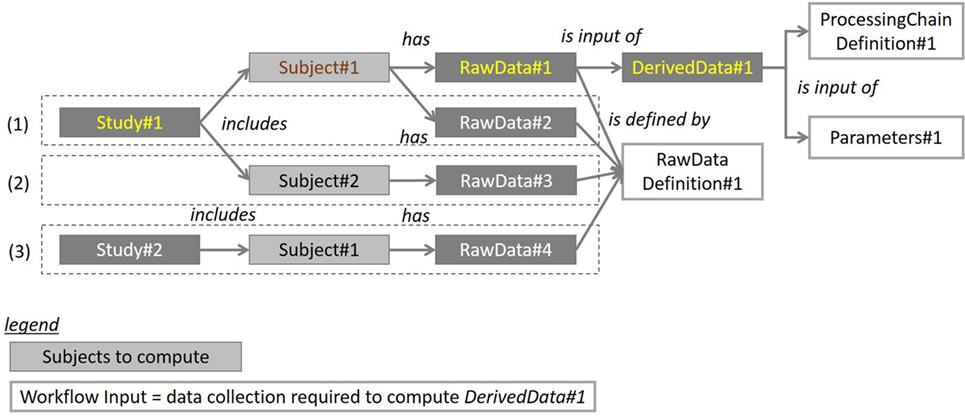
Figure 6. Diagram illustrating how the Workflow Input object can be used to reproduce an existing workflow on three use cases: (1) analysis of data associated with a new time point in a longitudinal study, (2) analysis of data from a new subject of the same study, and (3) analysis of data from a new subject of the different study (different study same processing chain). Definition of input data (raw data in the figure, but it could be derived data), definition of processing chain, and parameters are collected in a Workflow Input object by the user. When a processing chain has to be computed again on new data (new acquisition or new subject), the Workflow Input object is reused and the targeted subjects are given to the system to query corresponding input data. For use case (1), which represents a longitudinal study, appropriate raw data are found by excluding data that has already been computed with the processing chain.
Stages of Integrated Processing in a PLM System
The main objective of the DIMP method is to ensure quality provenance of derived data by reducing manual operations from users: data resulting from processing chains are automatically linked to input data, definition of processing chain, and parameters. The DIMP method is defined by the following stages:
Initialization
1. (User) build or identify a workflow input
2. (User) launch integrated processing workflow
○ Select workflow input
○ Select subjects
Workflow execution
3. (PLM system) query input data
4. (PLM system) export in working folder
○ Input data
○ Definition of the pipeline
○ Parameters of the pipeline and processing nodes (processing parameters items)
5. (Computer cluster) launch the pipeline script stored in the definition object representing the pipeline. This script parameterizes and executes processing operations.
Traceability operations
6. (PLM system) upload resulting data
○ Create corresponding result objects
○ Link result objects to its input data (raw or derived) and definition objects (pipeline structure and parameters)
7. (PLM system) sends an email notification: data are ready
Integration of Existing Neuroimaging Pipeline Engines
Processing pipelines are executed outside of the PLM system, typically on a computer cluster. Existing neuroimaging workflow management systems can therefore be used to execute the pipelines on any software libraries that can be launched in command lines. When manual processing is needed (such as expert delineation of brain structure), it is easy to checkout any dataset, modify it or create a new dataset, and send the results back to the PLM. Indeed, this corresponds to how CAD engineers work.
To facilitate user’s work, the definition objects of the processing pipeline can be generated through software tools, which extract the relevant information from pipeline specification files and facilitate the specification derived data annotations.
Querying Strategies
Efficiently storing data and managing provenance is not sufficient to ensure that data can be reused: the platform also should enable easy data querying. One major issue preventing from data access is user’s knowledge and understanding of the data model: as provenance is complex so are the queries. Therefore, getting to know the different concepts is time-consuming to occasional users. A query is defined both by the search criteria and the formatting of the retrieved data. The BIOMIST platform provides researchers with an intuitive way to retrieve data through a graphical interface (see Graphical Querying Interface). With this interface, queries are designed using concepts and relationships. Consolidated data can also be obtained through ODBC connectivity (see Report Building).
Graphical Querying Interface
Even if the neuroimaging community shares many standards, each research group—not to say each researcher—uses its own vocabulary to label its data. Besides, neuroimaging is a multidisciplinary domain and each discipline has its own concepts and ways of using data. In this context, it is difficult for researchers to query an unknown or an occasionally accessed database, because they are neither familiar with the data model nor with the semantics behind it (Pham et al., 2016). In the BIOMIST platform, to facilitate the query definition process of various kinds of users—occasional/regular, experienced/inexperienced, or the ones who come from different disciplines—we propose a graphical and user-oriented query approach.
For the “user-oriented” aspect, the proposed query approach is composed of three levels of abstraction—lowest, intermediate, and highest corresponding with three kinds of users: technical users, regular users, and occasional or non-technical, inexperienced users, respectively. At the lowest level, technical users, who have a good understanding of the way data structured, can directly select business objects in the data model to create a query. For instance, the Acquisition Result object is used to query all acquired data during the data acquisition process.
At the intermediate level, regular users, who manipulate frequently with data and have a certain understanding about them, are provided with a more abstract hierarchy of data classes. A class can have attributes and is named accordingly to the data it represent. Regular users could easily find their interesting data from one or many classes. For example, in the “Imaging Result” class, users could find all acquired imaging data like “EEG,” “MEG,” “MR,” and “PET” data. Some relations between classes can be defined to help users make more complex queries on multiple kinds of data.
The highest level is dedicated to inexperienced and non-technical users who have no knowledge about the data model and classification. We use ontologies and its graphical representation to facilitate the query making process of these users. The ontology is defined as “an explicit, formal specialization of a shared conceptualization” (Studer et al., 1998) and can be used to provide an explicit representation of domain knowledge and semantic relations between data in the database that is easily understood by inexperienced users. Without needing to understand the underlying data structure, inexperienced users express their queries with ontological concepts. For instance, the “imaging-acquisition-data” concept from OntoNeuroLog ontology (Gibaud et al., 2011) is used to query all acquired imaging data. The query formulated with ontologies is then translated into a formal query over data sources by using a set of mappings. Each mapping is an association between an ontological concept and the database schema. The set of defined mappings is then exported and implemented in the query transformation module of the PLM system.
For the “visual” aspect, playing the role of an external cognitive support to understand complexity (Keller and Tergan, 2005), graphical visualizations are used at the three levels to facilitate users’ query making process. All objects of the data model, classes of the classification, or ontological concepts are represented in a browsing tree while all eventual relationships between them (objects versus objects, etc.) are represented in an intuitive, interactive graphical zone to help users quickly and easily define their queries.
For example, at the highest level, a user starts by navigating through concept tree to select an interesting concept. When a concept is selected, the graph highlights all its relationships with the other concepts; user can select one of these concepts and add it into the query in order to make a query condition. This process is repeated until the query is defined completely. During the making process, the query formulated by the user is graphically represented to provide an illustrated visualization of all selected concepts and query conditions. At the end, this query is translated into one executable query by a query processor. The query results are displayed on the same interface, under the shape of a graph (nodes for resulting objects, edges for relationships).
Report Building
In neuroimaging, more and more studies include meta-analysis. For example, both supervised and unsupervised classification algorithms are typically used for discovering correlation between biomarkers extracted from brain images and behavioral observations or extract hidden structures (Abraham et al., 2014). The building of such data files prepared for analysis is quite fastidious because of the multiple sources of data. Furthermore, beside classification, deep learning algorithms (LeCun et al., 2015) are raising more and more interest in the neuroimaging research community since they begin to show a real potential on analyzing flexible and high-dimensional data, which is their main advantage. To exploit these heterogeneous data in a machine learning context, we designed a data mapping that consists of exporting neuroimaging data classification from the PLM, to a database server that most statistical analysis softwares should be able to address. The connexion between the PLM database and the database structured for statistical analyses is enabled with ODBC, a standard API (Signore et al., 1995).
Implementation
PLM Choice and Customization
The BMI-LM data model has been implemented in the PLM software Teamcenter (v10.6) developed by Siemens Industries Software, which has a commercial license. Information about Teamcenter architecture and technical details can be found in Teamcenter documentation: Teamcenter system administration (Siemens PLM Software, 2015b) and Teamcenter access manager (Siemens PLM Software, 2015a). Besides, Siemens PLM Software published a white paper on security management in Teamcenter (Siemens PLM Software, 2011). CIMdata, a leading independent global consulting and research authority toward PLM, wrote a white paper focused on Teamcenter as a unified platform that describes its functionalities (CIMdata, 2010). A type of Teamcenter objet is created for each object of the BMI-LM model, so that the four stages of a neuroimaging study are supported. Data are attached to object instances through dataset objects. The object instances are linked through typed relationships as defined in the BMI-LM data model. Teamcenter proposes a classification feature, which is often used in manufacturing industry to classify products in families.
Teamcenter PLM system is easily customizable to fit users’ needs: data model, data formats, workflows, access management, queries, integrated visualization and analysis tools, and interface. These make Teamcenter a backbone that can be adapted to the specific features of new domains (processes, formats, tools, etc.).
The organization feature of Teamcenter is used to model users’ groups and roles, which are required to design access rules to the data. Four roles are defined to access data inside of a study: principal investigator (can view all data of the project and edit all instances), data administrator (can view some data of project, can create and edit instances of objects, and can manage relationships between instances), editor (can view some data of the project, can edit instances of objects), and guest (can view some data of the project). The amount of data viewed and editable for each role can be defined.
Three data vaults that store files are set up with different backup strategies, according to data value:
– Raw data: this vault is the most valuable, as it contains all acquisition and study data. During acquisition or import campaigns, daily backup.
– Derived data: valuable too, but as these data can be computed again thanks to provenance storage and because the volume may be very big, the backup is occasional.
– Definition data: this vault is the lightest, as it contains only the data from definition objects. The backup strategy is high, as these data are crucial. Domain classification for neuroimaging.
Domain Classification for Neuroimaging
The definition of a classification requires a substantial investment in time and expertise. Some ontologies have already been designed and used by the neuroscience and neuroimaging communities (Temal et al., 2008). Therefore, defining the neuroimaging classification on existing organized knowledge seems relevant. Besides, the use of existing ontologies allows future data sharing between the PLM system and existing neuroimaging databases. Ontologies can be used as a mediation model between the data models of two databases. Aside of ontologies, standardized and partly aligned lexicons also exist, such as NeuroLex1 and DICOM that can provide class attributes. In a PLM system, class attributes are stored in a dictionary. Classes are stored in a hierarchical tree and can receive any number of attributes from the dictionary. We imported classes from OntoNeuroLog (Gibaud et al., 2011) ontologies for the classification branches that deal with image acquisition (image examination, acquisition, and data unit definitions) and image processing (processing unit definitions, imaging datasets). We based the subject-related branch of the classification on QIBO (Buckler et al., 2013). MRI parameter attributes (parameters such as the echo time) were imported from the DICOM lexicon (Clunie, 2000). Currently, we use attributes in the experimental psychology classes to store labels from the cognitive atlas (Poldrack et al., 2011) or cognitive paradigm (Turner and Laird, 2012) ontologies, as those seemed too large to be imported fully in the classification.
The classification that is used in the BIOMIST platform in its current state is available as Part S2 in Supplementary Material, in a mindmap format that can be viewed with the Freemind software.2
Data and Software Integration
Data Import
We developed a DICOM/Teamcenter interface that relies on the dcm4che java DICOM library. This way, the PLM server can act as a C-STORE service class provider (a DICOM archive), as well as a query/retrieve service class provider. It is therefore able to interact with existing PACS instances and DICOM viewing workstations. As XNAT, we rely on an intermediary gateway to comply with the defined PLM access management policies during query/retrieve operations. We also use web services to import other types of data (i.e., non-imaging data): for instance, to import the resting-state debriefing questionnaires, a web service receives the data from a LimeSurvey3 server and imports it into the PLM database.
Data Processing
As neuroimaging pipeline engines are now very mature, there was no need to develop a new one for the BIOMIST project. To implement the DIMP method, we chose the Nipype4 (Gorgolewski et al., 2011) pipeline engine, because it is simple to extend, flexible (written in Python), able to deal with many grid schedulers. Since this software originates from the neuroimaging community, it has a very rich catalog of interfaces for neuroimaging Command Line Interfaces tools [AFNI (Cox, 1996), ANTS (Klein et al., 2009), SPM (Ashburner, 2012), Freesurfer (Fischl, 2012), FSL (Jenkinson et al., 2012), etc.]. When running a job on a computer cluster, there are two different aspects to take into account: the command line to be executed (what are the inputs and options?) and the way the scheduler is going to handle it (how much memory, time or CPUs do we need?). The former is the domain of specific command line wrappers (i.e., the Nipype interfaces); the latter is the domain of generic processing node properties. We use the Teamcenter classification system to account for both. Accordingly, we developed python tools to import the existing Nipype interfaces, which describe the input and outputs of each command line tool, within the PLM classification as processing parameter classes. Based on these tools, we also developed tools to import entire Nipype workflows in the PLM (processing definition, processing unit definitions, and processing parameters items) and build the associated workflow input items.
Data Querying
The querying interface was implemented as a Javascript web client that connect to Teamcenter through a web service. The interface is composed of several windows, displaying information to build the query: the domain ontology, the relationships, the related classification, the criteria of the query chosen so far, and the query path itself. A view of the web querying interface is presented in Figure 7.
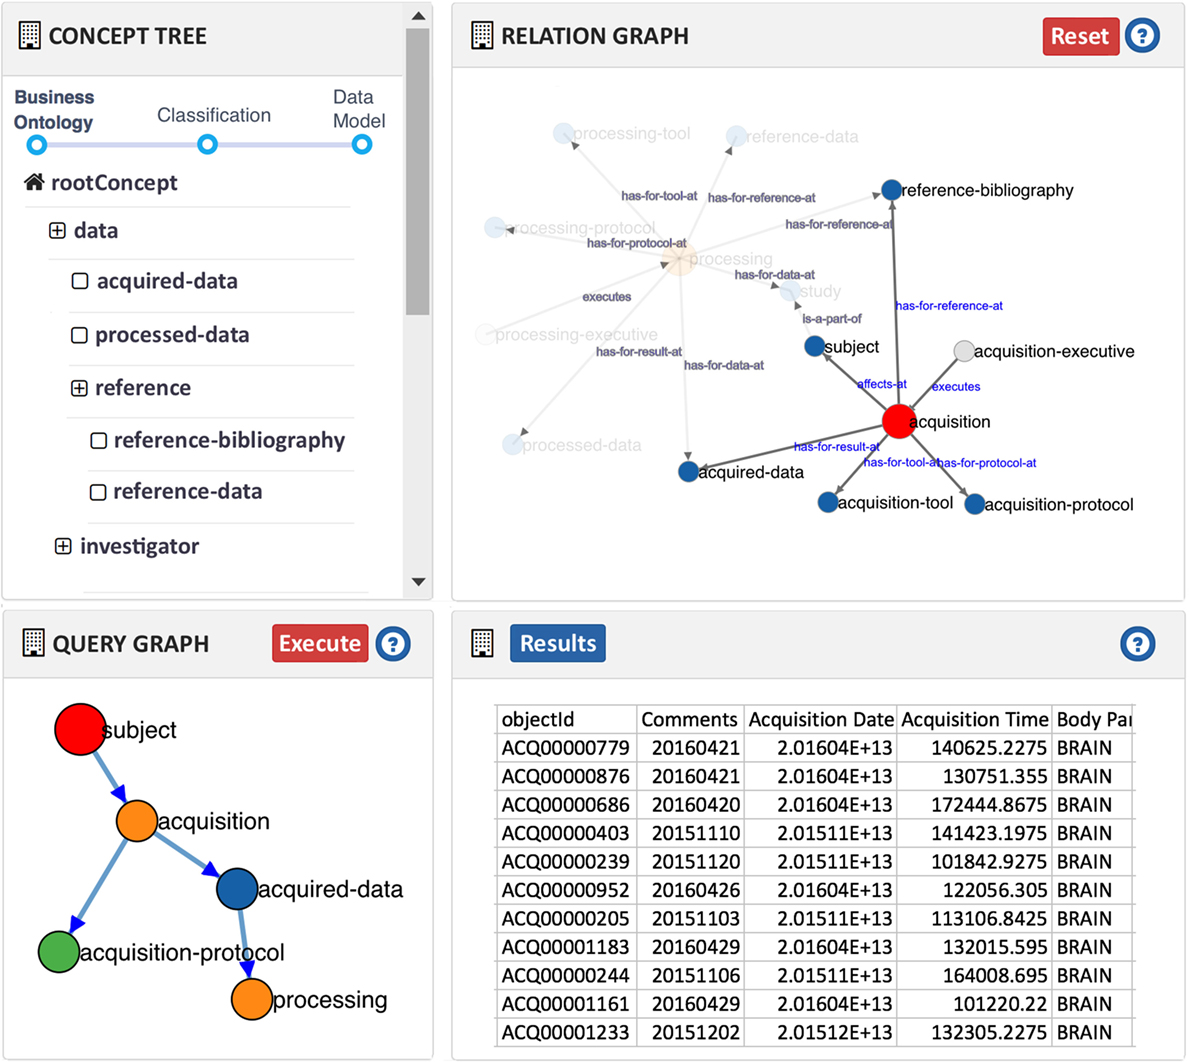
Figure 7. Ontology-based graphical query interface.
For the implementation of consolidated data files for statistical analysis, we took advantage of the PLMXQuery tool that is an approach for querying and exporting data from PLM (Sriti and Boutinaud, 2012). The concept of this approach is to make the PLM content seen as a XML document, in order to benefit from XML-related technologies, in particular XPath and XQuery, which are standard languages working on XML structures. XQuery scripts are used to browse PLM content (items, classification data, dataset contents, etc.) and to convert that data to any desired format. It can be used to create or update anything from a Hive table to a CSV file. It is currently used nightly to update data tables containing information about ongoing MRI acquisition that are accessed by researchers through ODBC connectivity for analysis with the JMP statistical software.
Example of Workflow: Raw Data Quality Check
Teamcenter PLM system allows creating easily workflows of operations. We present an example of workflow that is used to control the quality of new imaging raw data. Figure 8 shows the steps of the workflow:
1. Start of workflow: the workflow is initiated with raw data to control.
2. Automated quality control of raw data imaging parameters against those stored in the definition items.
3. A temporary status is assigned depending on control results.
4. The data manager (technical expert) is notified by email that there are new imaging data to control.
5. The data manager controls new imaging data.
6. The final status is set on new imaging data. If this status is “validated,” then the raw data would be involved in new workflows, such as processing workflows.
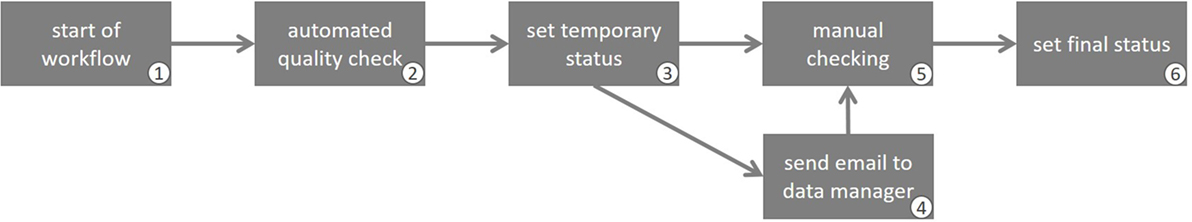
Figure 8. Steps of the workflow of raw data quality checking.
Speed of Access and Computing
Teamcenter PLM system is an efficient system to query and retrieve managed data. Data relationships are browsed as a graph and therefore query complexity is equal to graph browsing complexity. During the DIMP method, input data are queried and retrieved on computing grid and output data are imported when computation is done. Speed of data retrieving, as well as the speed of data import, is dependent of computing grid network performances. Besides, speed of data computing is dependent of computing grid performances and analysis tools chosen.
Licensing of the BIOMIST Platform
The conceptual data model is published and freely available to the community, as well as methods and functioning principles. The core of the BIOMIST platform is Teamcenter PLM system, which has a commercial license and academic licenses that are available for education and research purposes. Any analysis or visualization tool can be integrated with Teamcenter, whatever their type of license. We plan to release the TeamCenter business model files (which are meant for the TeamCenter Business Model IDE) under a GPLv3 license, using a web-based version control management service. This will still require that users have access to a TeamCenter license, however. We hope to have provided enough details in the article so that the model as described here can also be re-implemented using open-source software.
We plan to open in the middle of 2017 the platform to researchers through collaborative scientific projects with the GIN. We plan to open in the middle of 2017 the platform to researchers through collaborative scientific projects with the GIN. For those projects, researchers of both groups will decide the sharing of their respective data in relation with the goals of the collaborative study. For projects that are not in the field of scientific expertise of GIN, Ginesis-lab (joint venture project between GIN and Cadesis) intents to launch another system to give researchers an access to the functionalities of the platform. Researcher groups interested are welcome to contact the corresponding author.
Application
Study of Brain Network Connectivity on the BIL&GIN Dataset
The GIN first Brain Imaging Laterality (BIL&GIN1) dataset is composed of 300 subjects, balanced by gender and handedness, and was acquired between 2009 and 2011 (Mazoyer et al., 2016). MRI resting-state images are segmented with a 384-region atlas and connectivity by pair of regions is measured.
The use case tested on the BIOMIST platform with the BIL&GIN dataset stands in six steps (illustrated in Figure 9):
1. Acquisition of raw data: the BIL&GIN dataset is imported from the GINdb database of the GIN laboratory (Mazoyer et al., 2016).
2. Processing of individual data: a pipeline that computes functional connectivity between regions of the brain is automatically launched with the DIMP workflow.
3. Creation of analysis groups: groups of subjects are queried according to research assumption based on subjects’ characteristics. The chosen criteria are: age, gender, and declared handedness, stated in ranges.
4. Processing of group data: a pipeline computes median functional connectivity for each group, creates from these data a MDG and computes a constraint layout to help the visualization analysis. All these processing operations are performed with the DIMP workflow.
5. Visual browsing of complex graphs: the resulting MDG is analyzed in an integrated visual browser.
6. Publication of results: the paper presenting the results of the MDG analysis would be written with a versioning history and linked to the data used for the analysis, which enables the replication of the procedures involved.
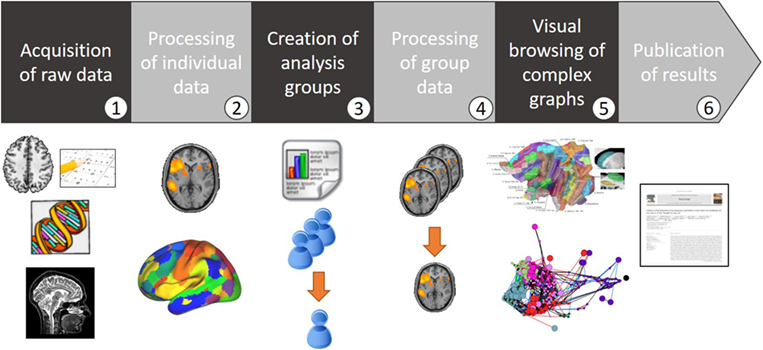
Figure 9. The six steps of the use case on the BIL&GIN dataset.
The BIL&GIN dataset, stored in a SQL-based database, was imported into the BIOMIST platform through a scripts that converted SQL tables into PLMXML files readable by Teamcenter PLM. Figure 10 shows raw data of a subject from the BIL&GIN dataset in the BIOMIST platform: the subject has two exams, one fMRI resting-state exam with three acquisitions (resting-state, anatomical, debriefing form) and one exam about subject’s individual characteristics.
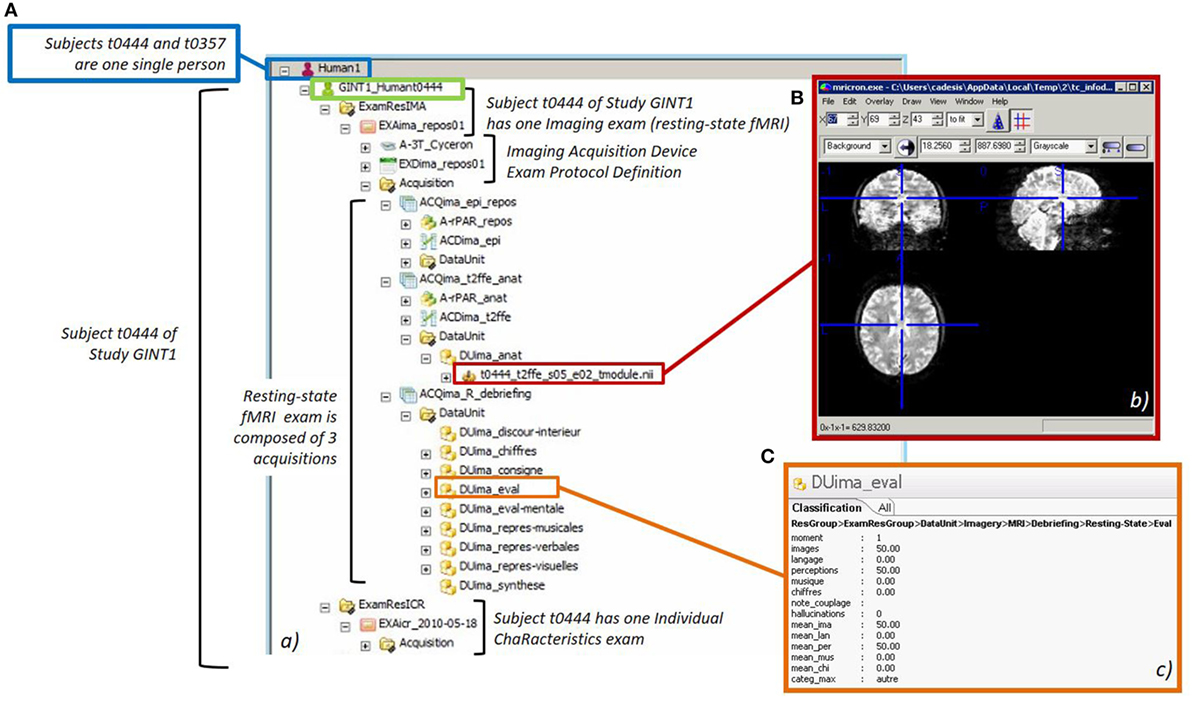
Figure 10. Step 1 of the use case with the BIOMIST platform. (A) Raw data of a subject identified t0444 from the BIL&GIN dataset in Teamcenter client. NifTi anatomical image (B) and resting-state debriefing form (C) are displayed.
Imaging raw data were processed with the DIMP method, with four workflows: (1) preprocessing workflow (registration, segmentation), (2) workflow to compute individual adjacency matrices of functional connectivity, (3) workflow to build group adjacency matrices, and (4) workflow to compute and analyze dynamic graphs from group adjacency matrices. Figure 11 shows how the final dynamic graph is obtained from individual adjacency matrices of functional connectivity.
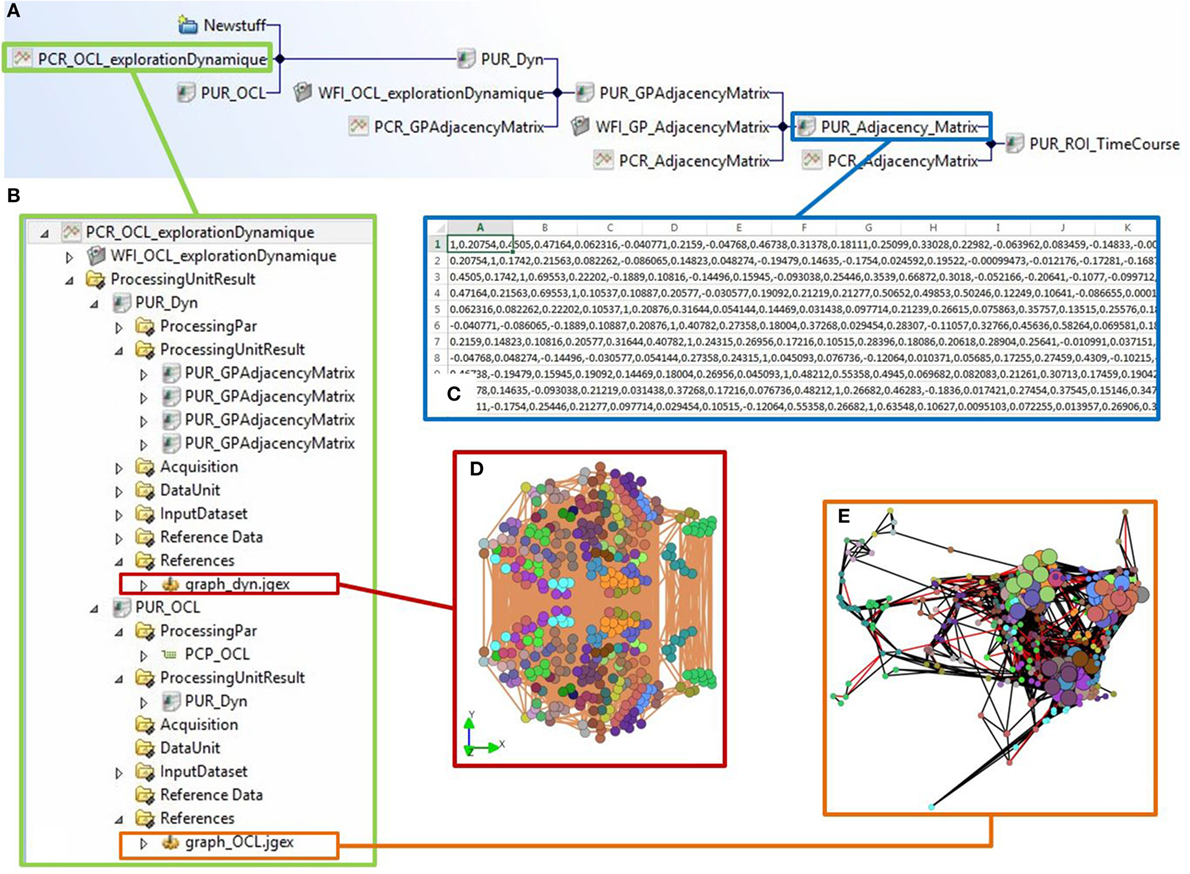
Figure 11. Steps 4 and 5 of the use case with the BIOMIST platform. (A) Traceability of the processing chain of brain connectivity for a group of subjects, from adjacency matrix to final dynamic graph. (B) View of the final processing pipeline to compute dynamic graph from the groups of subjects. (C) Display of the adjacency matrix of brain connectivity for a group of subjects. (D) Dynamic graph obtained from the matrices of all the groups. (E) Final layout of the dynamic graph for analysis.
The study of resting-state networks with MDGs on the BIL&GIN dataset is currently under process.
Ongoing Cohort Acquisition Campaign
The MRI-Share study is a subpart of the i-Share epidemiological study on students’ health.5 As many as 2,000 students are expected to undergo an MRI protocol including structural, diffusion, and multiband resting-state acquisitions on a recent 3-T scanner.
The MRI-Share study is particularly suited to test the BIOMIST platform, as it is a multidisciplinary study: resting-state fMRI acquisitions are followed by a debriefing questionnaire (Delamillieure et al., 2010) and other psychological data and genetics acquisitions. Because of the high number of subjects, batch data processing, as implemented with the DIMP method, is mandatory.
The acquisition campaign started in November 2015. Up to 10 subjects participate every day in the study from Tuesday to Friday, every week. At the time of writing, 1,200 subjects have participated. The import of a typical MRI-Share DICOM study (about 2.5 Go of data and 3,300 instances) into the BIOMIST database takes an average of 7 min and 56 s, with a SD of 221.7 s (3 min and 41.7 s). The daily acquisitions are imported every night, through an intermediary PACS system (dcm4chee) and a web service.
Discussion
The BIOMIST platform is designed to manage, share, and reuse data from neuroimaging studies. Provenance is tracked throughout the four stages of the lifecycle of a study, whatever data type or format, thanks to:
– PLM systems that naturally enable collaborative work and lifecycle management in a secure environment.
– The BMI-LM data model that supplements PLM features by introducing the concepts of a neuroimaging study and by allowing future semantic changes and evolutions of research practices. The data model enables the traceability of the data in ways similar to PROV-DM standard from W3C.
– Mapping strategies that allow automated data import, such as DICOM files or forms.
– The DIMP method that allows to launch processing pipelines and to retrieve automatically the resulting data; existing workflow engines and processing software can be integrated.
– A graphical query-building interface accessible to occasional users and report building to perform statistical analyses.
– Easy integration of visualization and processing tools.
The BIOMIST platform is currently used for the management of the BIL&GIN dataset (300 participants) and the ongoing longitudinal MRI-Share cohort acquisition of 2,000 participants, and its target is new neuroimaging studies from small (100 subjects) to medium (5,000 subjects) cohort, with multimodal, longitudinal and multi-source acquisitions requiring complex pipelines, quality controls, and efficient access management. The studies managed on the BIOMIST platform are still ongoing; therefore, the BMI-LM has not been validated on the fourth stage of a study (published results).
The BIOMIST platform distinguishes from existing neuroimaging data management systems by providing in one environment: (1) study data management throughout study lifecycle, (2) heterogeneous data management, and not only imaging, (3) managing provenance in order to enable data sharing and reuse, (4) allowing data processing and analysis inside the platform, with users’ regular software tools, and (5) providing a secured access to preserve data consistency and confidentiality. One current disadvantage of the BIOMIST platform is the necessity to train a specialized data manager in order to maintain the system, because it is complex with many possibilities of personalization.
One of the main objectives in designing the platform was to enable the use of existing neuroimaging tools and community standards: data formats, workflow engines, processing and visualization software, and ontologies. To foster data sharing through the community, it would also be relevant to bridge PLM systems with web-based archival systems such as XNAT or such as PubMed in order to link bibliography management of the BMI-LM model with the most complete bibliography database in medical field. Mediation between databases is possible through ontologies. Some work has already been done on this topic in the neuroimaging community (Ashish et al., 2010). Although classes from ontologies are being used in the BIOMIST platform for the neuroimaging data classification and the graphical querying interface, richer semantics would improve the management of relationships between the different objects in PLM systems (Assouroko et al., 2012). For instance, the mapping for data import could rely on an ontology-based description, rather being described in a XML file. Therefore, future work on the BIOMIST platform will focus on application of ontologies within PLM systems for improved interoperability, reusing, and simplified data management.
Moreover, in order facilitate data exchange between the BIOMIST platform and existing neuroimaging data management systems, we plan to develop a feature to export data provenance in PROV-DM format.
GIN users’ feedback also highlighted that the eclipse-based graphical user interface of the deployed PLM system would be unsuitable to them, because of the daunting numbers of sub-windows and menus that reduce the implicit use of the system; a simplified and more adequate user interface is being developed, intended for occasional users. Due to the nature of neuroimaging research work, the relationships between database objects are complex, so the ability to navigate among data is critical. However, current PLM systems do not propose a satisfactory relation browser or viewer, and they exhibit shortcomings in terms of data visualization and analysis, all the more as complex and heterogeneous data are managed (Allanic et al., 2014). Therefore, a major concern in the upcoming work on the BIOMIST platform is to visualize data relationships, using a visual graph representation, in order to improve the browsing and the visualization of data and provenance in PLM systems.
With the current querying facilities of the BIOMIST platform, users can build and retrieve data reports for statistical analysis. One of our main goals is now to integrate more tightly analytical tools, such as deep learning algorithms on large, multimodal heteregeneous data. The objective is to be able to extract knowledge after analyzing correlations between inter individual variables (age, gender, education, handedness, etc.) and brain structures, in order to provide additional information for a better understanding of brain organization and its mechanisms and also to be able to make predictive assumptions about some neurological pathologies.
Author Contributions
All the authors participated to the redaction of the paper. They are members of the BIOMIST project consortium, directed by PB (principal investigator), NM, BE, and MJ. MA worked on Sections “The BMI-LM Data Model to Manage Data and Provenance,” “The DIMP Method for Integration of Processing Pipelines,” “Implementation,” and “Application.” P-YH worked on Sections “Mapping Strategy for Data Import,” “The DIMP Method for Integration of Processing Pipelines,” “Implementation,” and “Application”; C-CP worked on Sections “Querying Strategies” and “Implementation”; ML worked on Sections “Querying Strategies” and “Implementation”; AD worked on Sections “The BMI-LM Data Model to Manage Data and Provenance,” “Querying Strategies,” and “Implementation”; TB worked on Sections “Mapping Strategy for Data Import,” “The DIMP Method for Integration of Processing Pipelines,” “Querying Strategies,” “Implementation,” and “Application”; AG worked on Sections “Mapping Strategy for Data Import,” “The DIMP Method for Integration of Processing Pipelines,” and “Implementation.”
Conflict of Interest Statement
CADESIS company is distributor of two PLM solutions: Teamcenter published by Siemens Industries Software and Windchill published by PTC.
Acknowledgments
The authors would like to thank Nicolas Boulic, Jérôme Cornet, and Olivier Menuel from Cadesis, and Christophe Delalande from the GIN, who supported technically their work.
Funding
The work presented in the paper was supported by the Agence Nationale de la Recherche (ANR) founded BIOMIST (no. ANR-13-CORD-0007) and Ginesis-Lab project (no. ANR16-LCV2-0006-01). This study also benefited from ABACI, a project supported by a public grant from ANR in the context of the Investments for the Future Program, referenced ANR-10-LABX-57 and named TRAIL.
Supplementary Material
The Supplementary Material for this article can be found online at http://journal.frontiersin.org/article/10.3389/fict.2016.00035/full#supplementary-material.
Footnotes
References
Abraham, A., Pedregosa, F., Eickenberg, M., Gervais, P., Mueller, A., Kossaifi, J., et al. (2014). Machine learning for neuroimaging with scikit-learn. Front. Neuroinformatics 8:14. doi:10.3389/fninf.2014.00014
Adamson, C. L., and Wood, A. G. (2010). DFBIdb: a software package for neuroimaging data management. Neuroinformatics 8, 273–284. doi:10.1007/s12021-010-9080-z
Allanic, M., Durupt, A., Eynard, B., Joliot, M., Brial, T., and Boutinaud, P. (2014). “Towards an enhancement of relationships browsing in mature PLM systems,” in IFIP International Conference on Product Lifecycle Management (Berlin Heidelberg: Springer), 345–354. Available at http://www.scopus.com/inward/record.url?eid=2-s2.0-84919388938&partnerID=tZOtx3y1
Allanic, M., Pierre-Yves, H., Alexandre, D., Marc, J., Philippe, B., and Eynard, B. (2017). PLM as a strategy for the management of heterogeneous information in bio-medical imaging field. Int. J. Info. Technol. Manag. 16, 1. doi:10.1504/IJITM.2017.080950
Ashish, N., Ambite, J. L., Muslea, M., and Turner, J. A. (2010). Neuroscience Data integration through mediation: an (F)BIRN case study. Front. Neuroinformatics 4:118. doi:10.3389/fninf.2010.00118
Assouroko, I., Ducellier, G., Eynard, B., and Boutinaud, P. (2012). “Semantic relationship knowledge management and reuse in collaborative product development,” in 9th International Conference on Product Lifecycle Management (Québec: Springer), 13.
Barillot, C., Bannier, E., Commowick, O., Corouge, I., Baire, A., Fakhfakh, I., et al. (2016). Shanoir: applying the software as a service distribution model to manage brain imaging research repositories. Front ICT 3, 25. doi:10.3389/fict.2016.00025
Book, G. A., Anderson, B. M., Stevens, M. C., Glahn, D. C., Assaf, M., and Pearlson, G. D. (2013). Neuroinformatics database (NiDB) – a modular, portable database for the storage, analysis, and sharing of neuroimaging data. Neuroinformatics 11, 495–505. doi:10.1007/s12021-013-9194-1
Buckler, A. J., Liu, T. T., Savig, E., Suzek, B. E., Rubin, D. L., and Paik, D. (2013). Quantitative imaging biomarker ontology (QIBO) for knowledge representation of biomedical imaging biomarkers. J. Digit. Imaging 26, 630–641. doi:10.1007/s10278-013-9599-2
CIMdata. (2010). Teamcenter “Unified” – Siemens PLM Software’s Next Generation PLM Platform White Paper. Ann Arbor: CIMdata.
Cox, R. W. (1996). AFNI: software for analysis and visualization of functional magnetic resonance neuroimages. Comput. Biomed. Res. 29, 162–173. doi:10.1006/cbmr.1996.0014
Crawford, K. L., Neu, S. C., and Toga, A. W. (2016). The image and data archive at the laboratory of neuro imaging. Neuroimage 124(Pt B), 1080–1083. doi:10.1016/j.neuroimage.2015.04.067
Das, S., Zijdenbos, A. P., Harlap, J., Vins, D., and Evans, A. C. (2011). LORIS: a web-based data management system for multi-center studies. Front. Neuroinformatics 5:37. doi:10.3389/fninf.2011.00037
Das, S., Zijdenbos, A. P., Harlap, J., Vins, D., and Evans, A. C. (2012). LORIS: a web-based data management system for multi-center studies. Front. Neuroinformatics 5:37. doi:10.3389/fninf.2011.00037
Delamillieure, P., Doucet, G., Mazoyer, B., Turbelin, M. R., Delcroix, N., Mellet, E., et al. (2010). The resting state questionnaire: an introspective questionnaire for evaluation of inner experience during the conscious resting state. Brain Res. Bull. 81, 565–573. doi:10.1016/j.brainresbull.2009.11.014
Dinov, I., Lozev, K., Petrosyan, P., Liu, Z., Eggert, P., Pierce, J., et al. (2010). Neuroimaging study designs, computational analyses and data provenance using the LONI pipeline. PLoS ONE 5:e13070. doi:10.1371/journal.pone.0013070
Dojat, M., Pélégrini-Issac, M., Ahmad, F., Barillot, C., Batrancourt, B., Gaignard, A., et al. (2011). NeuroLOG: a framework for the sharing and reuse of distributed tools and data in neuroimaging. Organ Hum Brain Mapp. HBM’11, 2–5.
Fischl, B. (2012). FreeSurfer. Neuroimage2 62, 774–781. doi:10.1016/j.neuroimage.2012.01.021.FreeSurfer
Fox, P. T., Laird, A. R., Fox, S. P., Fox, P. M., Uecker, A. M., Crank, M., et al. (2005). BrainMap taxonomy of experimental design: description and evaluation. Hum. Brain Mapp. 25, 185–198. doi:10.1002/hbm.20141
Fox, P. T., and Lancaster, J. L. (2002). Mapping context and content: the BrainMap model. Nat. Rev. Neurosci. 3, 319–321. doi:10.1038/nrn789
Gerhard, S., Daducci, A., Lemkaddem, A., Meuli, R., Thiran, J.-P., and Hagmann, P. (2011). The connectome viewer toolkit: an open source framework to manage, analyze, and visualize connectomes. Front. Neuroinformatics 5:3. doi:10.3389/fninf.2011.00003
Gibaud, B., Kassel, G., Dojat, M., Batrancourt, B., Michel, F., Gaignard, A., et al. (2011). NeuroLOG: sharing neuroimaging data using an ontology-based federated approach. AMIA Annu. Symp. Proc. 2011, 472–480.
Goble, C., and Stevens, R. (2008). State of the nation in data integration for bioinformatics. J. Biomed. Inform. 41, 687–693. doi:10.1016/j.jbi.2008.01.008
Gorgolewski, K., Burns, C. D., Madison, C., Clark, D., Halchenko, Y. O., Waskom, M. L., et al. (2011). Nipype: a flexible, lightweight and extensible neuroimaging data processing framework in python. Front. Neuroinformatics 5:13. doi:10.3389/fninf.2011.00013
Gupta, A., Bug, W., Marenco, L., Qian, X., Condit, C., Rangarajan, A., et al. (2008). Federated access to heterogeneous information resources in the Neuroscience Information Framework (NIF). Neuroinformatics 6, 205–217. doi:10.1007/s12021-008-9033-y
Jenkinson, M., Beckmann, C. F., Behrens, T. E., Woolrich, M. W., and Smith, S. M. (2012). FSL. Neuroimage 62, 782–790. doi:10.1016/j.neuroimage.2011.09.015
Joliot, M., Delcroix, N., Zago, L., Vigneau, M., Crivello, F., Simon, G., et al. (2009). “GINdb: portable database for the storage and processing of human functional brain imaging data,” in Proceedings of the 16th Annual Meeting of the Organization for Human Brain Mapping, Barcelona, Spain.
Keator, D. B., Marcus, D., and Murphy, S. (2009). A national human neuroimaging collaboratory enabled by the biomedical informatics research network (BIRN). NIH Public Access 12, 162–172. doi:10.1109/TITB.2008.917893.A
Keator, D. B., van Erp, T. G. M., Turner, J. A., Glover, G. H., Mueller, B. A., Liu, T. T., et al. (2016). The function biomedical informatics research network data repository. Neuroimage 124(Pt B), 1074–1079. doi:10.1016/j.neuroimage.2015.09.003
Keller, T., and Tergan, S.-O. (2005). “Visualizing knowledge and information: an introduction,” in Knowledge and Information Visualization (Berlin, Heidelberg: Springer), 1–23.
Kiritsis, D., Bufardi, A., and Xirouchakis, P. (2003). Research issues on product lifecycle management and information tracking using smart embedded systems. Adv. Eng. Info. 17, 189–202. doi:10.1016/j.aei.2004.09.005
Klein, A., Andersson, J., Ardekani, B. A., Ashburner, J., Avants, B., Chiang, M., et al. (2009). Evaluation of 15 nonlinear deformation algorithms applied to human brain MRI registration. Neuroimage 46, 1–62. doi:10.1016/j.neuroimage.2008.12.037
LeCun, Y., Bengio, Y., and Hinton, G. (2015). Deep learning. Nature 521, 436–444. doi:10.1038/nature14539
Marcus, D. S., Olsen, T. R., Ramaratnam, M., and Buckner, R. L. (2007a). The extensible neuroimaging archive toolkit. Neuroinformatics 5, 11–33. doi:10.1385/NI:5:1:11
Marcus, D. S., Olsen, T. R., Ramaratnam, M., and Buckner, R. L. (2007b). The extensible neuroimaging archive toolkit and sharing neuroimaging data. Neuroinformatics 5, 11–34. doi:10.1385/NI:5:1:11
Mazoyer, B., Mellet, E., Perchey, G., Zago, L., Crivello, F., Jobard, G., et al. (2016). BIL&GIN: a neuroimaging, cognitive, behavioral, and genetic database for the study of human brain lateralization. Neuroimage 124, 1225–1231. doi:10.1016/j.neuroimage.2015.02.071
Mildenberger, P., Eichelberg, M., and Martin, E. (2002). Introduction to the DICOM standard. Eur. Radiol. 12, 920–927. doi:10.1007/s003300101100
Moreau, L., and Missier, P. (2013). PROV-DM: the PROV Data Model. Southampton: University of Southampton.
Pham, C. C., Durupt, A., Matta, N., and Eynard, B. (2016). “Knowledge sharing using ontology graph-based: application in PLM and bio-imaging contexts,” in Product Lifecycle Management in the Era of Internet of Things: 12th IFIP WG 5.1 International Conference, PLM 2015, October 19–21, 2015, Vol. 467 (Doha, Qatar: Springer), 238.
Poldrack, R. A., Barch, D. M., Mitchell, J. P., Wager, T. D., Wagner, A. D., Devlin, J. T., et al. (2013). Toward open sharing of task-based fMRI data: the OpenfMRI project. Front. Neuroinformatics 7:12. doi:10.3389/fninf.2013.00012
Poldrack, R. A., Kittur, A., Kalar, D., Miller, E., Seppa, C., Gil, Y., et al. (2011). The cognitive atlas: toward a knowledge foundation for cognitive neuroscience. Front. Neuroinformatics 5:17. doi:10.3389/fninf.2011.00017
Poline, J.-B., Breeze, J. L., Ghosh, S., Gorgolewski, K., Halchenko, Y. O., Hanke, M., et al. (2012). Data sharing in neuroimaging research. Front. Neuroinformatics 6:9. doi:10.3389/fninf.2012.00009
Rex, D. E., Ma, J. Q., and Toga, A. W. (2003). The LONI pipeline processing environment. Neuroimage 19, 1033–1048. doi:10.1016/S1053-8119(03)00185-X
Schwartz, Y., Barbot, A., Thyreau, B., Frouin, V., Varoquaux, G., Siram, A., et al. (2012). PyXNAT: XNAT in Python. Front. Neuroinformatics 6:12. doi:10.3389/fninf.2012.00012
Scott, A., Courtney, W., Wood, D., de la Garza, R., Lane, S., King, M., et al. (2011). COINS: an innovative informatics and neuroimaging tool suite built for large heterogeneous datasets. Front. Neuroinformatics 5:33. doi:10.3389/fninf.2011.00033
Siemens PLM Software. (2011). Teamcenter Security Management – White Paper. Plano: Siemens PLM Software.
Siemens PLM Software. (2015b). Teamcenter v10.6.1 System Administration. Plano: Siemens PLM Software.
Signore, R., Stegman, M. O., and Creamer, J. (1995). The ODBC solution: Open database connectivity in distributed environments. New York, NY: McGraw-Hill, Inc.
Simmhan, Y. L., Plale, B., and Gannon, D. (2005). A survey of data provenance techniques technical report IUB-CS-TR618. Science 47405, 1–25. doi:10.1145/1084805.1084812
Sriti, M. F., and Boutinaud, P. (2012). “PLMXQuery: towards a standard PLM querying approach,” in IFIP Advances in Information and Communication Technology (Berlin, Heidelberg: Springer), 379–388.
Studer, R., Benjamins, V. R., and Fensel, D. (1998). Knowledge engineering: principles and methods. Data Knowl. Eng. 25, 161–197. doi:10.1016/S0169-023X(97)00056-6
Temal, L., Dojat, M., Kassel, G., and Gibaud, B. (2008). Towards an ontology for sharing medical images and regions of interest in neuroimaging. J. Biomed. Inform. 41, 766–778. doi:10.1016/j.jbi.2008.03.002
Terzi, S., Bouras, A., Dutta, D., Garetti, M., and Kiritsis, D. (2010). Product lifecycle management – from its history to its new role. Int. J. Prod. Lifecycle Manag. 4, 360–389. doi:10.1504/IJPLM.2010.036489
Turner, J. A., and Laird, A. R. (2012). The cognitive paradigm ontology: design and application. Neuroinformatics 10, 57–66. doi:10.1007/s12021-011-9126-x
Van Horn, J. D., Grethe, J. S., Kostelec, P., Woodward, J. B., Aslam, J. A., Rus, D., et al. (2001). The Functional magnetic resonance imaging data center (fMRIDC): the challenges and rewards of large-scale databasing of neuroimaging studies. Philos. Trans. R. Soc. Lond. B Biol. Sci. 356, 1323–1339. doi:10.1098/rstb.2001.0916
Keywords: data management, neuroscience, neuroimaging, provenance, product lifecycle management, workflow
Citation: Allanic M, Hervé P-Y, Pham C-C, Lekkal M, Durupt A, Brial T, Grioche A, Matta N, Boutinaud P, Eynard B and Joliot M (2017) BIOMIST: A Platform for Biomedical Data Lifecycle Management of Neuroimaging Cohorts. Front. ICT 3:35. doi: 10.3389/fict.2016.00035
Received: 01 September 2016; Accepted: 22 December 2016;
Published: 30 January 2017
Edited by:
Michel Dojat, INSERM, FranceReviewed by:
Alex Pappachen James, Nazarbayev University, KazakhstanCamille Maumet, University of Warwick, UK
Copyright: © 2017 Allanic, Hervé, Pham, Lekkal, Durupt, Brial, Grioche, Matta, Boutinaud, Eynard and Joliot. This is an open-access article distributed under the terms of the Creative Commons Attribution License (CC BY). The use, distribution or reproduction in other forums is permitted, provided the original author(s) or licensor are credited and that the original publication in this journal is cited, in accordance with accepted academic practice. No use, distribution or reproduction is permitted which does not comply with these terms.
*Correspondence: Marc Joliot, bWFyYy5qb2xpb3RAdS1ib3JkZWF1eC5mcg==