Sources and sinks of N2O in the subtropical Jiulong River Estuary, Southeast China
 Yuhong Li
 Yang Luo*
  Wangwang Ye
 Jiexia Zhang
 Liyang Zhan
- Third Institute of Oceanography (TIO), Ministry of Natural Resources (MNR), Xiamen, China
Nitrous oxide (N2O) is one of the most important greenhouse gases and contributes to the depletion of ozone in the stratosphere. Estuaries are areas of intensive biological production and associated N2O emissions through both denitrification and nitrification processes. The spatial and temporal variations of N2O in the Jiulong River Estuary, a subtropical estuary, were explored to evaluate sources and sinks of N2O in this area. The estuary was found to be a strong source of N2O, its saturation in the surface water ranged from 113 to 2926% relative to the ambient atmospheric concentrations, showing great temporal and spatial variations and was influenced by multiple factors such as the concentration of dissolved inorganic nitrogen (DIN, i.e., ,, and ), salinity and dissolved oxygen. N2O concentrations were at a high level in upper estuary but reduced to the lower parts of the estuary. Groundwater input could be another contributor to N2O in the estuary. Almost all N2O within the estuary was released into the atmosphere rather than being transported to the bay. The N2O flux in the estuary (mean 597 μmol/m2/d) was at the higher end of the range observed in estuaries worldwide due to the very high DIN loads in the Jiulong River Estuary. Our data indicate that the N2O saturation in the estuary continues to increase, although the DIN inputs began to decline in 2011, which might be relate to the improved environmental conditions with increased oxygen concentrations. N2O production pathways have changed from predominantly denitrification in the past toward significant production from nitrification in the present. Further investigation is needed to better understand the behavior of N2O in the Jiulong River Estuary.
1 Introduction
Nitrous oxide (N2O) is a powerful, long-lived (114-year lifespan) greenhouse gas and a depletor to ozone destruction in the stratosphere (Stocker et al., 2013). The atmospheric concentration of N2O has increased at a rate of approximately 2 percent per decade from 270 parts per billion (ppb) in 1750 to 335 ppb at present (Lan et al., 2022), which is largely attributed to the incomplete processing of nitrogen from anthropogenic sources (e.g., sewage release, agricultural fertilization, and industrial waste discharge) (Smith et al., 1997). Estuaries are important regions of nitrogen cycling and are affected by intensive nutrient loading from human activity, especially in agricultural and urban regions (Borges et al., 2018; Vilmin et al., 2018). The major threat of growing nitrogen loading is elevated N2O production and emission in the estuary (Borges et al., 2018; Wells et al., 2018; Reading et al., 2020). Tidal circulation leads to a longer turnover time of nitrogen in the estuary compared with that in the river as well as open ocean. As a consequence, estuaries account for only approximately 0.4% of the global ocean area, but they represent approximately 33% of the oceanic N2O emissions (Bange et al., 1996). However, these estimates have large uncertainty because of the high spatiotemporal variability of N2O emissions as well as the restricted data availability, particularly considering long-term monitoring under the management of municipal and industrial sewage and an overall improvement in pollution. Yang et al. (2020) reconstructed and reduced the uncertainty of global oceanic N2O emissions and revealed vigorous seasonal cycles, but subtler spatial and temporal variations were neglected in specific regions. Bange et al. (2019) also proposed facilitating the detection of seasonal and interannual variability of N2O in the future as a requirement of the Nitrous Oxide Ocean Observation Network (N2O–ON). Thus, it is imperative to conduct more comprehensive research to improve the accuracy of estimation both globally and regionally.
The Jiulong River and its estuary, have become eutrophic because of growing nitrogen loading induced by diverse anthropogenic factors, as well as human activities (such as crop cultivation, animal husbandry, and dam building) in the watershed, which has significantly changed both the nitrogen budget and riverine export to the estuary (Chen N. et al., 2015). Fortunately, effective management has been adopted (including updated wastewater treatment plants, reformed pig farming and dredging the channel), the concentration of dissolved inorganic nitrogen (DIN) has started to decrease, and the dissolved oxygen (DO) concentration has begun to increase in recent years (Cai et al., 2016; Wu et al., 2017).
In an earlier study from 2009, Zhan et al. (2011) found N2O emissions ranging from 3 to 94 μmol/m2/d in the Jiulong River Estuary, roughly equal to the values from a follow-up study by Wu et al. (2013) in 2010–2011 (5–98 μmol/m2/d), and then emissions of N2O increased up to 168 μmol/m2/d in 2013-2014. (Chen J. et al., 2015). Here, we conducted a study to investigate the N2O distribution in the Jiulong River Estuary. The ultimate objectives of our study were (1) to discuss the factors that influence the distribution of N2O along the Jiulong River Estuary; (2) to estimate the sources and sinks of N2O in the estuary; and (3) to evaluate the trend of N2O in recent decades. This study also provides insights into how human activities affect the N2O from the eutrophic Jiulong River Estuary.
2 Method and materials
2.1 Field work and analysis
2.1.1 Study area
The Jiulong River, which has two main tributaries and an average annual freshwater discharge of 1.47 × 10¹⁰ m3, is the second-largest river in Fujian Province, Southeast China (Zhang, 1996). The estuary has a gross drainage basin area of 14,741 km2 and can be defined as one shallow subtropical estuary featuring high turbidity in the low salinity zone (Chen et al., 2018). Annual precipitation falls within the range of 1400 - 1800 mm, 70% of which occurs in April and September. This area is also affected by intense typhoons (1.35 per year), mainly between July and September (Chen et al., 2018). The Jiulong River Estuary belongs to a semi enclosed macrotidal estuary, which has a mean elevation of 3.9 m and a maximum tidal range of 6.4 m. Its tidal current speed reaches up to >2 m/s (Luo et al., 2008). Based on water and salt budgets, it is assumed that the average residence time of water mass in this estuary lasts 2 or 3 days at the annual scale (Cao et al., 2005).
2.1.2 Field work
We divided the estuary into 3 zones according to geography, following the practice of Yan et al. (2012) (Figure 1). Six cruises were conducted along the salinity gradient of the main channel in the Jiulong River Estuary in September, November, and December 2017 and May, July, and August 2018 (Table 1). Each campaign was initiated from the lower reaches upward around early flood tide, and took ~2 h to complete. Groundwater surface samples were collected from 13 wells along the coast of the Jiulong River Estuary in September 2020. The wells had different depths of approximately 5 to 15 m, and were situated along the north and south banks of the Jiulong River Estuary. The sample locations are presented in Figure 1.
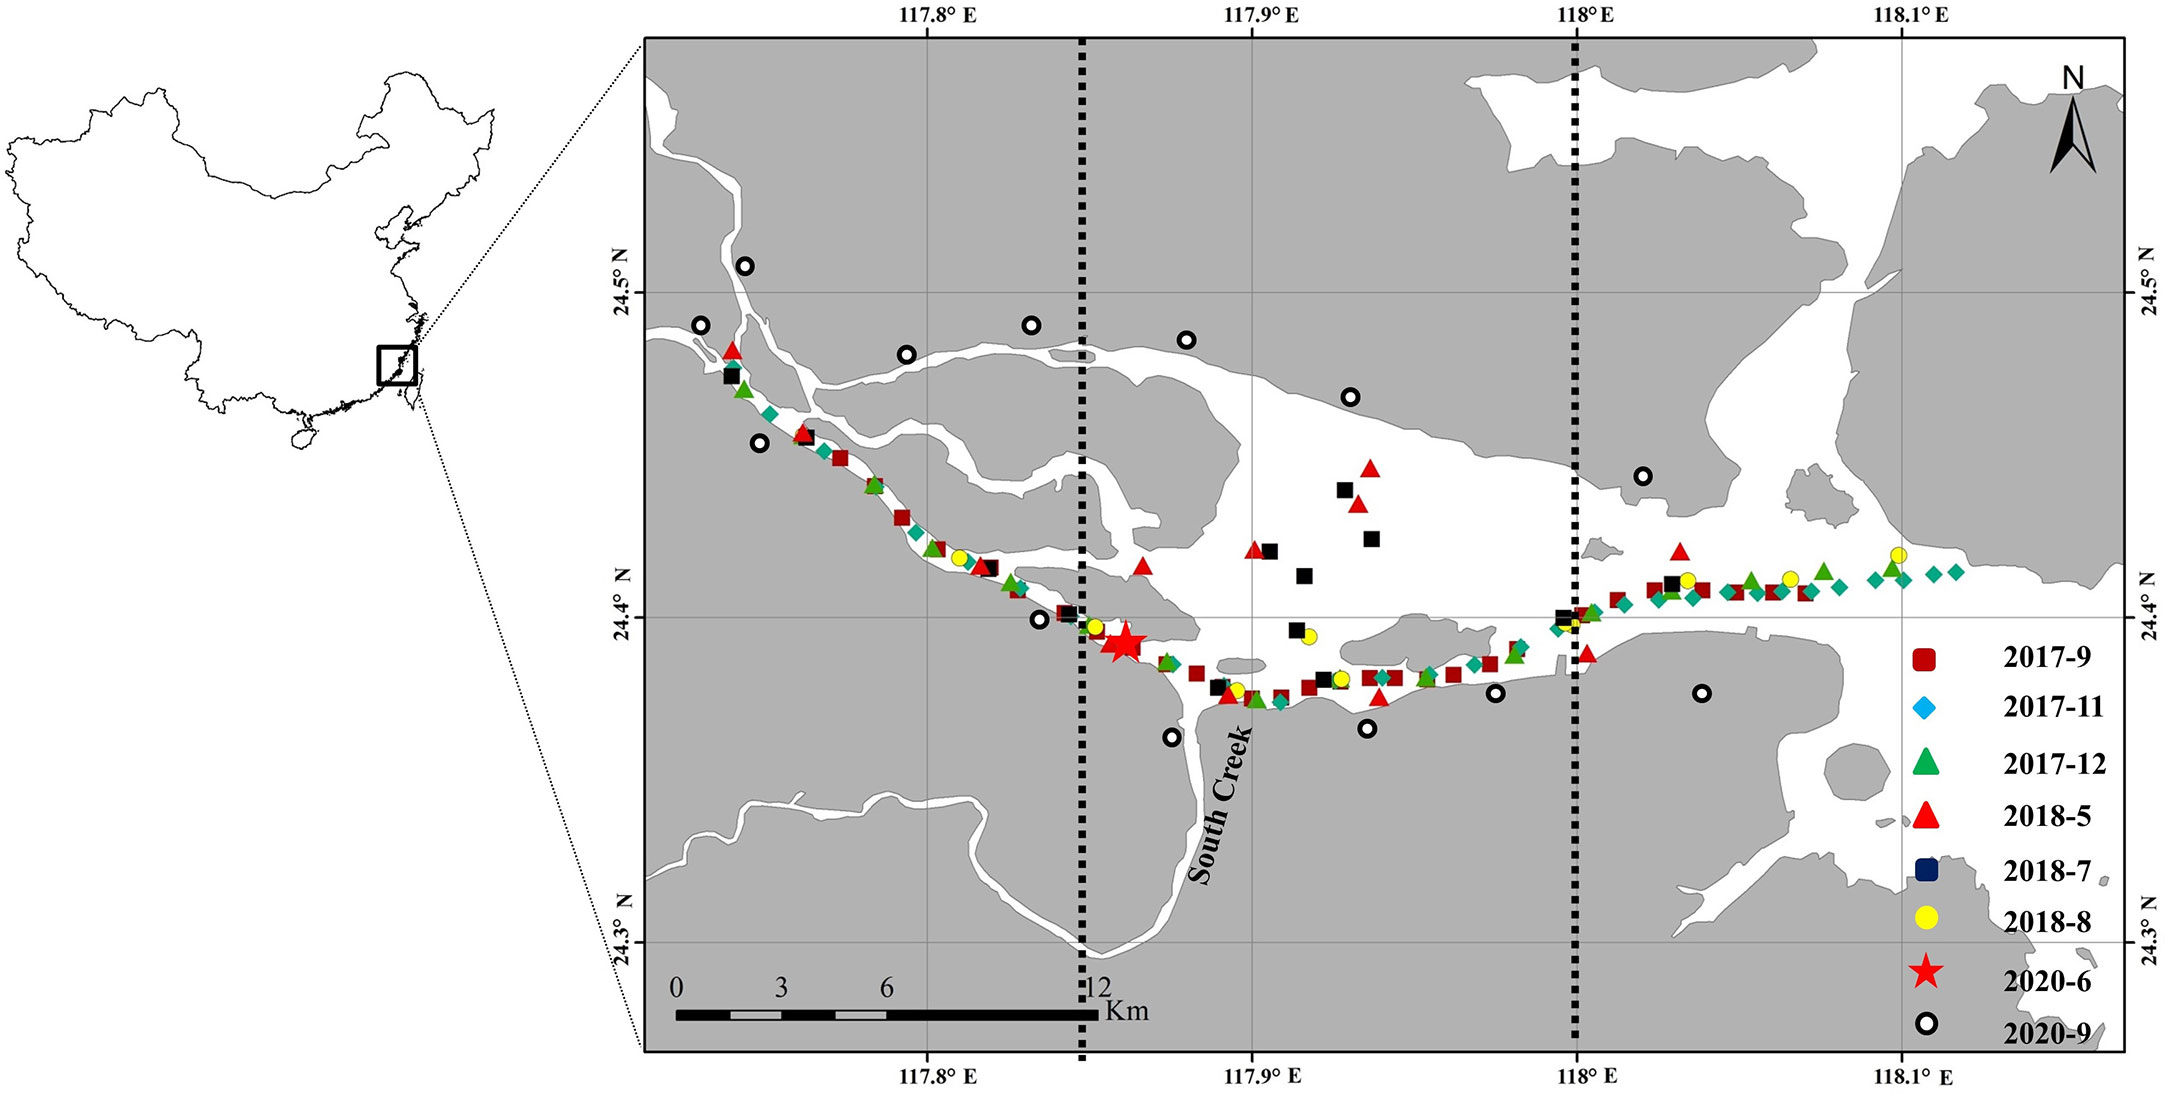
Figure 1 Map of the Jiulong River Estuary at sampling sites in 2017–2020. The star symbol represents the incubation site, and the black circles are the groundwater sampling locations. The research divided the estuary into 3 districts refer to previous study (Yan et al., 2012; Li et al., 2021), indicated by dashed vertical lines: upper reaches; middle reaches; as well as lower reaches.
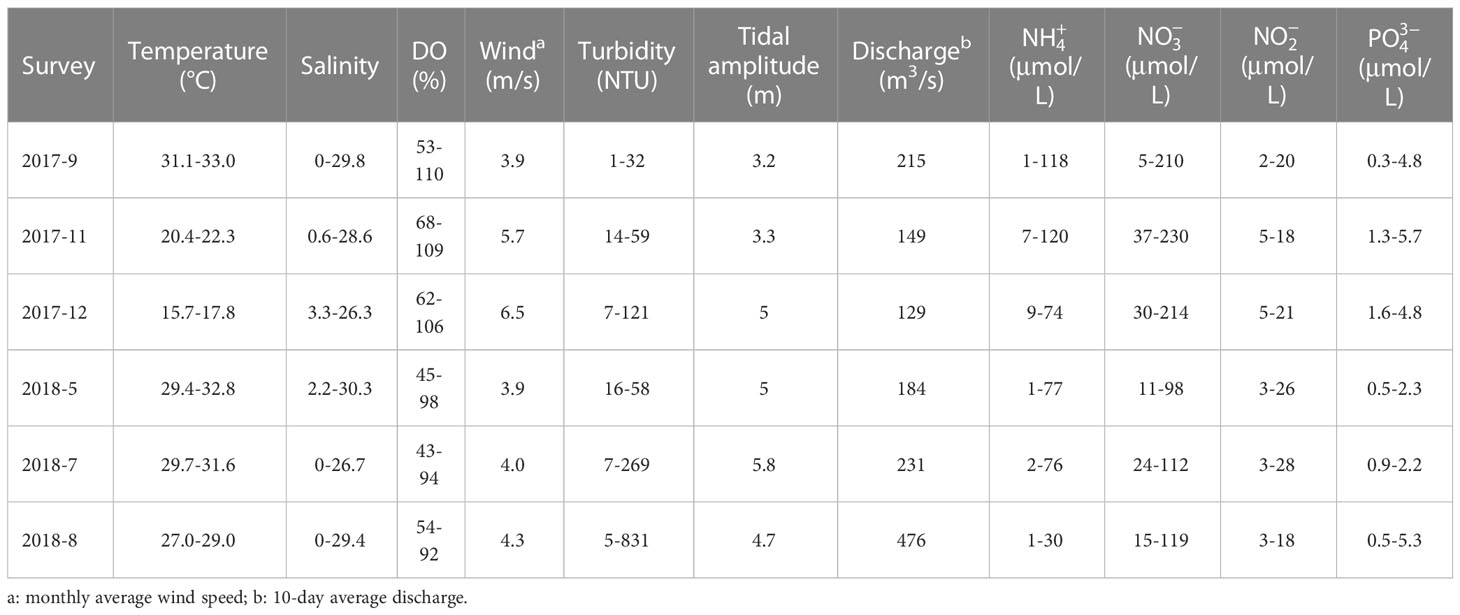
Table 1 Comparisons of temperature, salinity, wind speed, turbidity, tidal amplitude, tidal current velocity at the surface, and discharge in each campaign.
During every cruise, surface water samples were gathered, and bottom waters were sampled during the 3 surveys in 2018 using a 5-L polymethyl methacrylate bottle. Samples for N2O determination were added to the bottom of a 250-mL BOD (biochemical oxygen demand) bottle gravitationally equipped with a ground glass stoppered flask, and 2 times the volume of the bottle was overflowed to avoid bubbles. After, 150 μL saturated HgCl2 solution was added to inhibit microbial activity, the ground stopper was greased, plunged and fixed immediately. These waters were transported in the dark to the laboratory and analyzed within 2 weeks of the cruise. Temperature, salinity, N2O, turbidity, nitrate, nitrite, ammonium as well as phosphate were measured for all estuary water samples and groundwater samples.
2.1.3 Analysis of N2O
A static headspace gas chromatography (GC) method was developed for sample analysis (Zhan et al., 2013), 3 subsamples were transferred into 20 mL headspace vials. In each headspace vial, 12 mL of sample was replaced with high-purity nitrogen to create a headspace (Zhan et al., 2013). Control standards were produced following equilibrating gas standards using standard water with identical headspace preparation technique (Zhan et al., 2013). N2O standard gases (100, 400, 700, 1500, and 4000 ppb N2O) were produced at National Institute of Metrology, China. The subsamples were agitated in a CTC autosampler for 10 min to achieve equilibrium, and the headspace gas was analyzed using an Agilent 7890A equipped and electron capture detector (ECD). Both the precision and accuracy of this method were ~ 2%.
2.1.4 Ancillary measurements
The hydrographic parameters of temperature (± 0.1°C) and salinity (± 0.1) were measured with a WTW Cond 3110, and dissolved oxygen (± 0.01 mg/L) was measured using a HACH HQ 30d probe. Nutrient samples were filtered using glass fiber film (0.45 μm) and frozen stored (−20°C) for follow-up laboratory measurements. Dissolved nitrate, nitrite, ammonium as well as phosphate concentrations were determined using a continuous flow autoanalyzer (AA3, Bran+Luebbe Co., Germany) using colorimetric techniques (Yan et al., 2012). The detection limits for nitrite, nitrate and ammonium were 0.04, 0.1 and 0.5 μmol/L, separately. Samples containing high concentrations of nutrients were diluted as necessary. Nutrients data in 2017 (3 cruises) were obtained from Li et al. (2021).
2.2 Calculation of N2O emissions
N2O fluxes from the sea surface to the atmosphere were calculated to be the difference between measured N2O (Cmea) concentration and computed N2O equilibrium concentration with the equation as below:
where F suggests the flux of N2O (μmol/m2/d); and Ceq denotes the air-equilibrated seawater N2O concentration, which can be computed for in situ temperatures and salinities based on solubility data (Weiss and Price, 1980). N2O in the atmosphere had not been observed by the surveys. In this study, global mean atmospheric N2O mixing ratios of 330 ppb in 2017 and 331 ppb in 2018 from NOAA/ESRL (http://www.esrl.noaa.gov/gmd) were employed in the calculations. k (cm/h) suggests the gas transfer velocity, often indicated by the function of wind speed and Schmidt number (Sc). Sc is the Schmidt number of N2O that can be computed according to the equation from Wanninkhof (2014). For shallow and tidal estuaries, turbulence arising from the friction between bottom flow and side topography also contributes to water turbulence (Raymond and Cole, 2001; Gwenaël Zappa et al., 2003; Abril et al., 2004). The model developed by Raymond and Cole, 2001 was selected in this study due to its median value and because it has been widely used in other researches (Li et al., 2021). In this study, the gas transfer velocity was computed using monthly average wind speeds (10-m height, Table 1) obtained from the Xiamen airport (14 km from the estuary) documented by Weather Underground (https://www.wunderground.com).
2.3 Calculation of N2O budget
The budget of N2O at the estuary involves import and export mechanisms that include riverine inputs, groundwater inputs, in situ production and consumption, water-air exchange and export to the bay. To look at the N2O budget and distinguish unidentified N2O sources or sinks in the estuary, we used the modeling framework of Eyre et al. (2016) and Chen et al. (2022), the input of N2O should be equal to the output of N2O in the estuary, and it could be assessed with the equation as below:
where X is the unidentified N2O source or sink in the estuary, S is the sediment-water N2O effluxes, W is the water column of N2O production or consumption, R is the river input, G is the groundwater input, B is the loss of N2O because of transport to the bay, E refers to the loss of N2O caused by sea-to-air emissions, and the ± sign indicates the gain or loss of N2O of the estuary (+ means gain/production, - means loss/consumption). Incubation for water column (W) and sediments (S) are not carried out in this study, which needed to better interpret the mechanisms of production of N2O in the Jiulong River Estuary with further work.
2.4 Statistical analysis
Tests for the normality and homogeneity of the data were carried out with the Shapiro–Wilk test and Levene’s test. As the data failed to satisfy the assumptions of normality and homogeneity, we used the nonparametric Wilcoxon test to compare the average values between surface and bottom waters with paired samples, and Kruskal-Wallis test for seasonal and longitudinal differences with independent samples. Before the principal component analysis (PCA) calculation, a correlation matrix presenting the correlations was performed with the Spearman coefficient analysis with the same variables. All statistical tests and PCA steps were performed with SPSS (Statistics 23, IBM).
3 Results
3.1 Hydrochemistry
During the sampling period, water discharge was highest in August and lowest in December, a certain degree of interannual and seasonal variability was revealed compared to the long-term (1961– 2006) pattern of seasonal variation (Huang, 2008) (Figure 2). Table 1 and Figure S1 show the principal physicochemical properties of surface water from the Jiulong River Estuary in the 6 survey cruises. The lowest water temperature was 16.3°C in December, and the highest reached 31.9°C in September (Figure S1A). An obvious salinity gradient was seen across the estuary (Figure S1B), and a dramatic fall of salinity could be seen upstream. For middle reaches, the lowest salinity range (0–9.5) was in August and September (flood period), when the survey was after heavy rain and the river had the largest discharge of all the surveys, the salinity range increased to 9.5–22.5 in May (dry season), low discharge and large tidal amplitude (5.8 m) during the sampling day.
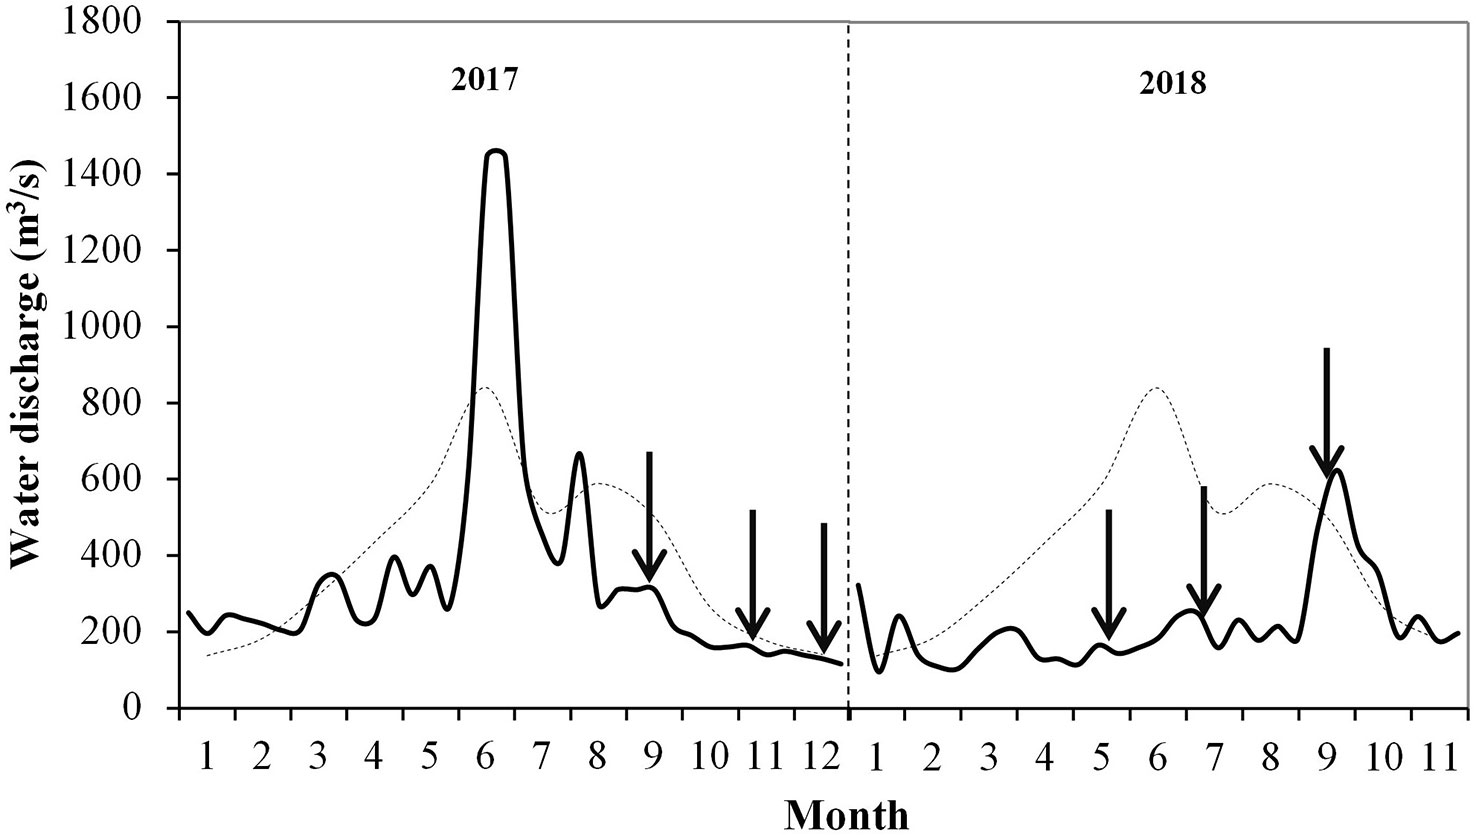
Figure 2 Interannual and monthly dynamics in water discharge of the Jiulong River. Dashed line presents long-run mean water discharge in 1961–2006 (Huang, 2008), while the solid curve indicates the water discharge between 2017 and 2018. Arrows show the sampling dates of the estuary.
Saturation of dissolved oxygen (DO) augmented progressively along with the salinity gradient except in August (Figure S1D) and varied from being mildly undersaturated to slightly supersaturated (43–119%). In the lower reaches, mixing with seawater, which was rich in oxygen, also exerted great effects on the verified growing DO content, and no noticeable discrepancy was revealed between surveys (p>0.05, Kruskal-Wallis test). Generally, nutrients levels decreased from upper reaches to lower reaches in the estuary. The upper reaches were characterized by high nutrient levels (Figure S1D–F), which was the outcome of riverine input. In the lower reaches, the lowest level of nutrients occurred subject to relatively less eutrophic coastal seawater. Nitrate presented high concentrations (mean: 87 μmol/L) and seemed dominant, standing for ~ 65% of the total DIN (mean: 134 μmol/L); in contrast, nitrite concentrations reached as ~ 8% (mean: 11 μmol/L). Notably, a storm-caused flood took place prior to the August survey, during which the runoff was 2 times that of July. The fresh water from upstream areas seemed to significantly affect the nutrients in the estuary, presenting different patterns compared to other surveys.
3.2 Spatial and seasonal variations in N2O concentration and saturation
N2O concentrations in water surface and bottom along the Jiulong River Estuary are plotted against longitude (a) and salinity (b) in Figure 3 and displayed significant spatial and temporal variability, between 11 and 185 nmol/L, corresponding to the saturation within 113–2926%. Therefore, the Jiulong River Estuary was a net source of atmospheric N2O. Generally, N2O exhibited a high level in the upper reaches, but decreased in lower reaches in overall seasons. During the surveys in August and September (flood period), the maximum values were located in the middle reaches (Figure 3A), which might result from the discharge from South Creek (Figure 1, it was hard to reach because of the shallow water depth). During flood period, floodwater carrying N2O from the upstream areas of South Creek could be another contributor to the Jiulong River Estuary N2O budget.
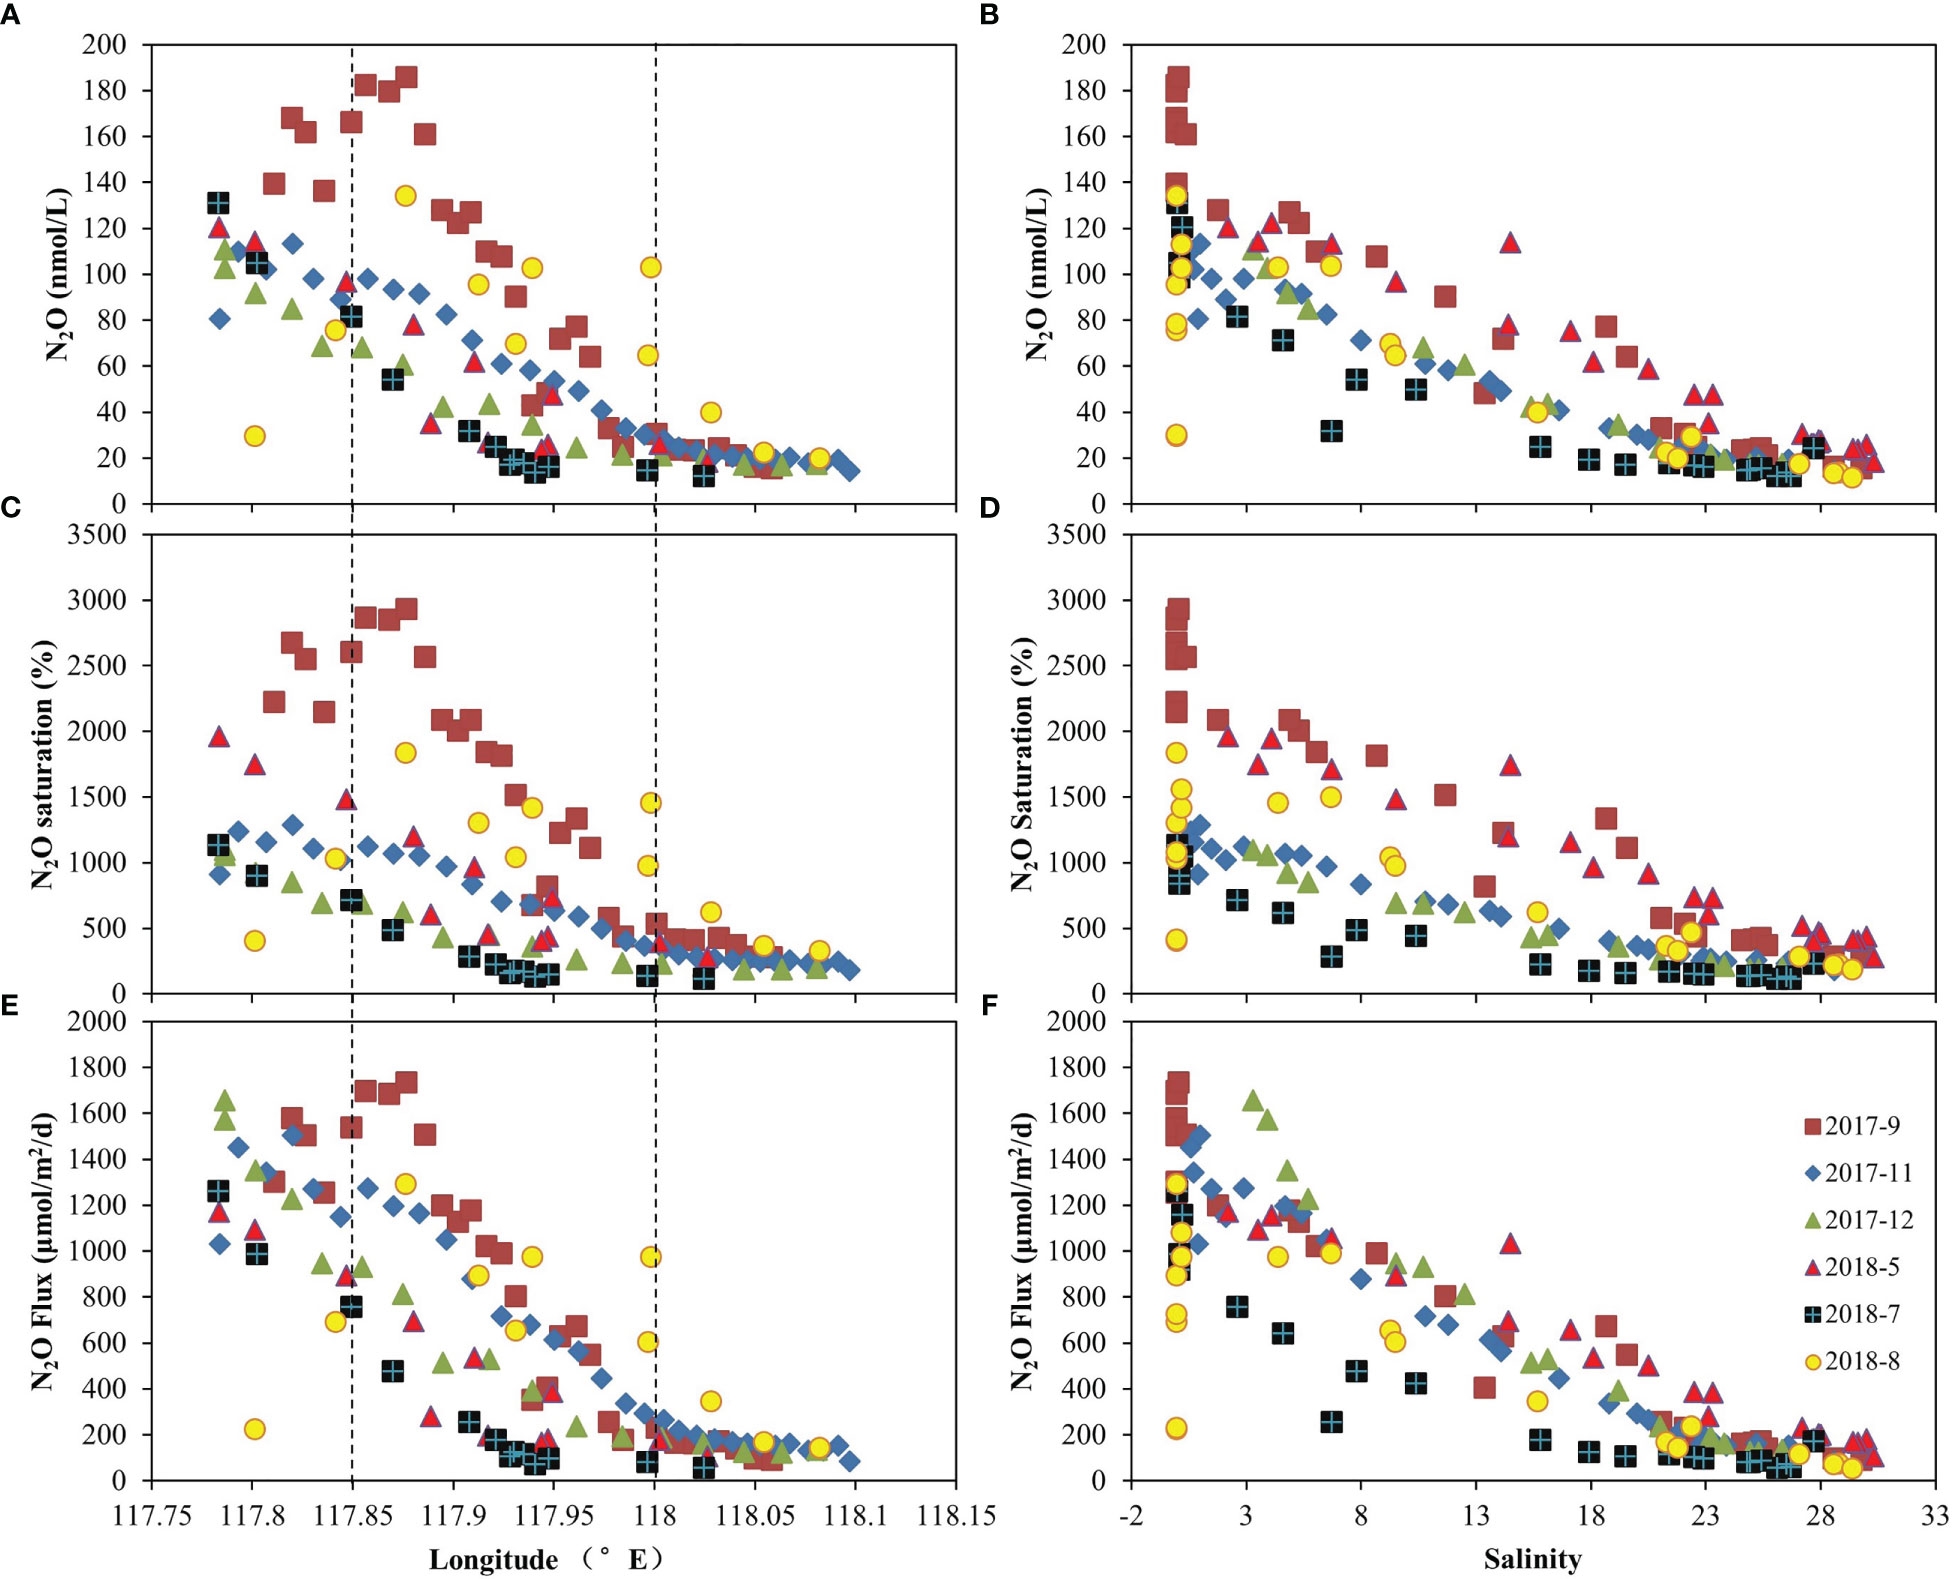
Figure 3 N2O concentration, saturation and fluxes vs longitude (A, C, E) and salinity (B, D, F) in the Jiulong River Estuary. The dashed lines resemble those of Figure 1.
We also tested the differences of N2O concentrations in different conditions of discharge and tidal amplitude. If the discharge was<200 m3/s, the sampling campaign conditions were considered representative of the dry season (November-2017, December-2017 and May-2018), and if the discharge was >200 m3/s, the sampling campaigns were considered representative of the flood period (September-2017, July-2018 and August-2018). If the tidal amplitude< 5 m, the campaigns were considered during neap tide, if the tidal amplitude was >5 m, the campaigns were considered during spring tide. The differences for N2O concentrations were not significant between dry and flood conditions, as well as between neap and spring tides (p > 0.05, Kruskal-Wallis Test).
Table 2 presents a comparison of N2O, temperature, salinity, DO, DIN, and turbidity between the surface and bottom waters in 3 cruises in 2018. The mean turbidity value of the bottom water seemed higher than the values of surface water. However, the differences in all these parameters between the surface and bottom waters were not significant (p>0.05, Wilcoxon Test).
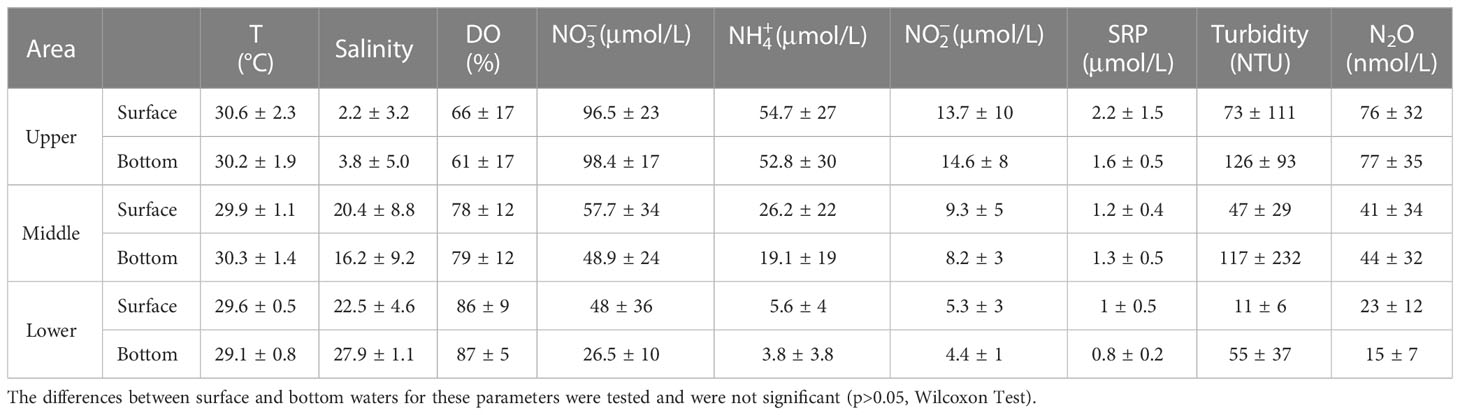
Table 2 Comparison of the temperature, salinity, DO, DIN, turbidity, and N2O between the surface and bottom waters from 3 zones in the Jiulong River Estuary in 3 cruises in 2018.
Figure S2 and Table S1 show the seasonal variation in N2O concentration using the Kruskal-Wallis Test, which reached the maximum generally in September and the minimum in July, the differences among these 2 campaigns were significant. For longitudinal differences, significant differences of N2O values among surveys could be found in the upper and middle reaches, however, in lower reaches, variation of N2O concentrations showed not pronounced.
Results of the principal component analysis (PCA) are shown in Figure 4. Factors 1 and 2 together explain for about 73% of the data variance. Factor 1 is dominated by DIN (, , and ) and N2O in one hand and by salinity and DO on the other hand. Factor 2 shows the influence of wind and temperature, as well as the tides and discharge. The PCA and correlation matrix (Table 3) consistently reveal that the controlling processes over N2O concentrations. N2O were shown to be strongly positively correlated with DIN (, , and ) and strongly inversely correlated with salinity and DO.
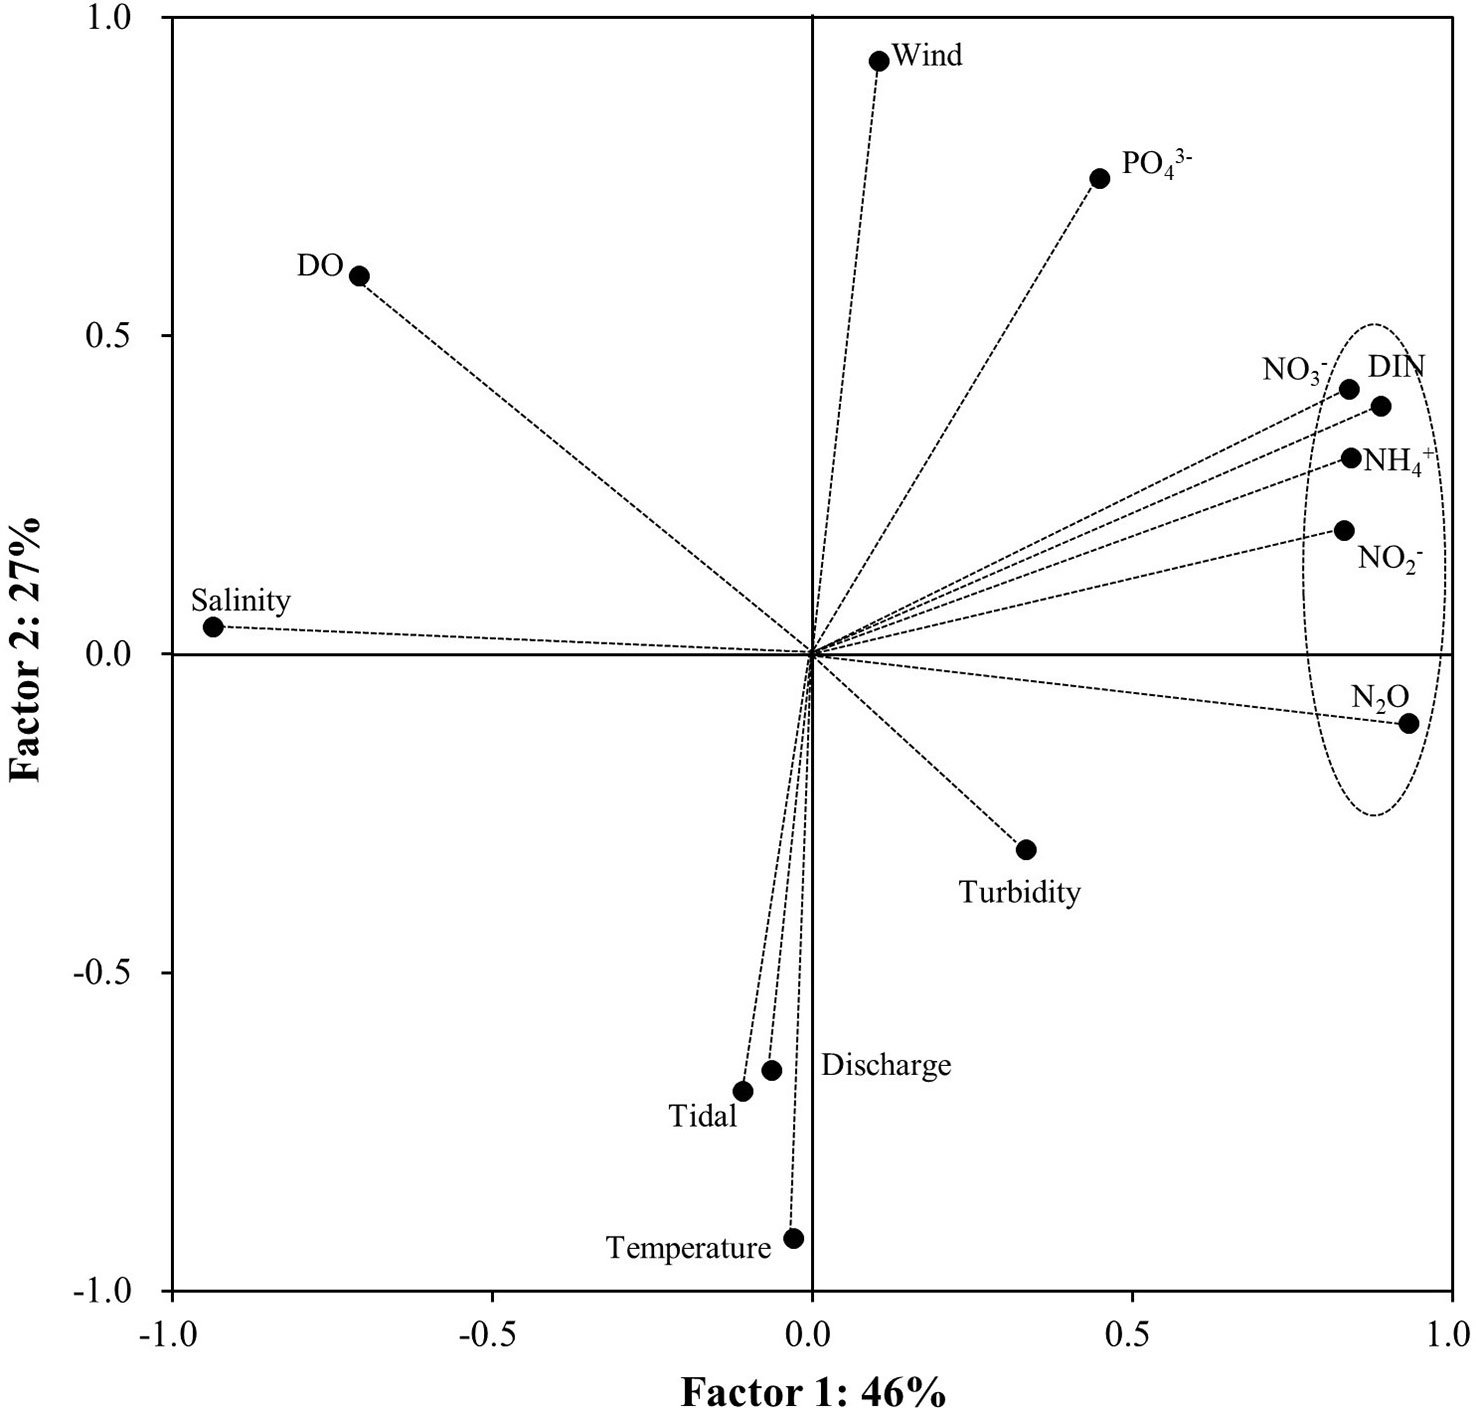
Figure 4 Bi-dimensional plot of factor 1 and factor 2 for all data sets obtained by principal component analysis (PCA).
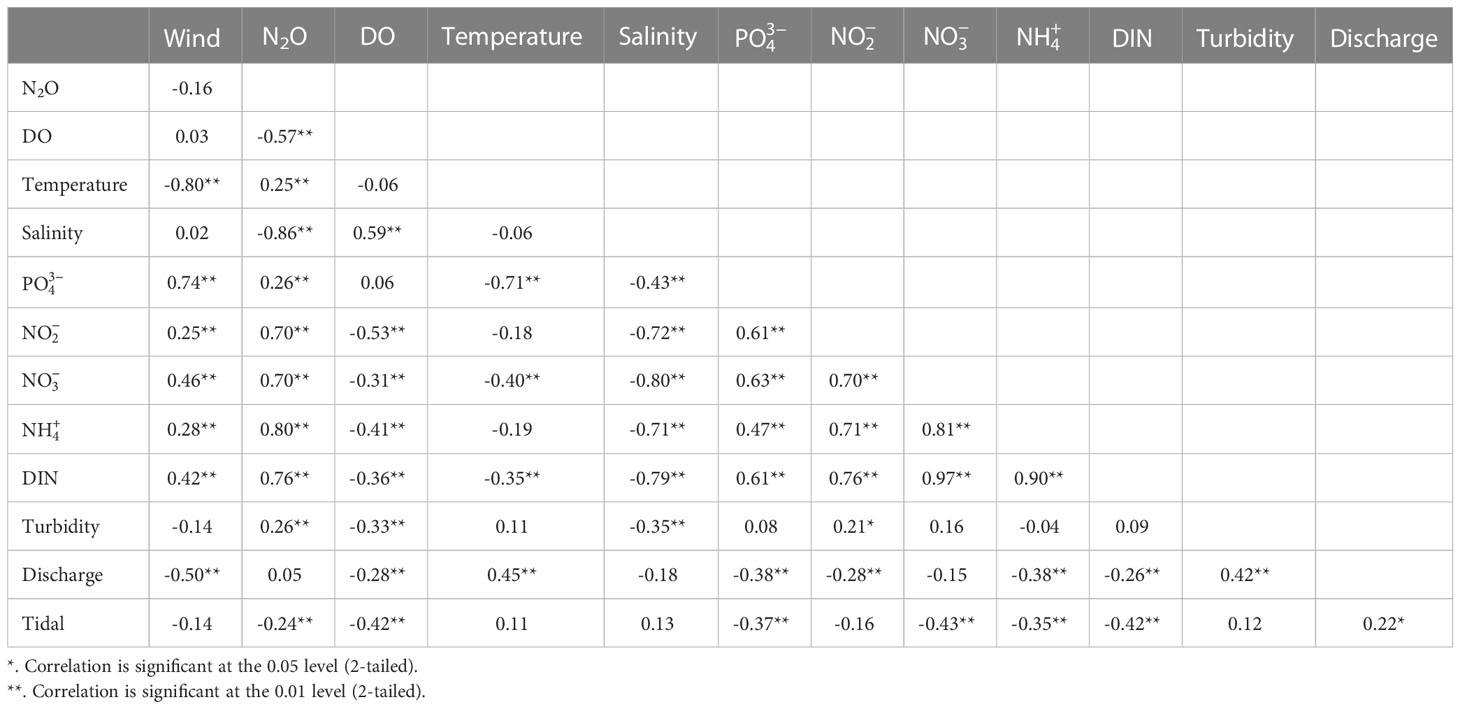
Table 3 Spearman correlation matrix for N2O, temperature, salinity, dissolved oxygen (DO; %sat), SRP, , , turbidity and wind in the Jiulong River Estuary.
The measured N2O concentrations in the groundwater showed high spatial variability, ranging from 6 to 301 nmol/L with an average of 133 ± 99 nmol/L along the north bank and from 4 to 5380 nmol/L with an average of 1233 ± 2054 nmol/L along the south bank. Generally, N2O concentration of the groundwater exceeded that of the estuary, demonstrating groundwater was possibly one N2O source to the Jiulong River Estuary.
3.3 N2O emission to the atmosphere
The monthly average wind speeds, ranging from 3.9 to 6.5 m/s (Table 1), were used to calculate N2O flux. In agreement with N2O concentrations, the sea-to-air N2O fluxes exhibited great spatial variability in the Jiulong River Estuary. The maximum N2O flux as 1731 μmol/m2/d was observed in the low salinity region, while the N2O flux decreased to 80 μmol/m2/d toward the mouth of the estuary (Figures 3E, F; Table S1). The average N2O flux across the whole estuary was estimated to be 597 ± 490 μmol/m2/d. Previous investigations in 2009 (Zhan et al., 2011) found N2O fluxes from 3 to 94 μmol/m2/d, and then increased to 0.5-168 μmol/m2/d in 2013-2014 (Chen J. et al., 2015). In this study, it has increased to 80-1741 μmol/m2/d, indicating an increasing trend in the N2O emissions of the Jiulong River Estuary during the last 10 years. To test the differences in the upper reaches between N2O values sampled in 2009 (Zhan et al., 2011) with N2O values in our study, a comparison was made using Kruskal-Wallis Test, N2O values in this study were much higher (Figure S3) than that sampled in 2009 (Zhan et al., 2011).
4 Discussion
4.1 Factors that influence the N2O distribution
Factors contributing to the variations of N2O in an estuarine system include its production primarily via nitrification/denitrification that is related to the substrate level (DIN: , , and ). Ambient environmental conditions such as DO level, salinity conditions including estuarine mixing, river discharge as well as N2O emission also play a role. The mixing diagram reflects the nonconservative behavior of and in August and September (flood period), with the system acting as an sink and source (Figure 5). In view of this, the removal of and addition of N2O in the middle reaches (Figure 3) of the Jiulong River Estuary should partly be a result of nitrification, which is consistent with a previous report that suggested N2O accumulation primarily came from nitrification instead of denitrification in the Jiulong River Estuary (Wu et al., 2013; Chen N. et al., 2015). Moreover, the significance of nitrification to estuary seems noticeable: a distinct positive correlation between and N2O concentrations supports N2O production through nitrification to some extent (de Wilde and de Bie, 2000).
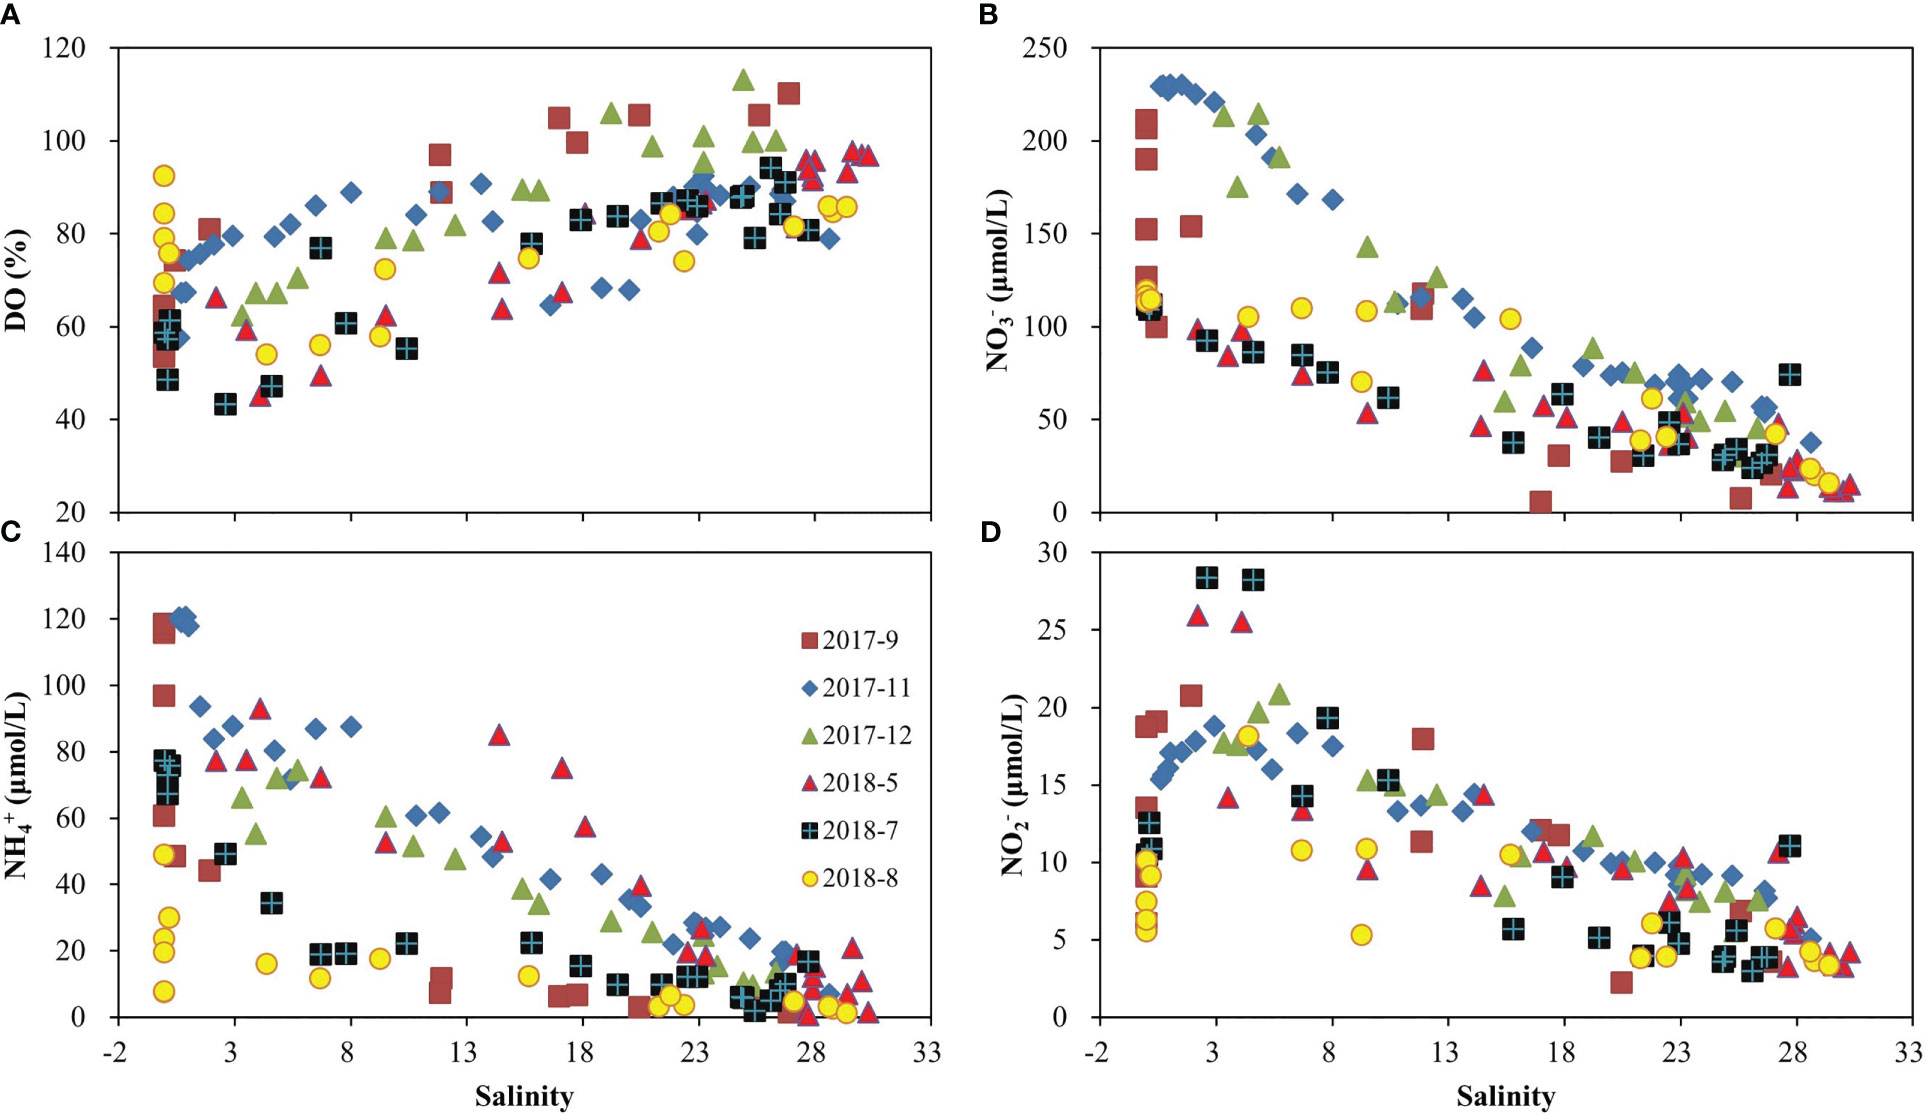
Figure 5 Distributions of DO saturation (A), (B), (C) and (D) along the salinity gradient of the Jiulong River Estuary.
N2O distribution of the Jiulong River Estuary also came under the influence of other environmental factors. Specifically, N2O concentrations were correlated with DO and turbidity (Table S2). The relationships between N2O and DO show negative correlations in overall seasons, i.e., high N2O concentrations and low DO concentrations. Such a pattern resembles those found in other estuaries by previous studies (de Wilde and de Bie, 2000; Brase et al., 2017). Low dissolved O2 (suboxic conditions) makes for nitrification and then N2O production (Codispoti, 2010; Kim et al., 2013), which can also be observed from our sediment incubation experiment. High N2O is usually observed near the maximum turbidity district (Barnes and Owens, 1998; Abril et al., 2000; Gonçalves et al., 2010), which exists year round in the Jiulong River Estuary (Chen et al., 2018). Lots of nitrifiers adhere to particles (Stehr et al., 1995), and a great many surveys concerning estuaries show that particle accumulation helps enhance nitrifying population growth as well as nitrifying action (Abril et al., 2000; de Wilde and de Bie, 2000). N2O concentration was shown to be strongly related to salinity (Table 3), N2O rapidly dropped with increasing salinity (Figure 3B). Nevertheless, in the middle reaches, the lowest N2O value (Figure 3A) was found in July (spring tide, Table 1), the higher tidal amplitude means more seawater intrusion to the estuary, indicating that low N2O seawater was diluting the high N2O estuarine water, thus the estuarine mixing process is another dominant process in the Jiulong River Estuary. The N2O concentration in the upper/middle reaches showed a certain degree of variation (Figure S2); however, we found no significant differences between dry and flood conditions, or among tidal amplitudes. Specific factors that control dynamic spatial pattern of N2O should be addressed in August (flood period), the lowest N2O value was found in the upper reaches (Figure 3A), when the survey was after a rain storm and the river had the highest discharge of all the surveys, significantly higher water discharge (Table 1) may substantially dilute both the N2O and its substrate such as DIN (Figure 3).
All these results suggest that the N2O distribution in the Jiulong River Estuary was subject to many factors, impact of such factors seems additive rather than exclusive. Specific factors that control dynamic spatial pattern of N2O should be confirmed by follow-up research which takes into account more details existing in the estuary.
4.2 Overall N2O sources and sinks
The Jiulong River Estuary was divided into 3 zones, namely, the upper, middle and lower reaches. The average N2O sea-to-air fluxes (μmol/m2/d) were 1111, 617 and 147, and the water areas (km2) were 14.3, 79.1 and 46.6 in the upper, middle and lower reaches, respectively. The daily N2O emissions of the Jiulong River Estuary (E) were estimated to be 71,542 mol/d.
Using the N2O concentrations of the freshwater endmembers (average: 118 nmol/L, S<1) multiplied by the annual average daily water discharge (0.405×10⁸ m3/d) to assess the riverine N2O fluxes (R) to the estuary yields a N2O flux of 4785 mol/d, which is equal to 1.7×10⁶ mol/yr in terms of annual input.
Groundwater could be another source of N2O in the Jiulong River Estuary. Based on average N2O concentrations (725 nmol/L) and daily groundwater discharge of 0.17×10⁸ m3/d (Guo et al., 2011), N2O input from the groundwater to the estuary (G) is estimated as 12,331 mol/d, which accounts for 28% of N2O emissions from the sediment.
N2O loss due to export to the bay could be another sink (B), and N2O surface water concentrations observed at estuary mouth (S>28) were used to calculate the N2O transport to the bay, and were multiplied by the annual average water discharge (0.405×10⁸ m3/d), giving a flux of 593 mol/d, indicating a minor sink of N2O in the estuary.
Incubations for water column and sediments are not carried out in this study. No clear consumption or production during incubation was found from the Brisbane River Estuary, Australia (Sturm et al., 2016). Nevertheless, the water column plays a major part in N2O production in other estuarine studies (Law et al., 1992; Barnes and Owens, 1998; de Wilde and de Bie, 2000), indicating variability among estuaries. According to other research, sediment-water N2O fluxes ranged between -5 and 600 μmol/m2/d, showing high spatiotemporal variability with fluxes (Barnes and Owens, 1998; Laursen and Seitzinger, 2002; Zhang et al., 2010; Allen et al., 2011).
The N2O budget (equation 2) demonstrates the Jiulong River Estuary indistinct N2O sources (X) of around 55,019 mol/d, there are some possible unidentified inputs, including sediment efflux, tributaries and sewage inputs are potential sources of N2O. Conceptual model for sources and sinks of N2O in the Jiulong River Estuary could be seen in Figure 6. Intensity of denitrification can be regulated through the presence of nitrate and nitrite (Dong et al., 2004). Hence, in the presence of sufficient nitrate, sedimentary denitrification site is ideal, and N2O may well derive from denitrification in sediment from the Jiulong River Estuary. In the middle reaches, South Creek joins the Jiulong River Estuary and the N2O concentrations are elevated between the 117.85 and 117.9°E (south creek) during the flood seasons, we conclude that the south creek join the estuary and provide fresh water with high concentration of N2O to the waterbody in the estuary. Sewage investigations are not covered in this survey; although wastewater is partially treated, the nutrients released into the estuary continually increase (Chen et al., 2014), which in turn plays a major role as a N2O source in the estuary.
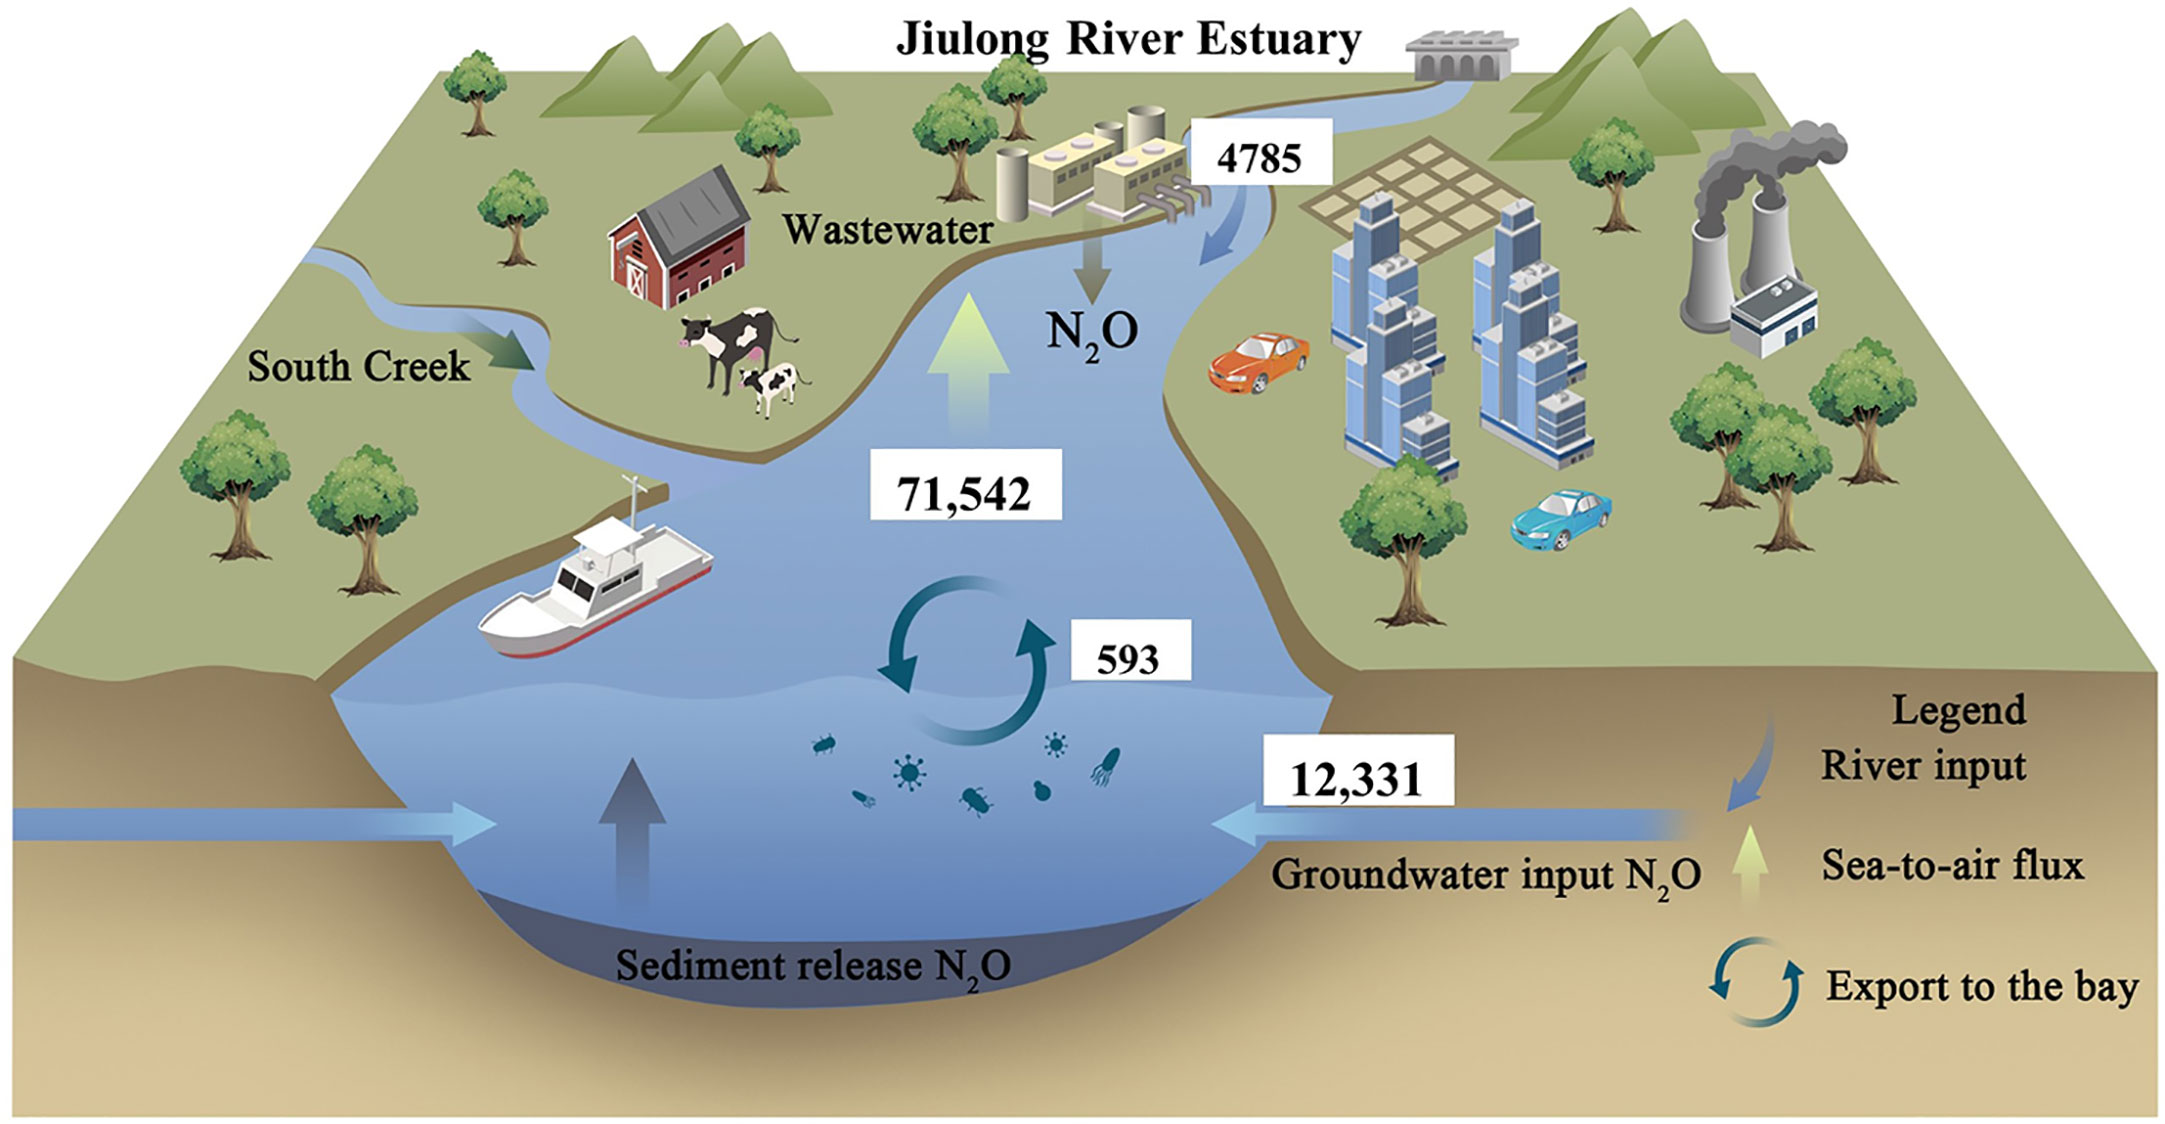
Figure 6 Conceptual model for sources and sinks of N2O in the Jiulong River Estuary, sea-to-air fluxes act as the main sinks of N2O in the water column of the Jiulong River Estuary. All values are in mol/d.
4.3 N2O emissions and long-term trends in the estuary
The plot concerning N2O vs. salinity (Figure 3B) is characterized by concave curves, and the concave profile indicates that N2O in the estuary decreased faster compared with that of the conservative mixing with N2O-poor seawater. N2O consumption has traditionally been considered active only in anoxic environments (Codispoti and Christensen, 1985). Recently, some studies have found that N2O reduction may occur in oxygenated waters (Raes et al., 2016; Rees et al., 2021; Sun et al., 2017; Sun et al., 2021; Tang et al., 2022; Wyman et al., 2013). According to incubations experiment for water column, N2O had not been obviously produced or consumed (section 4.2). Therefore, N2O reductions are primarily caused by gas emissions into the to the atmosphere. N2O saturation of surface water varied between 113% and 2926% in the 6 surveys of the research (Table 4), showing N2O concentrations in the Jiulong River Estuary were at a higher level with respect to the atmospheric N2O concentrations throughout the year. Hence, the Jiulong River Estuary represents one net source of N2O discharged into the atmospheric environment. The average N2O flux of the Jiulong River Estuary was estimated to be 597 μmol/m2/d (Table 4). This flux is comparable to the flux in the Colne Estuary (Dong et al., 2004) and far higher compared with that in estuaries such as the Scheldt, Humber, Indian and Pearl Estuaries (de Wilde and de Bie, 2000; Lin et al., 2016; Rao and Sarma, 2016), indicating that saturations and emissions of N2O in the Jiulong River Estuary rank top in the world (Figure 7). In accordance with the coverage in the Jiulong River Estuary (see section 4.2), the annual N2O emissions were estimated to be 0.26× 10⁸ mol/yr (equal to 1.1 Gg N/yr), which accounted for approximately 3.3% of the riverine DIN (34.3 Gg N/yr) load to the estuary (Yan et al., 2012), which was one order of magnitude higher than the 0.3% from DIN input employed in global scale models for estuaries (Seitzinger and Kroeze, 1998), indicating very high yields of N2O of the Jiulong River Estuary compared to global estuaries. Areal nutrient flux yield rates of the Jiulong River were much higher than those in major world rivers, and although the water discharge in the Jiulong River merely reaches 1.1% of that in the Changjiang River and 2.5% of that in the Pearl River, the areal DIN yield rates from the Jiulong River watershed are 4.1 and 2.4 times those from the Yangtze River and Pearl River watersheds, separately (Yan et al., 2012). Many studies have shown that DIN has a significant relationship with N2O, with increased N2O emissions due to the increased DIN inputs (Borges et al., 2018; Wells et al., 2018; Reading et al., 2020), Zhang et al. (2010) made a plot of estuarine N2O versus DIN on a global scale, and by compiling N2O data from 50 estuaries (Reading et al., 2020), they both found N2O saturation showed a positive relationship with DIN on a global scale, and our data nicely match the correlation they show. Thus, the higher N2O saturation could be attributed to greater DIN loadings as well as greater yields of N2O rates of the Jiulong River Estuary.
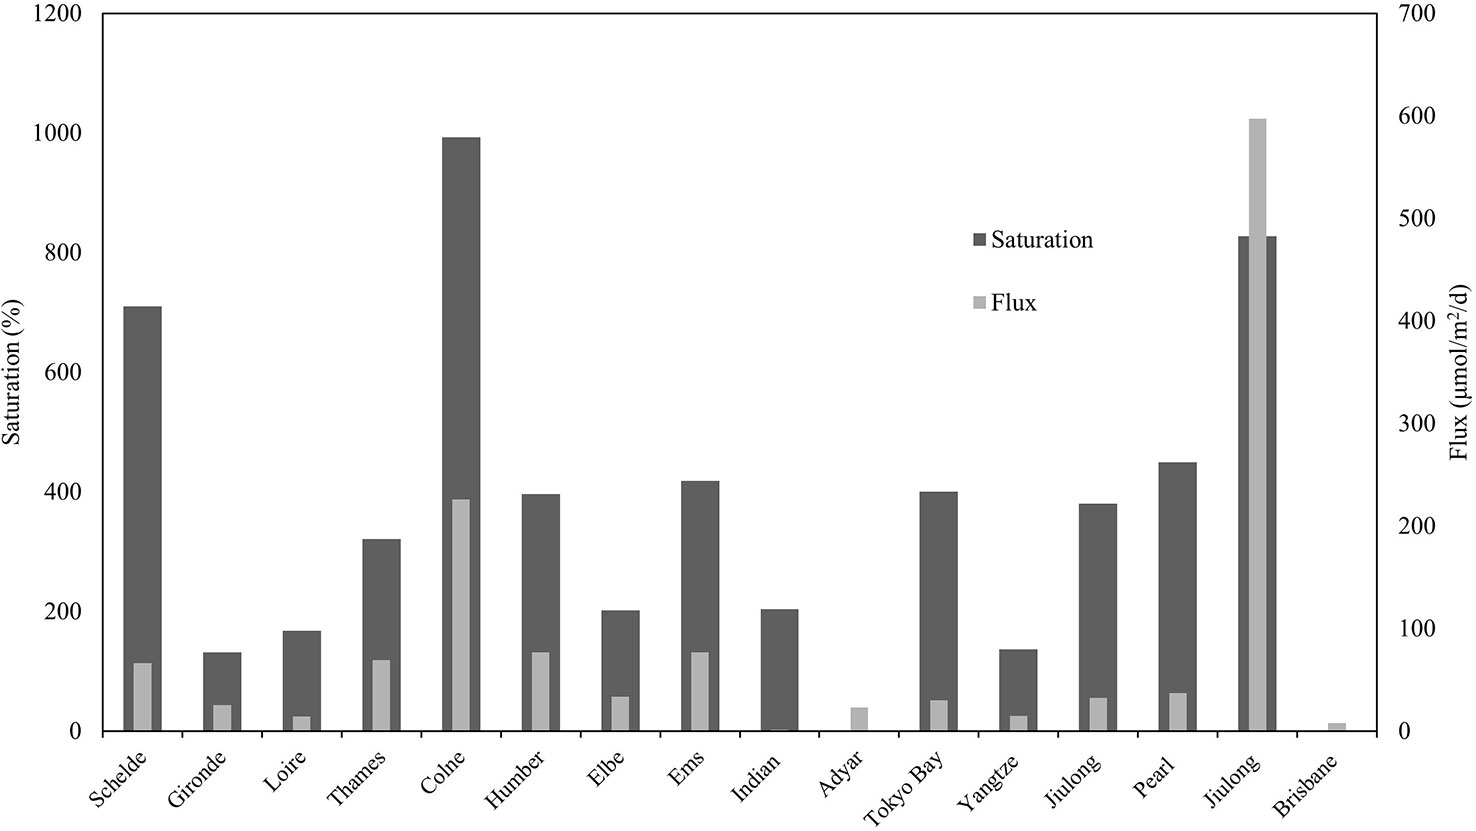
Figure 7 Comparisons of N2O saturations and fluxes among estuaries worldwide. (The data are from the research as well as references of Table S3).
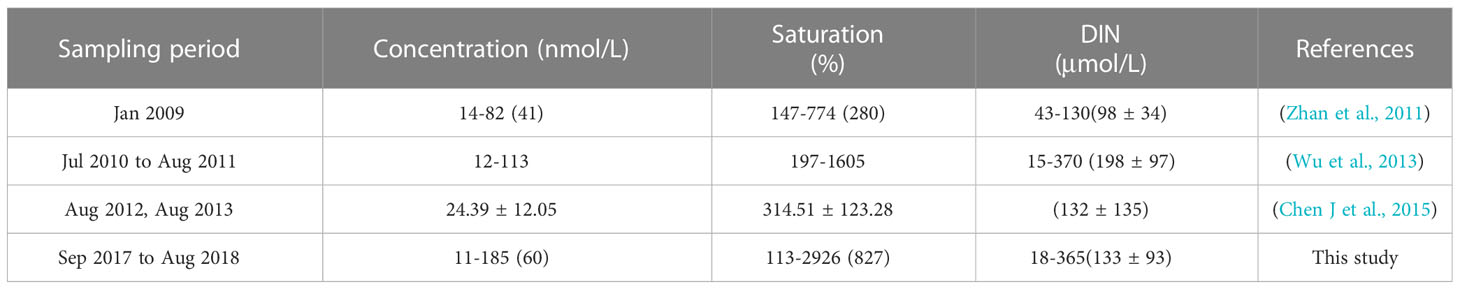
Table 4 Comparison of N2O concentrations, saturations and DIN in the Jiulong River Estuary from this and previous studies.
We made a comparison for the trend of nutrient loads and N2O saturations in the past 10 years (Table 4). Previous investigations in 2009 found N2O saturations around 280% (Zhan et al., 2011); since then, the saturations of N2O has been increasing, and the mean N2O saturations has increased by 2 folds of magnitude during the last 10 years (Table 4). In addition, riverine N2O flux to the Jiulong River Estuary increased more than 15-fold during the 1985–2012 period (Chen N. et al., 2015). This is in contrast to some European estuaries, such as the Elbe and Schelde Estuaries (de Wilde and de Bie, 2000; Brase et al., 2017), where reduced N2O concentrations were observed during the last 20 years, following a significant decrease in DIN loads and an improvement in environmental conditions. However, the DIN in the Jiulong River Estuary presented an increasing trend, reached a maximum in 2011 and then decreased (Table 4), which conformed to the historical nutrient fluxes of the Jiulong River Estuary (Wu et al., 2017). Based on the correlation of DIN and N2O mentioned above, N2O saturation should have declined after 2011; instead, it is remarkable that N2O saturation continued to increase. One possible reason for the contrast phenomenon between the correlations and our finding is probably the increased oxygen concentration (Cai et al., 2016; Wu et al., 2017) in the Jiulong River Estuary during the past decade. In line with high nutrient loads and low oxygen saturation in the Elbe estuary in the 1980s (Hanke and Knauth,1990), it is concluded that denitrification was the dominant contributor to N2O production at that time (Brase et al., 2017). N2O can be reduced to N2 under anoxic conditions via denitrification (Upstill-Goddard et al., 2017), whereas, the yields of N2O from microbial processes are enhanced under suboxic conditions (Zhang et al., 2010; Brase et al., 2017). With the improved environmental conditions in the Jiulong River Estuary especially with increased oxygen concentrations, the importance of denitrification appears to have ceased in the contemporary estuary, and our data also support that obvious nitrate addition in the middle reach points toward nitrification playing an important role in N2O production in the contemporary estuary. It remains unclear why N2O saturation continued to increase to such a high level, while it seems plausible that intense nitrification/denitrification and high yields of N2O in the sediment, may still play an important role in overall N2O production in the Jiulong River Estuary.
5 Conclusions
N2O concentrations in the Jiulong River Estuary presented great temporal and spatial variations, and saturations fell within the range of those in other estuaries worldwide but were toward the higher end and were in accordance with the high DIN levels. The N2O dynamics in the Jiulong River Estuary were influenced by many factors, such as DIN (, and ), salinity and dissolved oxygen. N2O concentrations showed little variability between the surface and bottom waters. Sea-to-air fluxes act as the main sinks for N2O of the water column in the Jiulong River Estuary, and careful incubation experiments in the water column and sediments are required to better interpret the mechanisms of production of N2O in the Jiulong River Estuary. Compared with previous research, DIN loads peaked in 2011 and then declined, but our research indicated that N2O saturation continued to increase, which may be related to the improved DO conditions. The main N2O production pathway has changed from predominantly denitrification in the past to significant nitrification in the present. Thus, the future development of N2O in the Jiulong River Estuary is still unclear and should be evaluated in further studies.
Data availability statement
The raw data supporting the conclusions of this article will be made available by the authors, without undue reservation.
Author contributions
YLi, YLu and LZ contributed to conception and design of the study. YLi, JL and JZ collected the field samples and analyzed the data. WY performed the statistical analysis. YLu provided the hydrographic data. YLi drafted the manuscript with input from all other authors. All authors contributed to the article and approved the submitted version.
Funding
This work was supported by National Key R&D Program of China (2022YFC2804002), the Scientific Research Foundation of the Third Institute of Oceanography (Grants 2022011, 2020004, 2020017), the Natural Science Foundation of Fujian Province (Grant 2020J01102) and Asian Cooperation Fund Project-Study on Typical Bay Ecological Protection and Management Demonstration. We appreciate two anonymous reviewers, and Editor Dr. Christian Joshua Sanders for their constructive comments that have improved the manuscript substantially.
Acknowledgments
We appreciate two reviewers, and Editors for their constructive comments that have improved the manuscript substantially.
Conflict of interest
The authors declare that the research was conducted in the absence of any commercial or financial relationships that could be construed as a potential conflict of interest.
Publisher’s note
All claims expressed in this article are solely those of the authors and do not necessarily represent those of their affiliated organizations, or those of the publisher, the editors and the reviewers. Any product that may be evaluated in this article, or claim that may be made by its manufacturer, is not guaranteed or endorsed by the publisher.
Supplementary material
The Supplementary Material for this article can be found online at: https://www.frontiersin.org/articles/10.3389/fmars.2023.1138258/full#supplementary-material
References
Abril G., Commarieu M. V., Maro D., Fontugne M., Guérin F., Etcheber H. (2004). A massive dissolved inorganic carbon release at spring tide in a highly turbid estuary. Geophys. Res. Lett. 31 (9), 1893–1906. doi: 10.1029/2004GL019714
Abril G., Riou S. A., Etcheber H., Frankignoulle M., Wit R. D., Middelburg J. J. (2000). Transient, tidal time-scale, nitrogen transformations in an estuarine turbidity maximum–fluid mud system (The gironde, south-west France). Estuar. Coast. Shelf Sci. 50 (5), 703–715. doi: 10.1006/ecss.1999.0598
Allen D., Dalal R. C., Rennenberg H., Schmidt S. (2011). Seasonal variation in nitrous oxide and methane emissions from subtropical estuary and coastal mangrove sediments. Australia Plant Biol. 13 (1), 126–133. doi: 10.1111/j.1438-8677.2010.00331.x
Bange H. W., Rapsomanikis S., Andreae M. O. (1996). Nitrous oxide in coastal waters. Global Biogeochem. Cycles 10 (1), 197–207. doi: 10.1029/95GB03834
Bange H. W., Sim C. H., Bastian D., Kallert J., Kock A., Mujahid A., et al (2019). Nitrous oxide (N2O) and methane (CH4) in rivers and estuaries of northwestern Borneo. Biogeosciences 16, 4321–4335. doi: 10.5194/bg-16-4321-2019
Barnes J., Owens N. J. P. (1998). Denitrification and nitrous oxide concentrations in the Humber estuary, UK, and adjacent coastal zones. Mar. pollut. Bull. 37 (3–7), 247–260. doi: 10.1016/S0025-326X(99)00079-X
Borges A. V., Darchambeau F., Lambert T., Bouillon S., Morana C., Brouyère S., et al. (2018). Effects of agricultural land use on fluvial carbon dioxide, methane and nitrous oxide concentrations in a large European river, the meuse (Belgium). Sci. total environ. 610–611, 342–355. doi: 10.1016/j.scitotenv.2017.08.047
Brase L., Bange H. W., Lendt R., Sanders T., Dähnke K. (2017). High resolution measurements of nitrous oxide (N2O) in the Elbe estuary. Front. Mar. Sci. 4, 162. doi: 10.3389/fmars.2017.00162
Cai M., Huang D., Liu Y., Chen K., Yang S. (2016). Quantitative analysis of anthropogenic influences on coastal water - a new perspective. Ecol. indicat.: Integrat. monitor. Assess. Manage. 67 (Aug.), 673–683. doi: 10.1016/j.ecolind.2016.03.037
Cao W., Hong H., Yue S. (2005). Modelling agricultural nitrogen contributions to the jiulong river estuary and coastal water. Global Planet. Change 47 (2–4), 111–121. doi: 10.1016/j.gloplacha.2004.10.006
Chen J., Cao W., Cao D., Huang Z., Liang Y. (2015). Nitrogen loading and nitrous oxide emissions from a river with multiple hydroelectric reservoirs. Bull. Environ. Contaminat. Toxicol. 94 (5), 633–639. doi: 10.1007/s00128-015-1525-5
Chen N., Krom M. D., Wu Y., Yu D., Hong H. (2018). Storm induced estuarine turbidity maxima and controls on nutrient fluxes across river-estuary-coast continuum. Sci. total Environ. 628-629, 1108–1120. doi: 10.1016/j.scitotenv.2018.02.060
Chen J.-J., Wells N. S., Erler D. V., Eyre B. D. (2022). Land-use intensity increases benthic N2O emissions across three sub-tropical estuaries. J. Geophys. Res.: Biogeosci. 127, e2022JG006899. doi: 10.1029/2022JG006899
Chen N., Wu J., Chen Z., Lu T., Wang L. (2014). Spatial-temporal variation of dissolved N2 and denitrification in an agricultural river network, southeast China. Agricul. Ecosyst. Environ. 189, 1–10. doi: 10.1016/j.agee.2014.03.004
Chen N., Wu J., Zhou X., Chen Z., Lu T. (2015). Riverine N2O production, emissions and export from a region dominated by agriculture in southeast Asia (Jiulong river). Agric. Ecosyst. Environ. 208, 37–47. doi: 10.1016/j.agee.2015.04.024
Codispoti L. A. (2010). Interesting times for marine N2O. Science 327 (5971), 1339–1340. doi: 10.1126/science.1184945
Codispoti L. A., Christensen J. P. (1985). Nitrification, denitrification and nitrous oxide cycling in the eastern tropical south pacific ocean. Mar. Chem. 16 (4), 277–300. doi: 10.1016/0304-4203(85)90051-9
de Wilde H. P. J., de Bie M. J. M. (2000). Nitrous oxide in the schelde estuary: production by nitrification and emission to the atmosphere. Mar. Chem. 69 (3), 203–216. doi: 10.1016/S0304-4203(99)00106-1
Dong L. F., Nedwell D. B., Colbeck I., Finch J. (2004). Nitrous oxide emission from some English and welsh rivers and estuaries. Water Air Soil Pollution: Focus 4 (6), 127–134. doi: 10.1007/s11267-004-3022-4
Eyre B. D., Maher D. T., Sanders C. (2016). The contribution of denitrification and burial to the nitrogen budgets of three geomorphically distinct Australian estuaries: importance of seagrass habitats. Limnol. Oceanog. 61 (3), 1144–1156. doi: 10.1002/lno.10280
Gonçalves C., Brogueira M. J., Camões M. F. (2010). Seasonal and tidal influence on the variability of nitrous oxide in the tagus estuary, Portugal. Scientia Mar. 74 (S1), 57–66. doi: 10.3989/scimar.2010.74s1057
Guo Z., Huang L., Yuan X., Liu H., Li K. (2011). Estimating submarine groundwater discharge to the jiulong river estuary using Ra isotopes (in Chinese). Adv. Water Sci. 22 (1), 118–125.
Hanke V.-R., Knauth H.-D. (1990). N2O-gehalte in wasser-und luftproben aus den bereichen der tideelbe und der deutschen bucht. Vom Wasser 75, 357–374.
Huang X. Q. (2008). Hydrological characteristics in the jiulong watershed (in Chinese). Water Sci. Technol. 1, 16–20.
Kim I. N., Lee K., Bange H. W., Macdonald A. M. (2013). Interannual variation in summer N2O concentration in the hypoxic region of the northern gulf of Mexico 1985–2007. Biogeosciences 10 (11), 6783–6792. doi: 10.5194/bg-10-6783-2013
Lan X., Thoning K. W., Dlugokencky E. J. (2022). Trends in globally-averaged CH4, N2O, and SF6 determined from NOAA global monitoring laboratory measurements. version 2023-01. Available at: https://gml.noaa.gov/ccgg/trends_n2o/
Laursen A. E., Seitzinger S. P. (2002). The role of denitrification in nitrogen removal and carbon mineralization in mid-Atlantic bight sediments. Continental shelf Res. 22 (9), 1397–1416. doi: 10.1016/S0278-4343(02)00008-0
Law C., Rees A., Owens N. (1992). Nitrous oxide: estuarine sources and atmospheric flux. Estuar. Coast. Shelf Sci. 35 (3), 301–314. doi: 10.1016/S0272-7714(05)80050-2
Li Y., Zhan L., Chen L., Zhang J., Wu M., Liu J. (2021). Spatial and temporal patterns of methane and its influencing factors in the jiulong river estuary, southeastern China. Mar. Chem. 228, 103909. doi: 10.1016/j.marchem.2020.103909
Lin H., Dai M., Kao S. J., Wang L., Roberts E., Yang J. Y. T., et al. (2016). Spatio temporal variability of nitrous oxide in a large eutrophic estuarine system: the pearl river estuary, China. Mar. Chem. 182, 14–24. doi: 10.1016/j.marchem.2016.03.005
Luo Z. B., Pan W. R., Zhang G. R., Teng M. A., Wang J. (2008). The three-dimensional tidal current numerical model in jiulongjiang estuary and xiamen bay (in Chinese). J. Xiamen Univ. 47 (6), 864–868.
Raes E. J., Bodrossy L., Van de Kamp J., Holmes B., Hardman-Mountford N., Thompson P. A., et al. (2016). Reduction of the powerful greenhouse gas N2O in the south-Eastern Indian ocean. PloS One 11 (1), 1–11. doi: 10.1371/journal.pone.0145996
Rao G. D., Sarma V. V. S. S. (2016). Variability in concentrations and fluxes of methane in the Indian estuaries. Estuar. Coasts 39 (6), 1–12. doi: 10.1007/s12237-016-0112-2
Raymond P. A., Cole J. J. (2001). Gas exchange in rivers and estuaries: choosing a gas transfer velocity. Estuaries 24 (2), 312–317. doi: 10.2307/1352954
Reading M. J., Tait D. R., Maher D. T., Jeffrey L. C., Looman A., Holloway C., et al. (2020). Land use drives nitrous oxide dynamics in estuaries on regional and global scales. Limnol. Oceanog 65 (8), 1903–1920. doi: 10.1002/lno.11426
Rees A. P., Brown I. J., Jayakumar A., Lessin G., Somerfield P. J., Ward B. B. (2021). Biological nitrous oxide consumption in oxygenated waters of the high latitude Atlantic ocean. Commun. Earth Environ. 2 (1), 36. doi: 10.1038/s43247-021-00104-y
Seitzinger S. P., Kroeze C. (1998). Global distribution of nitrous oxide production, n inputs in freshwater, coastal marine ecosystems. Global Biogeochem. Cycles 12 (1), 93–113. doi: 10.1029/97GB03657
Smith K. A., Mctaggart I. P., Tsuruta H. (1997). Emissions of N2O and NO associated with nitrogen fertilization in intensive agriculture, and the potential for mitigation. Soil Use Manage. 13 (s4), 296–304. doi: 10.1111/j.1475-2743.1997.tb00601.x
Stehr G., Böttcher B., Dittberner P., Rath G., Koops H.-P. (1995). The ammonia-oxidizing nitrifying population of the river Elbe estuary. FEMS Microbiol. Ecol. 17 (3), 177–186. doi: 10.1111/j.1574-6941.1995.tb00141.x
Stocker T. F., Qin D., Plattner G. K., Tignor M., Allen S. K., Boschung J., et al. (2013). “IPCC 2013: climate change 2013: the physical science basis,” in Contribution of working group I to the fifth assessment report of the intergovernmental panel on climate change (Cambridge: WMO/UNEP), 95–123 pp.
Sturm K., Grinham A., Werner U., Yuan Z. (2016). Sources and sinks of methane and nitrous oxide in the subtropical Brisbane river estuary, south East Queensland, Australia. Estuar. Coast. Shelf Sci. 168, 10–21. doi: 10.1016/j.ecss.2015.11.002
Sun X., Amal J., Bess B. W. (2017). Community composition of nitrous oxide consuming bacteria in the oxygen minimum zone of the Eastern tropical south pacific. Front. Microbiol. 8. doi: 10.3389/fmicb.2017.01183
Sun X., Jayakumar A., Tracey J. C., Wallace E., Kelly C. L., Casciotti K. L., et al. (2021). Microbial N2O consumption in and above marine N2O production hotspots. Isme J. 15 (5), 1434–1444. doi: 10.1038/s41396-020-00861-2
Tang Z., Liu X., Li G., Liu X. (2022). Mechanism of biochar on nitrification and denitrification to N2O emissions based on isotope characteristic values. Environ. Res. 212 (Part A).
Upstill-Goddard R. C., Salter M. E., Mann P. J., Barnes J., Poulsen J., Dinga B., et al. (2017). The riverine source of CH4 and N2O from the republic of Congo, western Congo basin. Biogeosciences 14, 1–24. doi: 10.5194/bg-14-2267-2017
Vilmin L., Mogollón J. M., Beusen A. H. W., Bouwman A. F. (2018). Forms and subannual variability of nitrogen and phosphorus loading to global river networks over the 20th century. Global Planet. Change 163, 67–85. doi: 10.1016/j.gloplacha.2018.02.007
Wanninkhof R. (2014). Relationship between wind speed and gas exchange over the ocean revisited. Limnol. Oceanog.: Methods 12 (6), 351–362. doi: 10.4319/lom.2014.12.351
Weiss R. F., Price B. A. (1980). Nitrous oxide solubility in water and seawater. Mar. Chem. 8 (4), 347–359. doi: 10.1016/0304-4203(80)90024-9
Wells N. S., Maher D. T., Erler D. V., Hipsey M., Rosentreter J. A., Eyre B. D. (2018). Estuaries as sources and sinks of N2O across a land use gradient in subtropical Australia. Global Biogeochem. Cycles 32 (5), 877–894. doi: 10.1029/2017GB005826
Wu G., Cao W., Huang Z., Kao C.-M., Chang C.-T., Chiang P.-C., et al. (2017). Decadal changes in nutrient fluxes and environmental effects in the jiulong river estuary. Mar. pollut. Bull. 124 (2), 871–877. doi: 10.1016/j.marpolbul.2017.01.071
Wu J., Chen N., Hong H., Lu T., Wang L., Chen Z. (2013). Direct measurement of dissolved N2 and denitrification along a subtropical river-estuary gradient, China. Mar. pollut. Bull. 66 (1–2), 125–134. doi: 10.1016/j.marpolbul.2012.10.020
Wyman M., Hodgson S., Bird C. (2013). Denitrifying alphaproteobacteria from the Arabian Sea that express nosZ, the gene encoding nitrous oxide reductase, in oxic and suboxic waters. Appl. Environ. Microbiol. 79 (8), 2670–2681. doi: 10.1128/AEM.03705-12
Yan X. L., Zhai W. D., Hong H. S., Li Y., Guo W. D., Huang X. (2012). Distribution, fluxes and decadal changes of nutrients in the jiulong river estuary, southwest Taiwan strait. Chin. Sci. Bull. 57 (18), 2307–2318. doi: 10.1007/s11434-012-5084-4
Yang S., Chang B. X., Warner M. J., Weber T. S., Bianchi D. (2020). Global reconstruction reduces the uncertainty of oceanic nitrous oxide emissions and reveals a vigorous seasonal cycle. Proc. Natl. Acad. Sci. 117 (22), 201921914. doi: 10.1073/pnas.1921914117
Zappa C. J., Raymond P. A., Terray E. A., Mcgillis W. R. (2003). Variation in surface turbulence and the gas transfer velocity over a tidal cycle in a macro-tidal estuary. Estuaries 26 (6), 1401–1415. doi: 10.1007/BF02803649
Zhan L.-Y., Chen L.-Q., Zhang J.-X., Lin Q. (2013). A system for the automated static headspace analysis of dissolved N2O in seawater. Int. J. Environ. Anal. Chem. 93 (8), 828–842. doi: 10.1080/03067319.2012.702273
Zhan l., Chen L., Zhang J., Zheng A. (2011). Distribution of N2O in the jiulong jiang river estuary and estimation of its air-sea flux during winter (in Chinese). J. Oceanog. Taiwan Strait 30 (002), 189–195.
Zhang J. (1996). Nutrient elements in large Chinese estuaries. Continental shelf Res. 16 (8), 1023–1045. doi: 10.1016/0278-4343(95)00055-0
Keywords: N2O, Jiulong River Estuary, sources, sinks, nitrification/denitrification process
Citation: Li Y, Luo Y, Liu J, Ye W, Zhang J and Zhan L (2023) Sources and sinks of N2O in the subtropical Jiulong River Estuary, Southeast China. Front. Mar. Sci. 10:1138258. doi: 10.3389/fmars.2023.1138258
Received: 05 January 2023; Accepted: 25 April 2023;
Published: 12 May 2023.
Edited by:
Stelios Katsanevakis, University of the Aegean, GreeceReviewed by:
Hsiao-Chun (Jean) Tseng, National Taiwan Ocean University, TaiwanJiafang Huang, Fujian Normal University, China
Copyright © 2023 Li, Luo, Liu, Ye, Zhang and Zhan. This is an open-access article distributed under the terms of the Creative Commons Attribution License (CC BY). The use, distribution or reproduction in other forums is permitted, provided the original author(s) and the copyright owner(s) are credited and that the original publication in this journal is cited, in accordance with accepted academic practice. No use, distribution or reproduction is permitted which does not comply with these terms.
*Correspondence: Liyang Zhan, zhanliyang@tio.org.cn; Yang Luo, luoyang@tio.org.cn