Human activities altered the enrichment patterns of microplastics in mangrove blue carbon ecosystem in the semi-enclosed Zhanjiang Bay, China
 Peng Zhang
 Wei Zhao1
  Jibiao Zhang
- 1College of Chemistry and Environmental Science, Guangdong Ocean University, Guangdong, Zhanjiang, China
- 2Research Center for Coastal Environmental Protection and Ecological Resilience, Guangdong Ocean University, Guangdong, Zhanjiang, China
Mangroves, as the key blue carbon ecosystem, are considered ‘potential sinks’ for microplastics (MPs) in the land-ocean interface zones. However, there is limited understanding of enrichment patterns of MPs in mangrove blue carbon ecosystem, particularly in relation to human activities. This study explored the abundance, composition, and diversity of MPs in mangrove and non-mangrove sediments in Zhanjiang Bay (ZJB) to investigate the effects of human activities on MPs enrichment patterns in the blue carbon system. The results showed that MPs were widely prevalent in all sediment samples, and the abundance of MPs was significantly higher in all mangrove sediments than in non-mangrove sediments (P < 0.05). Furthermore, the average abundance of MPs was found to be 263.67 ± 85.25 items/kg in non-mangrove sediment samples, whereas in mangrove sediment samples, it was 618.17 ± 71.75 items/kg. The average abundance of MPs in mangroves was about 1.6 times higher than that in non-mangroves, indicating that mangroves have an interception effect on MPs, and human activities are the key factor leading to the difference in MPs enrichment patterns between mangroves and non-mangroves. Furthermore, the predominant MPs shapes in both mangroves and non-mangroves are fragments, with multicolor and green being the most common colors and most MPs sizes ranging between 100 and 330 µm. Besides, there was no significant relationship found between MPs abundance and particulate organic carbon (P > 0.05), indicating that MPs pollution didn’t significantly alter the natural POC pool in ZJB. Overall, this study provided important baseline information on MPs pollution in the mangrove blue carbon ecosystems in ZJB, which was implications for future mitigation of MPs pollution and the management of mangrove ecosystem.
1 Introduction
Microplastics (MPs) were first introduced in 2004 (Thompson et al., 2004). MPs are plastic particles less than 5.0 mm in diameter (GESAMP, 2016). Depending on the source, MPs are classified as primary and secondary. Primary MPs are any plastic fragments or particles that are less than or equal to 5.0 mm in size before entering the environment (Zitko and Hanlon, 1991; Fendall and Sewell, 2009). MPs are deliberately produced by humans and incidental products of the manufacturing process. They include microfibers, microbeads, and plastic particles (also referred to as small pieces) from clothing. Secondary MPs are produced by the degradation (decomposition) of larger plastic products that enter the environment through natural weathering processes. This results in the gradual cleavage of their polymer matrix into plastic fragments smaller than 5 mm by breaking the chemical bonds. Improper waste management and human misconduct release plastic waste into the environment, which can have multiple biotic and abiotic effects. These effects can lead to the formation of secondary MPs (Andrady, 2011; Zettler et al., 2013). Its sources include water and soda bottles, fishing nets, and plastic bags. These types of waste are persistent in the environment, especially in marine and aquatic organisms. Several studies have reported the adsorption of trace metals by plastics suspended in the ocean (Rochman et al., 2014). Additionally, the presence of organic chemicals in plastics is globally recognized (Ogata et al., 2009). It has been suggested that MPs may cause harm to humans through both physical and chemical pathways (Smith et al., 2018). Due to their microscopic nature, MPs are easily ingested as food by a wide variety of aquatic organisms, especially marine zooplankton (Desforges et al., 2015). MPs accumulate in the stomachs and intestines of marine organisms, causing gastrointestinal obstruction and ultimately death (Güven et al., 2017). Large marine mammals ingest MPs directly from the ocean and also indirectly by consuming other organisms that have adsorbed or ingested MPs (Guzzetti et al., 2018). MPs can enter organisms through food web ingestion and transfer (Dahms, 2014). Prolonged exposure to MPs can adversely affect organism functioning (Maghsodian et al., 2022), including reduced fertility reproduction (Sussarellu et al., 2016), immune system effects (Liu et al., 2019), and physical harm such as wound rupture and death (Maghsodian et al., 2020). Jambeck et al. (2015) estimated that between 1.75% and 4.62% of total annual plastic production becomes marine litter. They also found that between 4.8 and 12.7 million tonnes of plastic entered the ocean in 2010, and this amount is expected to double by 2025 without intervention. According to Statista (2020), global plastic production in 2019 was approximately 368 million metric tonnes, with half of it produced in Asia. Therefore, it can be estimated that around 6.44 to 17 million tonnes of plastic waste entered the oceans in 2019. MPs migrate long distances in the ocean with winds and currents (Li et al., 2022), and as they migrate for longer periods of time, organisms attach to the surface of the MPs, leading to reduced buoyancy (Lobelle and Cunliffe, 2011) and eventual sinking to the seafloor and accumulation in sediments (Woodall et al., 2014). This leads to the potential for marine sediments to accumulate MPs and become the largest “sink” (Nuelle et al., 2014).
Mangroves are a crucial component of blue carbon ecosystems due to their high productivity, high sedimentation rates, high biodiversity, and well-developed root systems (Roy, 2014). They thrive in hydrothermal conditions, anoxic waterlogged soils, and slow decomposition rates, making them effective carbon storage (Donato et al., 2011; Walcker et al., 2018). Tang et al. (2022) refer to them as ‘coastal guardians’ due to their ability to provide important economic, social, and ecological services (Alemu et al., 2021). Its dense and well-developed root system also acts as an effective filter, attenuating wave impact and current velocity, thereby adequately capturing and trapping floating material and facilitating the deposition of suspended particulate matter, making it a barrier and buffer for the input of a wide range of terrestrial pollutants into the ocean (Horstman et al., 2014; Mullarney et al., 2017; Norris et al., 2017; Martin et al., 2019; Liu et al., 2022). Research has shown that mangrove forests cover only 0.5% of the global coastal area (Alongi, 2014) but sequester 5% of the world’s total global carbon, making them one of the most carbon-rich forests in the tropics (Donato et al., 2011). It is worth noting that MPs particles contain a significant amount of carbon, at around 80% (Rillig, 2018). Additionally, mangroves are important and unique intertidal ecosystems that have an interception effect on MPs (Jiao et al., 2022). Mangroves mainly grow in coastal or estuarine areas and are currently considered a “potential sink” for MPs (Bayen, 2012; Mohamed Nor and Obbard, 2014; Deng et al., 2021). The density of aerial plants is positively correlated with wave energy dissipation and plays an important role in wave attenuation (Norris et al., 2017), and mangroves have aerial roots (aerial roots specialized for gas exchange), which plays an important role in wave attenuation (Duan et al., 2021). Additionally, they are effective in trapping and preserving MPs in the sediment due to the high sediment accretion rate of mangroves (Martin et al., 2020). Pollution caused by plastic waste has been recognized as a major threat to mangroves (Owuor et al., 2019). MPs have been found to enter the water column of mangrove forests and may adsorb and release harmful substances that negatively affect the growth and reproduction of aquatic organisms, thus reducing marine biodiversity (Gallo et al., 2018). Additionally, MPs can be deposited directly on top of mangrove aerial roots, affecting root growth and in the long term creating an anoxic environment that can eventually lead to mortality (van Bijsterveldt et al., 2021). In 2014, Mohamed Nor and Obbard (2014) conducted the first study on MPs in coastal mangrove ecosystems in Singapore. They found that the maximum level of MPs in mangrove sediments was 62.7 MPs/kg, which initiated further research on MPs in mangrove sediments. Currently, research on MPs in mangrove ecosystems is still in its early stages, with most studies focusing on MPs in marine environments, river estuaries (Jiao et al., 2022), freshwater, and drinking water (Law et al., 2014). While there have been studies on mangrove forests, the focus primarily been on the abundance and distribution of MPs in mangrove sediments, including their size, color and shape. This study, aims to investigate the relationship between MPs abundance and POC.
Zhanjiang Bay (ZJB) is a semi-enclosed bay situated on the northeastern side of the Leizhou Peninsula in western Guangdong (Zhang et al., 2019; Zhang et al., 2020a, 2021). It is considered the largest port in Zhanjiang City. The Zhanjiang Mangrove National Nature Reserve is the largest mangrove reserve in China, known for its diverse and complex characteristics (Tang et al., 2022). Due to rapid economic development and substantial population growth in Zhanjiang, the coastal environment has suffered severe damage, and the mangroves are under greater environmental pressure. MPs pollution in the mangrove blue carbon ecosystem has been exacerbated by human activities, including the rapid development of developed fisheries, tourism, and industry (Zhang et al., 2020b). Despite this, the corresponding environmental protection system and pollution treatment capacity have not improved significantly, resulting in a considerable impact on ZJB mangroves. However, there is still limited understanding of the enrichment patterns of MPs in this ecosystem affected by human activities.
To enhance comprehension of the pollution status of mangrove forests in ZJB, this study examined five stations along ZJB, which were divided into two major groups: mangroves and non-mangroves. The following aspects of research were carried out for this purpose (1) to investigate the abundance of MPs in mangrove and non-mangrove sediments of ZJB affected by human activities; (2) to identify the MPs characteristics and diversity of mangrove and non-mangrove sediments of ZJB human activities; (3) assess the diversity and enrichment patterns of MPs in mangrove blue carbon ecosystem; (4) to explore the interactions between particulate organic carbon (POC) and MPs abundance. This study provided important baseline information on MPs pollution in the mangrove blue carbon ecosystems in the semi-enclosed bay, which was helpful to understand the MPs pollution and interactions with mangroves blue carbon under intensive human activities in the future.
2 Materials and methods
2.1 Study area
This study focuses on the selection of mangrove and non-mangrove forests in river basins located in Zhanjiang Bay (ZJB) in southern China. ZJB is a typical subtropical semi-enclosed bay with a mild climate and fertile water, surrounded by the main urban area of Zhanjiang City. The area’s topography is complex, making it relatively suitable for mangrove growth (Syahid et al., 2020). The region of ZJB is connected to the South China Sea through a narrow channel (< 2 km), which allows for the exchange of suspended seawater sediments between ZJB and the outer part of the bay (Zhou et al., 2021). Sediment samples were collected from five stations in ZJB, and detailed information for each station is shown in Figure 1 and Table 1. In addition, to explore the MPs difference in the mangrove and non-mangrove sediments in ZJB, sediment samples (three replicates) were collected from mangrove and unvegetated bare flat sites during low tide.
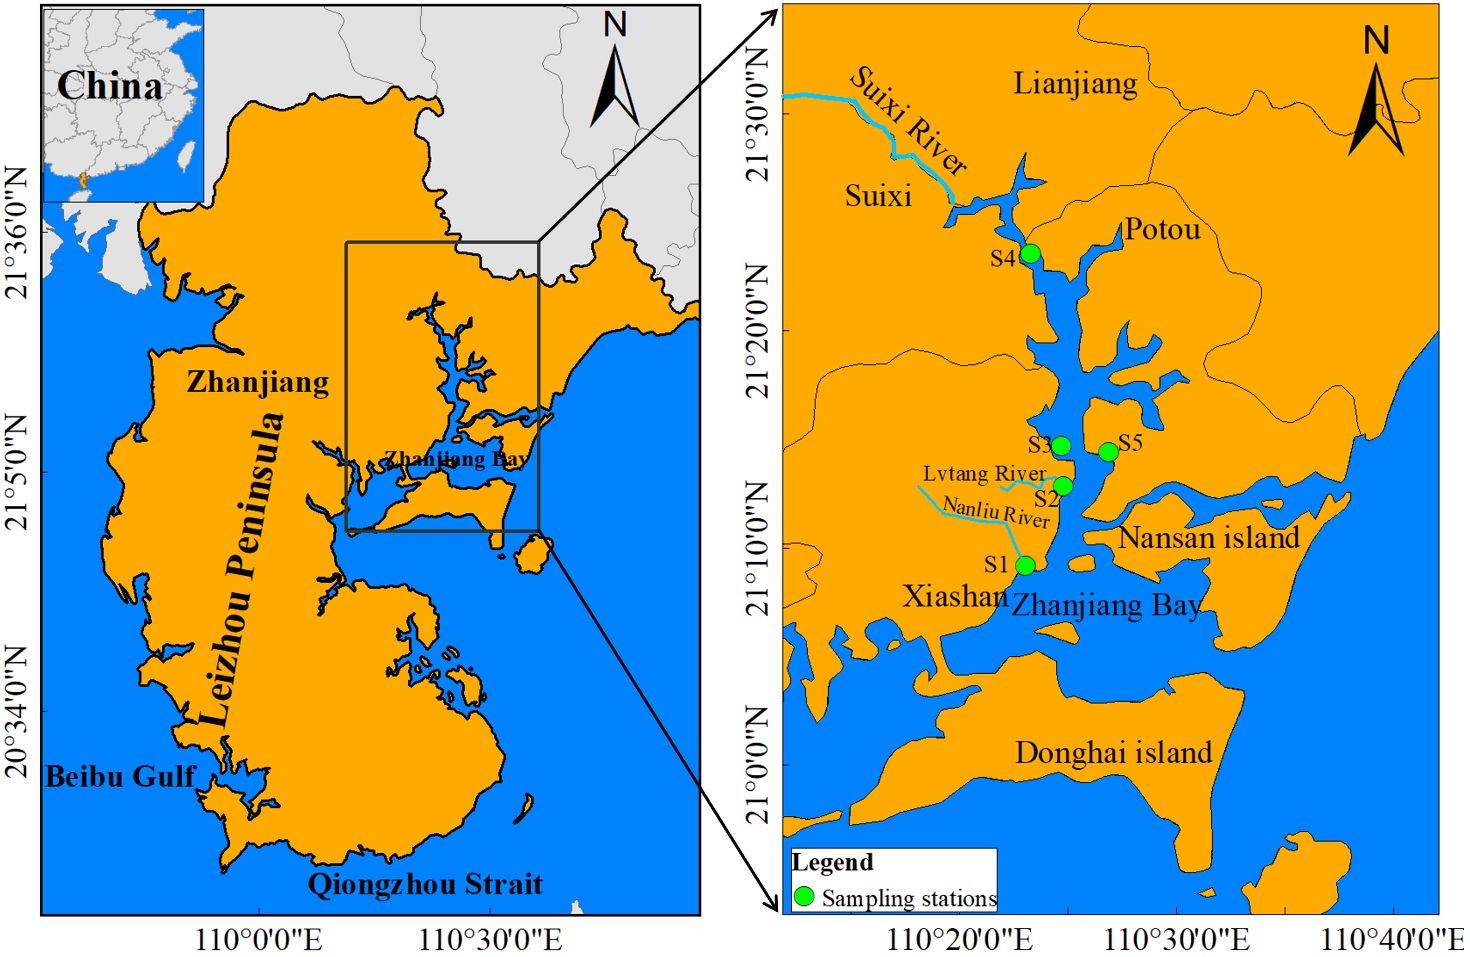
Figure 1 Geographic location and the location of the five sampling stations at the land-source entry point of Zhanjiang Bay (ZJB).

Table 1 Investigation of estuaries and sewage outlets.
The mangrove forests are in the estuarine and coast zone, which is easily impacted by the river discharge and wastewater input by human activities. Nanliu River (S1) is situated in close proximity to industrial plants, including fertilizer production plants, which transport significant quantities of treated industrial wastewater to coastal waters (Zhang et al., 2019). Lvtang River (S2) is heavily polluted due to the discharge of urban sewage. Sino-Australian Garden (S3) is a popular tourist attraction with a water surface area of 42, 400 m2. The northern part of ZJB is fed by the Suixi River (S4) with an area of 1486 km2. It carries runoff from major agricultural areas and is the largest freshwater flow into ZJB (Zhang et al., 2019; Zhang et al., 2020b). S5 is the Potou Primary School, which has a large population in the vicinity.
2.2 Sampling and analysis methods
Sampling was completed on 30th October, 2021, and all tools were cleaned with Milli-Q water before sampling. Two separate sample squares measuring 1.5 m x 1.5 m, spaced 2 m apart, were randomly set up at the sampling stations. Surface sediment (0-5 cm) was collected using a clean stainless steel grab sampler to remove debris such as gravel and shells. The collected sediment was then transferred to a clean aluminum box with markers. Each sediment sample consisted of at least1 kg of wet sediment. A total of 20 surface sediment samples (10 points × 2 replicates) were collected. It is crucial to avoid any contamination during transportation to the laboratory for research.
The MPs were identified using the method proposed by Masura et al. (2015) with modifications. The samples underwent pre-treatment, mainly for ablation and the measurement of particulate organic carbon. Following pre-treatment, the MPs were quantified and characterized. To avoid contamination, sediment samples were first spread evenly in an aluminum tray, covered with aluminum foil, and dried in an oven at 75°C. A solution of sodium chloride (450 ml, density 1.2 g/cm3) was added to a 1 L beaker containing 200 g of dried sediment. The mixture was stirred for 5 minutes and left to stand for 15 minutes until the suspended solids settled. The upper layer of liquid was passed through a 45 μm stainless steel sieve and the residue on the sieve was washed three times with ultrapure water and then transferred to a 250 ml beaker. To avoid interference to natural organic matter in the sediment, a solution of 90 ml of 30% H2O2 and 90 ml of 0.05 M FeSO4 was added to the beaker for disintegration. The beaker was then heated in a water bath at 75°C for 12 hours and cooled at room temperature (25°C) for 24 hours. The samples were vacuum filtered through a 10 µm cellulose acetate filter membrane and covered with aluminum foil. Finally, the filter membranes were dried in an oven at 60°C to facilitate further analysis. Content of organic carbon of each sediment sample was estimated by loss on ignition (LOI) (Samper-Villarreal et al., 2016; Huang et al., 2021). The mean precision of the ratio of organic carbon to organic matter (LOI) was 12.0% in this study. To measure particulate organic carbon (POC), the sediment was dried in an oven at 60°C for 12 hours and weighed to determine its density after drying. The sediment was then burned in a muffle furnace at 500°C for 4 hours, and the burn-off rate was measured (Huang et al., 2021).
MPs were systematically quantified using a stereomicroscope (Nikon SMZ1270, Tokyo, Japan) at magnifications up to 40 × 40 for MPs ranging from 0.45 to 5 mm (Masura et al., 2015). The following criteria must be met to distinguish MPs particles by visual inspection. The particles must not be broken off; they must be clearly and uniformly colored and free of cells and organic structures (Hidalgo–Ruz et al., 2012). The microscope was connected to a computer to capture images, and photographs were taken in zigzag mode until every position was captured (Tang et al., 2018). MPs abundance was calculated as items/kg dry sediment weight (items/kg d.w) and MPs were classified by shape (fibrils, fragments, and films), color (black, multicolored, blue, yellow, red, transparent, pink, green and purple) and size (length: 45-100, 100-330, 330-500, 500-1000, 1000-2000, 2000-5000 μm). In this study, a miniature Fourier transforms infrared spectrometer (Frontier, PerkinElmer, Waltham, MA, USA) was used to identify common suspicious types of MPs. Suspicious MPs identified by visual inspection were randomly selected for verification. The obtained spectra were verified by comparison with the spectrogram database on the instrument. MPs were identified only if the match rate was higher than 70% (Hidalgo–Ruz et al., 2012).
2.3 Quality assurance and control
Samples were collected according to the latest quality assurance and quality control standards with strict control measures (Koelmans et al., 2019; Adomat and Grischek, 2020). Collected sediments were preserved in metal samplers and containers to avoid contamination. Non-textile laboratory overalls, masks, and nitrile gloves were worn throughout sample collection, extraction, and identification to avoid the use of plastic-containing laboratory equipment (Masura et al., 2015). All laboratory equipment was rinsed three times with Milli-Q water before and after use (Prata et al., 2020). During the experiments, all solutions, including FeSO4 and Milli-Q water, were filtered through a 45 µm filter before use. Filtered Milli-Q was used as a blank in the laboratory and processed using the same procedure as the samples (Zhu et al., 2021). The final data were corrected for the average abundance of MPs in the corresponding blank group. These procedures were used to prevent interference from external MPs.
2.4 Enrichment index and diversity index of microplastics
The diversity index D’ (MPs) was calculated according to Equation 1 to estimate the complexity of MP types and sources in mangrove and non-mangrove sediments in ZJB. In total, three types of D’ (MPs), namely size D’ (MPs), color D’ (MPs), and shape D’ (MPs), were calculated based on their shape, color, and size characteristics, respectively (Wang et al., 2019; Huang et al., 2020b; Huang et al., 2021).
Where S is the number of MPs categories, Ni is the number of MPs categorized into the ith type, and N is the total number of MPs in the sample.
The enrichment index (EI) is the ratio of mangrove MPs abundance to non-mangrove MPs abundance. EI is calculated using Equation 2 (Huang et al., 2021). EI > 1 indicates that MPs are enriched in mangroves and EI< 1 indicates that MPs are enriched in non-mangroves.
Where Am is the MPs abundance in mangroves and An is the MPs abundance in non-mangroves.
Total organic carbon (TOC) calculated by regression line of Equation 3 burning loss rate and soil organic carbon mass fraction.
where x is the burn-off rate and y is the soil organic carbon mass fraction.
2.5 Statistical analysis
Station locations were mapped using ArcGIS 10.2 (Esri Corporation, New York, USA). Data were analyzed using Microsoft Excel 2019 and plotted and analyzed using Origin 2022, including MPs characteristics (abundance, shape, color, size, and diversity) of mangrove and non-mangrove sediments. Confidence intervals were set at 95% for all tests. One-way ANOVA was performed using IBM SPSS Statistics 26 software. MPs shape, color, size, and diversity were analyzed using a multi-way ANOVA (two factors of station location and whether it was mangrove). Values were considered statistically significant when P < 0.05; P < 0.01 indicated highly significant; and P > 0.05 indicated no significance.
3 Results
3.1 MPs patterns in different areas of the sediment
Figure 2 displays the variation in MPs abundance in sediments from both mangrove and non-mangrove areas in ZJB region. MPs were detected in all sediment samples collected from the five stations in ZJB. The abundance of MPs was significantly higher in all mangrove sediments than in non-mangrove sediments (P < 0.05). The mean abundance of MPs in non-mangrove sediment samples was 263.67 ± 85.25 items/kg, compared to 618.17 ± 71.75 items/kg in mangrove sediment samples. The non-mangrove sediment sample from NLR (S1) had the highest abundance of MPs (589.17 items/kg), while the lowest abundance (76.67 items/kg) was found in Sino-Australian Garden (S3). Among the mangrove sediment samples, the highest abundance of MPs (891.67 items/kg) was found at Sino-Australian Garden (S3), while the lowest abundance (351.67 items/kg) was found at Potou Primary School (S5). The sediment samples showed the highest and lowest abundances of MPs at S3, which was the most variable of the five stations.
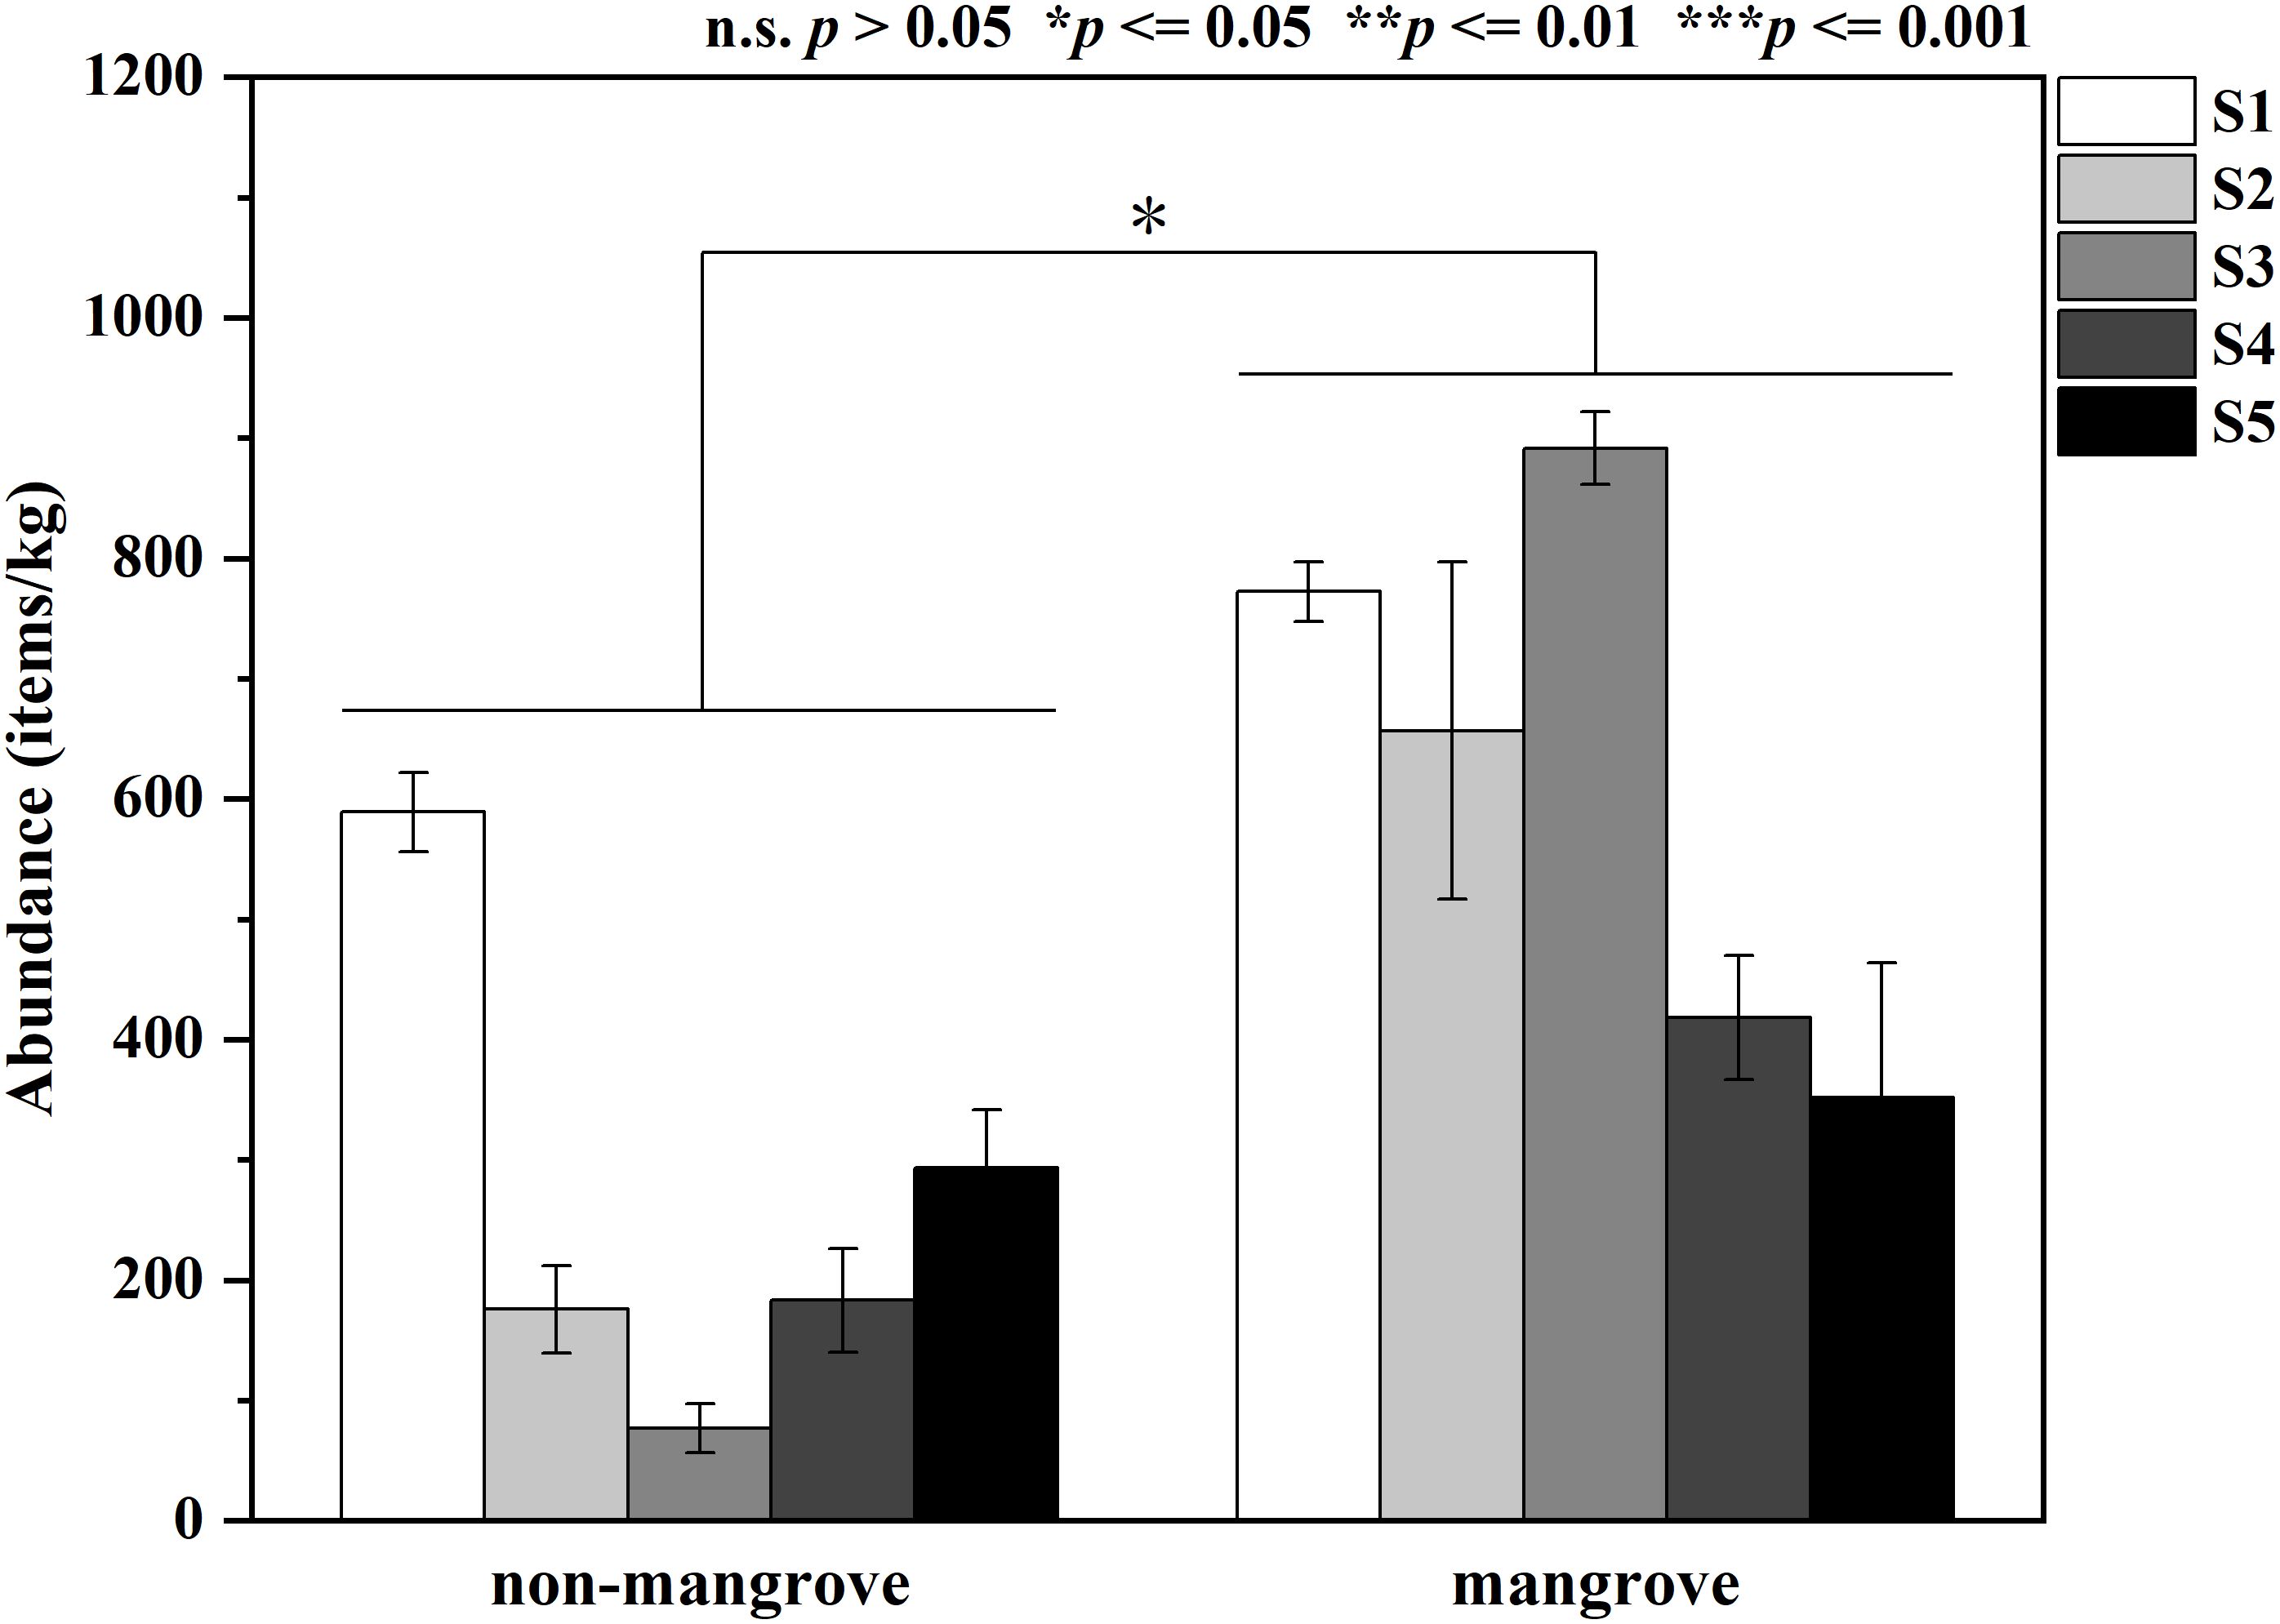
Figure 2 Variation of microplastics (MPs) abundance in the studied mangroves and non-mangrove forests.
3.2 MPs characteristics and diversity of different areas in the sediment
The study analysed the sample sizes of MPs, which were divided into six categories: 0-100 µm, 100-330 µm, 330-500 µm, 500-1000 µm, 1000-2000 µm, and 2000-5000 µm (Wang et al., 2022; Zhang et al., 2022). The size of the MPs did not differ significantly between station (P > 0.05). As shown in Figure 3A, 100-330 µm was the most abundant size category across all five stations, accounting for an average of 37.30%. The total number of MPs < 500 µm at the five stations was 63.36% and 55.31% at non-mangrove and mangrove stations, respectively.
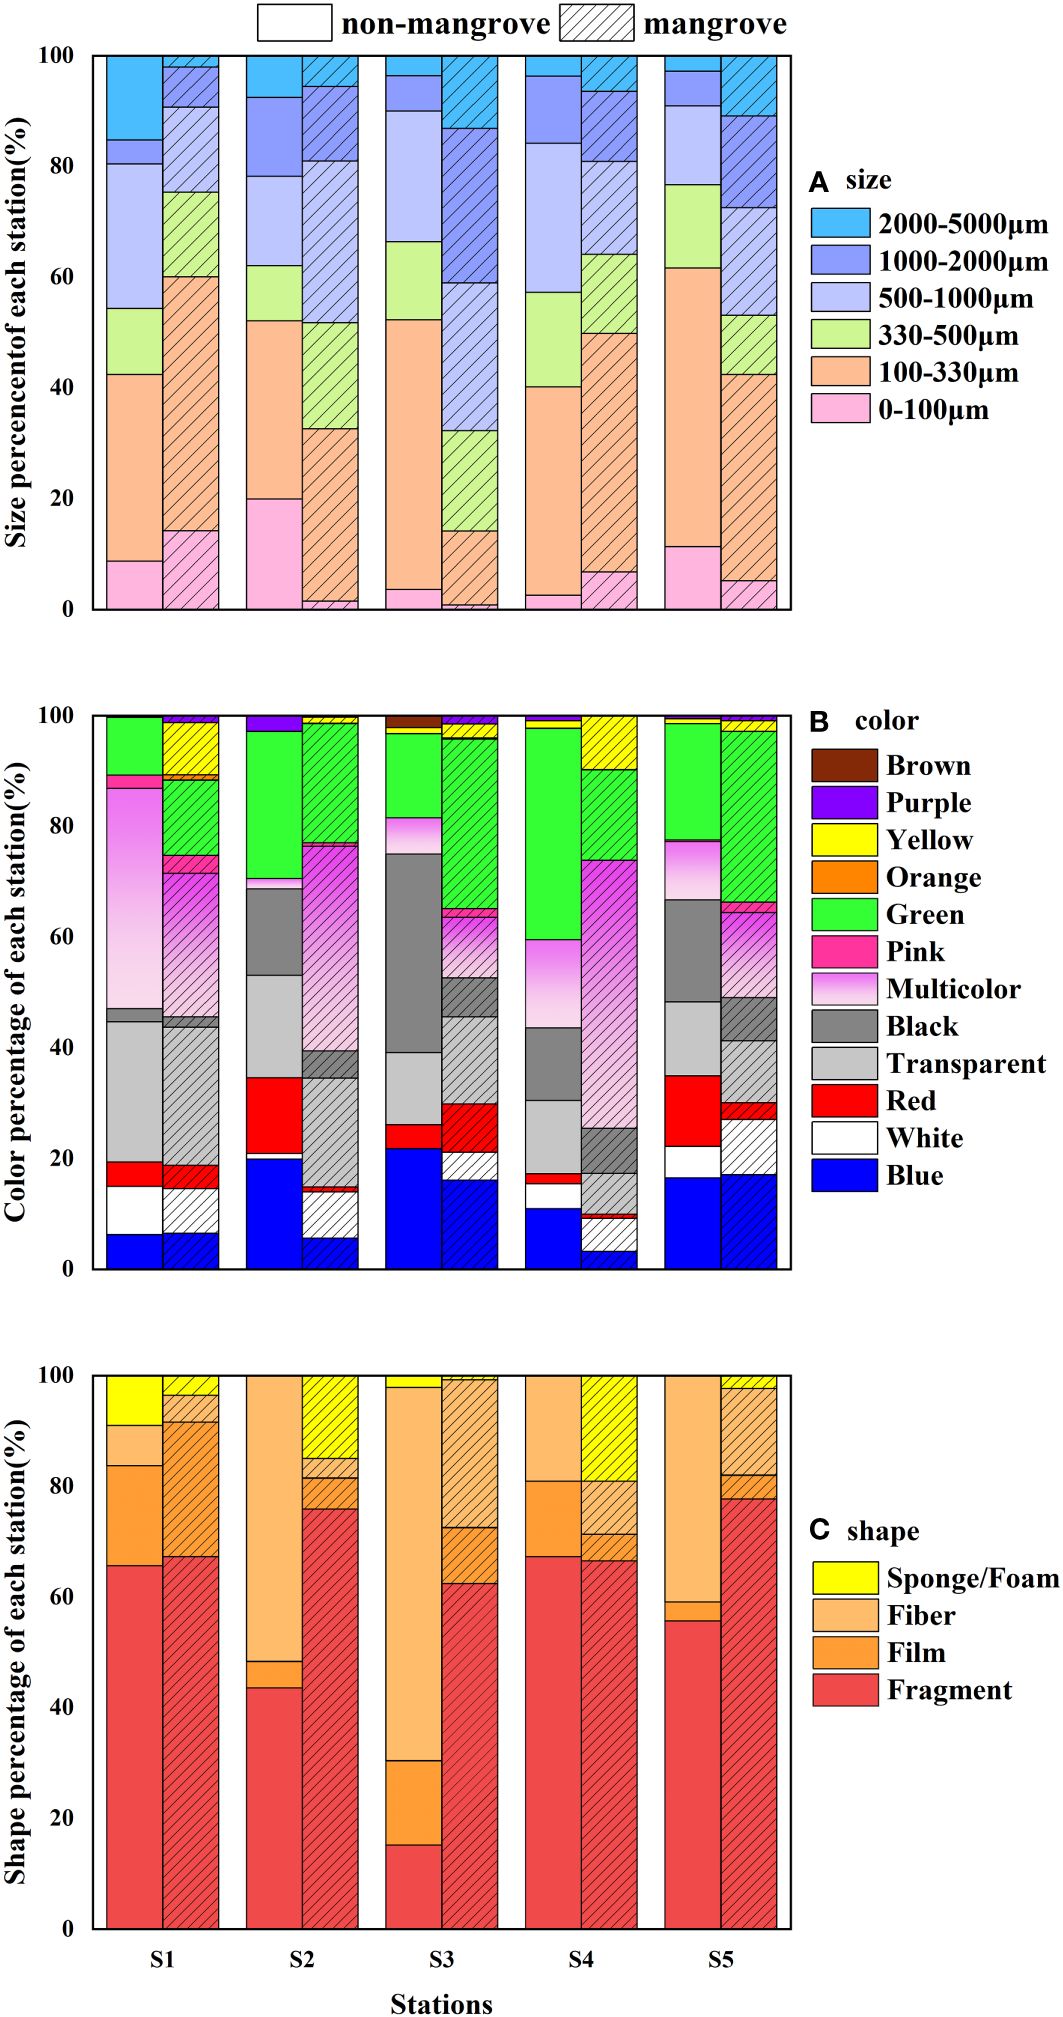
Figure 3 Characteristic percentage variation of MPs in mangrove forests and non-mangrove forests (A) size, (B) color, and (C) shape.
Based on the survey results of the survey, a total of 12 colors of MPs were identified, as shown in Figure 3B. MPs colors did not differ significantly between sampling areas (P > 0.05). Among all MPs in the non-mangrove sediment samples, green was the predominant color (22.28%), followed by black (17.11%), transparent (16.67%), blue (15.05%), and multicolor (14.91%). Other colors accounted for less than 10%. In this study, multicolor (27.51%) was the most abundant in the mangrove sediment samples, followed by transparent and blue MPs, accounting for 15.78% and 9.67%, respectively. Other colors accounted for less than 10%. Orange and brown were the least common colors found in the study in both mangrove and non-mangrove sediment samples.
The relative abundance of different shapes of MPs was shown in Figure 3C. No significant differences were found in the shapes of the MPs detected from the different areas (P > 0.05). All samples contained four distinct shapes: fragments, films, fibers, and sponges (foams). The majority of identified MPs were fragments, accounting for 49.48% and 69.98% of all non-mangrove and mangrove samples, respectively. Fibers were the second most common shape across all stations, accounting for 37.25% and 12.07% of MPs, respectively. Overall, fragments were more prevalent in the samples from this study.
Figure 4 shows typical MPs characteristics and compositions of MPs captured in the sediments by micro-Fourier Transform infrared (FTIR) spectroscopy. Major polymers were found in selected samples of black fragment (A), red fiber (B), transparent film (C), and white fragment (D); with major types including polypropylene (A), polyethylene (B), polypropylene (C), and docosanol (D).
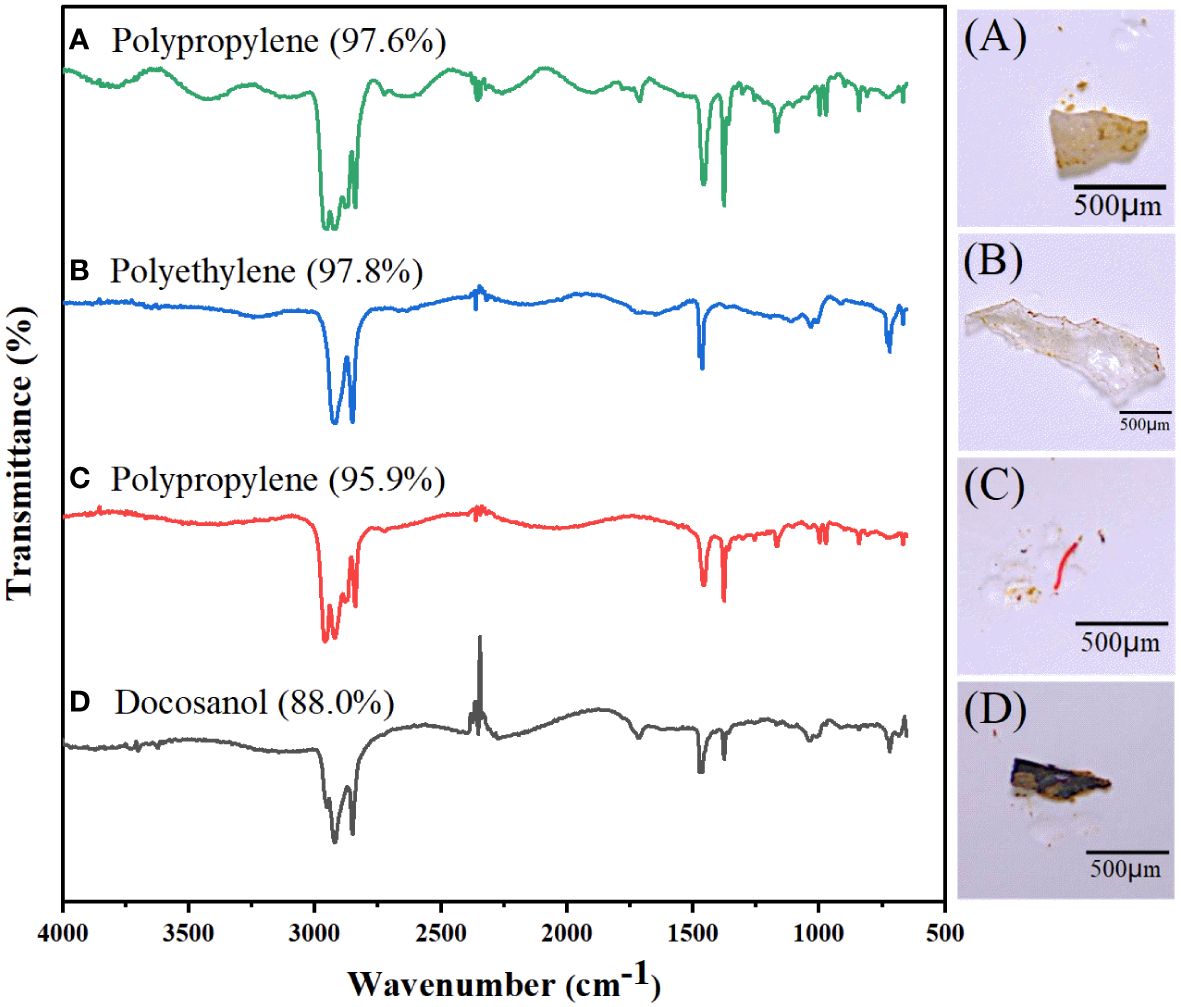
Figure 4 Typical MPs and composition in sediments. (A) Black fragment, (B) Red fiber, (C) Transparent film, and (D) White fragment.
3.3 Diversity and enrichment patterns of MPs in mangrove blue carbon ecosystem
The diversity of MPs size, color, and shape indices, i.e. size D’ (MPs), color D’ (MPs), and shape D’ (MPs), were calculated separately according to equation (1). The results showed the abundance of sediment MPs in the samples (Figure 5). There were no significant differences in the diversity of D’ (MPs), D’ (MPs), and D’ (MPs) in different areas (P > 0.05). The results of this study showed that the diversity of color, size, and shape of MPs in mangroves was changing and mostly showed a decreasing trend. The diversity of color, size, and shape of MPs in non-mangrove samples was 0.77 ± 0.02, 0.72 ± 0.03, and 0.50 ± 0.07, respectively. The diversity of color, size, and shape of mangrove MPs was 0.77 ± 0.06, 0.75 ± 0.02, and 0.45 ± 0.05, respectively. The enrichment index of the mangroves was calculated according to equation (2) and the results showed that for all the mangroves studied the EI values were greater than 1 and the enrichment index ranged from 1 to 12 (Figure 6).
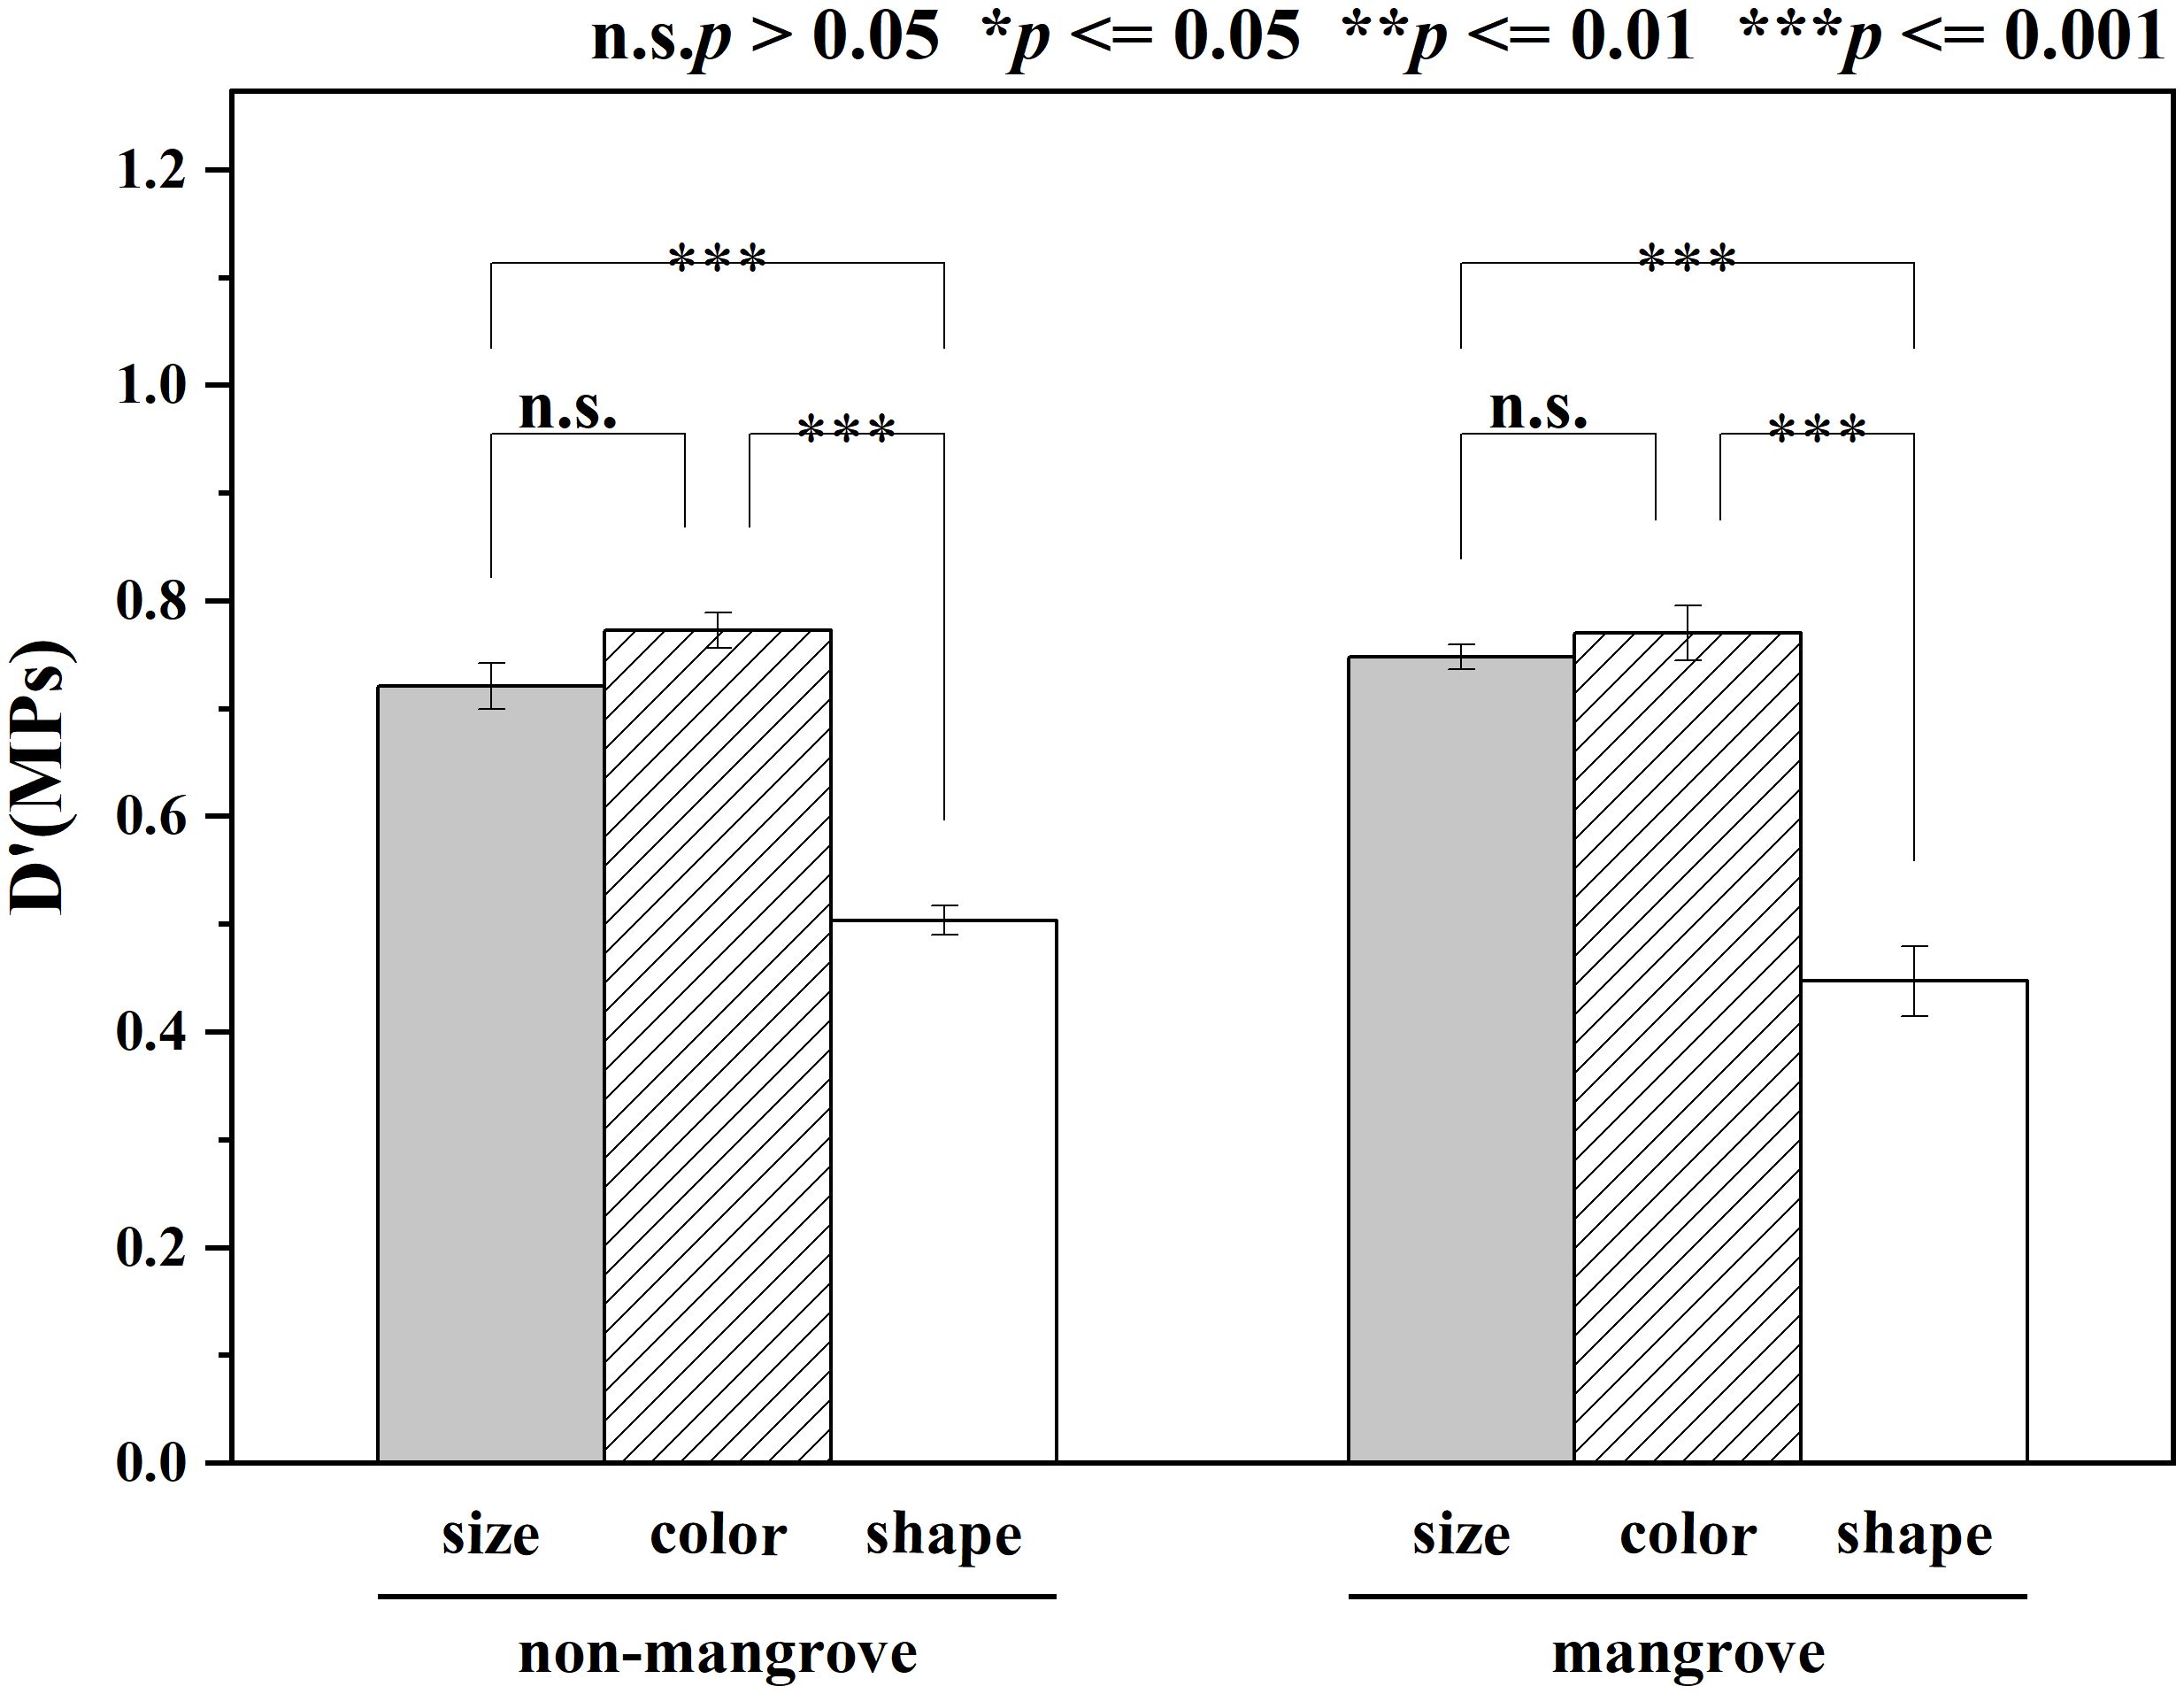
Figure 5 Variation in the diversity of mangrove MPs in ZJB.
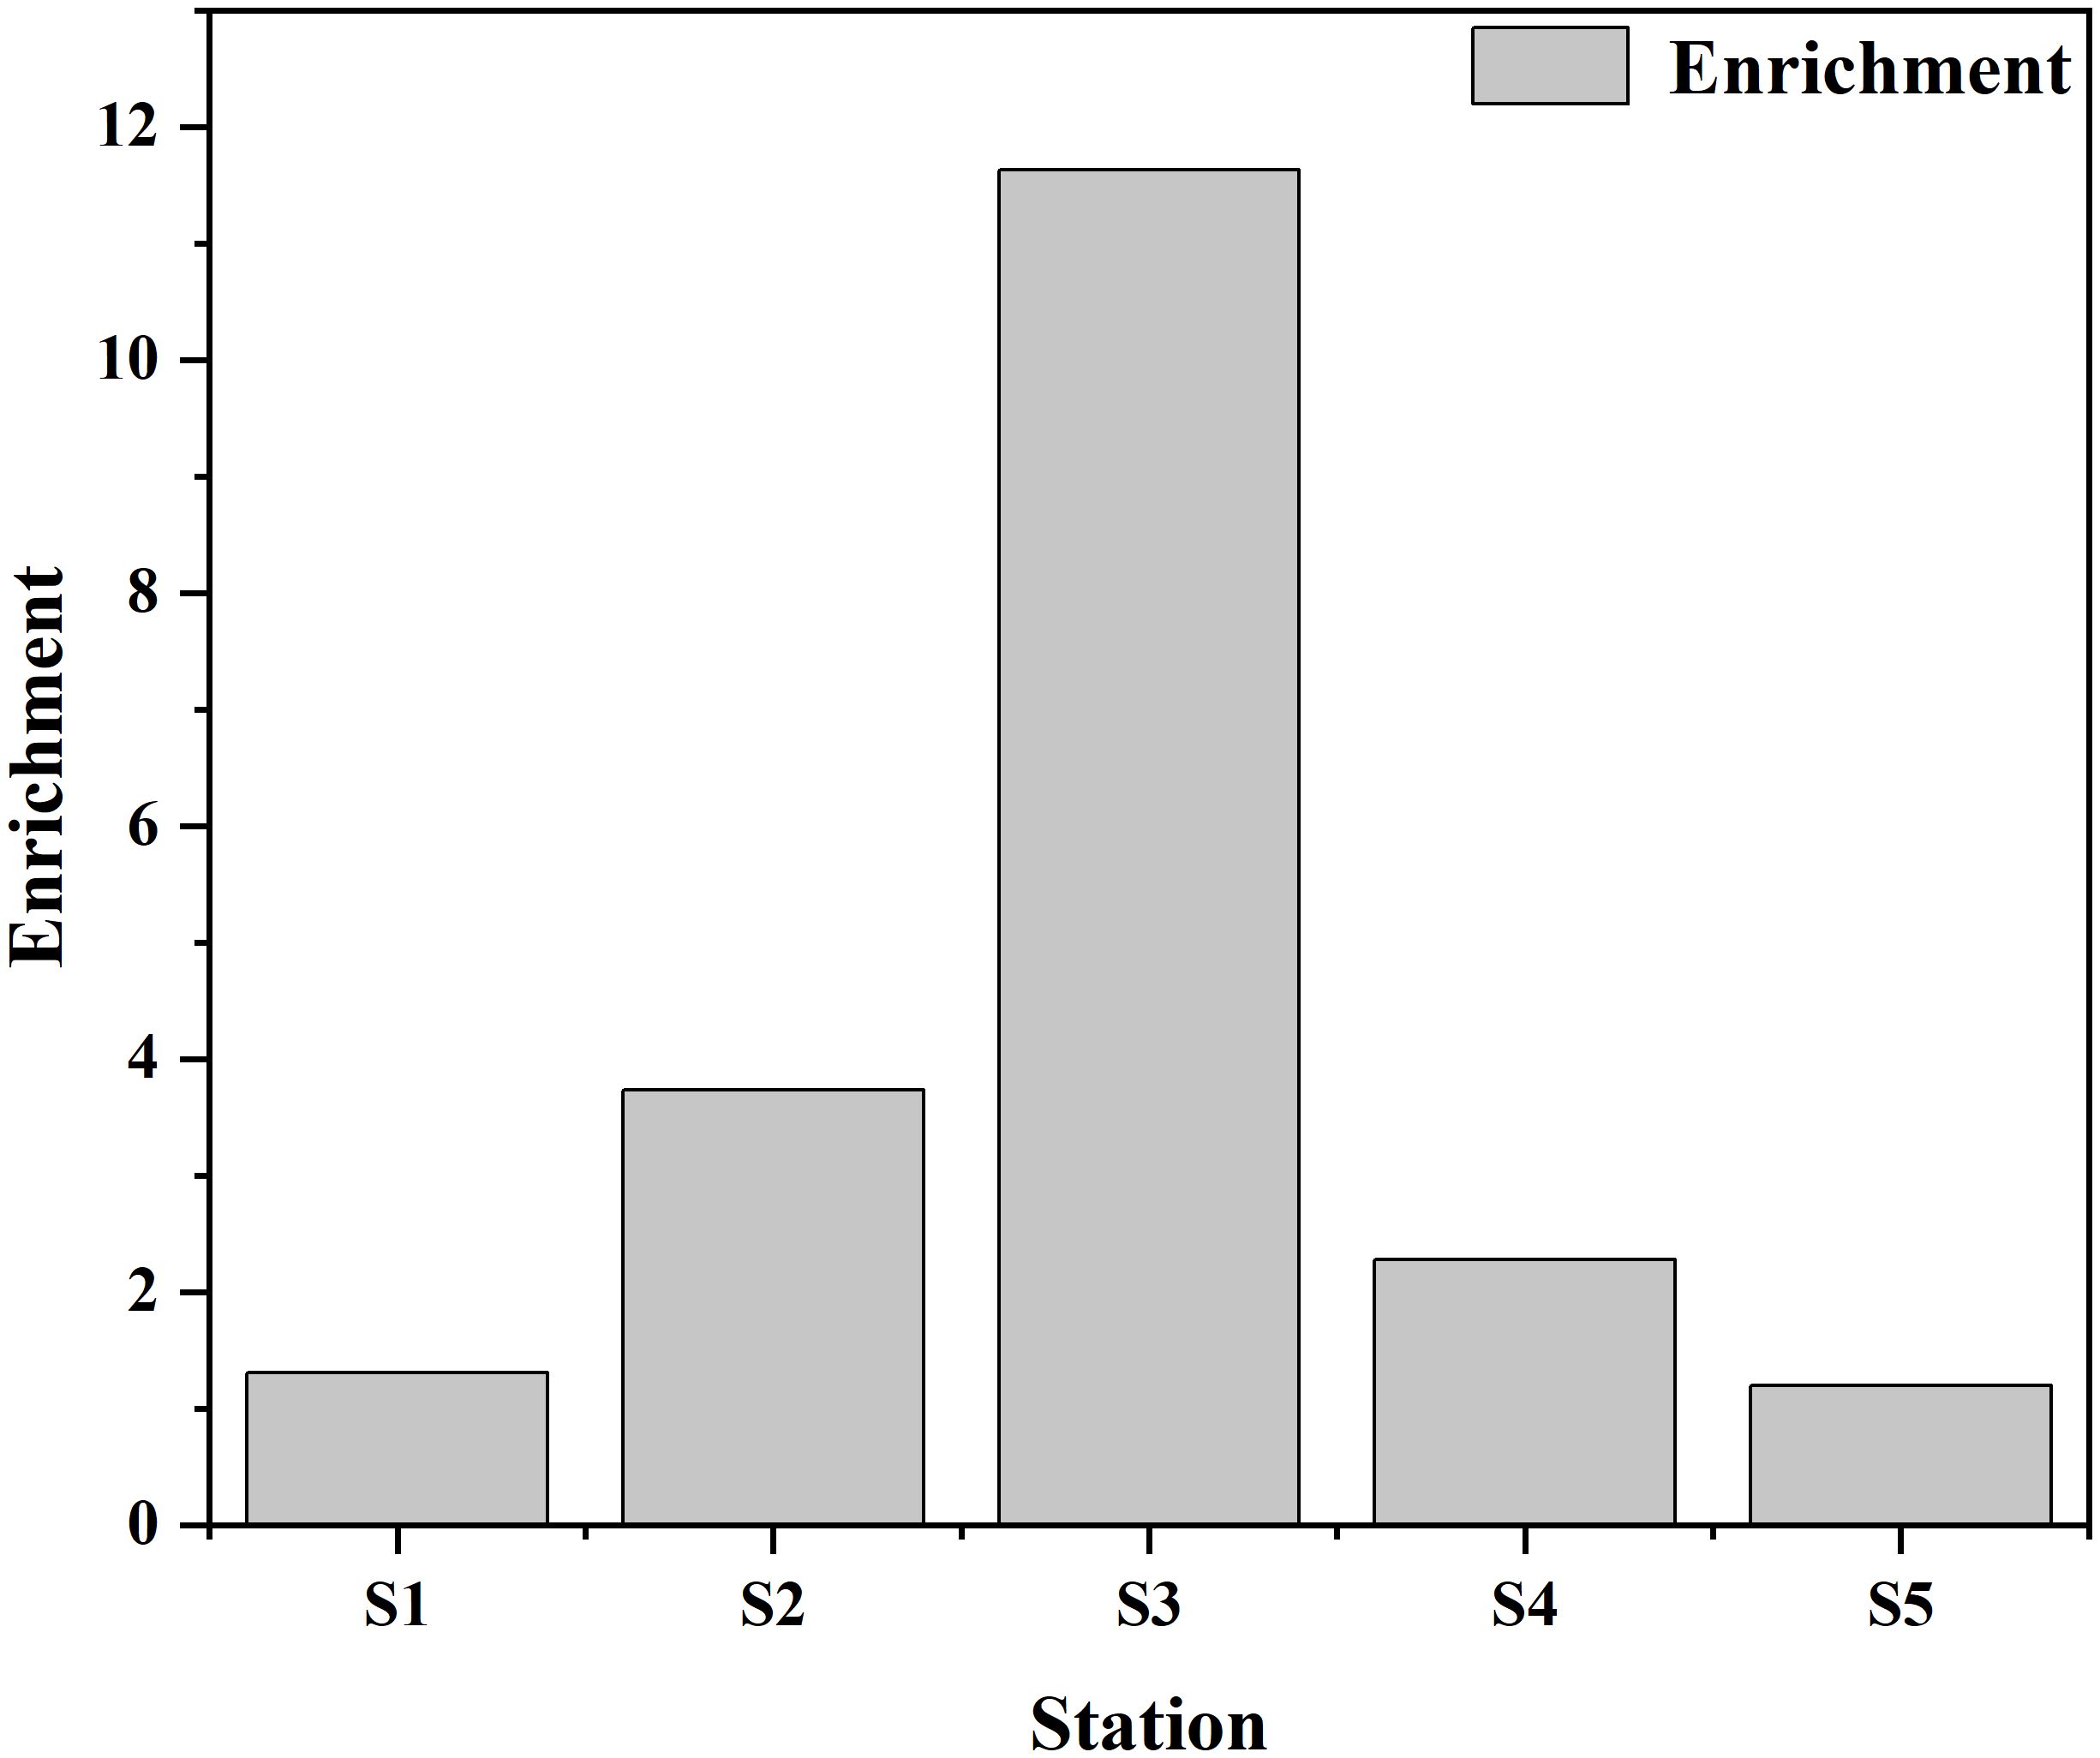
Figure 6 Enrichment patterns of MPs in mangrove blue carbon ecosystem.
3.4 Interactions between particulate organic carbon (POC) and MPs abundance
The POC for both mangroves and non-mangroves stations are shown in Figure 7. It can be seen that particulate organic carbon was higher in mangrove areas than that in non-mangrove stations, with the highest and lowest POC occurring at the same sampling point. In the mangrove sediment samples, the mean POC was 13.12 g/cm3 with the highest POC in NLR (S1) (16.66 g/cm3) and the lowest in LTR (S2) (9.76 g/cm3), and in the non-mangrove sediment, the mean POC was 11.01 g/cm3 with the highest in NLR (S1) (13.72 g/cm3) and the lowest POC in LTR (S2) (9.16 g/cm3). There was no significant difference in POC between mangrove and non-mangrove areas (P > 0.05).

Figure 7 Changes in POC in the mangrove and non-mangrove forests.
4 Discussion
4.1 Influencing factors of MPs pollution in Zhanjiang Bay
MPs abundance varies between sampling stations in different regions. Human activities have been found to influence MPs abundance, such as agricultural activities, aquaculture (Hinojosa and Thiel, 2009), wastewater discharge (Gies et al., 2018), tourism activities, residential life, tidal action (Zhang et al., 2022), and seasonal variations (Wang et al., 2022). A comparison of MPs abundance in dry mangrove sediments from different regions is shown in Table 2. The MPs abundance in ZJB is intermediate compared to foreign contamination, including Muara Angke Wildlife Reserve of Indonesia (28.09 ± 10.28 items/kg), Northern Persian Gulf of (19.5 to 34.5 items/kg), Kuala Muda of Malaysia (430 ± 7.234 items/kg), Penaga of Malaysia (940 ± 15.773 items/kg), Seberang Perai of Malaysia (4000 ± 29.174 items/kg) (Naji et al., 2019; Cordova et al., 2021; Tan and Mohd Zanuri, 2023). Compared with mangrove sediments from other regions of China, it was much higher than that of the North Yellow Sea (37.1 ± 42.7 items/kg), Beibu Bay (26.67 ± 9.43 to 239.94 ± 37.80 items/kg), inside the mangrove of Qinzhou Bay (42.9 ± 26.8 items/kg) (Zhu et al., 2018; Li et al., 2018a; Zhang et al., 2022), lower than outside the mangrove of Qinzhou Bay (2174.5 ± 2206.8 items/kg), Pearl River Estuary, South China (851 ± 177 items/kg), the fringe in Futian mangrove in Shenzhen Bay (2835 ± 713 items/kg) (Li et al., 2018a; Zuo et al., 2020; Duan et al., 2021). Each study may have used a different MPs extraction method and different filters will result in subtle differences. In this study, the abundance of MPs in sediments from mangrove areas in ZJB was 1-11 times higher than in non-mangrove areas, a result that is consistent with other studies, suggesting that mangroves trap some of the sediment and do not allow MPs to fully flow into the ocean (Liu et al., 2022).
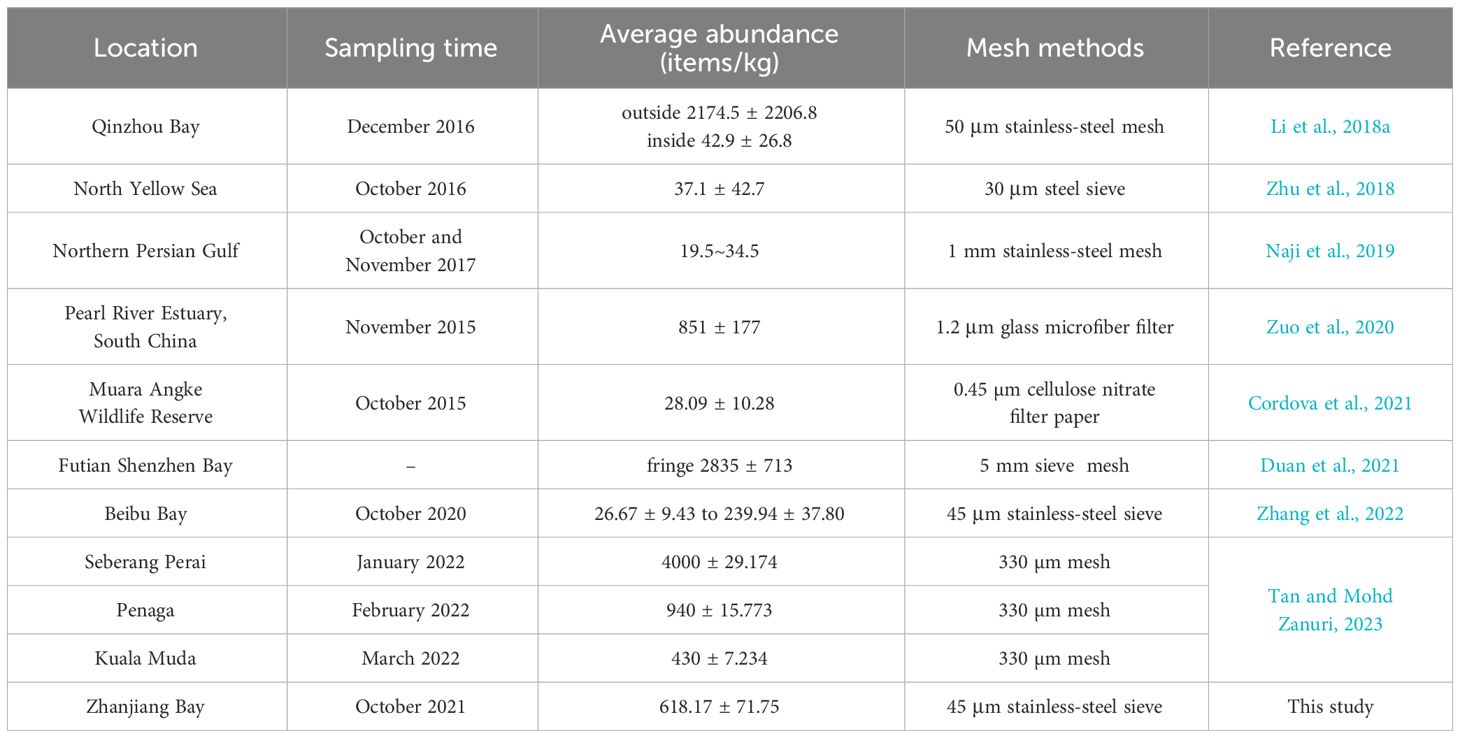
Table 2 Comparison of the abundance of MPs in ZJB with other mangrove sediments.
The shape, color, size, and other characteristics of MPs are key factors in determining the source of MPs. Comparing the five stations, the abundance results showed that the Nanliu River (S1) may be the river with the highest amount of MPs due to the presence of many industrial plants in its vicinity, and the effluents from the plants contained large amounts of MPs, which were discharged into the nearby rivers and thus flowed into the ocean (Zhang et al., 2019). The large difference in MPs between mangroves and non-mangroves in Sino-Australian Garden (S3) may be due to the large distance between the locations of the two sets of samples collected, coupled with the fact that this is a tourist attraction where plastic waste is not properly disposed of and exposed to the environment, thus decomposing into MPs through various effects, with the intermediate anthropogenic factors dominating the results. The MPs in Suixi River (S4) may be due to the high river discharge and fast flow rate, resulting in the input of MPs from the river (Wang et al., 2022). Both the Lvtang River (S2) and the Potou Primary School (S5) were due to the input of MPs from nearby residential life into the river. 80% of the MPs were smaller than 1000 μm in size. All mangrove and non-mangrove samples contained more fragments than other shapes, which could be fragments of MPs left behind by fishing gear during fishing (Li and Liu, 2018). Transparent MPs were the most frequently detected in both mangroves and non-mangroves combined, most likely from transparent plastic products from the daily lives of the surrounding population (Liu et al., 2022).
4.2 MPs characteristics, diversity, and enrichment in sediment
4.2.1 Shape
Human activities are considered to be the main cause of the spatial distribution of MPs in marine and river sediments (Machado et al., 2019). The higher proportion of sediment samples from the five stations in this study were fragments, with fibers being the second most common shape, with mangrove and non-mangrove groups presenting the same results. The main shape was same to the previous in water samples from the land-based sources (Wang et al., 2022). A major reason for this result was the land-based source water inputs affected by the human activities such as human living and aquaculture (Wang et al., 2022). Among them, the fragmented shape may be due to MPs left by fishing gear during fishing (Li and Liu, 2018), or the degradation of plastic waste generated the lives of nearby residents, such as cosmetics used in daily life. MPs are added to cosmetics, and MPs in cosmetics can be absorbed into the skin (Kannan and Vimalkumar, 2021), but MPs left on the skin are washed down the drain and into the ocean. Which become brittle during weathering, such as photodegradation, biodegradation, thermal degradation, mechanical damage, and hydrolysis, breaking into smaller fragments and increasing fragment content (Wang et al., 2022). In addition, the fiber may come from damage to fibrous fishing gear such as nets (Rebelein et al., 2021; Wang et al., 2022), and residual fibers discharged into untreated domestic sewage such as washing machines (Cole et al., 2011; Napper and Thompson, 2016). Foam buoys for aquaculture produce foam (Li et al., 2018a). Increased levels of MPs are a direct result of increased levels of MPs in marine organisms, which are widespread in fish species in studies by Huang et al. (2020a), most likely due to the large amounts of plastic fragments trapped in mangroves. Over time, plastic particles can contaminate marine ecosystems and food chains, including food for human consumption (Lusher et al., 2017).
4.2.2 Color
The characteristic feature of color presents different results for the two major groups of samples. Previous studies have shown that the predominant color of MPs in mangrove sediments was white or transparent (Young and Elliott, 2016; Li et al., 2018a), and in the present study, the proportion of transparent MPs particles, although not the highest, was 15%, which was likely to come from plastic bags used in the life of the surrounding residents and by people visiting the area (Liu et al., 2022). Green MPs particles were relatively rare in other studies, whereas they were quite common in non-mangrove sediment samples (22.28%), possibly originating from textile washing, where a single garment wash can produce over 1900 MPs (Browne et al., 2011). Multicolor was the most common in mangrove sediment samples, which was consistent with MPs color the in the water samples from land-based sources in the previous study (Wang et al., 2022). It is most likely from MPs introduced into the mangrove via wastewater from various human activities, such as the domestic and industries waste water (Maghsodian et al., 2021).
4.2.3 Size
In this study, the size of MPs in the two major groups of samples, mangrove, and non-mangrove sediments, ranged from 45 to 1000 µm. The results of the two major groups were consistent, with the MPs being most abundant in the 100-330 µm size range. It indicated the that the MPs in the mangrove, and non-mangrove sediments were all from the land-based sources discharge (Wang et al., 2022). The water from the land-based sources was heavily polluted by human activities, such as industrial and domestic untreated waste water discharge (Zhang et al., 2021). Besides, the some microorganisms in mangrove ecosystems have good MPs degradation ability under the special environment of high temperature, strong light, high salinity, and humidity (Auta et al., 2017). The degradation rates of PE MPs by Bacillus cereus and Bacillus gottheilii isolated from mangroves in the Malaysian Peninsula were 1.6% and 6.2%, respectively (Auta et al., 2017). However, the degradation rate was slow, which contributed to the higher proportion of medium particle sizes in mangroves. Besides, small size MPs have a higher surface-to-volume ratio than large-size MPs, which increases the adhesion of small-size (Huang et al., 2021). As MPs are similar in size to natural foods, this enhanced the risk by fish to ingest MPs (Ory et al., 2017).
4.2.4 Diversity and enrichment
There were no significant differences of the diversity of D’ (MPs), D’ (MPs), and D’ (MPs) between mangroves and non-mangroves. This can be attributed to the same land-based sources inputs under human activities influences (Wang et al., 2022), resulting in less diversity of MPs in mangroves than in non-mangroves. However, the results showed that the size and color diversity were greater than the shape in mangroves and non-mangroves. These results were consistent with the previous study in the seasonal diversity variation of MPs from land-based sources and the Beibu Gulf mangrove sediments (Wang et al., 2022; Zhang et al., 2022). In addition, in this study, the highest S3 MPs abundance was found in the mangrove sampling area with an EI value of 11.63. The higher abundance of MPs in mangroves compared to non-mangroves also indicated the retention of MPs by mangroves. In the S3 sampling stations, this may be caused by the untreated domestic waste water source discharge into estuary (Wang et al., 2022). Besides, the different enrichment index of MPs in the different sampling stations indicated that the different human activities impact. The degree of impact varies depending on the sources of the estuaries and outfalls, such as industry, tourism or agriculture (Zhang et al., 2019, 2021).
4.3 Interactions of POC and MPs abundance in mangrove blue carbon system
According to the regression line analysis of MPs abundance and POC, MPs abundance was not significantly correlated with POC (P > 0.05) (Figure 8). It was possible that MPs abundance was not correlated with POC due to the high variability in estuarine flow dynamics, which prevented MPs from aggregating easily in the sediment. It was also possible that the sample data collected was too small to support a relationship between MPs abundance and POC, which needs to be investigated further. In addition, the relationship between MPs and POC could be explored if more samples could be collected from different stations. Galgani et al. (2019) found that plastics have the potential to alter carbon sequestration and carbon turnover, with MPs increasing the production of organic carbon and its aggregation into gelatinous particles, and an increase in gelatinous organics may affect marine bio-pumping and transport of MPs in the ocean, which can affect the ocean nutrient cycling and the global ocean productivity. Blue carbon stocks were not only provided by internal carbon sources, but also by external sources such as phytoplankton, algae, seagrass meadows, mangrove debris, and terrestrial sources (Röhr et al., 2016; Huang et al., 2021). Many studies have concluded that MPs abundance in sediments has a high positive correlation with organic carbon (Chen and Lee, 2021). However, it has also been suggested that MPs abundance was not necessarily positively correlated with sediment organic carbon content and that regional and anthropogenic influences need to be considered (Zhou et al., 2023), and our results were consistent with this. Blue carbon ecosystems, where the presence of submerged vegetation (e.g., mangroves) reduces water velocity through interception to store carbon, may also lead to the accumulation of MPs particles, which can adversely affect vegetation growth and thus its ability to sequester carbon (Huang et al., 2021). In addition, environmental MPs can enter plant tissues and adversely affect photosynthesis and metabolism (Dad et al., 2023), which indirectly affects the global carbon cycle by decreasing the efficiency of plants in sequestering and utilising atmospheric carbon dioxide, contributing to the global greenhouse effect (Li et al., 2024). Based on the experimental results, it indicated that MPs pollution had not yet had a significant impact on the blue carbon system. Both the abundance of MPs and the content of POC were higher in mangrove areas than in non-mangrove areas, and it can be predicted that MPs were much higher in mangrove areas than in non-mangrove areas. This also suggested that mangroves could trap MPs.
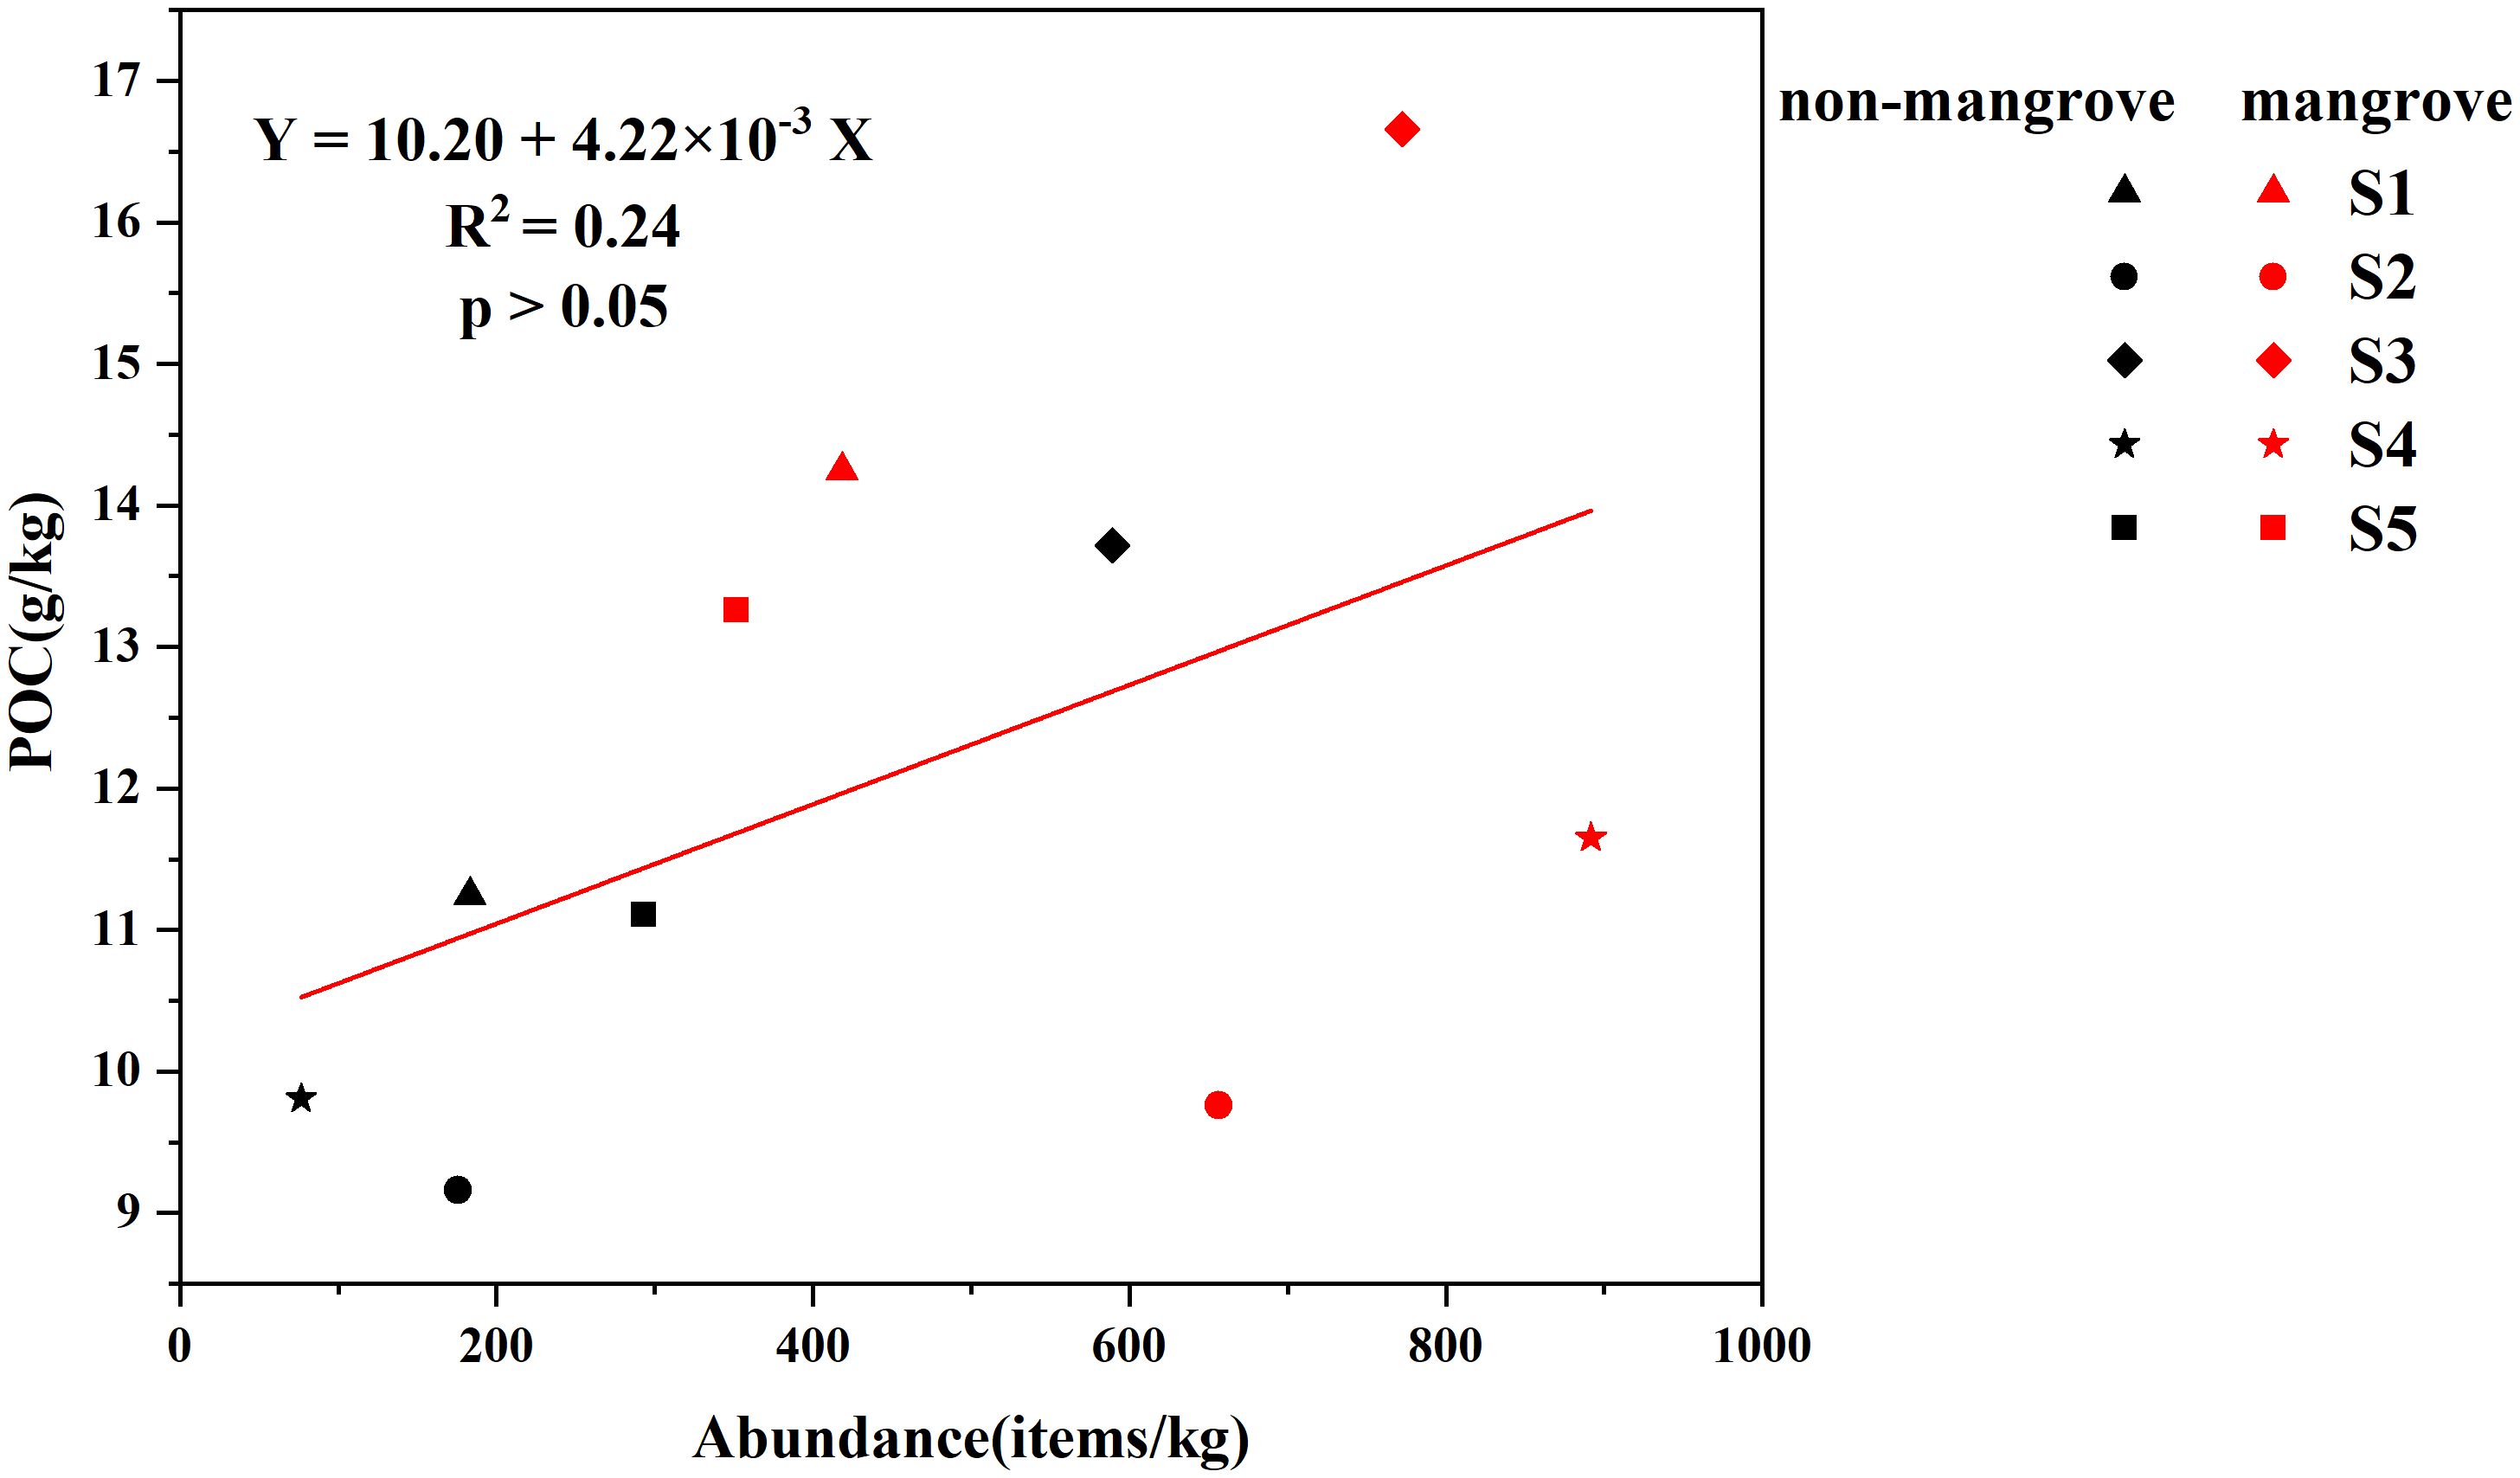
Figure 8 Linear regression relationship between MPs abundance and POC in ZJB.
4.4 Long-term monitoring and mitigation strategy of MPs pollution in mangrove ecosystem
MPs are monitored and analyzed using techniques such as microscopy, Fourier Transform Infrared (FTIR) and Raman spectroscopy (Raman), and thermal analysis (Shim et al., 2017). MPs can be monitored in a variety of environments, including water (Li et al., 2018b), air (Gasperi et al., 2018), soil (Jacques and Prosser, 2021), sediment (Uddin et al., 2021), and marine fish (Bråte et al., 2016). MPs can be monitored from the interior and edges of mangroves (Duan et al., 2021), and this study was conducted to monitor MPs in estuarine mangrove and non-mangrove sediments, and the comparative results showed more MPs in mangroves than in non-mangroves, indicating that mangroves can trap MPs, and the trapping effect of MPs was greatly influenced by the adjacent land-based sources induced by human activities. Although wastewater treatment plants can remove more than 90% of MPs (Iyare et al., 2020), discharged MPs can still cause significant environmental pollution, with nearly 48% of wastewater discharged globally without treatment (Jones et al., 2021). This suggests that untreated wastewater is likely to be a major source of MPs in areas where wastewater treatment facilities are limited or non-existen (Rico et al., 2023). Therefore, MPs can be controlled from the perspective of wastewater treatment. Governments should set standards for wastewater treatment, companies should strictly enforce them, and people should raise environmental awareness to reduce the use of plastic products. There are limitations to this study in that the sample size was not large enough, and future studies should focus on organic-rich sediments to further explore the relationship between MPs and blue carbon storage.
5 Conclusion
In summary, MPs were found at all sampling stations in this study, indicating that MPs are widely distributed in the sediments, and the abundance, composition, and diversity of MPs were investigated. The results showed that there was a significant difference in MPs abundance between mangroves and non-mangroves at ZJB (P < 0.05). Human activities are the key factor leading to the difference in MPs enrichment patterns between mangroves and non-mangroves. In addition, the predominant MPs shapes in both mangroves and non-mangroves are fragments, with multicolor and green being the most common colors and most MPs sizes between 100 and 330 µm. The POC was higher in mangrove areas than that in non-mangrove stations. This study demonstrated the interception effects of MPs by mangroves blue carbon ecosystem, which could help provide directions for the management of MPs pollution in ZJB. Although POC storage in sediments was not significantly affected by the MPs at present, human activities altered the enrichment patterns of MPs in the mangrove blue carbon ecosystem. Further studies should focus on organic-rich sediments to explore the relationships between MPs and blue carbon storage in the future, which may impact on the blue carbon biogeochemical cycle in the mangrove ecosystem.
Data availability statement
The original contributions presented in the study are included in the article/supplementary material. Further inquiries can be directed to the corresponding author.
Author contributions
PZ: Conceptualization, Funding acquisition, Methodology, Project administration, Supervision, Writing – original draft, Writing – review & editing, Investigation. WZ: Formal analysis, Methodology, Software, Validation, Writing – original draft, Writing – review & editing. JZ: Project administration, Writing – review & editing. YG: Formal analysis, Software, Validation, Writing – original draft. SW: Visualization, Writing – review & editing. QJ: Visualization, Writing – review & editing.
Funding
The author(s) declare financial support was received for the research, authorship, and/or publication of this article. We gratefully acknowledge the Guangdong Basic and Applied Basic Research Foundation (2023A1515012769), Guangdong Basic and Applied Basic Research Foundation (2020A1515110483), Research and Development Projects in Key Areas of Guangdong Province (2020B1111020004), Guangdong Ocean University Fund Project (R18021); Science and Technology Special Project of Zhanjiang City (2019B01081); Innovation Strong School Project (230420021) of Guangdong Ocean University, and Province College Student Innovation and Entrepreneurship Plan (S202210566007) for funding.
Acknowledgments
Special appreciation is given to the reviewers for their careful review and constructive suggestions. We thank all members of the research team and others who participated in this study.
Conflict of interest
The authors declare that the research was conducted in the absence of any commercial or financial relationships that could be construed as a potential conflict of interest.
Publisher’s note
All claims expressed in this article are solely those of the authors and do not necessarily represent those of their affiliated organizations, or those of the publisher, the editors and the reviewers. Any product that may be evaluated in this article, or claim that may be made by its manufacturer, is not guaranteed or endorsed by the publisher.
References
Adomat Y., Grischek T. (2020). Sampling and processing methods of microplastics in river sediments—A review. Sci. Total Environ. 758, 143691. doi: 10.1016/j.scitotenv.2020.143691
Alemu I. J. B., Richards D. R., Gaw L. Y. F., Masoudi M., Nathan Y., Friess D. A. (2021). Identifying spatial patterns and interactions among multiple ecosystem services in an urban mangrove landscape. Ecol. Indic. 121, 107042. doi: 10.1016/j.ecolind.2020.107042
Alongi D. M. (2014). Carbon cycling and storage in mangrove forests. Ann. Rev. Mar. Sci. 6, 195–219. doi: 10.1146/annurev-marine-010213-135020
Andrady A. L. (2011). Microplastics in the marine environment. Mar. pollut. Bull. 62, 1596–1605. doi: 10.1016/j.marpolbul.2011.05.030
Auta H. S., Emenike C. U., Fauziah S. H. (2017). Screening of Bacillus strains isolated from mangrove ecosystems in Peninsular Malaysia for microplastic degradation. Environ. pollut. 231, 1552–1559. doi: 10.1016/j.envpol.2017.09.043
Bayen S. (2012). Occurrence, bioavailability and toxic effects of trace metals and organic contaminants in mangrove ecosystems: A review. Environ. Int. 48, 84–101. doi: 10.1016/j.envint.2012.07.008
Bråte I. L. N., Eidsvoll D. P., Steindal C. C., Thomas K. V. (2016). Plastic ingestion by Atlantic cod (Gadus morhua) from the Norwegian coast. Mar. pollut. Bull. 112, 105–110. doi: 10.1016/j.marpolbul.2016.08.034
Browne M. A., Crump P., Niven S. J., Teuten E., Tonkin A., Galloway T., et al. (2011). Accumulation of microplastic on shorelines woldwide: sources and sinks. Environ. Sci. Technol. 45, 9175–9179. doi: 10.1021/es201811s
Chen Z. L., Lee S. Y. (2021). Contribution of microplastics to carbon storage in coastal wetland sediments. Environ. Sci. Technol. Lett. 8, 1045–1050. doi: 10.1021/acs.estlett.1c00784
Cole M., Lindeque P., Halsband C., Galloway T. S. (2011). Microplastics as contaminants in the marine environment: A review. Mar. pollut. Bull. 62, 2588–2597. doi: 10.1016/j.marpolbul.2011.09.025
Cordova M. R., Ulumuddin Y. I., Purbonegoro T., Shiomoto A. (2021). Characterization of microplastics in mangrove sediment of Muara Angke Wildlife Reserve, Indonesia. Mar. pollut. Bull. 163, 112012. doi: 10.1016/j.marpolbul.2021.112012
Dad F. P., Khan W. D., Kirkham M. B., Bolan N., Tanveer M. (2023). Microplastics: a review of their impacts on different life forms and their removal methods. Environ. Sci. pollut. Res. 30, 86632–86655. doi: 10.1007/s11356-023-28513-w
Dahms H. U. (2014). The grand challenges in marine pollution research. Front. Mar. Sci. 1. doi: 10.3389/fmars.2014.00009
Deng H., He J. X., Feng D., Zhao Y. Y., Sun W., Yu H. M., et al. (2021). Microplastics pollution in mangrove ecosystems: A critical review of current knowledge and future directions. Sci. Total Environ. 753, 142041. doi: 10.1016/j.scitotenv.2020.142041
Desforges J. P. W., Galbraith M., Ross P. S. (2015). Ingestion of microplastics by zooplankton in the Northeast Pacific Ocean. Arch. Environ. Contam Toxicol. 69, 320–330. doi: 10.1007/s00244-015-0172-5
Donato D. C., Kauffman J. B., Murdiyarso D., Kurnianto S., Stidham M., Kanninen M. (2011). Mangroves among the most carbon-rich forests in the tropics. Nat. Geosci. 4, 293–297. doi: 10.1038/ngeo1123
Duan J. H., Han J., Cheung S. G., Richard K. Y. C., Lo C. M., Lee F. W. F., et al. (2021). How mangrove plants affect microplastic distribution in sediments of coastal wetlands: Case study in Shenzhen Bay, South China. Sci. Total Environ. 767, 144695. doi: 10.1016/j.scitotenv.2020.144695
Fendall L. S., Sewell M. A. (2009). Contributing to marine pollution by washing your face: microplastics in facial cleansers. Mar. pollut. Bull. 58, 1225–1228. doi: 10.1016/j.marpolbul.2009.04.025
Galgani L., Tsapakis M., Pitta P., Tsiola A., Tzempelikou E., Kalantzi I., et al. (2019). Microplastics increase the marine production of particulate forms of organic matter. Environ. Res. Lett. 14, 124085–124085. doi: 10.1088/1748-9326/ab59ca
Gallo F., Fossi C., Weber R., Santillo D., Sousa J., Ingram I., et al. (2018). Marine litter plastics and microplastics and their toxic chemicals components: the need for urgent preventive measures. Environ. Sci. Eur. 30, 13. doi: 10.1186/s12302-018-0139-z
Gasperi J., Wright S. L., Dris R., Collard F., Mandin C., Guerrouache M., et al. (2018). Microplastics in air: Are we breathing it in? Curr. Opin. Environ. Sci. Health 1, 1–5. doi: 10.1016/j.coesh.2017.10.002
GESAMP (2016). Sources, fate and effects of microplastics in the marine environment: part two of a global assessment. In: Kershaw P. J., Rochman C. M., (Eds). Rep. Stud. GESAMP No. 93, 220p. Available at: http://www.gesamp.org/publications/microplastics-in-the-marine-environment-part-2.
Gies E. A., LeNoble J. L., Noel M., Etemadifar A., Bishay F., Hall E. R., et al. (2018). Retention of microplastic in a major secondary wastewater treatment plant in Vancouver, Canada. Mar. pollut. Bull. 133, 553–561. doi: 10.1016/j.marpolbul.2018.06.006
Güven O., Gökdağ K., Jovanović B., Kıdeyş A. E. (2017). Microplastic litter composition of the Turkish territorial waters of the Mediterranean Sea, and its occurrence in the gastrointestinal tract of fish. Environ. pollut. 223, 286–294. doi: 10.1016/j.envpol.2017.01.025
Guzzetti E., Sureda A., Tejada S., Faggio C. (2018). Microplastic in marine organism: environmental and toxicological effects. Environ. Toxicol. Pharmacol. 64, 164–171. doi: 10.1016/j.etap.2018.10.009
Hidalgo–Ruz V., Gutow L., Thompson R. C., Thiel V. (2012). Microplastics in the marine environment: A review of the methods used for identification and quantification. Environ. Sci. Technol. 46, 3060–3075. doi: 10.1021/es2031505
Hinojosa I. A., Thiel M. (2009). Floating marine debris in fjords, gulfs and channels of southern Chile. Mar. pollut. Bull. 58, 341–350. doi: 10.1016/j.marpolbul.2008.10.020
Horstman E. M., Dohmen-Janssen C. M., Narra P. M. F., van den Berg N. J. F., Siemerink M., Hulscher S. J. M. H. (2014). Wave attenuation in mangroves: a quantitative approach to field observations. Coast. Eng. 94, 47–62. doi: 10.1016/j.coastaleng.2014.08.005
Huang J.-S., Koongolla J. B., Li H.-X., Lin L., Pan Y.-F., Liu S., et al. (2020a). Microplastic accumulation in fish from Zhanjiang mangrove wetland, South China. Sci. Total Environ. 708, 134839. doi: 10.1016/j.scitotenv.2019.134839
Huang Y., Xiao X., Effiong K., Xu C., Su Z., Hu J., et al. (2021). New insights into the microplastic enrichment in the blue carbon ecosystem: evidence from seagrass meadows and mangrove forests in coastal South China Sea. Environ. Sci. Technol. 55, 4804–4812. doi: 10.1021/acs.est.0c07289
Huang Y., Xiao X., Xu C., Perianen Y. D., Hu J., Holmer M. (2020b). Seagrass beds acting as a trap of microplastics - Emerging hotspot in the coastal region? Environ. pollut. 257, 113450. doi: 10.1016/j.envpol.2019.113450
Iyare P. U., Ouki S. K., Bond T. (2020). Microplastics removal in wastewater treatment plants: a critical review. Environ. Sci. Water Res. Technol. 6, 2664–2675. doi: 10.1039/d0ew00397b
Jacques O., Prosser R. S. (2021). A probabilistic risk assessment of microplastics in soil ecosystems. Sci. Total Environ. 757, 143987. doi: 10.1016/j.scitotenv.2020.143987
Jambeck J. R., Geyer R., Wilcox C., Siegler T. R., Perryman M, Andrady A., et al. (2015). Plastic waste inputs from land into the ocean. Science 347, 768–771. doi: 10.1126/science.1260352
Jiao M., Ren L., Wang Y. J., Ding C. Y., Li T. Z., Cao S. H., et al. (2022). Mangrove forest: An important coastal ecosystem to intercept river microplastics. Enviro. Res. 210, 112939. doi: 10.1016/j.envres.2022.112939
Jones E. R., van Vliet M. T. H., Qadir M., Bierkens M. F. P. (2021). Country-level and gridded estimates of wastewater production, collection, treatment and reuse. Earth Syst. Sci. Data. 13, 237–254. doi: 10.5194/essd-13-237-2021
Kannan K., Vimalkumar K. (2021). A review of human exposure to microplastics and insights into microplastics as obesogens. Front. Endocrinol. (Lausanne) 12. doi: 10.3389/fendo.2021.724989
Koelmans A. A., Mohamed Nor N. H., Hermsen E., Kooi M., Mintenig S. M., De France J. (2019). Microplastics in freshwaters and drinking water: Critical review and assessment of data quality. Water Res. 155, 410–422. doi: 10.1016/j.watres.2019.02.054
Law K. L., Moret–Ferguson S. E., Goodwin D. S., Zettler E. R., Deforce E., Kukulka T., et al. (2014). Distribution of surface plastic debris in the Eastern Pacific Ocean from an 11–year data set. Environ. Sci. Technol. 48, 4732–4738. doi: 10.1021/es4053076
Li K., Du L., Qin C., Bolan N., Wang H. L., Wang H. (2024). Microplastic pollution as an environmental risk exacerbating the greenhouse effect and climate change: a review. Carbon Res. 3, 9. doi: 10.1007/s44246-023-00097-7
Li L. F., Liu W. A. (2018). Dynamic changes of mangrove wetland landscape pattern in Lianzhou Gulf of Guangxi and its causes. J. For. Environ. 38, 171–177. doi: 10.13324/j.cnki.jfcf.2018.02.007
Li J., Liu H., Paul Chen J. (2018b). Microplastics in freshwater systems: A review on occurrence, environmental effects, and methods for microplastics detection. Water Res. 137, 362–374. doi: 10.1016/j.watres.2017.12.056
Li J., Zhang H., Zhang K. N., Yang R. J., Li R. Z., Li Y. F. (2018a). Characterization, source, and retention of microplastic in sandy beaches and mangrove wetlands of the Qinzhou eBay, China. Mar. pollut. Bull. 136, 401–406. doi: 10.1016/j.marpolbul.2018.09.025
Li C. J., Zhu L. X., Wang X. H., Liu K., Li D. J. (2022). Cross-oceanic distribution and origin of microplastics in the subsurface water of the South China Sea and Eastern Indian Ocean. Sci. Total Environ. 805, 150243. doi: 10.1016/j.scitotenv.2021.150243
Liu X. Y., Liu H. T., Chen L., Wang X. H. (2022). Ecological interception effect of mangroves on microplastics. J. Hazard. Mater. 423, 127231. doi: 10.1016/j.jhazmat.2021.127231
Liu Z., Yu P., Cai M., Wu D., Zhang M., Chen M., et al. (2019). Effects of microplastics on the innate immunity and intestinal microflora of juvenile Eriocheir sinensis. Sci. Total Environ. 685, 836–846. doi: 10.1016/j.scitotenv.2019.06.265
Lobelle D., Cunliffe M. (2011). Early microbial biofilm formation on marine plastic debris. Mar. pollut. Bull. 62, 197–200. doi: 10.1016/j.marpolbul.2010.10.013
Lusher A. L., Hollman P. C. H., Mendoza-Hill J. J. (2017). Microplastics in fisheries and aquaculture: status of knowledge on their occurrence and implications for aquatic organisms and food safety. FAO Fisheries and Aquaculture Technical Paper. No. 615. Available at: https://doi.org/978-92-5-109882-0.
Machado A. A. d. S., Lau C. W., Kloas W., Bergmann J., Bachelier J. B., Faltin E., et al. (2019). Microplastics can change soil properties and affect plant performance. Environ. Sci. Technol. 53 (10), 6044–6052. doi: 10.1021/acs.est.9b01339
Maghsodian Z., Sanati A. M., Ramavandi B., Ghasemi A., Sorial G. A. (2020). Microplastics accumulation in sediments and Periophthalmus waltoni fish, mangrove forests in southern Iran. Chemosphere 264, 128543. doi: 10.1016/j.chemosphere.2020.128543
Maghsodian Z., Sanati A. M., Ramavandi B., Ghasemi A., Sorial G. A. (2021). Microplastics accumulation in sediments and Periophthalmus waltoni fish, mangrove forests in southern Iran. Chemosphere 264, 128543. doi: 10.1016/j.chemosphere.2020.128543
Maghsodian Z., Sanati A. M., Tahmasebi S., Shahriari M. H., Ramavandi B. (2022). Study of microplastics pollution in sediments and organisms in mangrove forests: A review. Environ. Res. 208, 112725. doi: 10.1016/j.envres.2022.112725
Martin C., Almahasheer H., Duarte C. M. (2019). Mangrove forests as traps for marine litter. Environ. pollut. 247, 499–508. doi: 10.1016/j.envpol.2019.01.067
Martin C., Baalkhuyur F., Valluzzi L., Saderne V., Cusack M., Almahasheer H., et al. (2020). Exponential increase of plastic burial in mangrove sediments as a major plastic sink. Sci. Adv. 6, eaaz5593. doi: 10.1126/sciadv.aaz5593
Masura J., Baker J., Foster G., Arthur C. (2015). Laboratory methods for the analysis of microplastics in the marine environment: Recommendations for quantifying synthetic particles in waters and sediments (Silver Spring, MD, USA: NOAA Tech. Memo. NOS-OR & R-48; National Oceanic and Atmospheric Administration).
Mohamed Nor N. H., Obbard J. P. (2014). Microplastics in Singapore’s coastal mangrove ecosystems. Mar. pollut. Bull. 79, 278–283. doi: 10.1016/j.marpolbul.2013.11.025
Mullarney J. C., Henderson S. M., Reyns J. A. H., Norris B. K., Bryan K. R. (2017). Spatially varying drag within a wave-exposed mangrove forest and on the adjacent tidal flat. Cont. Shelf Res. 147, 102–113. doi: 10.1016/j.csr.2017.06.019
Naji A., Nuri M., Amiri P., Niyogi S. (2019). Small microplastic particles (S-MPPs) in sediments of mangrove ecosystem on the northern coast of the Persian Gulf. Mar. pollut. Bull. 146, 305–311. doi: 10.1016/j.marpolbul.2019.06.033
Napper I. E., Thompson R. C. (2016). Release of synthetic microplastic plastic fibres from domestic washing machines: Effects of fabric type and washing conditions. Mar. pollut. Bull. 112, 39–45. doi: 10.1016/j.marpolbul.2016.09.025
Norris B. K., Mullarney J. C., Bryan K. R., Henderson S. M. (2017). The effect of pneumatophore density on turbulence: A field study in a Sonneratia-dominated mangrove forest, Vietnam. Cont. Shelf Res. 147, 114–127. doi: 10.1016/j.csr.2017.06.002
Nuelle M. T., Dekiff J. H., Remy D., Fries E. (2014). A new analytical approach for monitoring microplastics in marine sediments. Environ. pollut. 184, 161–169. doi: 10.1016/j.envpol.2013.07.027
Ogata Y., Takada H., Mizukawa K., Hirai H., Iwasa S., Endo S., et al. (2009). International pellet watch: global monitoring of persistent organic pollutants (POPs) in coastal waters. 1. Initial phase data on PCBs, DDTs, and HCHs. Mar. pollut. Bull. 58(10), 1437–1446. doi: 10.1016/j.marpolbul.2009.06.014
Ory N., Sobral P., Ferreira J., Thiel M. (2017). Amberstripe scad Decapterus muroadsi (Carangidae) fish ingest blue microplastics resembling their copepod prey along the coast of Rapa Nui (Easter Island) in the South Pacific subtropical gyre. Sci. Total Environ. 586, 430–437. doi: 10.1016/j.scitotenv.2017.01.175
Owuor M. A., Icely J., Newton A. (2019). Community perceptions of the status and threats facing mangroves of Mida Creek, Kenya: implications for community based management. Ocean Coast. Manage. 175, 172–179. doi: 10.1016/j.ocecoaman.2019.03.027
Prata J. C., Reis V., da Costa J. P., Mouneyrac C., Duarte A. C., Rocha-Santos T. (2020). Contamination issues as a challenge in quality control and quality assurance in microplastics analytics. J. Hazard. Mater. 403, 123660. doi: 10.1016/j.jhazmat.2020.123660
Rebelein A., Int-Venn I., Kamman U., Scharsack J. P. (2021). Microplastic fibers - Underestimated threat to aquatic organisms? Sci. Total Environ. 777, 146045. doi: 10.1016/j.scitotenv.2021.146045
Rico A., Redondo-Hasselerharm P. E., Vighi M., Waichman A. V., Nunes G. S. d. S., Oliveira R., et al. (2023). Large-scale monitoring and risk assessment of microplastics in the Amazon River. Wat. Res. 232, 119707. doi: 10.1016/j.watres.2023.119707
Rillig M. C. (2018). Microplastic disguising as soil carbon storage. Environ. Sci. Technol. 52, 6079–6080. doi: 10.1021/acs.est.8b02338
Rochman C. M., Hentschel B. T., Teh S. J. (2014). Long-term sorption of metals is similar among plastic types: implications for plastic debris in aquatic environments. PloS One 9, e85433. doi: 10.1371/journal.pone.0085433
Röhr M. E., Boström C., Canal-Vergés P., Holmer M. (2016). Blue carbon stocks in Baltic Sea eelgrass (Zostera marina) meadows. Biogeosciences 13, 6139–6153. doi: 10.5194/bg-13-6139-2016
Roy A. K. D. (2014). Determinants of participation of mangrove-dependent communities in mangrove conservation practices. Ocean Coast. Manage. 98, 70–78. doi: 10.1016/j.ocecoaman.2014.06.001
Samper-Villarreal J., Lovelock C. E., Saunders M. I., Roelfsema C., Mumby P. J. (2016). Organic carbon in seagrass sediments is influenced by seagrass canopy complexity, turbidity, wave height, and water depth. Limnol. Oceanogr. 61, 938–952. doi: 10.1002/lno.10262
Shim W. J., Hong S. H., Eo S. E. (2017). Identification methods in microplastic analysis: a review. Anal. Methods 9, 1384–1391. doi: 10.1039/c6ay02558g
Smith M., Love D. C., Rochman C. M., Neff R. A. (2018). Microplastics in seafood and the implications for human health. Curr. Environ. Health Rep. 5, 375–386. doi: 10.1007/s40572-018-0206-z
Statista (2020). Available online at: https://www.statista.com/statistics/282732/global-production-of-plastics-since-1950/.
Sussarellu R., Suquet M., Thomas Y., Lambert C., Fabioux C., Pernet M. E. J., et al. (2016). Oyster reproduction is affected by exposure to polystyrene microplastics. Proc. Natl. Acad. Sci. U.S.A. 113, 2430–2435. doi: 10.1073/pnas.1519019113
Syahid L. N., Sakti A. D., Virtriana R., Wikantika K., Windupranata W., Tsuyuki S., et al. (2020). Determining optimal location for mangrove planting using remote sensing and climate model projection in Southeast Asia. Remote Sens. 12, 3734. doi: 10.3390/rs12223734
Tan E., Mohd Zanuri N. B. (2023). Abundance and distribution of microplastics in tropical estuarine mangrove areas around Penang, Malaysia. Front. Mar. Sci. 10. doi: 10.3389/fmars.2023.1148804
Tang G., Liu M., Zhou Q., He H., Chen K., Zhang H., et al. (2018). Microplastics and polycyclic aromatic hydrocarbons (PAHs) in Xiamen coastal areas: Implications for anthropogenic impacts. Sci. Total Environ. 634, 811–820. doi: 10.1016/j.scitotenv.2018.03.336
Tang D. B., Luo S. Y., Deng S. Y., Huang Y., Chen B.H. and Deng Z. Y. (2022). Heavy metal pollution status and deposition history of mangrove sediments in Zhanjiang Bay, China. Front. Mar. Sci. 9. doi: 10.3389/FMARS.2022.989584
Thompson R. C., Olsen Y., Mitchell R. P., Davis A., Rowland S. J., John A. W. G., et al. (2004). Lost at sea: where is all the plastic? Sci. 304, 838. doi: 10.1126/science.1094559
Uddin S., Fowler S. W., Uddin M. F., Behbehani M., Naji A. (2021). A review of microplastic distribution in sediment profiles. Mar. pollut. Bull. 163, 111973. doi: 10.1016/j.marpolbul.2021.111973
van Bijsterveldt C. E. J., van Wesenbeeck B. K., Ramadhani S., Raven O. V., van Gool F. E., Pribadi R., et al. (2021). Does plastic waste kill mangroves? A field experiment to assess the impact of macro plastics on mangrove growth, stress response and survival. Sci. Total Environ. 756, 143826. doi: 10.1016/j.scitotenv.2020.143826
Walcker R., Gandois L., Proisy C., Corenblit D., Mougin É., Laplanche C., et al. (2018). Control of “blue carbon” storage by mangrove ageing: Evidence from a 66-year chronosequence in French Guiana. Global Change Biol. 24, 2325–2338. doi: 10.1111/gcb.14100
Wang S. J., Jian Q. Y., Zhang P., Zhang J. B., Zhao L. R., Liu D., et al. (2022). Tracing land-based microplastic sources in coastal waters of Zhanjiang Bay, China: spatiotemporal pattern, composition, and flux. Front. Mar. Sci. 9. doi: 10.3389/fmars.2022.934707
Wang T., Zou X., Li B., Yao Y., Zhang Z., Li Y., et al. (2019). Preliminary study of the source apportionment and diversity of microplastics: Taking floating microplastics in the South China Sea as an example. Environ. pollut. 245, 965–974. doi: 10.1016/j.envpol.2018.10.110
Woodall L. C., Sanchez-Vidal A., Canals M., Paterson G. L. J., Coppock R., Sleight V., et al. (2014). The deep sea is a major sink for microplastic debris. R. Soc Open Sci. 1, 140317. doi: 10.1098/rsos.140317
Young A. M., Elliott J. A. (2016). Characterization of microplastic and mesoplastic debris in sediments from Kamilo Beach and Kahuku Beach, Hawai’i. Mar. pollut. Bull. 113, 477–482. doi: 10.1016/j.marpolbul.2016.11.009
Zettler E. R., Mincer T. J., Amaral-Zettler L. A. (2013). Life in the”Plastisphere”: microbial communities on plastic marine debris. Environ. Sci. Technol. 47, 7137–7146. doi: 10.1021/es401288x
Zhang P., Peng C. H., Zhang J. B., Zou Z. B., Shi Y. Z., Zhao L. R., et al. (2020a). Spatiotemporal urea distribution, sources, and indication of DON bio availability in Zhanjiang Bay, China. Water 12, 633. doi: 10.3390/w12030633
Zhang P., Ruan H. M., Dai P. D., Zhao L. R., Zhang J. B. (2020b). Spatiotemporal river flux and composition of nutrients affecting adjacent coastal water quality in Hainan Island, China. J. Hydrol. 591, 125293. doi: 10.1016/j.jhydrol.2020.125293
Zhang L., Wang S. J., Jian Q. Y., Zhang P., Lu Y. J., Liu H. Q. (2022). Tidal variation shaped microplastic enrichment patterns in mangrove blue carbon ecosystem of northern Beibu Gulf, China. Front. Mar. Sci. 9. doi: 10.3389/fmars.2022.927884
Zhang P., Wei L. R., Lai J. Y., Dai P. D., Chen Y., Zhang J. B. (2019). Concentration, composition and fluxes of land–based nitrogen and phosphorus source pollutants input into Zhanjiang Bay in summer. J. Guangdong Ocean Univ. 39, 46–55. doi: 10.3969/j.issn.1673-9159.2019.04.000
Zhang J. B., Zhang Y. C., Zhang P., Li Y., Li J. X., Xu J. L., et al. (2021). Seasonal phosphorus variation in coastal water affected by the land–based sources input in the eutrophic Zhanjiang Bay, China. Estuar. Coast. Shelf Sci. 252, 107277. doi: 10.1016/j.ecss.2021.107277
Zhou X., Jin G., Li J., Song Z., Zhang S., Chen C., et al. (2021). Effects of Typhoon Mujigae on the biogeochemistry and ecology of a semi-enclosed bay in the northern South China Sea. J. Geophys. Res. Biogeosci. 126, e2020JG006031. doi: 10.1029/2020JG006031
Zhou X., Xiao C., Li X., Chen T., Yang X. (2023). Microplastics in coastal blue carbon ecosystems: A global Meta-analysis of its distribution, driving mechanisms, and potential risks. Sci. Total Environ. 878, 163048. doi: 10.1016/j.scitotenv.2023.163048
Zhu L., Bai H. Y., Chen B. J., Sun X. M., Qu K. M., Xia B. (2018). Microplastic pollution in North Yellow Sea, China: Observations on occurrence, distribution and identification, Sci. Total Environ. 636, 20–29. doi: 10.1016/j.scitotenv.2018.04.182
Zhu J., Zhang Q., Huang Y., Jiang Y., Li J., Michal J. J., et al. (2021). Long-term trends of microplastics in seawater and farmed oysters in the Maowei Sea, China. Environ. pollut. 273, 116450. doi: 10.1016/j.envpol.2021.116450
Zitko V., Hanlon M. (1991). Another source of pollution by plastics: Skin cleaners with plastic scrubbers. Mar. pollut. Bull. 22, 41–42. doi: 10.1016/0025-326X(91)90444-W
Keywords: microplastics, mangrove, human activities, Zhanjiang Bay, sediment
Citation: Zhang P, Zhao W, Zhang J, Gao Y, Wang S and Jian Q (2024) Human activities altered the enrichment patterns of microplastics in mangrove blue carbon ecosystem in the semi-enclosed Zhanjiang Bay, China. Front. Mar. Sci. 11:1362170. doi: 10.3389/fmars.2024.1362170
Received: 27 December 2023; Accepted: 25 March 2024;
Published: 05 April 2024.
Edited by:
Jenny Fong, Griffith University, AustraliaReviewed by:
Mehrzad Keshavarzifard, Education and Extension Organization (AREEO), IranDandan Duan, Hainan Normal University, China
Copyright © 2024 Zhang, Zhao, Zhang, Gao, Wang and Jian. This is an open-access article distributed under the terms of the Creative Commons Attribution License (CC BY). The use, distribution or reproduction in other forums is permitted, provided the original author(s) and the copyright owner(s) are credited and that the original publication in this journal is cited, in accordance with accepted academic practice. No use, distribution or reproduction is permitted which does not comply with these terms.
*Correspondence: Jibiao Zhang, zhangjb@gdou.edu.cn