Development of polymorphic simple sequences repeats markers from whole gene resequencing data comparison of 68 Oncorhynchus mykiss
 Haibing Ma
 Tianqing Huang
 Enhui Liu2
  Gefeng Xu
- 1College of Fisheries and Life Sciences, Shanghai Ocean University, Shanghai, China
- 2Cold Water Fish Industry Technology Innovation Strategic Alliance, Heilongjiang Fisheries Research Institute, Chinese Academy of Fishery Sciences, Harbin, China
- 3Plateau Agricultural Science and Technology Joint Innovation Center, Lhasa, China
Rainbow trout (Oncorhynchus mykiss) is a significant cold-water fish farmed in China. Currently, most molecular marker-assisted breeding applications in rainbow trout rely on SSR markers. Although many rainbow trout SSR markers have been developed, methods for mining many polymorphic SSR markers from the genome and identifying them efficiently and rapidly are still lacking. For this reason, this study used in silico simulation method to rapidly develop a large number of polymorphic SSR markers quickly. A total of 354,613 SSR loci with two to six nucleotide repeat motifs were mined from 32 chromosomes of the rainbow trout reference genome using GMATA. The chromosome sequences of the reference genome were then aligned to the whole genome sequencing data (10×) of 68 rainbow trout samples. In silico genotyping was performed using the HipSTR programme to compare and count the variation in the number of repeats of the motifs of the SSR loci in the samples. The loci with high deletion rates and monomorphism were discarded, while those with more than one non-reference allele were kept. The final set of polymorphic SSR loci screened was 78,828. Finally, 4,821 SSR loci were selected with more than 3 alleles and no deletion in all rainbow trout samples and were physically mapped. The average polymorphic information content of these loci was 0.692, indicating high levels of polymorphism. These SSRs were utilized to analyse the genetic diversity and population structure of the 68 rainbow trout samples. The results showed that these 68 samples were divided into two groups. These newly discovered polymorphic SSR markers will provide valuable information for evaluating the construction of rainbow trout family lines for genetic diversity and improvement.
1 Introduction
Rainbow trout (Oncorhynchus mykiss) is one of the world’s most widely farmed cold-water economic fish. Its meat is tender and tasty; not only is it free of a fishy odor and small bony spurs, but there is also no need to scrape the scales when consuming it. From a nutritional point of view, the meat of rainbow trout is rich in potassium (Barszcz et al., 2016), B vitamins (Stancheva, 2010), amino acids (Turchini et al., 2018), and unsaturated fatty acids (Weaver et al., 2008), which are beneficial to human absorption and nutritional balance. Moreover, rainbow trout contains DHA and EPA, known as brain gold, which are several times more abundant than other fish (Santigosa et al., 2020). Notably, in the U.S. market, marketing for rainbow trout grew from $26 million in 2016 to $35.1 million in 2021, with an average annual growth rate of 8.3% (Sun et al., 2023). According to the 2021 China Fisheries Statistics Yearbook, the annual domestic production of rainbow trout in 2020 was 37,800 metric tonnes. The demand for salmon trout is expected to increase at a rate of 35–40% per year, and by 2030, the consumption of salmon trout in China will reach 300,000–400,000 metric tonnes. It can be said that rainbow trout enjoys a high reputation in the global market as a popular farmed fish. Its rich nutritional value and delicious taste make it one of the top choices for people seeking a healthy diet and a high quality of life.
Microsatellite markers, or SSR markers, are tandem simple repetitive sequences consisting of one to six nucleotides present in eukaryotic genomes (Ellegren, 2004). SSR markers have many advantages, such as genome-wide coverage, stability, high reproducibility, co-occurrence of inheritance, high polymorphism (multiple alleles at each locus), inter-species transferability, and low requirements for expertise and instrumentation (Tóth et al., 2000; Jiang et al., 2014). Obtaining a large number of highly polymorphic and strongly stable SSR markers for a target species is beneficial for molecular resource management and the genetic improvement of that species (Sigang et al., 2021). Currently, SSR markers have been widely used in genetic diversity studies (Guo et al., 2010), population structure analysis (Abdul-Muneer, 2014; Sharma et al., 2019; Layton et al., 2020), strain identification (Napora-Rutkowski et al., 2017), ploidy identification (Feng et al., 2018), and linkage mapping analysis of fish (Hollenbeck et al., 2017). With the use of microsatellite markers, we can better understand the genetic diversity of fish, reveal population structure and relatedness, assess the purity and quality of strains, and even establish linkage mapping to aid in breeding efforts. The high polymorphism and wide range of applications of microsatellite markers make them indispensable tools in fish genetic studies and resource management.
Development of new SSR markers with high polymorphism and strong stability has long been expensive and time-consuming. However, with the rapid development of sequencing technologies and the reduction of sequencing costs, it has become feasible to use whole genome data for SSR marker development (Gao et al., 2021). Nowadays, whole genome resequencing of multiple samples has become increasingly common in many studies related to economic fish (Xu et al., 2019; Ciezarek et al., 2022). In this study, SSR markers were mined from published rainbow trout whole genome chromosome sequences, and the distribution regions of these markers in the genome were identified. Subsequently, the polymorphism of SSR loci was assessed by whole-genome resequencing of multiple samples from different populations and comparing the resequencing data with a reference genome by detecting changes in the number of repeat units of SSRs in different samples. Previous studies usually verified the polymorphism of a small number of SSR loci by PCR amplification and polypropylene gel electrophoresis (PAGE) or by capilar electrophoresis in a genetic analyzer ABI machine or fragment analyzer machine (Luo et al., 2012; Mason, 2015; Ariede et al., 2018; Guerrero-Cózar et al., 2020; Tian et al., 2021; Yang et al., 2022). This study, however, adopted a new and efficient method to compensate for the shortcomings of the traditional method in terms of a complex, time-consuming, and inefficient process.
2 Materials and methods
2.1 Rainbow trout germplasm resources
Fin tissue from 68 rainbow trout was collected, 34 from the wild populations and 34 from the selected populations. The selected population (SK) was a new strain of rainbow trout ‘Shuike No.1’ bred by Heilongjiang Fisheries Research Institute, Chinese Academy of Fisheries Sciences, and was collected from the Bohai Sea Cold Water Fish Experimental Station, Heilongjiang Fisheries Research Institute, Chinese Academy of Fisheries Sciences. The wild population (CH) was collected from Changbai Mountain in southeastern Jilin Province, China. Tiangen DNeasy Kit (Tiangen, China, Beijing) was used to extract total DNA from rainbow trout fins. Purity (OD260/280 = 1.8~2.0) and concentration were measured by UV spectrophotometer, and concentration diluted to 50 ng/µL. 1% agarose gel electrophoresis was used to measure the quality.
2.2 Mining SSRs in the genome of rainbow trout
The reference genome (USDA_OmykA_1.1) for rainbow trout was obtained from the Ensembl database (Gao et al., 2021). SSRs were retrieved from the chromosome sequence of the rainbow trout reference genome with the aid of the Genome-wide Microsatellite Analysing Tool Package (GMATA) (Wang and Wang, 2016). The minimum number of repeats was set at 12 for dinucleotide repeats, 10 for trinucleotide repeats, and 8 for pentanucleotide and hexanucleotide repeats while searching for SSR loci with di- to hexanucleotide motifs in the rainbow trout chromosome sequences.
Next, flanking sequences of 250 bp were located on both sides of the motifs of the SSR loci that had been mined above using the Marker Design module in GMATA. For every locus, primer pairs were designed using the Primer3 algorithm. Product size of 100–400 bp, minimum GC content of 40%, annealing temperature of 60°C (59–61°C), and primer length of 20 bp (18–25 bp) were the parameters for generating primer pairs. After that, SSR loci that could not produce primers were eliminated. SSRs with inter-site distances less than 100 bp were removed.
Furthermore, it was necessary to eliminate the SSR motifs that only included T and A since they were hard to score (Bhattarai and Mehlenbacher, 2017). Finally, for the remaining filtered batch of SSR loci, a bed format file was made in preparation for the polymorphism analysis that would come next. The names of the chromosomes, motif length, number of repeat units in the reference sequence, and starting and ending positions of SSR loci were all included in the file.
2.3 Screening for polymorphisms in silico
The Beijing Genomics Institute (BGI) conducted 10 × depth resequencing of DNA from 68 rainbow trout samples. In order to gather data on variations in SSR repeat units across multiple rainbow trout sample genome sequences, the chromosome sequences of the reference genome were mapped with the genome resequencing sequences of 68 samples. The raw sequencing data was first subjected to quality control and data filtering using Fastp v.0.23.2 (Chen et al., 2018). Next, the paired-end reads of the 68 rainbow trout samples were aligned to the reference genome’s chromosomal sequences using BWA mem2 v. 2.2.1 (Li, 2013). The resulting SAM format files were converted to BAM format using SAMtools v. 0.1.19 (Li et al., 2009). The final comparison file was sorted and indexed, and the final bam file was created for further polymorphism analysis.
Subsequently, in silico polymorphism screening was performed on the SSRs that were selected from GMATA. The aligned bam files of the 68 rainbow trout samples, the bed files containing the coordinates of the SSR loci and the reference genomic chromosome sequences used to mine the SSRs were all used in the allelotyping process using the HipSTR programme (Willems et al., 2017). The integrated Python script was used to filter the VCF file containing SSR calls produced by HipSTR for low-quality calls. Following that, the monomorphic SSRs were removed. In 68 samples, the SSRs that had less than 60% detection were eliminated. Furthermore, SSRs with fewer than two non-reference alleles were eliminated. The polymorphic SSRs’ start position was utilized to create the physical map in R, which was then uniquely coloured for every motif length (two to six). Then, the genomic coordinates of polymorphic SSRs were compared with the general feature format (GFF) file to determine the distribution of SSRs in gene regions or between genes. Finally, gene functional annotations were retrieved from the rainbow trout database in the BiomaRt package.
2.4 Genetic diversity and population structure analysis
Expected heterozygosity (He), observed heterozygosity (Ho) and polymorphic information content (PIC) were computed by Cervus v.3.0.7, with the detection of any deviations from Hardy-Weinberg equilibrium (Kalinowski et al., 2007).
Before the population structure analysis using Structure v. 2.3.4 (Evanno et al., 2005), the genotype data of SSR loci generated by the HipSTR programme were converted into data suitable for Structure software using the GenALEx v. 6.503 (Peakall and Smouse, 2012). Next, set the K value from 1 to 10, the number of iterations to 20, the Length of the Burnin Period to 5000, and the Number of MCMC Reps after Burnin to 50000 to estimate the number of subpopulations. At the end of the run, the results of the Structure run were uploaded to STRUCTURE HARVESTER (Earl and VonHoldt, 2012) to determine the optimal K value. The Structure results were then sampled and analysed using CLUMPP (Jakobsson and Rosenberg, 2007). Finally, R was used to graphically plot the results based on the Q matrix of the optimal K. Principal Component Analysis (PCA) was performed using GenAlEx v. 6.503 to determine population structure further.
3 Results
3.1 Identification and distribution of SSRs in the rainbow trout genome
The rainbow trout reference genome chromosome sequence used for mining SSR loci was approximately 2.19 Gb. A total of 354,613 SSR loci (162.26 loci/Mb) were identified, with dinucleotide motif repeat minimum number of 12 (305,535; 86.16%), trinucleotide motif repeat minimum number of 10 (7,807; 2.20%), tetranucleotide motif repeat minimum number of 8 (33,369; 9.41%), pentanucleotide motif repeat minimum number of 8 (5,780; 1.63%), and hexanucleotide motif repeat minimum number of 8 (2,122; 0.60%) (Figure 1; Table 1; Supplementary Table S1). Among the different types of SSRs, there were six types of dinucleotide repeat sequence motifs, with a higher number of TG/CA and AC/GT, which accounted for 28.32% and 27.05%, respectively (Supplementary Figure S1, Supplementary Table S2). There were 29 types of trinucleotide repeat sequence motifs, with GTA/TAC having the highest number at 15.77%. There were 123 types of tetranucleotide repeat sequence motifs, with CAGA/TCTG, ACAG/CTGT, and GTCT/AGAC being the more numerous, accounting for 12.78%, 11.70%, and 10.04%, respectively. CTCTC/GAGAG and TCTCC/GGAGA were the two most dominant 203 pentanucleotide repeat sequence motif types, accounting for 17.06% and 17.02%, respectively. CCCTAA/TTAGGG was the most abundant of the 190 hexanucleotide repeat sequence motif types, accounting for 14.56%. With the highest density of distribution of SSR loci on chromosome 21, 240.30 loci/Mb, the average distribution density (number of SSR loci/Mb) of SSR loci on the reference genome’s chromosome sequences ranged from 117.90 to 240.30 loci/Mb (Table 2).
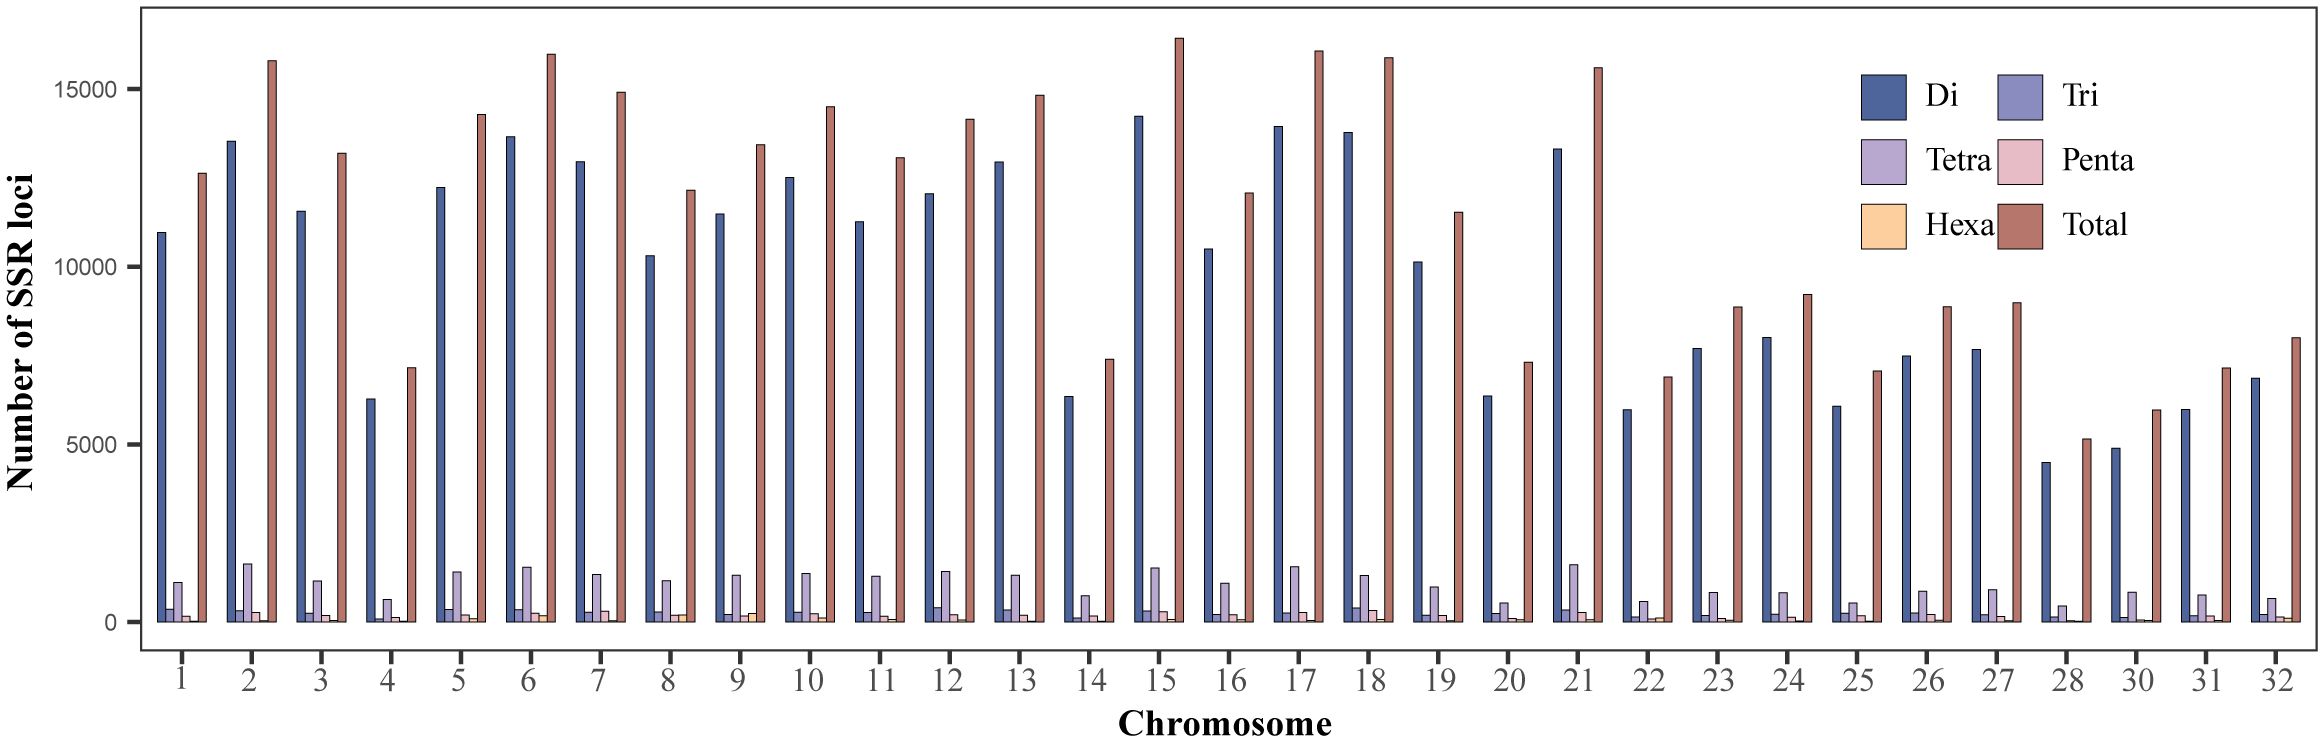
Figure 1 Distribution of di-, tri-, tetra-, penta- and hexanucleotide repeat SSR loci in rainbow trout genome chromosomes.
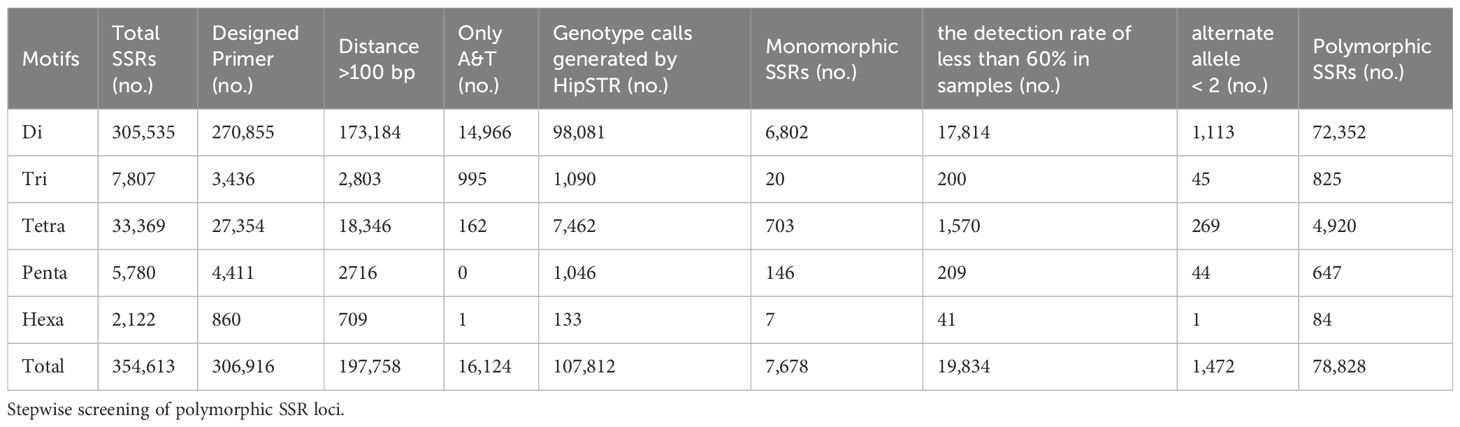
Table 1 Distribution of SSR markers for dinucleotide to hexanucleotide repeat sequences.
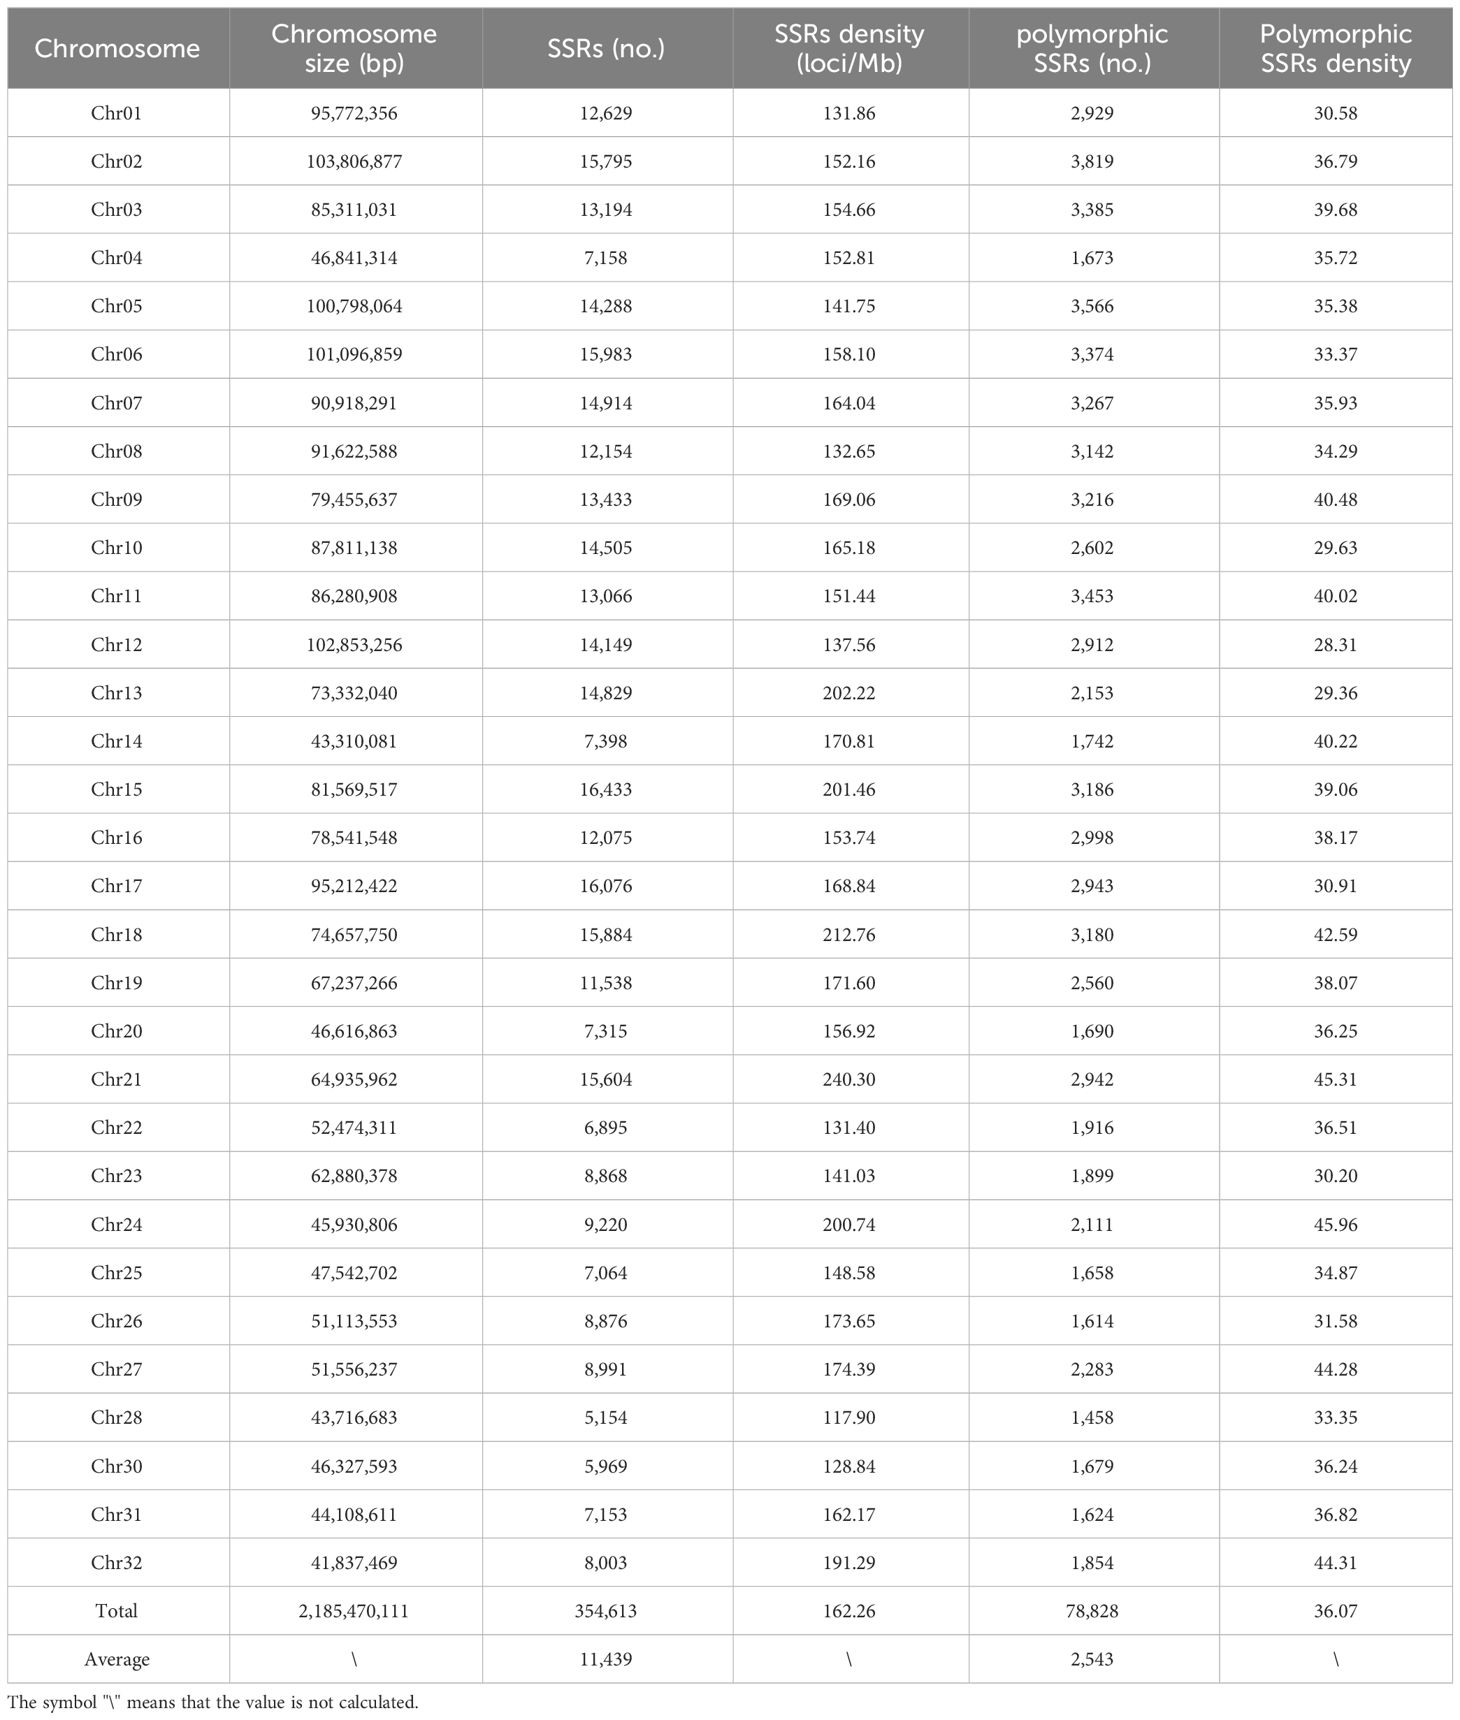
Table 2 Distribution and density of SSR loci on rainbow trout genome chromosomes.
3.2 Polymorphic SSRs identification through in silico genome sequence comparison
After mining SSRs based on the chromosome sequence of the rainbow trout reference genome using GMATA, primer pairs were successfully designed for a total of 306,916 SSR markers using its primer design module. Next, 109,158 SSR markers were removed because the distance between their motifs was less than 100 bp. In addition, 16,124 SSR markers with motifs containing only A and T needed to be removed. A total of 181,634 SSR markers were retained, and a bed file containing details of these loci was prepared for subsequent polymorphic site identification (Supplementary Table S3).
Next, the HipSTR program was used to investigate polymorphisms based on a bed file containing information on 181,634 SSRs, a comparison BAM file of 68 rainbow trout samples, and the chromosome sequences of the reference genome. The HipSTR program generated genotypic calls for 107,812 SSR loci (Table 1). Seven thousand six hundred seventy-eight monomorphic SSR loci were excluded. Nineteen thousand eight hundred thirty-four loci with less than 60% detection in 68 samples were rejected due to missing information. In addition, 1,472 SSR loci with less than two alleles were eliminated (Table 1). Finally, a total of 78,828 SSR loci with polymorphisms were retained, as detailed in Supplementary Table S4.
Among these polymorphic loci, the dinucleotide repeat and tetranucleotide repeat loci were more abundant, while the trinucleotide repeat, pentanucleotide repeat, and hexanucleotide repeat loci were relatively scarce (Table 1). Among the chromosome sequences of the rainbow trout reference genes, chromosome 2 was the longest and, as expected, it contained the most polymorphic SSRs (Table 2). Comparison of the genomic coordinate information of the polymorphic SSRs with the rainbow trout GFF file revealed that these polymorphic SSR loci could be classified into five regions: UTR_5’, UTR_3’, intron, exon, and intergenic regions of the genes. Of the SSR loci, 45.19% and 53.04% were localized in the intergenic and introns of genes (Figure 2A). Intergenic regions are non-coding DNA regions located between genes, In contrast, introns are non-coding DNA sequences located between exons within genes. In the rainbow trout genome set, these two regions may occupy most of the genome with more SSR sequences. Among the five regions, dinucleotide repeats constituted a more significant proportion (Figure 2B). Additionally, no polymorphic SSRs with pentanucleotide and hexanucleotide repeats were detected in both the UTR_5’ and UTR_3’ regions (Figure 2B).
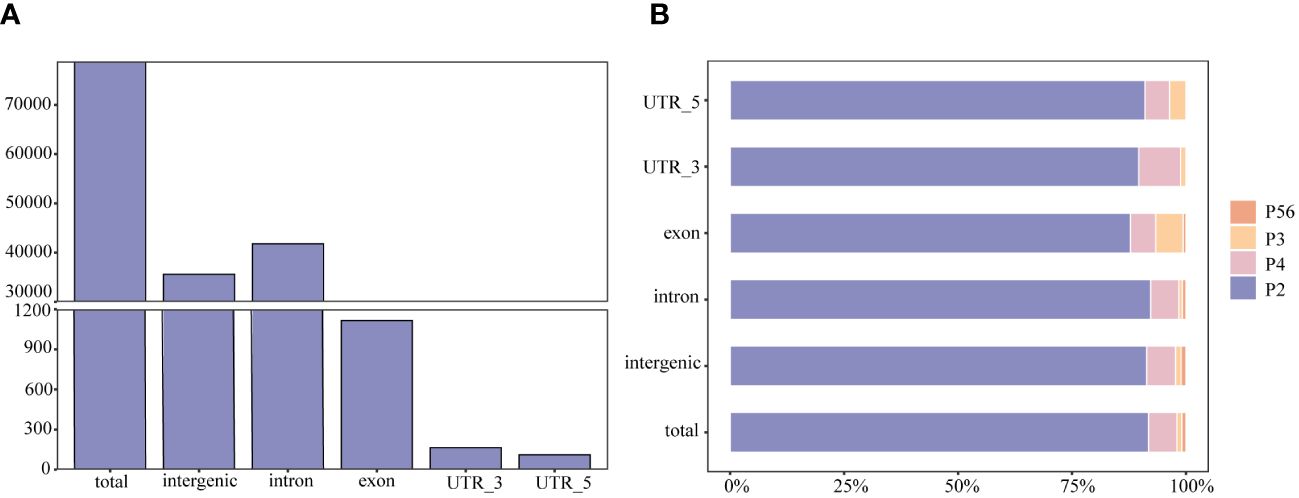
Figure 2 The type and distribution of microsatellites in the genome of rainbow trout. (A) Number of SSRs distributed within and between rainbow trout genomes; (B) Percentage distribution of different types of SSRs within and between rainbow trout genomes. P2, dinucleotide repeats; P3, trinucleotide repeats; P4, tetranucleotide repeats; P56, pentanucleotide repeats and hexanucleotide repeats.
3.3 Genetic diversity and population structure analyses based on highly polymorphic SSR loci
Although many polymorphic SSR loci were screened in this study, we need highly polymorphic SSR loci more in practical applications. SSRs with a 100% detection rate in 68 samples were retained, and to further reduce the number of SSR markers, SSR loci with more than 3 alleles were used in conducting population structure analyses. Ultimately, a total of 4,821 SSR markers were retained (Supplementary Table S5), which contained 3,521 dinucleotide repeat loci, 214 trinucleotide repeat loci, 1,022 tetranucleotide repeat loci, 54 pentanucleotide repeat loci, and 10 hexanucleotide repeat loci. The average PIC value was 0.692, indicating that these loci were highly polymorphic. 36,779 alleles in total were found; the average number of alleles per locus was approximately 7, and the range of alleles per locus was 4 to 17. (Supplementary Table S5). Expected heterozygosity (He) per locus ranged between 0.128 and 0.922, averaging 0.731. Observed heterozygosity (Ho) ranged from 0.015 to 0.971, averaging 0.650 per locus (Supplementary Table S5). The average null allele frequency was 6.5% (Supplementary Table S5). The physical map revealed the distribution of 4821 polymorphic SSR loci in the rainbow trout genome and was plotted using unique colors for each SSR motif length (Figure 3). In addition, the gene names of these genic SSRs and their predicted functions are reported in Supplementary Table S6.
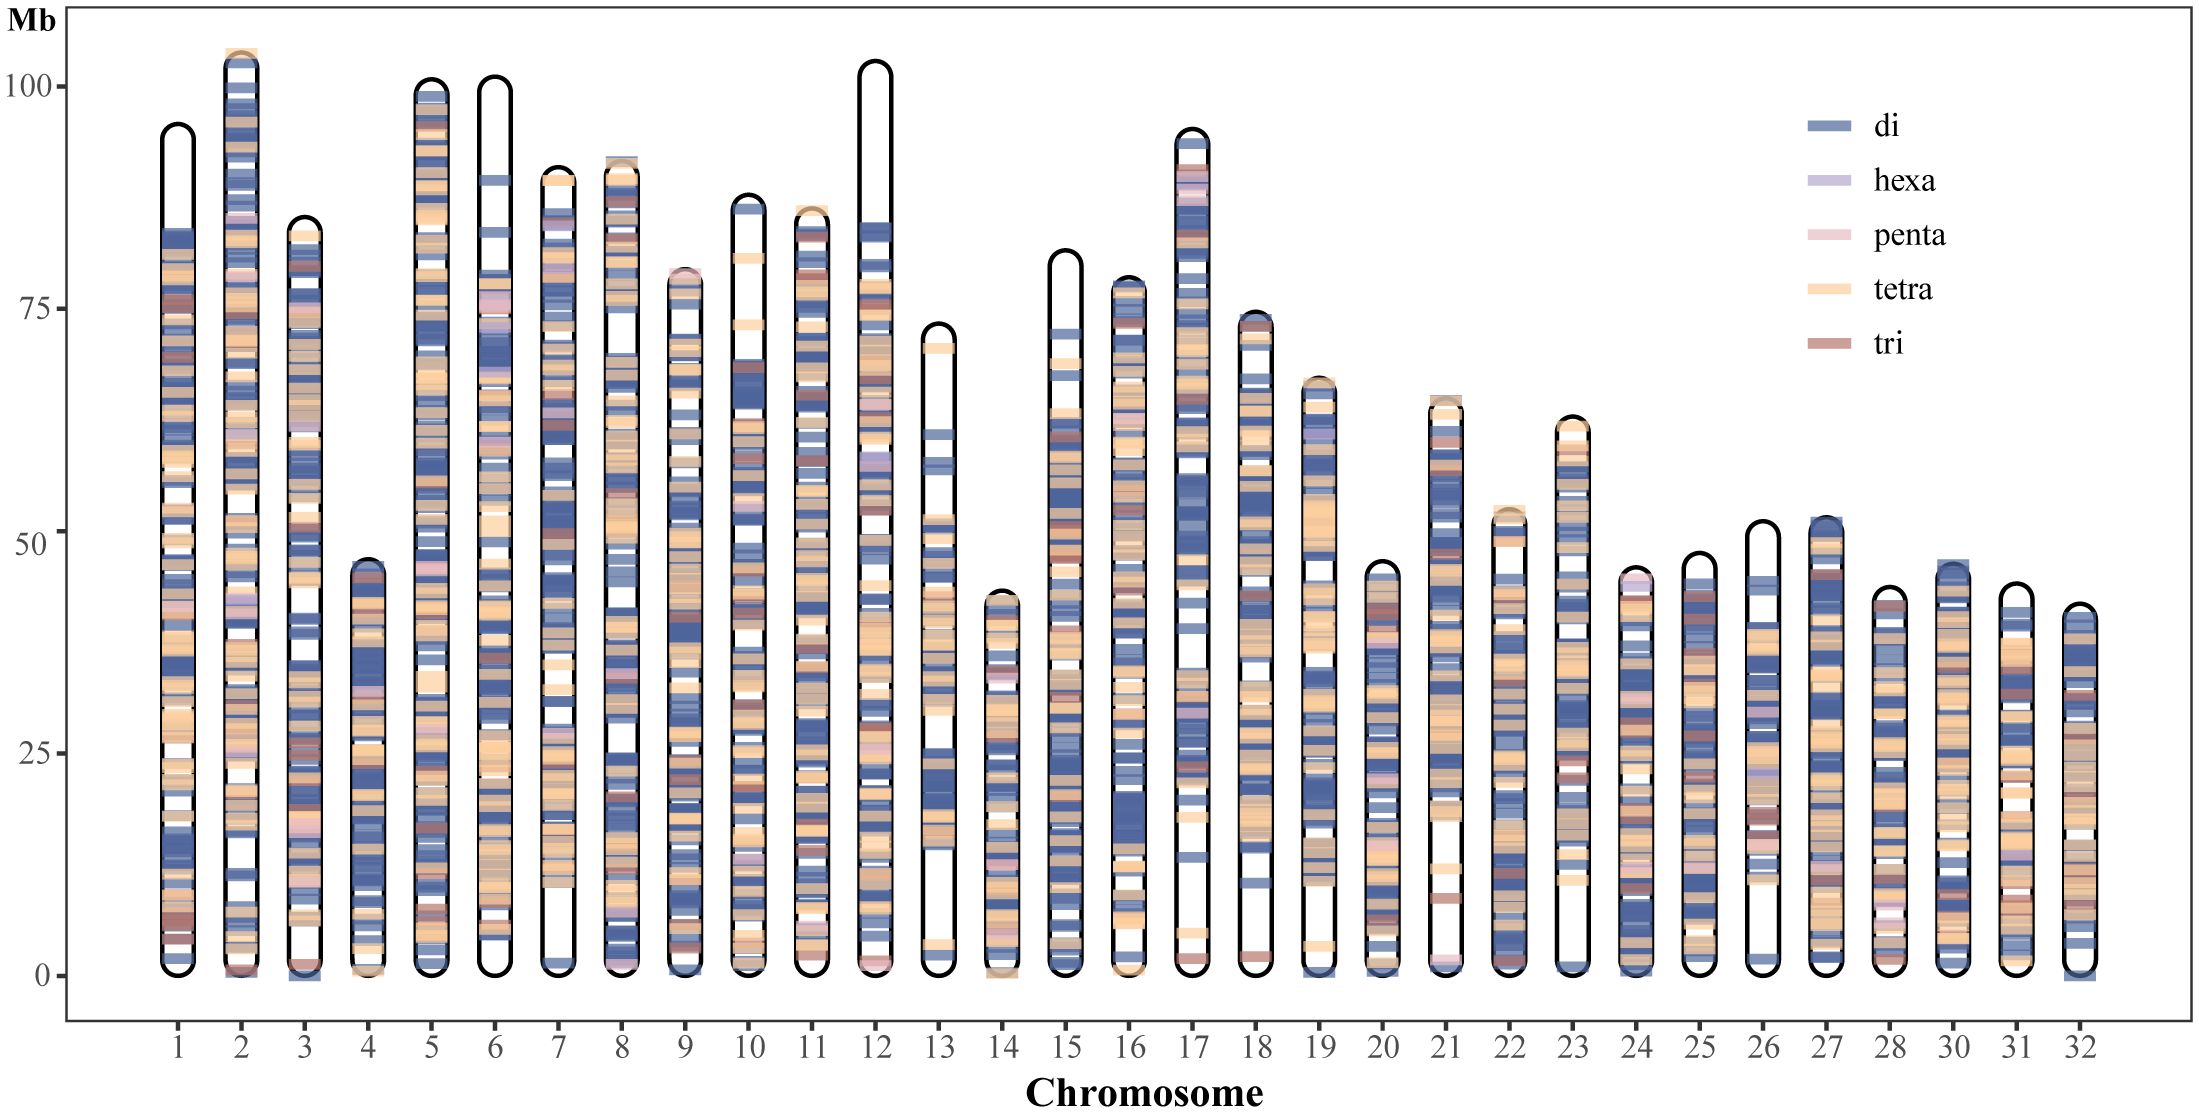
Figure 3 Physical map location and distribution of 4821 polymorphic SSRs in rainbow trout genome chromosome sequence.
Population structure analyses were performed on 68 rainbow trout samples using the 4,821 highly polymorphic SSR loci screened above. Genetic differences between the two populations were explored by PCA analysis in GenAlEx v. 6.503. Sixty-eight samples were differentiated into two main clusters, CH (red squares) and SK (blue diamonds) in the PCA plot (Figure 4A). Structure software was used to infer the optimal number of subgroups (K) for the 68 rainbow trout samples, K = 2 was selected as the best value, followed by K = 5 (Figure 4B). In addition, the population structure of the 68 samples was shown by Bayesian-based structure analysis (K = 2 and K = 5) (Figure 4C). In the Structure plot with K = 2, two subpopulations of individuals, Q1 and Q2, were labelled in blue and red, respectively. Group Q1 contained exactly 34 individuals from the CH population. Group Q2 also had precisely 34 individuals from the SK population. In the structure plot with K = 5, it remains possible to clearly distinguish the two populations on the basis of the colours of the subpopulation representatives, with the CH population predominantly marked in red, yellow, and blue and the SK population predominantly marked in pink and purple. In summary, population structure analyses of 68 rainbow trout samples using 4,821 highly polymorphic SSR loci yielded consistent results in Structure and PCA, all clearly distinguishing between CH and SK populations (Figures 4A, 4C).
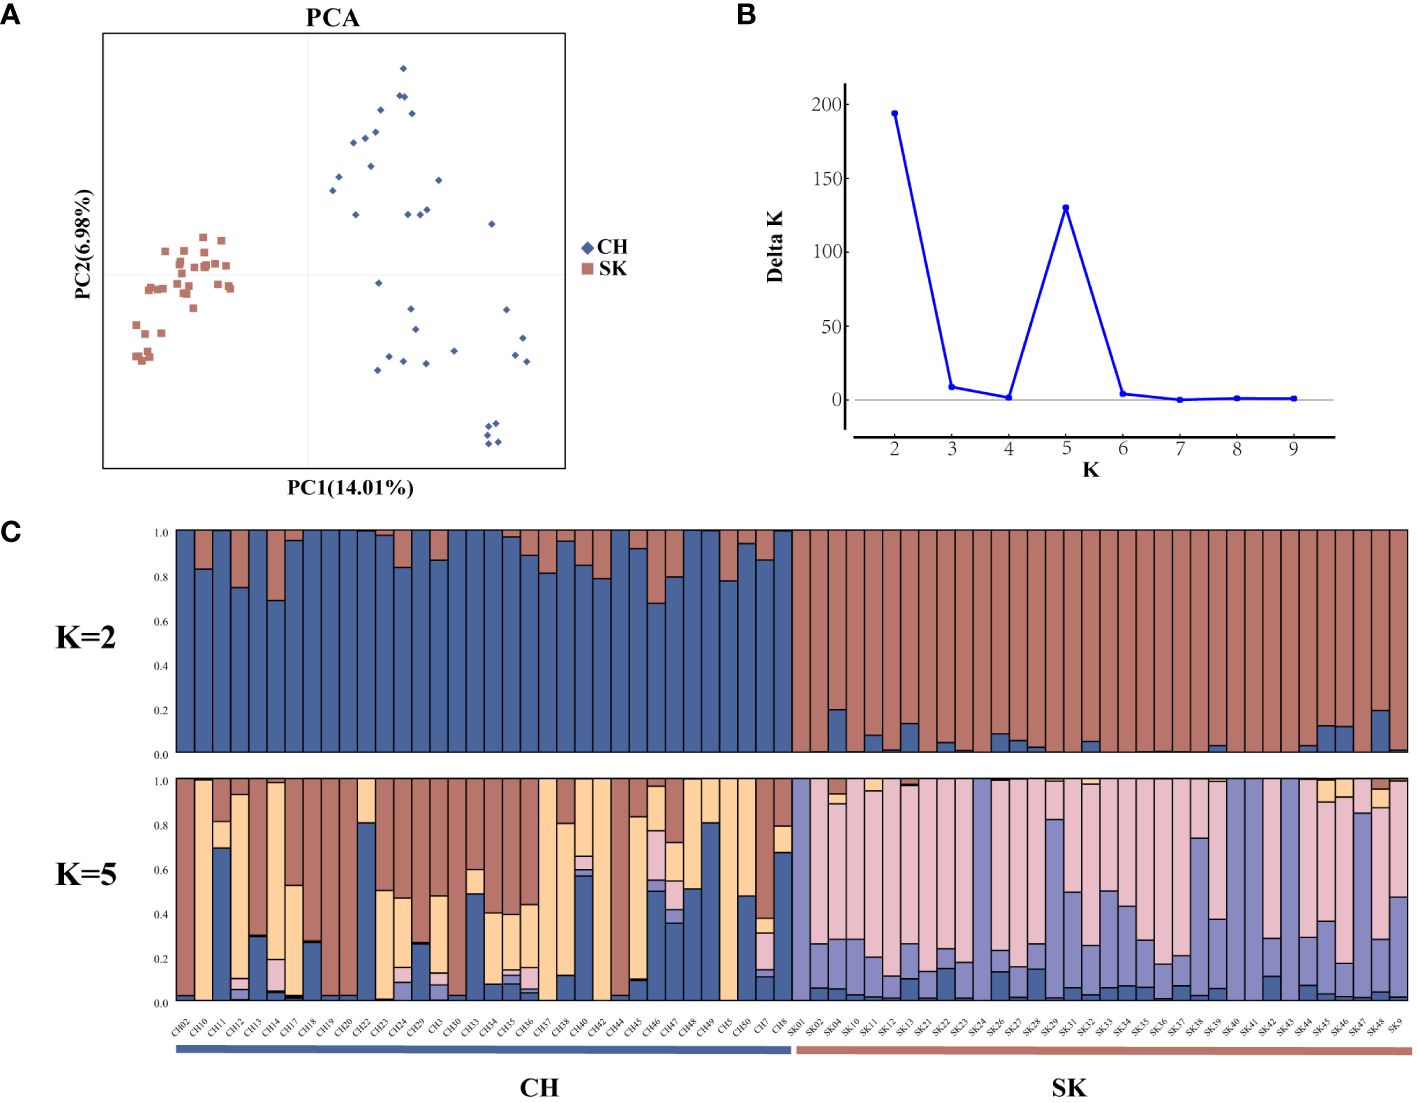
Figure 4 Population structure analysis of 68 rainbow trout samples. (A) Principal component analysis (PCA) for 68 rainbow trout samples using 4821 SSRs; (B) Distribution of △K at different K values; (C) Population structure of 68 rainbow trout samples inferred by genotyping 4821 SSRs (K = 2 and K = 5).
4 Discussion
Microsatellites are widely distributed in the genome of rainbow trout and are widely used for genetic relationship analysis (Spruell et al., 1999; Overturf et al., 2003; Silverstein et al., 2004; Bielikova et al., 2021), subspecies determination (Ostberg and Rodriguez, 2002), ploidy identification (Haibing et al., 2023), and quantitative trait locus mapping (Sakamoto et al., 1999; Perry et al., 2001; O'Malley et al., 2003; Perry et al., 2005; Haidle et al., 2008). Obtaining many SSR markers with high polymorphism and sound stability is crucial for promoting molecular resource management and genetic improvement (Sigang et al., 2021). With the advancement of sequencing technology, more and more whole-genome sequencing data for species have been made publicly available, facilitating the mining of SSR markers even more. In previous studies, SSR markers were usually developed by cloning and sequencing microsatellite-rich sequences. However, this method is costly, complex, and time-consuming (Rexroad et al., 2002; Rexroad and Palti, 2003; Rexroad et al., 2008). Although genome-wide or transcriptome data have been used for SSR marker mining in recent studies, often only a few loci are often randomly selected for polymorphism testing. Therefore, large-scale screening and assessment of polymorphisms for SSR loci mined from genome-wide or transcriptome data remains challenging. In addition, no study has been conducted so far to mine SSR loci from rainbow trout genome-wide data. In this study, we propose a novel approach to remedy the shortcomings of previous methods. First, SSR locus mining and primer design were performed based on the publicly available rainbow trout reference genome chromosome sequences. Then, whole genome resequencing data of multiple samples from different populations was combined with the mined SSR marker information, Genotyping was performed with the help of the HipSTR program to obtain information on the variation in the number of motif repeats of the SSR loci in the different samples to determining whether they were polymorphic. Subsequently, many screened SSR loci with high polymorphism were used to analyze the genetic relationships of individuals from diverse populations. In this study, we successfully developed SSR loci in 32 chromosomes of the rainbow trout genome and efficiently screened and identified many polymorphic loci from them.
In this study, 354,613 SSR loci were detected in the chromosome sequence of rainbow trout. On average, there were about 162.26 loci per 1 Mb of genomic chromosome sequence, which was lower than that of Lateolabrax maculatus (425.06 loci/Mb) (Sigang et al., 2021) and Solea senegalensis (886.7 loci/Mb) (Guerrero-Cózar et al., 2020). Among the five types of SSRs, dinucleotide repeat motifs had the highest number of SSRs, accounting for 86.16%. Microsatellites are formed mainly through the replication pulley mechanism, where mismatches between the nascent and template strands may lead to an increase or decrease in repetitive units during DNA replication. Microsatellite sequences with dinucleotide repeats are more common due to their relative shortness and susceptibility to slip, resulting in dinucleotide repeats (Levinson and Gutman, 1987). In addition, the higher mutation rate of dinucleotide repeat SSRs compared to other types of microsatellites may be one of the reasons why they are more common. However, it is worth noting that dinucleotide repeat sequences are prone to “stutter” during PCR, which may affect the subsequent analysis and interpretation of these sequences (Cipriani et al., 2008). Single nucleotide repeat SSR loci were not explored in this study because single nucleotide sequences are prone to errors in detection and analysis, resulting in inaccurate data (Flores Rentería and Whipple, 2011). Although the number of tri-, tetra-, penta-, and hexanucleotide motifs detected in the rainbow trout genome with a high number of repeats is relatively tiny compared to the number of dinucleotide repeats, they are less prone to amplification errors and “stutter” phenomena and are therefore more suitable for future genetic studies (Edwards et al., 1991; Brinkmann et al., 1998; Schug et al., 1998).
The distribution of microsatellites is closely related to the selective pressure during evolution, and different genomic regions may perform other functions. To determine the location of the mined SSR markers in the genome, this study compared the coordinate information of SSRs with the GFF files. It classified them into intergenic microsatellites and intragenic microsatellites. The results showed that a total of 78,828 polymorphic SSR loci were screened in this study, of which 53% were located in the intronic region of genes, 45.19% in the intergenic region, 1.42% in the exon region of genes, 0.21% in the UTR_3’ region, and 0.14% in the UTR_5’ region (Figure 2A). Exon regions are critical to gene function and have been subjected to more stringent selection pressures during evolution to retain the correct protein-coding sequences.
In contrast, intergenic and introns are likely subject to lower selective pressures during evolution and are more prone to accumulating SSRs. In addition, although UTR regions and introns are not coding regions, they have essential functions in gene regulation and stability. Among these five regions, polymorphic SSR loci with pentanucleotide and hexanucleotide repeats were detected only in the intergenic, intron, and exon (Figure 2B). This may be because the minimum number of times for detecting pentanucleotide and hexanucleotide motif repeats was set at 8 in this study, which is a high value relative to the values set in other studies and may have limited the detection of polymorphic SSR loci for pentanucleotide and hexanucleotide repeats in the UTR_5’ and UTR_3’ regions.
The effectiveness of microsatellite markers usually depends on factors such as the loci’s stability, polymorphisms, gene locus localisation, and primer design’s success. In this study, we successfully designed primers for the developed polymorphic loci and determined the distribution regions of these polymorphic loci in the genomic chromosomes (Supplementary Tables S4, S5). Valid microsatellite loci should maintain a stable presence across individuals. The stability of loci is usually assessed by detecting mutations or deletions among different individuals. Therefore, in this study, we retained 4821 SSR loci with polymorphism that were not detected missing in 68 rainbow trout samples, and determined the physical map locations of these loci on 32 chromosomes of rainbow trout (Figure 3). In addition, these 4,821 loci had an allele number greater than 3, with an average allele number of approximately 7. PIC is an essential indicator of population genetic diversity and is often used to measure genetic heterozygosity, with values ranging from 0 to 1, with 0 indicating no polymorphism and 1 indicating a very high degree of polymorphism. According to Botstein et al (Ghislain et al., 2004), PIC values can be classified into three intervals: PIC<0.25 for low polymorphism, 0.25<PIC<0,50 for medium polymorphism, and PIC>0.50 for high polymorphism. In this study, the average PIC value of 4,821 loci was 0.692, of which 4,451 (92.33%) loci had a PIC greater than 0.5, indicating that these loci were highly polymorphic. The null allele frequency of these polymorphic loci was about 6.5% on average. When the null allele frequency of individual loci averages between 5% and 8%, using of these loci for analyses such as genetic differentiation usually does not introduce bias (Oddou-Muratorio et al., 2009). Using these 4,821 loci with high polymorphisms, we revealed the population structure between 68 rainbow trout individuals. As expected, the results of PCA and structure analysis consistently and clearly separated these 68 individuals into two populations, the selected population (SK) and the wild population (CH). Finally, we annotated the gene function of these 4821 SSRs, and used them as reference resources for rainbow trout research, providing information basis for subsequent research in this field.
5 Conclusions
In summary, 354,613 SSR loci were mined in this study based on the available chromosome sequences of the rainbow trout reference genome. By analysing the whole genome sequencing data of 68 rainbow trout samples, 78,828 polymorphic SSR loci were successfully identified, and a new method for rapid screening of polymorphic loci was provided. The technique avoids time-consuming and laborious screening by molecular experiments. Considering the stability of loci, polymorphism, genetic locus positioning, and success rate of primer design, 4821 SSR loci with high polymorphism and validity were finally screened. These loci can be used for fingerprinting, genetic diversity analysis, phylogenetic study, population structure analysis, and mapping and molecular breeding of rainbow trout, which provides an essential reference for related research.
Data availability statement
The original contributions presented in the study are included in the article/Supplementary Material. Further inquiries can be directed to the corresponding authors.
Ethics statement
The animal study was approved by Heilongjiang Fisheries Research Institute, Chinese Academy of Fishery Sciences. The study was conducted in accordance with the local legislation and institutional requirements.
Author contributions
HM: Conceptualization, Data curation, Methodology, Software, Writing – original draft, Writing – review & editing. TH: Supervision, Formal analysis, Validation, Writing – review & editing. EL: Formal analysis, Supervision, Validation, Writing – review & editing. GW: Conceptualization, Data curation, Methodology, Software, Writing – review & editing. WG: Investigation, Resources, Writing – review & editing. GX: Funding acquisition, Project administration, Supervision, Validation, Writing – review & editing.
Funding
The author(s) declare financial support was received for the research, authorship, and/or publication of this article. Funding for this research was provided by the China Agriculture Research System of MOF and MARA (CARS-46), the Central Public-interest Scientific Institution Basal Research Fund, CAFS (NO. 2023TD96), the Central Public-interest Scientific Institution Basal Research Fund, HRFRI (NO. HSY202309K), and the Central Public-interest Scientific Institution Basal Research Fund, HRFRI(NO.HSY202203M).
Conflict of interest
The authors declare that the research was conducted in the absence of any commercial or financial relationships that could be construed as a potential conflict of interest.
Publisher’s note
All claims expressed in this article are solely those of the authors and do not necessarily represent those of their affiliated organizations, or those of the publisher, the editors and the reviewers. Any product that may be evaluated in this article, or claim that may be made by its manufacturer, is not guaranteed or endorsed by the publisher.
Supplementary material
The Supplementary Material for this article can be found online at: https://www.frontiersin.org/articles/10.3389/fmars.2024.1375524/full#supplementary-material
References
Abdul-Muneer P. M. (2014). Application of microsatellite markers in conservation genetics and fisheries management: recent advances in population structure analysis and conservation strategies. Genet. Res. Int. 2014, 1–11. doi: 10.1155/2014/691759
Ariede R. B., Freitas M. V., Hata M. E., Matrochirico-Filho V. A., Utsunomia R., Mendonça F. F., et al. (2018). Development of microsatellite markers using next-generation sequencing for the fish Colossoma macropomum. Mol. Biol. Rep. 45, 9–18. doi: 10.1007/s11033-017-4134-z
Barszcz A., Szarek J., Skibniewska K., Polak-Juszczak L., Barszcz A., Siemianowska E., et al. (2016). Mineral content of muscle tissue of rainbow trout (Oncorhynchus mykiss walbaum). J. Elem. 21, 833–845. doi: 10.5601/jelem.2015.20.4.1004
Bhattarai G., Mehlenbacher S. A. (2017). In silico development and characterization of tri-nucleotide simple sequence repeat markers in hazelnut (Corylus avellana l.). PLoS One 12, e178061. doi: 10.1371/journal.pone.0178061
Bielikova O., Тarasjuk S., Mruk A., Zaloilo O., Didenko A. (2021). Microsatellite-based analysis of genetic diversity and population structure of rainbow trout (Oncorhynchus mykiss) cultured in Ukraine. Genet. Aquat. Organisms 5, 29–39. doi: 10.4194/2459-1831-v5_1_04
Brinkmann B., Klintschar M., Neuhuber F., Hühne J., Rolf B. (1998). Mutation rate in human microsatellites: influence of the structure and length of the tandem repeat. Am. J. Hum. Genet. 62, 1408–1415. doi: 10.1086/301869
Chen S., Zhou Y., Chen Y., Gu J. (2018). Fastp: an ultra-fast all-in-one fastq preprocessor. Bioinformatics 34, i884–i890. doi: 10.1093/bioinformatics/bty560
Ciezarek A., Ford A. G. P., Etherington G. J., Kasozi N., Malinsky M., Mehta T. K., et al. (2022). Whole genome resequencing data enables a targeted snp panel for conservation and aquaculture of oreochromis cichlid fishes. Aquaculture 548, 737637. doi: 10.1016/j.aquaculture.2021.737637
Cipriani G., Marrazzo M. T., Di Gaspero G., Pfeiffer A., Morgante M., Testolin R. (2008). A set of microsatellite markers with long core repeat optimized for grape (Vitis spp.) Genotyping. BMC Plant Biol. 8, 127. doi: 10.1186/1471-2229-8-127
Earl D. A., VonHoldt B. M. (2012). Structure harvester: a website and program for visualizing structure output and implementing the evanno method. Conserv. Genet. Resour 4, 359–361. doi: 10.1007/s12686-011-9548-7
Edwards A., Civitello A., Hammond H. A., Caskey C. T. (1991). Dna typing and genetic mapping with trimeric and tetrameric tandem repeats. Am. J. Hum. Genet. 49, 746–756.
Ellegren H. (2004). Microsatellites: simple sequences with complex evolution. Nat. Rev. Genet. 5, 435–445. doi: 10.1038/nrg1348
Evanno G., Regnaut S., Goudet J. (2005). Detecting the number of clusters of individuals using the software STRUCTURE: a simulation study. Mol. Ecol. 14, 2611–2620. doi: 10.1111/j.1365-294X.2005.02553.x
Feng B., Yi S. V., Zhang M., Zhou X. (2018). Development of novel est-ssr markers for ploidy identification based on de novo transcriptome assembly for Misgurnus anguillicaudatus. PLoS One 13, e195829. doi: 10.1371/journal.pone.0195829
Flores Rentería L., Whipple A. V. (2011). A new approach to improve the scoring of mononucleotide microsatellite loci. Am. J. Bot. 98, e51–e53. doi: 10.3732/ajb.1000428
Gao G., Magadan S., Waldbieser G. C., Youngblood R. C., Wheeler P. A., Scheffler B. E., et al. (2021). A long reads-basedde-novo assembly of the genome of the arlee homozygous line reveals chromosomal rearrangements in rainbow trout. G3 Genes|Genomes|Genetics 11, jkab052. doi: 10.1093/g3journal/jkab052
Ghislain M., Spooner D. M., Rodríguez F., Villamón F., Núñez J., Vásquez C., et al. (2004). Selection of highly informative and user-friendly microsatellites (SSRs) for genotyping of cultivated potato. Theor. Appl. Genet. 108, 881–890. doi: 10.1007/s00122-003-1494-7
Guerrero-Cózar I., Perez-Garcia C., Benzekri H., Sánchez J. J., Seoane P., Cruz F., et al. (2020). Development of whole-genome multiplex assays and construction of an integrated genetic map using ssr markers in Senegalese sole. Sci. Rep. 10, 21905. doi: 10.1038/s41598-020-78397-w
Guo B., Xie C., Qi L., Qi P., Wu C., Abbas K. (2010). Assessment of the genetic diversity among glyptosternum maculatum, an endemic fish of yarlung zangbo river, tibet, China using ssr markers. Biochem. Syst. Ecol. 38, 1116–1121. doi: 10.1016/j.bse.2010.12.008
Haibing M., Tianqing H., Gefeng X., Fuyuan G., Fulin D., Longhua Z., et al. (2023). Screening and application of ssr markers for identification of ploidy in Oncorhynchus mykiss. Prog. Fishery Sci. 1-10. doi: 10.19663/j.issn2095-9869.20230226001
Haidle L., Janssen J. E., Gharbi K., Moghadam H. K., Ferguson M. M., Danzmann R. G. (2008). Determination of quantitative trait loci (qtl) for early maturation in rainbow trout (Oncorhynchus mykiss). Mar. Biotechnol. (Ny) 10, 579–592. doi: 10.1007/s10126-008-9098-5
Hollenbeck C. M., Portnoy D. S., Wetzel D., Sherwood T. A., Samollow P. B., Gold J. R. (2017). Linkage mapping and comparative genomics of red drum (Sciaenops Ocellatus) using next-generation sequencing. G3: Genes Genomes Genet. 7, 843–850. doi: 10.1534/g3.116.036350/-/DC1
Jakobsson M., Rosenberg N. A. (2007). Clumpp: a cluster matching and permutation program for dealing with label switching and multimodality in analysis of population structure. Bioinformatics 23, 1801–1806. doi: 10.1093/bioinformatics/btm233
Jiang Q., Li Q., Yu H., Kong L. (2014). Genome-wide analysis of simple sequence repeats in marine animals—a comparative approach. Mar. Biotechnol. (Ny) 16, 604–619. doi: 10.1007/s10126-014-9580-1
Kalinowski S. T., Taper M. L., Marshall T. C. (2007). Revising how the computer programcervus accommodates genotyping error increases success in paternity assignment. Mol. Ecol. 16, 1099–1106. doi: 10.1111/j.1365-294X.2007.03089.x
Layton K. K. S., Dempson B., Snelgrove P. V. R., Duffy S. J., Messmer A. M., Paterson I. G., et al. (2020). Resolving fine-scale population structure and fishery exploitation using sequenced microsatellites in a northern fish. Evol. Appl. 13, 1055–1068. doi: 10.1111/eva.12922
Levinson G., Gutman G. A. (1987). Slipped-strand mispairing: a major mechanism for dna sequence evolution. Mol. Biol. Evol. 4, 203–221. doi: 10.1093/oxfordjournals.molbev.a040442
Li H. (2013). Aligning sequence reads, clone sequences and assembly contigs with bwa-mem. arXiv preprint. doi: 10.48550/arXiv.1303.3997
Li H., Handsaker B., Wysoker A., Fennell T., Ruan J., Homer N., et al. (2009). The sequence alignment/map format and samtools. Bioinformatics 25, 2078–2079. doi: 10.1093/bioinformatics/btp352
Luo W., Nie Z., Zhan F., Wei J., Wang W., Gao Z. (2012). Rapid development of microsatellite markers for the endangered fish Schizothorax biddulphi (günther) using next generation sequencing and cross-species amplification. Int. J. Mol. Sci. 13, 14946–14955. doi: 10.3390/ijms131114946
Mason A. S. (2015). Ssr genotyping. Plant genotyping: Methods Protoc., 77–89. doi: 10.1007/978-1-4939-1966-6_6
Napora-Rutkowski A., Rakus K., Nowak Z., Szczygieł J., Pilarczyk A., Ostaszewska T., et al. (2017). Genetic diversity of common carp (Cyprinus carpio l.) Strains breed in Poland based on microsatellite, aflp, and mtdna genotype data. Aquaculture 473, 433–442. doi: 10.1016/j.aquaculture.2017.03.005
O'Malley K. G., Sakamoto T., Danzmann R. G., Ferguson M. M. (2003). Quantitative trait loci for spawning date and body weight in rainbow trout: testing for conserved effects across ancestrally duplicated chromosomes. J. Heredity 94, 273–284. doi: 10.1093/jhered/esg067
Oddou-Muratorio S., Vendramin G. G., Buiteveld J., Fady B. (2009). Population estimators or progeny tests: what is the best method to assess null allele frequencies at ssr loci? Conserv. Genet. 10, 1343–1347. doi: 10.1007/s10592-008-9648-4
Ostberg C. O., Rodriguez R. J. (2002). Novel molecular markers differentiate Oncorhynchus mykiss (rainbow trout and steelhead) and the O. clarki (cutthroat trout) subspecies. Mol. Ecol. Notes 2, 197–202. doi: 10.1046/j.1471-8286.2002.00181.x
Overturf K., Casten M. T., LaPatra S. L., Rexroad C., Hardy R. W. (2003). Comparison of growth performance, immunological response and genetic diversity of five strains of rainbow trout (oncorhynchus mykiss). Aquaculture 217, 93–106. doi: 10.1016/S0044-8486(02)00014-5
Peakall R., Smouse P. E. (2012). Genalex 6.5: genetic analysis in excel. Population genetic software for teaching and research—an update. Bioinformatics 28, 2537–2539. doi: 10.1093/bioinformatics/bts460
Perry G. M., Danzmann R. G., Ferguson M. M., Gibson J. P. (2001). Quantitative trait loci for upper thermal tolerance in outbred strains of rainbow trout (Oncorhynchus mykiss). Heredity (Edinb) 86, 333–341. doi: 10.1046/j.1365-2540.2001.00838.x
Perry G. M. L., Ferguson M. M., Sakamoto T., Danzmann R. G. (2005). Sex-linked quantitative trait loci for thermotolerance and length in the rainbow trout. J. Hered 96, 97–107. doi: 10.1093/jhered/esi019
Rexroad III, C.E., Coleman R. L., Gustafson A. L., Hershberger W. K., Killefer J. (2002). Development of rainbow trout microsatellite markers from repeat enriched libraries. Mar. Biotechnol. (Ny) 4, 12–16. doi: 10.1007/s10126-001-0058-6
Rexroad C. E., Palti Y. (2003). Development of ninety-seven polymorphic microsatellite markers for rainbow trout. Trans. Am. Fisheries Soc. (1900) 132, 1214–1221. doi: 10.1577/T02-086
Rexroad R. C. E., Palti Y., Gahr S. A., Vallejo R. L. (2008). A second generation genetic map for rainbow trout (Oncorhynchus mykiss). BMC Genet. 9, 74. doi: 10.1186/1471-2156-9-74
Sakamoto T., Danzmann R. G., Okamoto N., Ferguson M. M., Ihssen P. E. (1999). Linkage analysis of quantitative trait loci associated with spawning time in rainbow trout (Oncorhynchus mykiss). Aquaculture 173, 33–43. doi: 10.1016/S0044-8486(98)00463-3
Santigosa E., Constant D., Prudence D., Wahli T., Verlhac Trichet V. (2020). A novel marine algal oil containing bothepa anddha is an effective source of omega-3 fatty acids for rainbow trout (Oncorhynchus mykiss). J. World Aquac Soc. 51, 649–665. doi: 10.1111/jwas.12699
Schug M. D., Wetterstrand K. A., Gaudette M. S., Lim R. H., Hutter C. M., Aquadro C. F. (1998). Distribution and frequency of microsatellite loci in drosophila melanogaster. Mol. Ecol. 7, 57–70. doi: 10.1046/j.1365-294x.1998.00304.x
Sharma L., Ali S., Siva C., Kumar R., Barat A., Sahoo P. K., et al. (2019). Genetic diversity and population structure of the threatened chocolate mahseer (Neolissochilus hexagonolepis mcclelland 1839) based on ssr markers: implications for conservation management in northeast India. Mol. Biol. Rep. 46, 5237–5249. doi: 10.1007/s11033-019-04981-7
Sigang F., Hao H., Yong L., Pengfei W., Chao Z., Lulu Y., et al. (2021). Genome-wide identification of microsatellite and development of polymorphic ssr markers for spotted sea bass (Lateolabrax maculatus). Aquac Rep. 20, 100677. doi: 10.1016/j.aqrep.2021.100677
Silverstein J. T., Rexroad C. E. III, King T. L. (2004). Genetic variation measured by microsatellites among three strains of domesticated rainbow trout (Oncorhynchus mykiss, Walbaum). Aquaculture Res. 35, 40–48. doi: 10.1111/j.1365-2109.2004.00979.x
Spruell P., Rieman B. E., Knudsen K. L., Utter F. M., Allendorf F. W. (1999). Genetic population structure within streams: microsatellite analysis of bull trout populations. Ecol. Freshw. Fish 8, 114–121. doi: 10.1111/j.1600-0633.1999.tb00063.x
Stancheva M. (2010). Vitamin content and fatty acids composition of rainbow trout (Oncorhynchus mykiss) (Plodiv. University, Paisii Hilendarski, Bulgaria Scientific Papers, Book) 5, 117–123.
Sun L., Engle C. R., Kumar G., van Senten J. (2023). Supermarket trends for rainbow and steelhead trout products: evidence from scanner data. Aquac Rep. 30, 101579. doi: 10.1016/j.aqrep.2023.101579
Tian H., Hu Q., Li Z. (2021). Genome-wide identification of simple sequence repeats and development of polymorphic ssr markers in swamp eel (Monopterus albus). Sci. Prog. 104, 39829613. doi: 10.1177/00368504211035597
Tóth G., Gáspári Z., Jurka J. (2000). Microsatellites in different eukaryotic genomes: survey and analysis. Genome Res. 10, 967–981. doi: 10.1101/gr.10.7.967
Turchini G. M., Hermon K. M., Francis D. S. (2018). Fatty acids and beyond: fillet nutritional characterisation of rainbow trout (Oncorhynchus mykiss) fed different dietary oil sources. 491, 391–397. doi: 10.1016/j.aquaculture.2017.11.056
Wang X., Wang L. (2016). Gmata: an integrated software package for genome-scale ssr mining, marker development and viewing. Front. Plant Sci. 7. doi: 10.3389/fpls.2016.01350
Weaver K. L., Ivester P., Chilton J. A., Wilson M. D., Pandey P., Chilton F. H. (2008). The content of favorable and unfavorable polyunsaturated fatty acids found in commonly eaten fish. J. Am. Dietetic Assoc. 108, 1178–1185. doi: 10.1016/j.jada.2008.04.023
Willems T., Zielinski D., Yuan J., Gordon A., Gymrek M., Erlich Y. (2017). Genome-wide profiling of heritable and de novo str variations. Nat. Methods 14, 590–592. doi: 10.1038/nmeth.4267
Xu S., Zhao L., Xiao S., Gao T. (2019). Whole genome resequencing data for three rockfish species of sebastes. Sci. Data 6, 97. doi: 10.1038/s41597-019-0100-z
Keywords: rainbow trout (Oncorhynchus mykiss), salmon, population genetics, microsatellite markers, bioinformatics
Citation: Ma H, Huang T, Liu E, Wang G, Gu W and Xu G (2024) Development of polymorphic simple sequences repeats markers from whole gene resequencing data comparison of 68 Oncorhynchus mykiss. Front. Mar. Sci. 11:1375524. doi: 10.3389/fmars.2024.1375524
Received: 24 January 2024; Accepted: 22 March 2024;
Published: 16 April 2024.
Edited by:
Pablo Presa, University of Vigo, SpainCopyright © 2024 Ma, Huang, Liu, Wang, Gu and Xu. This is an open-access article distributed under the terms of the Creative Commons Attribution License (CC BY). The use, distribution or reproduction in other forums is permitted, provided the original author(s) and the copyright owner(s) are credited and that the original publication in this journal is cited, in accordance with accepted academic practice. No use, distribution or reproduction is permitted which does not comply with these terms.
*Correspondence: Gefeng Xu, xugefeng@hrfri.ac.cn