Genetic structure of ten Artemia populations from China: cumulative effects of ancient geological events, climatic changes, and human activities
 Ke Li
Ke Li Rui Zhang
 Li-Ying Sui
 Chi Zhang
 Xue-Kai Han
- 1Asian Regional Artemia Reference Center, Key Laboratory of Marine Resource Chemistry and Food Technology (TUST), Tianjin University of Science and Technology, Tianjin, China
- 2International Artemia Aquaculture Consortium (IAAC), Network of Aquaculture Centres in Asia-Pacific, Bangkok, Thailand
- 3Institute of Fisheries Science, Tibet Academy of Agricultural and Animal Husbandry Sciences, Lhasa, China
This study investigated the population genetics and distribution patterns of Artemia populations from ten inland salt lakes in China. A total of 1,274,698 Artemia single nucleotide polymorphisms (SNPs) were identified. The results showed that these populations could be geographically and genetically divided into four distinct groups, and that the Tibetan populations were further divided into two subpopulations with a trend of decreasing genetic diversity from west to east. The Tibetan population had the highest genetic diversity, whereas the Shanxi population had the lowest. There was moderate genetic differentiation between the Tibetan populations and greater genetic differentiation between the Xinjiang and Shanxi populations. IBD (isolation by distance) suggested that geographical isolation contributes to genetic differentiation. In addition, there was some degree of gene flow among the ten populations, with A. sinica showing unidirectional gene flow in all populations in the eastern Nagri region. Species distribution modeling showed that mean annual temperature, temperature seasonality, and annual precipitation were the main environmental factors affecting the distribution of Artemia populations and suitable habitats for Tibetan populations will be further reduced in the future. It is necessary to strengthen the protection of germplasm resources and formulate scientific protocols for the sustainable development and utilization of Artemia resources.
1 Introduction
The brine shrimp Artemia is a small crustacean that lives in hypersaline habitats such as salt lakes and coastal salt pans worldwide. In addition to being a major part of the food chain and a biological regulator of brine ecosystems (Triantaphyllidis et al., 1998; Sánchez et al., 2006; Georgiev et al., 2007), Artemia, especially Artemia nauplii obtained by hatching Artemia cysts, are crucial live food items in fish and shrimp larviculture (Sorgeloos et al., 2001). As a natural resource, the yield and quality of Artemia cysts are greatly influenced by environmental factors, such as salinity, temperature, food availability, and harvesting management (Wurtsbaugh and Maciej Gliwicz, 2001; Torrentera and Dodson, 2004; Van Stappen et al., 2020). In recent years, global warming has led to an increase in surface evaporation and changes in the spatiotemporal pattern of precipitation (Li et al., 2018), resulting in changes in the spatiotemporal distribution and biological diversity. Compared with marine and freshwater environments, the diversity and number of species in high-salinity habitat systems are often limited, making them more vulnerable and posing greater threats to biodiversity within these ecosystems. Salinity is the main environmental factor for the survival and reproduction of Artemia (Torrentera and Dodson, 2004). Artemia can survive in a salinity range of 15–300 g/L (Sung et al., 2008). However, the Artemia population suffers from significant salinity fluctuations in salt lakes. For example, the gradual drying of Lake Urmia in Iran has led to near-saturation levels of lake salinity and the loss of more than 90% of the Artemia population over the past two decades (Asem et al., 2019). In contrast, the Qinghai-Tibet Plateau (QTP) is experiencing warming and changing precipitation patterns, with a steady flow of freshwater from glaciers and snowmelt on the QTP into the plateau salt lakes, leading to salinity reduction and further triggering the survival crisis of Artemia in these salt lakes (Song et al., 2017). For instance, Qixiang Co, the most productive salt lake for Artemia cysts on the QTP, has gradually approached a salinity limit of 40 g/L in recent years.
Climate fluctuations are important drivers of changes in the current distribution, genetic diversity, and abundance of many species and communities (Hewitt, 2004). Species distribution models (SDMs) are among the primary tools used to infer the habitats of past species (Gavin et al., 2014). Combining SDMs with genetic analyses can reveal population differences across distributional ranges as well as population expansion and contraction. Moreover, SDMs can help explain the adaptive responses of different geographic populations to current and future environmental conditions and provide more accurate range estimates for the conservation management of threatened populations. Although climate change has threatened the sustainable production of Artemia cysts in recent years, currently there have been no reports that have combined SDMs and population genetics to study the responses of Artemia species to global warming.
Genetic diversity is the core of conservation research on species and a prerequisite for survival, adaptation, and evolution. The study of the diversity and population structure between and within populations is essential for the effective management of genetic resources. In recent years, molecular markers such as SSR, COI, and ITS1 (Han et al., 2019; Li et al., 2024) have been used to study the population genetic structure and genetic diversity of Artemia. The results showed that the genetic structure was clear between the Tibetan, Xinjiang, and Shanxi populations but was more complex within the Tibetan populations. Compared to these molecular markers, single-nucleotide polymorphisms (SNPs) have recently been recognized as some of the most popular molecular markers for genetic research because of their abundance, high stability, high polymorphism, etc (You et al., 2020). The emergence of multiple high-throughput sequencing technologies such as Rad-Seq, GBS, and SLAF-Seq has made it possible to obtain a large number of markers for population genetic analysis, germplasm resource evaluation, and phylogenetic evolution studies in many animals and plants. More recently, the SLAF-seq method was used to develop SNP markers and construct the first high-density genetic linkage map for Artemia franciscana (Han et al., 2021). However, there are few reports on the application of SNP in Artemia population genetics and molecular phylogeny (Li et al., 2024).
The genus Artemia has six sexually dimorphic species (Artemia. franciscana, Artemia. persimilis, Artemia. salina, Artemia. sinica, Artemia. urmiana, and Artemia. tibetiana) and many parthenogenetic Artemia populations. Recently, three new species (Artemia. murae, Artemia. frameshifta, and Artemia. sorgeloosi) were identified in the salt lakes in Mongolia and China (Naganawa and Mura, 2017; Asem et al., 2023). A. tibetiana and A. sinica are indigenous to China. The traditional view is that all Artemia species in Tibet belong to A. tibetiana. While salt lakes in Tibet are geographically close, they are relatively isolated, showing a fragmented distribution that may result in a certain degree of genetic differentiation of Artemia in Tibet. In recent years, people have introduced A. sinica and colonized successfully in Tibet, which, combined with the fact that Artemia cysts can be transmitted by waterfowls (Vest and Conover, 2011; Reynolds et al., 2015), necessitates studies into gene flows between salt lakes. There is evidence that Artemia populations in Tibet do not all belong to A. tibetiana (Abatzopoulos et al., 1998; Asem et al., 2023). Therefore, further research is needed to better understand the population genetic structure of Artemia in this region.
Artemia has a short reproductive cycle, viviparous and ovoviviparous reproduction modes, high level of genetic variability, and easy handling in the laboratory; thus, it is an ideal experimental organism in genetics, developmental biology, and molecular biology studies (Baxevanis et al., 2006; Duan et al., 2014, 2022). This study aimed to (1) determine the genetic diversity of Artemia in central and western China to guide the rational exploitation of Artemia resources, (2) explore the genetic structure to provide a reasonable reference for taxonomy (especially Tibetan Artemia), and (3) elucidate the relationship between geographic isolation and genetic differentiation using IBD (isolation by distance). This was the first time that Treemix and Maxent were used to study gene flow and species distribution to explore the historical dynamics of Artemia populations.
2 Materials and methods
2.1 Sampling and sequencing
Artemia cysts were collected from salt lakes in the Nagri region of Tibet (Qixiang Co, Bange Co, Dangqiong Co, Daduo Co, Dong Co, Lagkor Co, and Nieer Co), Aibi Lake, and Balikun Lake in Xinjiang Province, and Yuncheng Salt Lake in Shanxi Province (Table 1, Figure 1). These salt lakes are large, rich in Artemia and Artemia cysts, and cover different levels of salinity and can thus represent the diversity of Artemia in the three regions. The cysts were hatched for 24 h following the general hatching procedure (Lavens and Sorgeloos, 1996) and Artemia nauplii were collected in 1-L cones and reared at 28°C and salinity 30 g/L for approximately 25 days and fed with the microalgae Chlorella vulgaris (De Vos et al., 2019). Then 10 adult Artemia samples were collected from each population, and DNA was extracted using a tissue genomic DNA extraction kit (Tianjin Lanrui Biotechnology Co., Ltd., China). The DNA concentration was measured using a nucleic acid protein meter (Eppendorf, BioPhotometer) and DNA quality was determined on a 1.2% agarose gel.
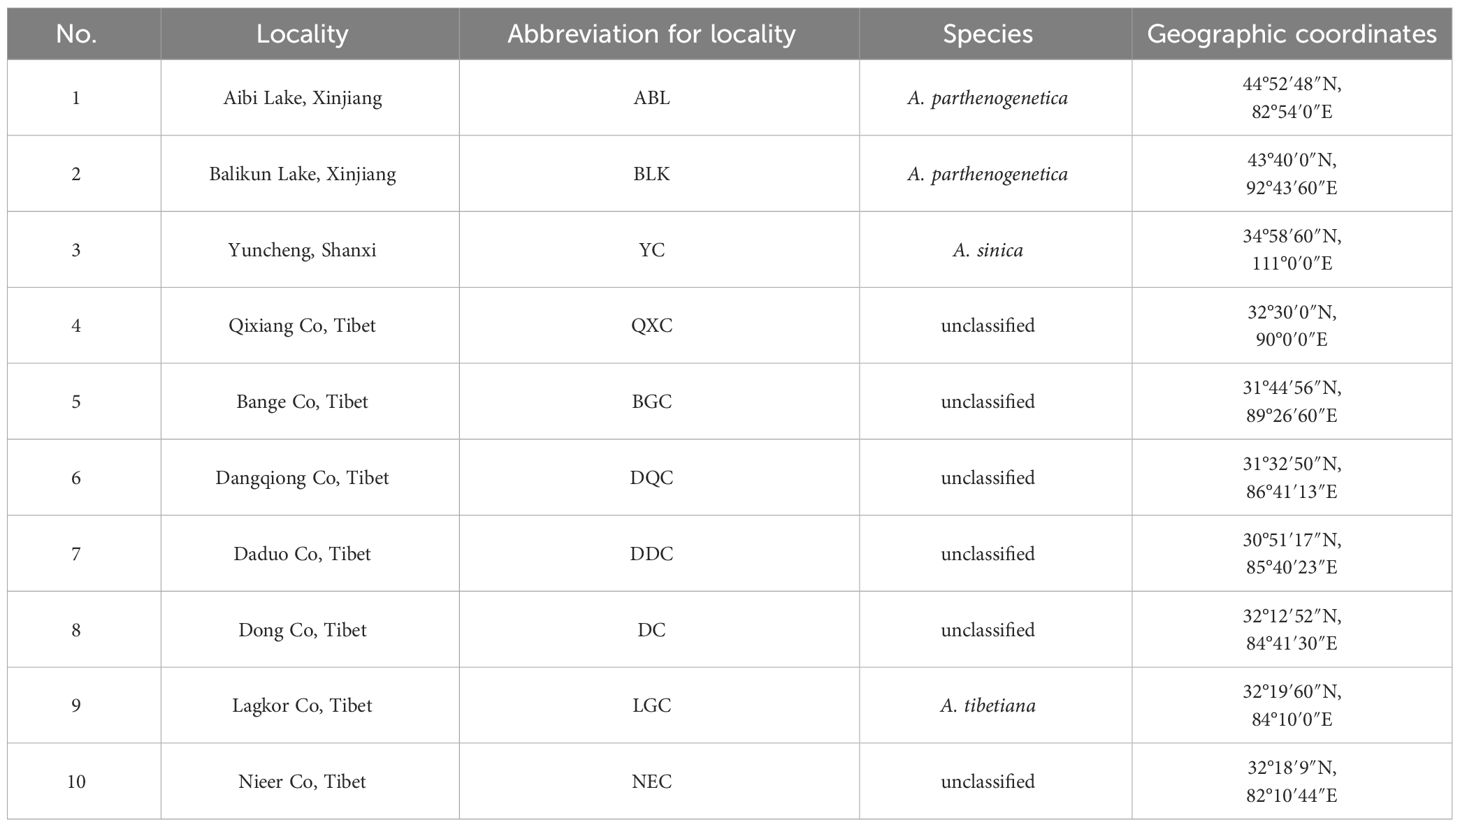
Table 1 Origin of Artemia cyst samples in this study.
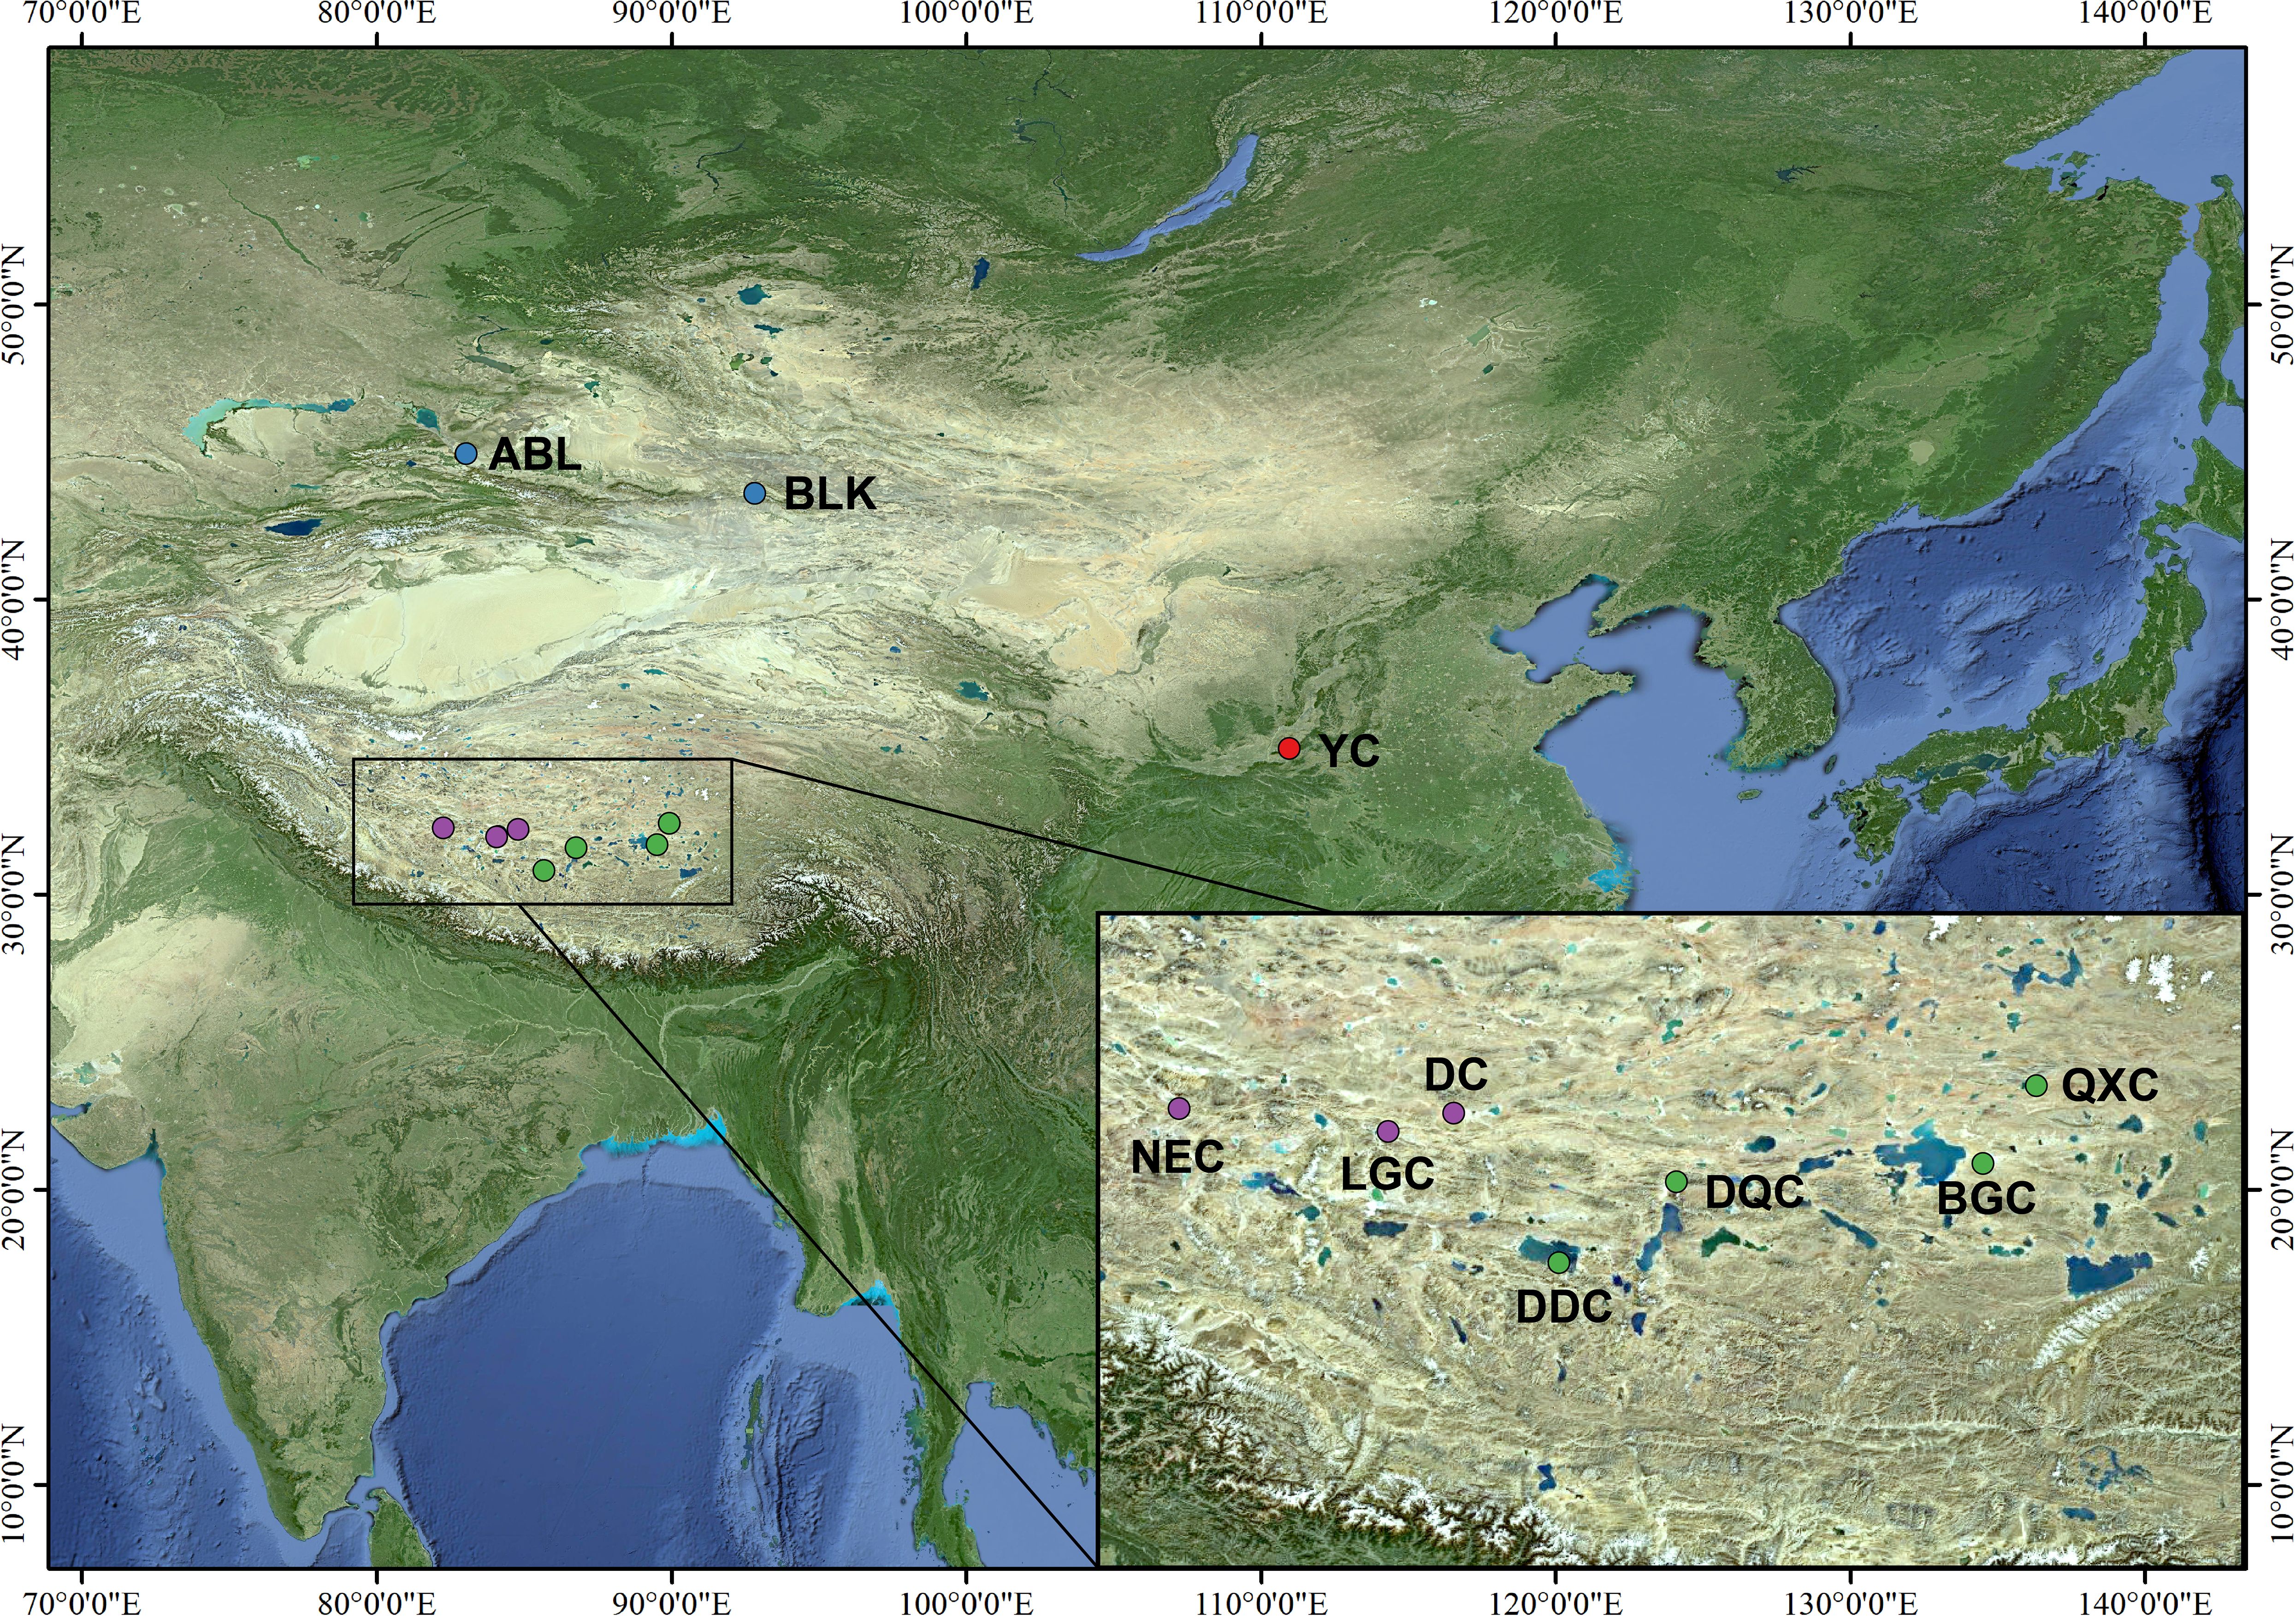
Figure 1 Distribution of 10 Artemia populations in China.
Large-scale SNP discovery and genotyping were performed on 100 samples using SLAF-seq (Sun et al., 2013) to obtain genome-wide molecular markers. Based on the results of electron digestion training, a combination of HaeIII and Hpy166II restriction enzymes was selected to digest genomic DNA. Briefly, the resulting fragments were processed with A at the 3’ end, ligated with Dual-index sequencing connectors, amplified using PCR, purified, mixed, and gummed to select the target fragments (Kozich et al., 2013). Subsequently, DNA fragments of 364–414 bp were gel-purified and diluted for sequencing on an Illumina High-seq 6000 platform.
2.2 SNP calling
The SNP markers were developed using the sequence type with the highest depth in each SLAF tag as the reference sequence (Wei et al., 2020). After an initial quality check of the raw data, low-quality reads (N content > 10%, > 50% of bases with quality values < 10) were removed. We clustered all the paired-end reads into SLAF loci with clear index information based on sequence similarity above 90% using LAST software and concatenated all loci into a “fake” reference genome. For each locus, a reference sequence was selected based on the maximum sequencing depth of the corresponding SLAF tag. Sequenced reads were compared to the reference genome using BWA, and SNPs were developed using both GATK and SAM tools (Li et al., 2009; McKenna et al., 2010). The SNP marker intersection obtained using both methods was used as the final SNP marker dataset (Li and Durbin, 2009). Finally, SNPs with minor allele frequencies (MAF) above 5% and completeness above 50% were selected for population genetic analysis.
2.3 Population genetic analysis
The population structure was constructed and genetic diversity was calculated based on 156,695 SNPs. Genetic diversity indicators included the number of alleles (Na), expected heterozygosity (He), Nei diversity index (Nei’s), number of observed alleles (No), observed heterozygosity (Ho), polymorphism information content (PIC), and the Shannon-Wiener index (I). Pairwise FST values between populations were calculated using Stacks (Catchen et al., 2013).
A neighbor-joining tree (NJ tree) was constructed using MEGA X software (Kumar et al., 2018) and a maximum likelihood tree (ML tree) was constructed using IQ-Tree software (Nguyen et al., 2015). The NJ tree was constructed using the Kimura 2-parameter model with 1,000 bootstrap replicates. The optimal model obtained by evaluating the DNA model using ModelFinder was TVM+F+ASC+R5 (Kalyaanamoorthy et al., 2017), and a ML tree was constructed. Based on the selected SNPs, the Admixture software was used to analyze the population structure. The optimal number of groups was determined based on the valley of the cross-validation error rate and the clustering results were cross-validated. Principal component analysis was performed using the EIGENSOFT software to cluster the samples (Price et al., 2006). The Mantel test was performed using GenAlEx 6.5 to test the correlation between the genetic and geographic matrices and to determine whether the genetic differentiation pattern was consistent with the isolation-by-distance model (Peakall and Smouse, 2012).
2.4 Gene flow between populations
TREEMIX v.1.13 (Pickrell and Pritchard, 2012) was used to calculate the level of gene flow observed in the populations. Genome-wide allele frequency data were used to plot maximum likelihood trees, which inferred splitting and mixing events between clades and indicated the magnitude and direction of gene flow in the phylogenetic tree. To determine the number of gene migration events occurring between clades, the migration values were set to 1–20. To assess the optimal number of migrations, the variance of the interpopulation correlations was explained using the R package TreemixVarianceExplained.R (https://github.com), with over 99.8% of the variance indicating a reliable model (Pickrell and Pritchard, 2012).
2.5 SDM construction and parameter optimization
To study the impact of climate change on the distribution of Artemia, MaxEnt v3.4 (Phillips et al., 2006) was used to establish SDMs for five time periods: Last Interglacial period (LIG, ~120–140 kya), Last Glacial Maximum (LGM, ~21 kya), Middle Holocene (5–7.5 kya), present, and future (2070 RCP8.5). Before establishing the SDMs of Artemia, the distribution data were obtained from three sources: sampling sites, the Global Biodiversity Information Network (GBIF, http://www.gbif.org), and literature records (Supplementary Table S1) (Evans and Jacquemyn, 2020; Wei et al., 2020). To avoid the effect of distribution data redundancy on model simulation overfitting, redundancy analysis of the distribution data for each population was performed using ENMTools (Warren et al., 2010; Li et al., 2023). Nineteen climate variables (Supplementary Table S2) were downloaded from WorldClim (www.WorldClim.org) at a resolution of 2.5 arcmin for the LGM and 30 arcsec for the other periods. To avoid multicollinearity, ENMTools was used to perform the correlation analysis of bioclimatic variables and retain only one variable with a Pearson correlation coefficient > 0.8. After screening, four representative variables (bio1: Annual Mean Temperature, bio4: Temperature Seasonality, bio12: Annual Precipitation, and bio15: Precipitation Seasonality) were identified, and bio14 (Precipitation of Driest Month) was identified to affect aquatic organisms in lake water bodies (Hou et al., 2022).
MaxEnt provides a set of default parameters when constructing the distribution model; however, the default parameters are influenced by subject data. A model with default parameters is sensitive to subject data and prone to overfitting, whereas the model prediction results often lead to large differences from the actual distribution. Therefore, the optimization of model parameters is crucial for improving both the prediction accuracy and reliability of the results (Fernández and Morales, 2019). ENMeval data packages were used to optimize the parameters, analyze the complexity of the model under various parameter conditions, evaluate the complexity of the model by testing the Akaike’s Information Criterion (AIC) value of the MaxEnt model correction under different parameter conditions (i.e., AIC corrected (AICc)), and select the model parameter with the lowest complexity. The feature combination (FC) (L, Q, H, T, P) was used to form 29 combinations, with a regularization multiplier (RM) range of 0.5–6, interval of 0.5, 12 multiplicity parameters, and 348 parameter combinations. Of the distribution data, 75% were used as the training set for SDM correction and the remaining 25% were used to test the validity of the model. Using the R language kuenm (https://github.com/marlonecobos/kuenm) package for simulation optimization, the model with an average omission rate lower than 5% was selected as the best model (Cobos et al., 2019). Finally, ArcGIS v.10.4 was used to manipulate and visualize the model output.
2.6 Niche overlap
ENMTools was used to compare SDM models for the four groups to assess the predicted ecotone distributions and ecotone differences. Schoener’s D and Warren’s I were used to measure ecological niche divergence in Artemia (Schoener, 1968; Warren et al., 2008; Shengwu et al., 2016).
3 Results
3.1 Sequencing and SNP calling
A total of 316 Mb of read data were obtained by sequencing, with an average sequencing Q30 of 92.40% and an average GC content of 37.35%. In addition, 1,224,409 SLAF tags were developed, containing 260,589 polymorphic SLAF tags with an average sequencing depth of 19.66 x. In total, 1,274,698 SNP markers were identified (Supplementary Table S3).
3.2 Phylogenetic inference
The phylogenetic tree showed four major gene clusters in the neighbor-joining tree and the maximum likelihood tree, consistent with geographical location (Figure 1). The Tibetan populations were divided into 2 subgroups (Figure 2), which we defined as the eastern Nagri populations (Qixiang Co: QXC, Bango Co: BGC, Dangqiong Co: DQC, Daduo Co: DDC) and the western Nagri populations (Lagkor Co: LGC, Dong Co: DC, Nieer Co: NEC), Xinjiang populations (Aibi Lake: ABL and Balikun Lake: BLK), and Shanxi population (Yuncheng Salt Lake: YC). Based on the valley of the cross-validation error, the optimal K value was 4 (Supplementary Figure S1). When K=2, Xinjiang populations and the Shanxi population were separated from the Tibetan populations; when K=3, BGC and QXC were separated from the Tibetan populations; when K=4, Tibetan populations were divided into eastern Nagri populations (BGC, QXC, DDC, DQC) and western Nagri populations (DC, LGC, NEC) and Xinjiang populations were separated from the Shanxi populations (Supplementary Figure S2). The results were consistent with the phylogenetic analysis. Although the Tibetan populations were differentiated, intragroup similarity was high in the principal component analysis. Its differences from the Xinjiang and Shanxi populations were large, and we then performed another principal component analysis on the Artemia populations in the Nagri region; in PC1/PC2, LGC, DC, and NEC could be clustered together, and in PC1/PC3, QXC, BGC, DDC, and DQC could be clustered together (Figure 3).
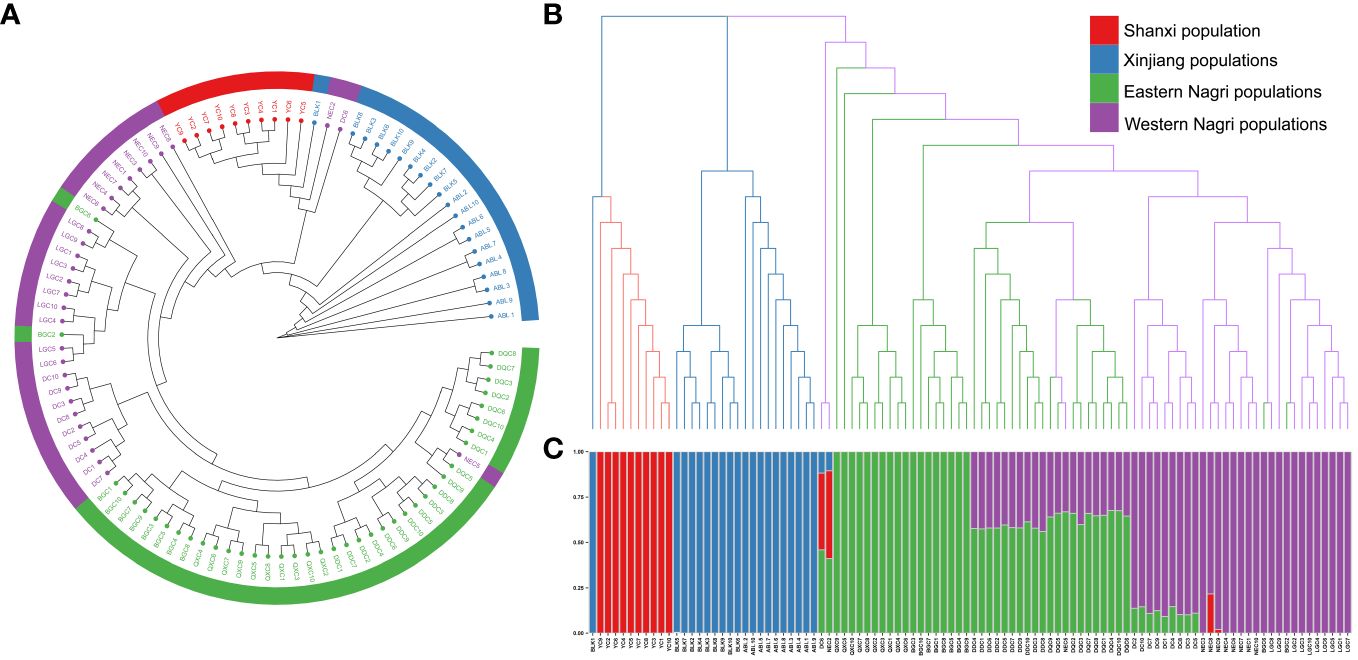
Figure 2 Phylogenetic inference of 10 Artemia populations in China. (A): Maximum likelihood (ML) tree for 10 Artemia populations yielded four major gene clusters, namely, Shanxi population, Xinjiang populations, Eastern Nagri populations and Western Nagri populations. (B): Neighbor-joining (NJ) tree for 10 Artemia populations, and the results were consistent with the ML tree. (C): Optimal population structure of Artemia from 10 inland salt lakes in China at K = 4. Posterior probabilities are available in Supplementary Figure S3.
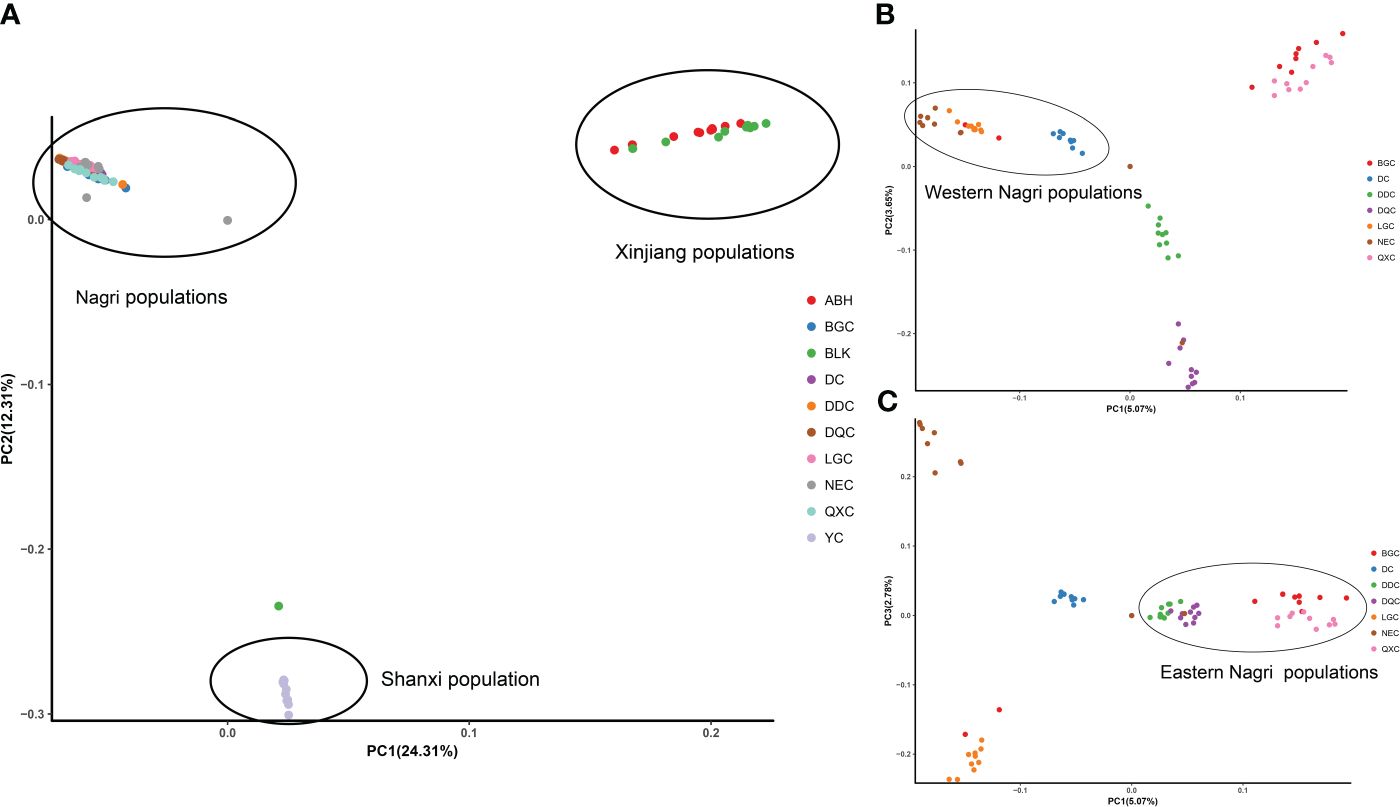
Figure 3 PCA of Artemia from 10 inland salt lakes in China. (A): PCA of 10 populations. (B): PCA (PC1/PC2) of Nagri populations. (C): PCA (PC1/PC3) of Nagri populations.
In summary, the clustering results of the principal component analysis were consistent with the results of the phylogenetic and population structure analyses and the populations of the ten salt lakes from different regions of China were classified into four geographically and genetically distinct groups.
3.3 Genetic diversity analysis
Overall, the genetic diversity of the Tibetan populations was higher than that of the other populations, whereas the Shanxi population had the lowest genetic diversity. The maximum values of all genetic diversity indicators were observed in NEC. The expected number of alleles ranged from 1.132–1.243 and the expected heterozygosity ranged from 0.076–0.147. The average number of alleles observed and observed heterozygosity ranged from 1.217–1.460 and 0.06–0.1. The average polymorphism information content values ranged from 0.060 to 0.119, Nei´s diversity index ranged from 0.081 to 0.158, and Shannon Wiener index ranged from 0.113 to 0.224. Among the Tibetan populations, the QXC population exhibited the lowest genetic diversity. In the Xinjiang population, the genetic diversity of ABL was lower than that of the BLK population. Interestingly, we found that the genetic diversity of the Tibetan populations tended to be higher in the west and lower in the east (Table 2).
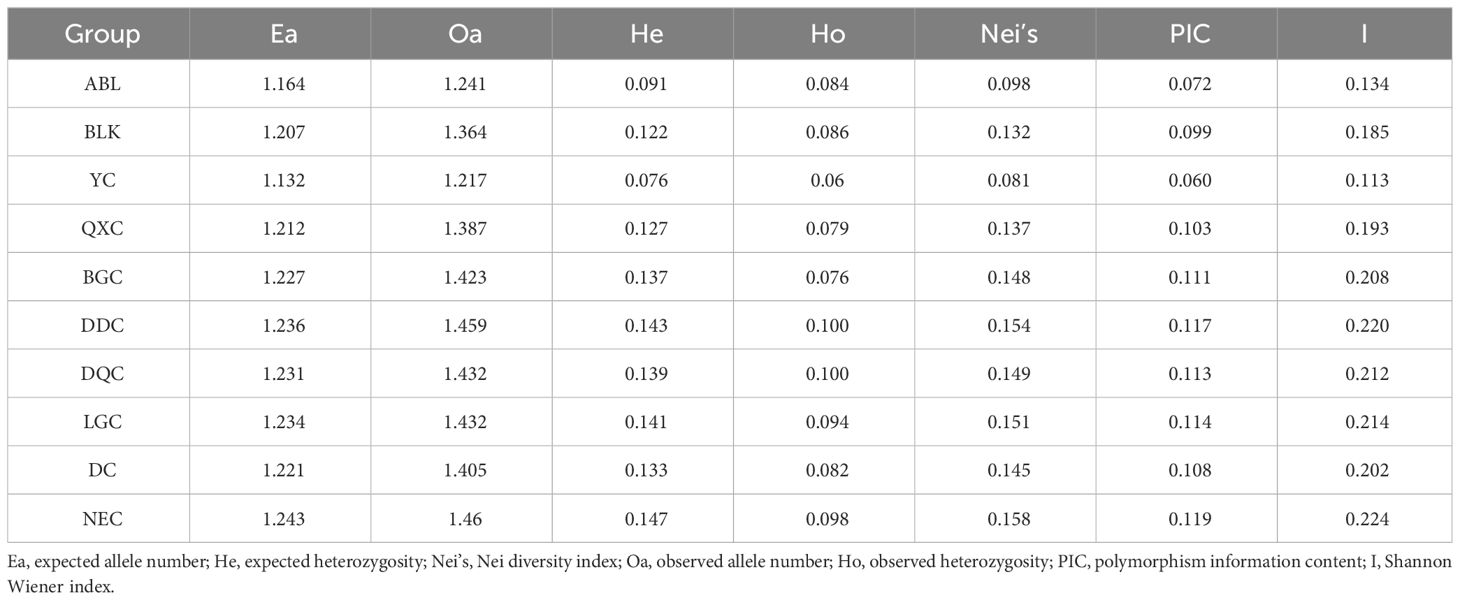
Table 2 Genetic diversity of 10 Artemia populations in China.
3.4 Genetic differentiation and Mantel test
Moderate divergence occurred between the Tibetan populations, with greater genetic differentiation between the Xinjiang and Shanxi populations than between the Tibetan populations (Supplementary Table S4). The highest genetic differentiation between ABL and YC was 0.621 and the lowest genetic differentiation between DQC and DDC was 0.065. Four populations (QXC, BGC, DQC, and DDC) were distributed in the eastern Nagri region and three populations (DC, LGC, and NEC) were distributed in the western Nagri region. Genetic differentiation within the eastern and western populations was less than that between the eastern and western populations. The results showed a significant positive correlation (R2 = 0.857; P<0.0001) between the genetic and geographic distances of the ten Artemia populations (Figure 4), whereas a slightly weaker correlation was obtained by the Mantel test after excluding the Xinjiang and Shanxi populations (R2 = 0.5052; P<0.01).
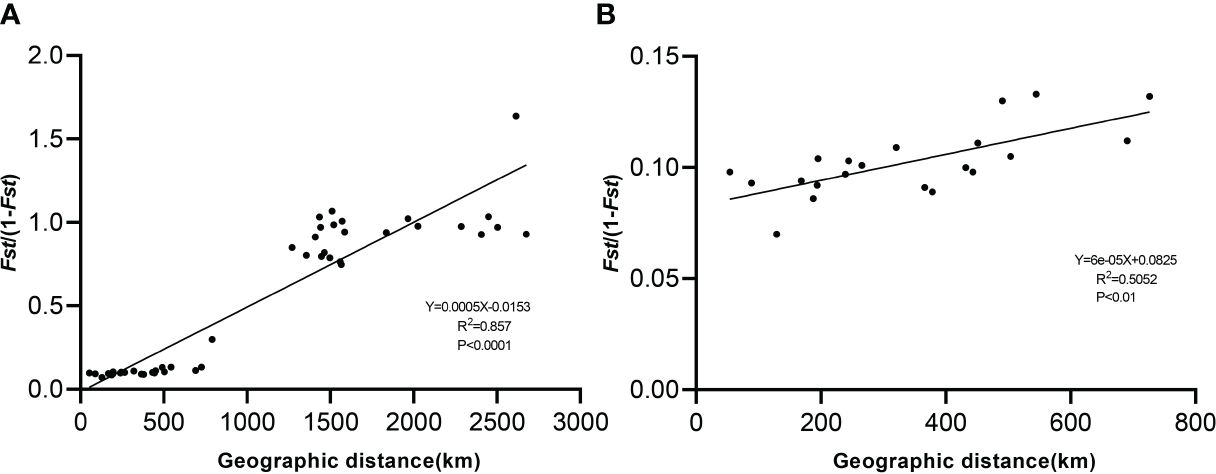
Figure 4 Correlation between genetic differentiation (FST) and geographic distance among Artemia populations. (A): Mantel test of 10 populations. (B): Mantel test of Nagri populations.
3.5 Gene flow between populations
Applying m=10, the model variance explained 99.9% (Supplementary Figure S4); therefore, this m value was considered the input value for the model operation. The results of the TREEMIX software showed that the Tibetan, Xinjiang, and Shanxi populations formed three large clades, whereas the Tibetan populations could be divided into eastern and western Nagri populations. Unidirectional and frequent gene flow was observed from the Shanxi population to the eastern Nagri population. There were not only mutual gene flows between the three major clades but also between the eastern and western Nagri regions, where there were two strongly supported events: the first from ABL to BLK and the second from LGC to DQC (Figure 5).
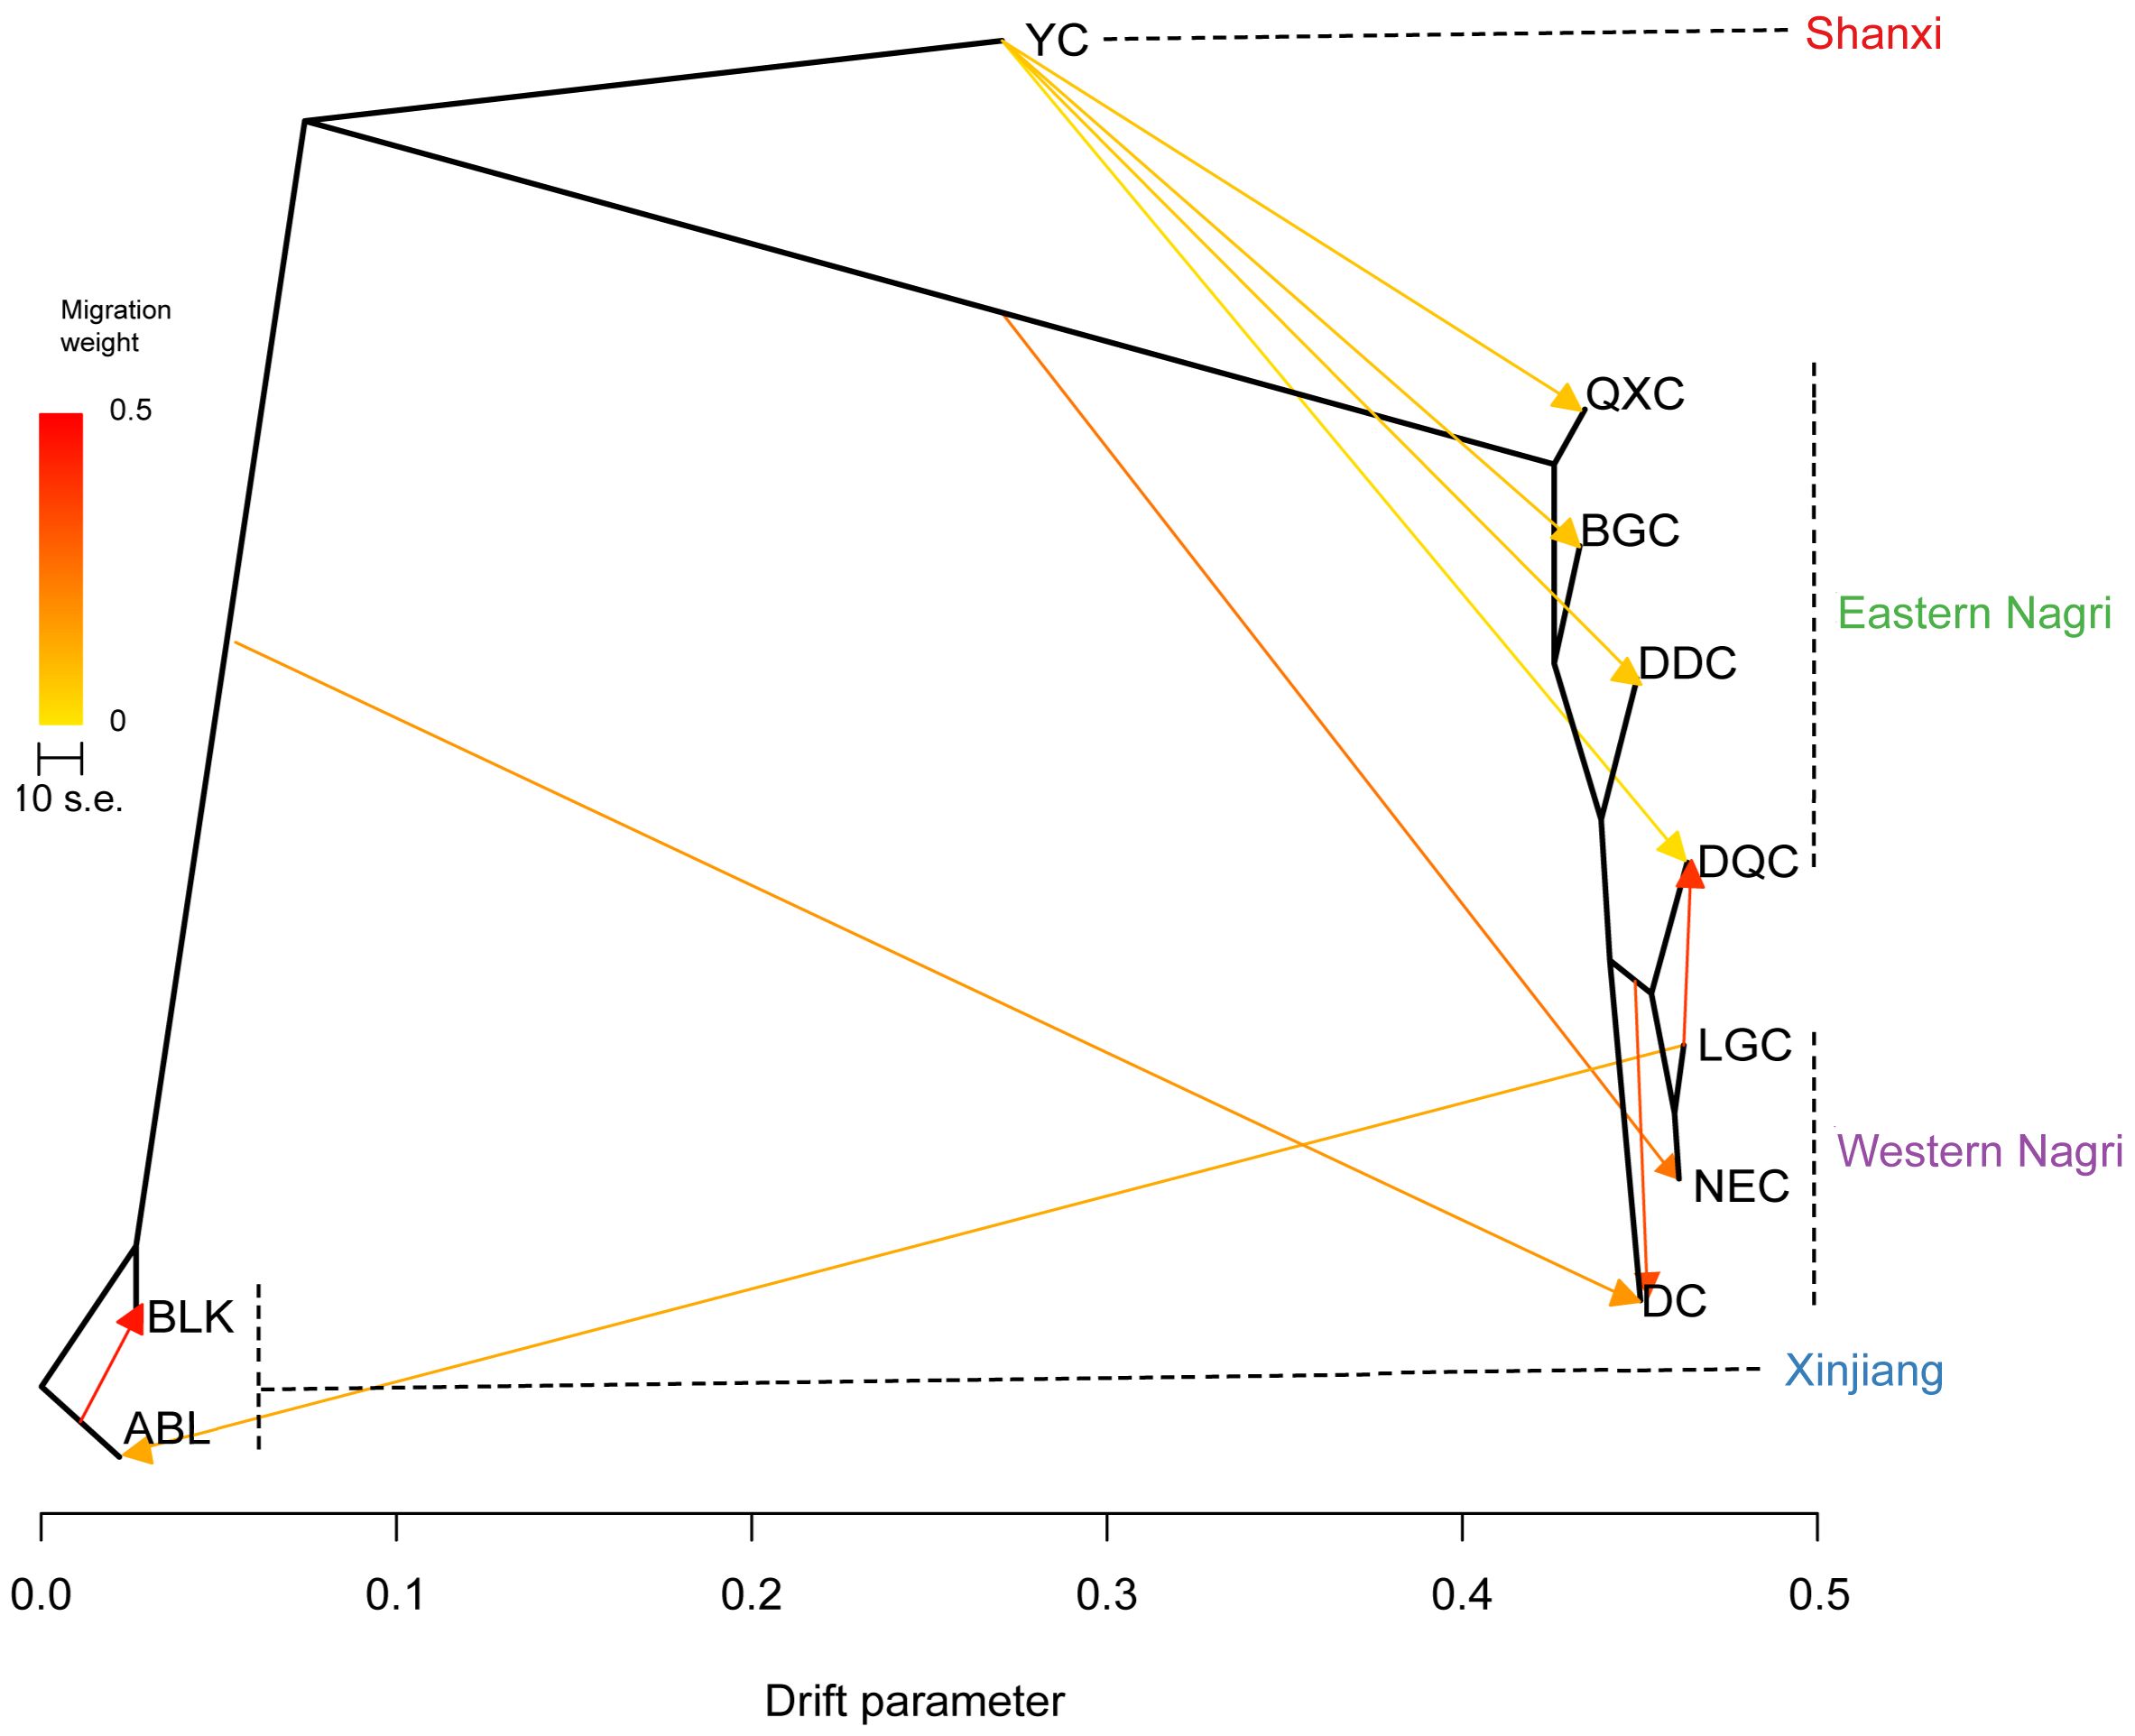
Figure 5 Interpopulation migration events inferred from TreeMix.
3.6 SDM parameter optimization
Based on the area under the curve, AICc, and other indicators (Supplementary Table S5), we determined the FC and RM for different groups: FC=T and RM=0.5 for Xinjiang populations, FC =P and RM=0.5 for Shanxi population, FC =LPH and RM=5 for eastern Nagri populations, and FC =LQPT and RM=0.5 for western Nagri populations (Table 3).

Table 3 Optimal MAXENT model parameters for 4 Artemia groups.
3.7 SDM
The area under the curve values of all models exceeded 0.95, indicating model reliability (Supplementary Table S6). During the three historical periods, the fitness range of all groups, except for the western Nagri region, showed a gradual expansion. From the mid-Holocene to the current period, the fitness range of Artemia populations in the eastern and western Nagri regions expanded, while the fitness area distribution of the Shanxi and Xinjiang populations contracted. In the present study, the eastern Nagri population had the largest fitness area, whereas the western Nagri population had the smallest (Supplementary Table S7). Interestingly, the mid-Holocene and future periods (2070 RCP8.5) were very similar. It should be noted that the range in Tibet will contract rapidly, with the range in the western Nagri region contracting to almost zero under 2070 RCP8.5 (Figure 6).
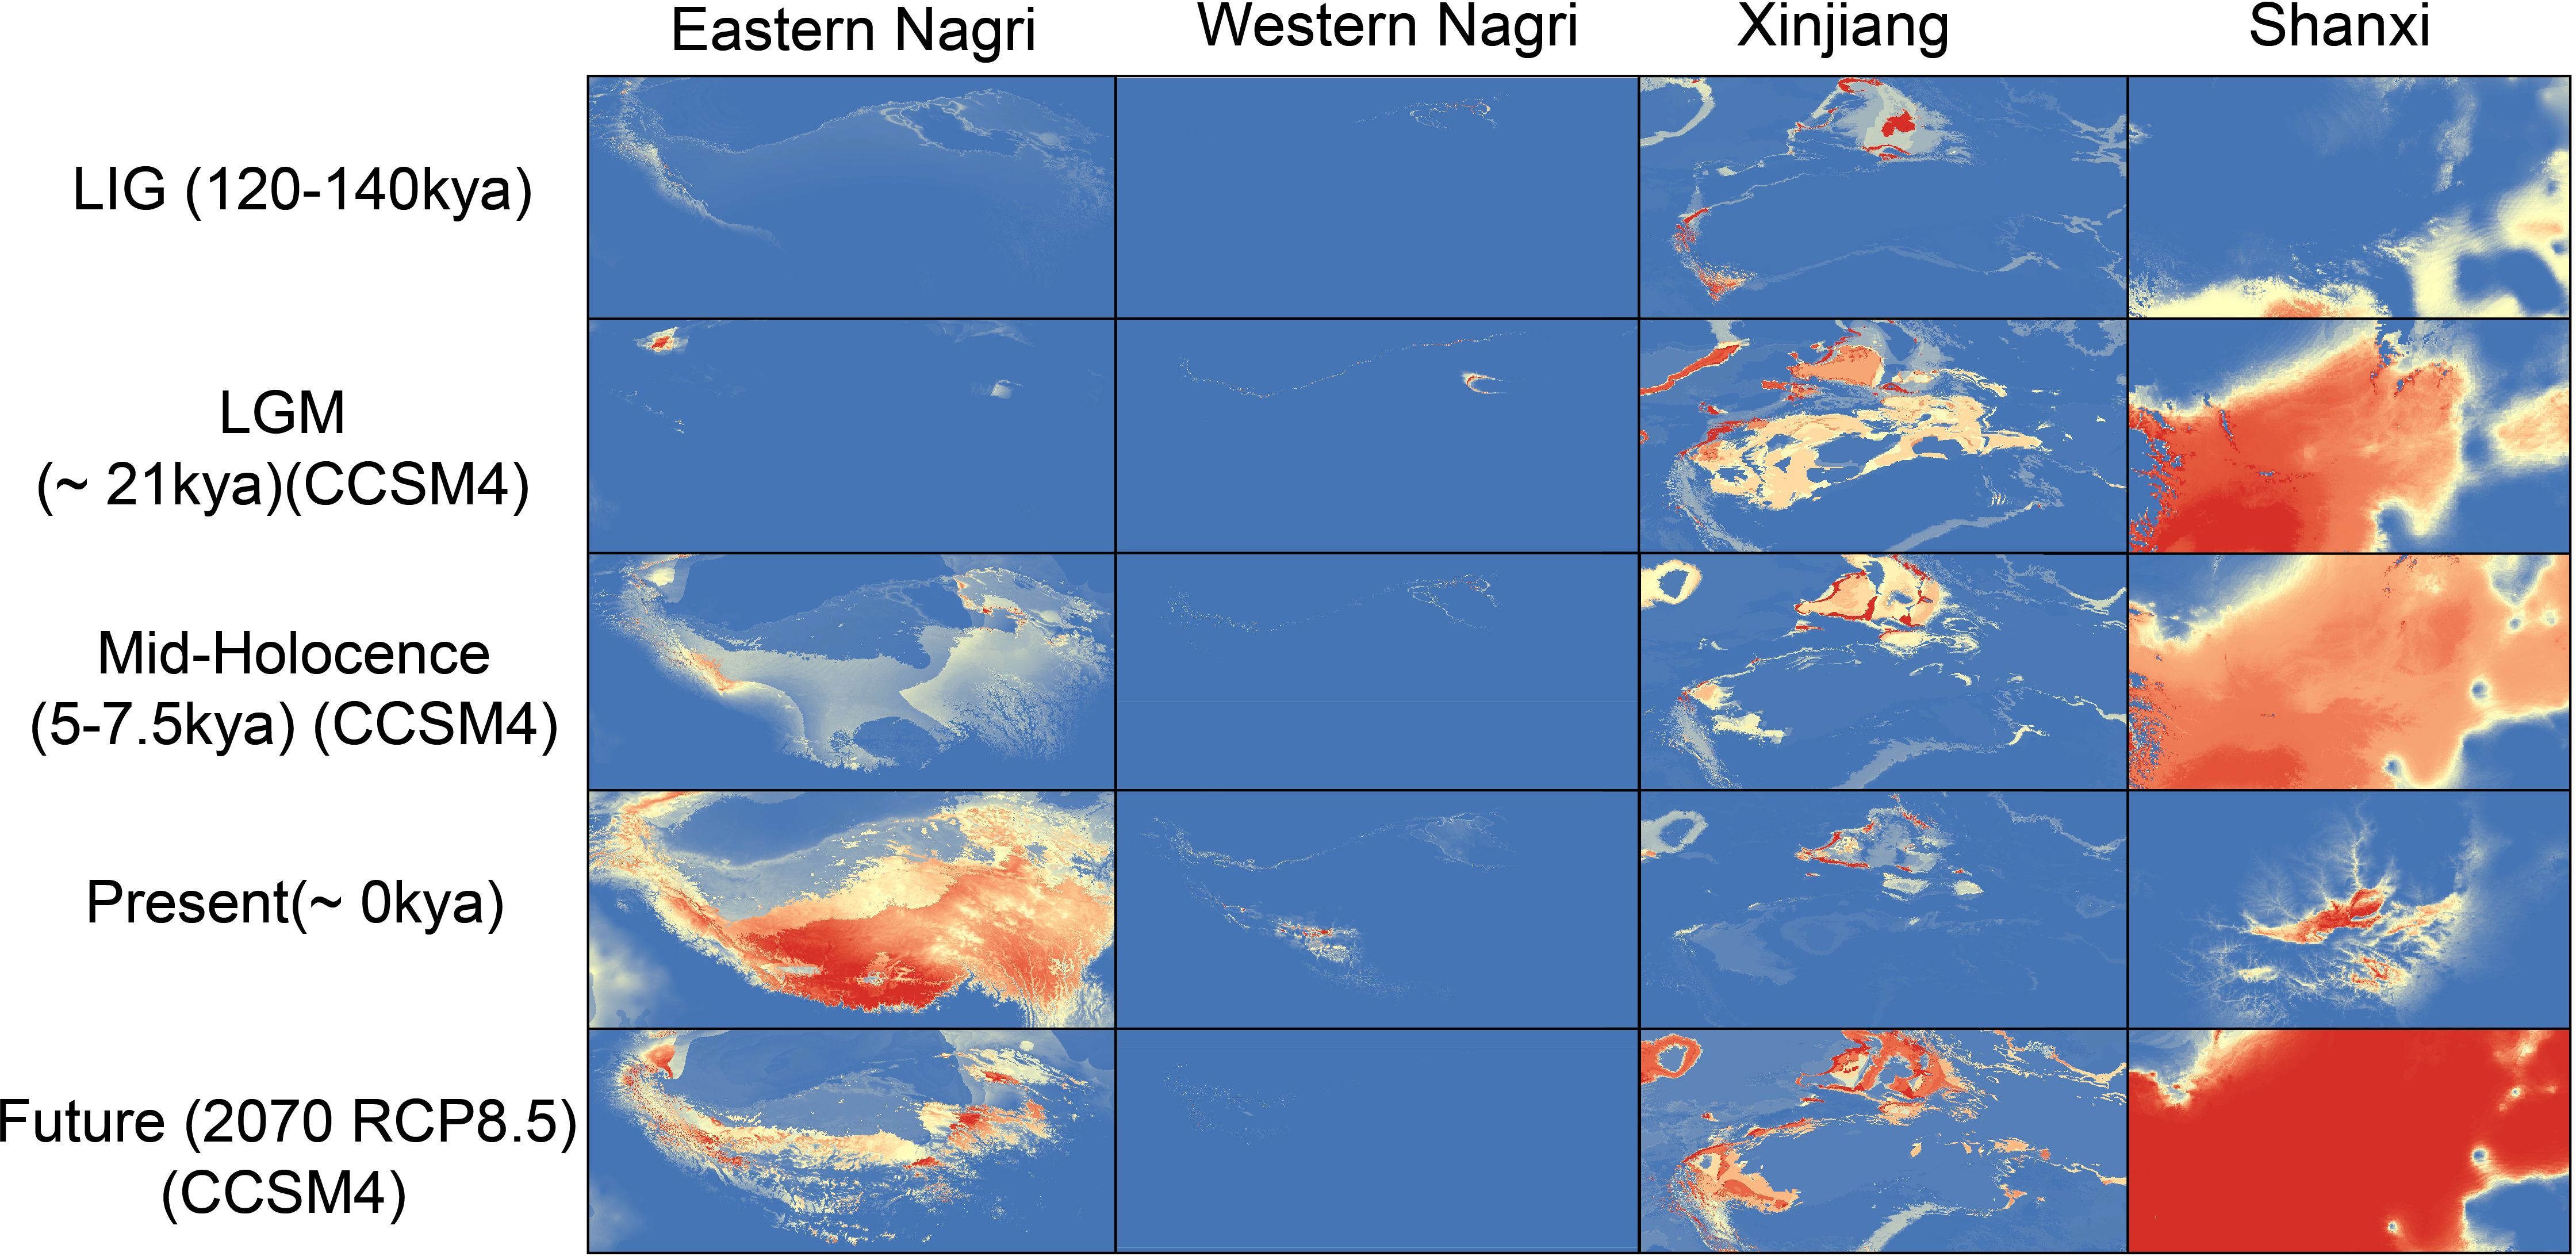
Figure 6 SDMs of four Artemia groups in five different historical periods. Mid-Holocene, 5–7.5 kya, last glacial maximum [LGM], 21 kya and the last interglacial [LIG], 120–140 kya) times. Warmer colors indicate higher probability of occurrence as predicted by MAXENT. Eastern Nagri, Western Nagri, Xinjiang, Shanxi respectively represent the distribution of the populations in the corresponding period.
3.8 Niche overlap
The ecological niche overlap between populations was small, except between the Xinjiang and eastern Nagri populations (Schoener’s D: 0.000885–0.2237, Warren’s I: 0.007397–0.514372, Table 4). This implies that biological invasion is relatively easy for Artemia.
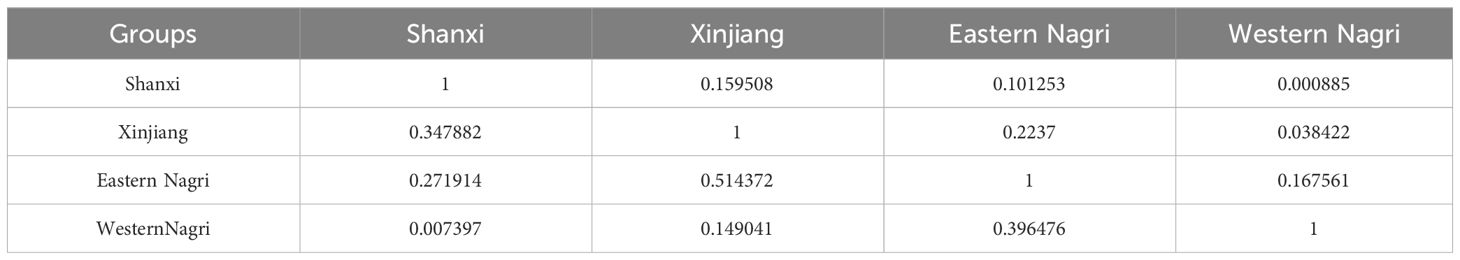
Table 4 Comparison of niche overlap among 4 Artemia groups using Schonner’s D (upper diagonal) and Warren’s I (lower diagonal).
4 Discussion
Genetic diversity is the basis of species diversity and an important prerequisite for the study of any species, affecting the evolutionary and reproductive potential of the species or population (Reusch, 2014; Schrieber and Lachmuth, 2017). In this study, ten individuals from each salt lake were used to develop SNP and the genetic diversity of the Tibetan populations was found to be higher than that of the other populations, while the Shanxi population had the lowest genetic diversity. This result was inconsistent with our previous findings in these populations (Han et al., 2019), in which the Shanxi population had the highest genetic diversity and the Tibetan population had the lowest. This may be due to the differences in the types and numbers of molecular markers, evaluation methods, and populations. In addition, salt lakes with higher Artemia cyst production (YC, QXC, and ABL) had lower genetic diversity. This is likely due to human activities, such as cyst collection and mineral extraction, which may also cause a decrease in the biomass of Artemia and changes in the chemical characteristics of the lake. Interestingly, within Tibetan Artemia populations, genetic diversity tended to be higher in the west and lower in the east. There are several possible explanations for this. One reason for this may be that the complex geographical environment and evolutionary history of the QTP have a long-lasting impact on species survival and promote species adaptation to local conditions (Mao et al., 2021; Shen et al., 2021). Studies have indicated that local adaptations may affect the genetic diversity of populations (Escalante et al., 2020; Zhao et al., 2020). For commercially exploited salt lakes (ABL, YC, and QXC) that have low genetic diversity, exploiters must consider rational exploitation. Research on Artemia has shown that some morphological features could differ significantly not only in different species (Zheng and Sun, 2008) but also in different salt lakes with different hydro chemical characteristics (Zheng and Liu, 2009; Qi et al., 2021), suggesting that Artemia populations could develop local adaptation and exhibit different adaptive characteristics and that local adaptation may further affect the genetic diversity of Artemia populations in different lakes. Studies have also found that some invasive species of Artemia show decreased genetic diversity when they enter new habitats (Kappas et al., 2004). Thus, the relatively low genetic diversity in the DQC may be due to an introduction event nearly 20 years ago (Jia et al., 2015).
This study revealed the genetic structure of ten geographical populations of Artemia in inland salt lakes in China. Unlike previous studies on Asian Artemia (Kappas et al., 2011; Eimanifar et al., 2015), our results suggest that the genetic structure of Artemia in Tibet is more complex. The selection of the best K value for cross-validation must be performed carefully, and multiple datasets, such as phylogenetic trees and PCA, should be combined to determine the final genetic structure of the species (Liu et al., 2022; Mamat et al., 2023). Population structure analyses showed that ten 10 populations from different regions of China could be classified into four geographically and genetically distinct groups. Notably, clusters were more abundant in the Nagri region, suggesting the existence of a more refined population genetic structure. The combination of genetic structure and FST values further showed a high level of genetic differentiation among different Artemia groups. Geographical barriers and distances typically cause genetic differentiation (Goetze, 2003; Binks et al., 2019; Fu et al., 2022; Liang et al., 2022). The altitude of the Tibetan region is very high (above 4500 m), whereas Yuncheng Salt Lake (320 m), Aibi Lake (189 m), and Balikun Lake (3300 m) are relatively low. These low-elevation regions may act as barriers to geographic dispersal (Milá et al., 2013). In addition, the Kunlun, Qilian, Tianshan, and Qinlian Mountains separate Artemia populations and impede genetic flow between the populations in these three regions (Funk et al., 2005; Chen et al., 2006; Von Oheimb et al., 2013). The Mantel test revealed that the genetic differentiation among Artemia populations likely stemmed from the geographical distance between clades. Given the high correlation between geographical distance and genetic distance in 10 populations (R2 = 0.857; P<0.0001), we can speculate that geographic distance and geographic barriers are major contributors to genetic differentiation among Artemia populations. In the Tibetan Nagri region, these Artemia populations can be divided into eastern Nagri populations (BGC, QXC, DDC, and DQC) and western Nagri populations (DC, LGC, and NEC), with a moderate correlation between geographical distance and genetic distance (R2 = 0.5052; P<0.01). The climate of Tibet is unique and complex, with overall characteristics of severe cold in the northwest and humid in the southeast, and a variety of regional climates and obvious vertical climate zones due to the complex topography (Deng et al., 2019; Shi et al., 2022), which may explain the divergence of populations in the eastern and western Nagri regions.
Geological events occurring at certain times in history, such as the uplift of a mountain range, downcutting of rivers, and formation of deep valleys, disrupt the original balance of genetic exchange and cause genetic differentiation of species. These genetic divergences often appear as divisions between clades and usually coincide with geological events (Lemmon et al., 2007; Akın et al., 2010; Pickrell and Pritchard, 2012; Yan et al., 2013; Favre et al., 2015). Undoubtedly, the uplift of the QTP is one of the most prominent recent geological events on a global scale. The current mainstream view is that the QTP originated from the collision of the Indian and Eurasian plates at approximately 55–40 Mya (Hu et al., 2016), which began in the middle to late Eocene and ended in the late Miocene, with some areas reaching altitudes of 4,000 m (Li, 2008; Du, 2021). Previous studies on the timing of Artemia differentiation (Eimanifar et al., 2015) indicated that A. sinica separated from other populations at 19.99 Mya (95% HPD 9.37–36.69 Mya), a period corresponding to the second accelerated uplift of the QTP. This was mainly due to the change in landform. Gene flow between the Shanxi population in central China and the western population was hindered, resulting in genetic differentiation. Similarly, the differentiation of parthenogenetic Artemia and A. tibetiana occurred at 5.41 Mya (95% HPD 2.19–9.99), a period corresponding to the third accelerated uplift of the QTP. Therefore, it is likely that the differentiation of Artemia was related to successive geological events (three accelerated uplifts of the QTP). Each stage of these movements may produce fragmented habitats that limit the dispersal of previously contiguous populations owing to geographical isolation, thus promoting the formation of allopatry patterns (Liao et al., 2015; Scotti-Saintagne et al., 2019). Considering that Artemia is distributed in inland salt lakes with a relatively weak diffusion ability, this genetic differentiation effect is more obvious. Populations living in different regions have developed local adaptations that increase their genetic differentiation (Orsini et al., 2013; Colautti and Lau, 2015; Zhang et al., 2022).
Treemix analysis revealed that A. sinica underwent unidirectional gene flow in four salt lakes: QXC, BGC, DQC, and DDC. Despite the large environmental differences between habitats, the relatively small ecological niche overlap between Artemia populations makes invasion and successful colonization possible. As an aquatic invertebrate, the dispersal capacity of Artemia is limited and geographic isolation caused by geologic events contributes significantly to differentiation among Artemia populations; however, gene flow among Artemia populations can still be detected based on SLAF-seq data. We suggest that this is passive dispersal, mainly from anthropogenic introductions and birds (Vest and Conover, 2011; Reynolds et al., 2015). The genetic structure of Tibetan Artemia is complex and its taxonomic status remains controversial (Sainz-Escudero et al., 2021). The Treemix results demonstrated that a certain amount of gene flow exists between Artemia populations and that geological events and gene flow promote interspecies hybridization, leading to hybrid polyploidization and the formation of isoploid hybrid species (Wu et al., 2022), which may have contributed to the current complex genetic structure of Tibetan Artemia. Considering the effects of climate change on bird migration routes, the genetic structure of the Tibetan Artemia populations may undergo further changes in the future.
Pleistocene climate fluctuations and periodic glaciations have contributed to the current patterns of genetic variation in biological species (Shepard and Burbrink, 2009; Neaves et al., 2012; Evans and Jacquemyn, 2020). During glaciation, especially during LGM, which had a dry climate, low temperatures, and massive glacial coverage globally (Gasse, 2000; Clark et al., 2009), many species experienced severe habitat range contractions and survived only in restricted geographic range refuges (Hewitt, 2004). The present study found that the distribution of the Tibetan and Shanxi populations shrank during the LGM and the Xinjiang populations experienced range expansion but a significant decrease in the proportion of suitable habitats. During warm interglacial periods, the retreating ice cap created new suitable habitats and species began to expand away from their refuges (Hewitt, 2000; Jenkins et al., 2018). Our SDM results were consistent with this phenomenon, with all populations having optimal suitable areas during the LIG, except for the western Nagri populations, which had almost no suitable areas during the LIG. The Pleistocene has experienced many alternating glacial and interglacial periods and is one of the most volatile periods in history. Climatic fluctuations had a strong impact on Artemia suitable areas, especially in Shanxi, where populations experienced strong contraction and expansion. We hypothesize that the influence of Pleistocene climate fluctuations on the distribution patterns of Artemia may be common in the aquatic life of inland salt lakes in China. In the future (2070 RCP8.5), the suitable area of Tibetan populations will shrink, while Shanxi and Xinjiang populations will expand. Today, the world’s glaciers are retreating and speeding up due to relatively rapid global warming. Given the importance of salinity to Artemia (Abatzopoulos et al., 2003), it is not difficult to understand that the lake expansion and salinity reduction in QTP salt lakes will pose a serious threat to the survival of Artemia in these plateau salt lakes. Thus, efforts should be made to establish and improve corresponding monitoring, assessment, and protection systems for Artemia resources.
5 Conclusion
A large number of SNPs were identified in 10 Artemia populations. These populations can be classified into four groups (Shanxi, Xinjiang, eastern Nagri, and western Nagri), with both Nagri groups exhibiting the highest levels of genetic diversity. The Shanxi population showed unidirectional gene flow to the eastern Nagri population. SDMs were established for Artemia populations for the first time, which will help us understand the impact of climate change on Artemia distribution worldwide. The genetic diversity results and declining trend of Tibetan populations indicate that Artemia germplasm resources require protection to ensure the sustainable development of Artemia resources.
Data availability statement
The datasets generated during the current study are available in the NCBI repository, PRJNA1014179.
Ethics statement
The animal study was approved by Tianjin University of Science and Technology. The study was conducted in accordance with the local legislation and institutional requirements.
Author contributions
KL: Conceptualization, Data curation, Methodology, Software, Validation, Visualization, Writing – original draft, Writing – review & editing. RZ: Data curation, Formal analysis, Writing – original draft. L-YS: Conceptualization, Funding acquisition, Methodology, Project administration, Supervision, Writing – original draft, Writing – review & editing. CZ: Conceptualization, Funding acquisition, Writing – review & editing. X-KH: Conceptualization, Funding acquisition, Investigation, Methodology, Project administration, Supervision, Writing – original draft, Writing – review & editing.
Funding
The author(s) declare financial support was received for the research, authorship, and/or publication of this article. The study was supported by China Postdoctoral Science Foundation Funded Project (Project No.: 2023MD734227), the Projects of Agricultural Intelligence Introduction of Tibet (2020WZ006) and Fishery Science and Technology Aid Tibet project, Ministry of Agriculture and Rural Affairs, China.
Acknowledgments
This study was performed within the framework of the International Artemia Aquaculture Consortium (IAAC) with contribution number 1. The authors are very grateful to the Artemia cysts collector Meirong Gao from Asian Regional Artemia Reference Center, TUST.
Conflict of interest
The authors declare that the research was conducted in the absence of any commercial or financial relationships that could be construed as a potential conflict of interest.
Publisher’s note
All claims expressed in this article are solely those of the authors and do not necessarily represent those of their affiliated organizations, or those of the publisher, the editors and the reviewers. Any product that may be evaluated in this article, or claim that may be made by its manufacturer, is not guaranteed or endorsed by the publisher.
Supplementary material
The Supplementary Material for this article can be found online at: https://www.frontiersin.org/articles/10.3389/fmars.2024.1375641/full#supplementary-material
References
Abatzopoulos T. J., El-Bermawi N., Vasdekis C., Baxevanis A. D., Sorgeloos P. (2003). Effects of salinity and temperature on reproductive and life span characteristics of clonal Artemia. (International Study on Artemia. LXVI). Hydrobiologia 492, 191–199. doi: 10.1023/A:1024826702830
Abatzopoulos T. J., Zhang B., Sorgeloos P. (1998). Artemia tibetiana: Preliminary characterization of a new Artemia species found in Tibet (People’s Republic of China). International Study on Artemia. LIX. Int. J. Salt. Lake. Res. 7, 41–44. doi: 10.1007/BF02449923
Akın Ç., Can Bilgin C., Beerli P., Westaway R., Ohst T., Litvinchuk S. N., et al. (2010). Phylogeographic patterns of genetic diversity in eastern Mediterranean water frogs were determined by geological processes and climate change in the Late Cenozoic: Phylogeographic patterns of genetic diversity in water frogs. J. Biogeogr. 37, 2111–2124. doi: 10.1111/j.1365-2699.2010.02368.x
Asem A., Eimanifar A., van Stappen G., Sun S.-C. (2019). The impact of one-decade ecological disturbance on genetic changes: a study on the brine shrimp Artemia urmiana from Urmia Lake, Iran. PeerJ 7, e7190. doi: 10.7717/peerj.7190
Asem A., Yang C., Eimanifar A., Hontoria F., Varó I., Mahmoudi F., et al. (2023). Phylogenetic analysis of problematic Asian species of Artemia Leach 1819 (Crustacea, Anostraca), with the descriptions of two new species. J. Crustacean. Biol. 43, ruad002. doi: 10.1093/jcbiol/ruad002
Baxevanis A. D., Kappas I., Abatzopoulos T. J. (2006). Molecular phylogenetics and asexuality in the brine shrimp Artemia. Mol. Phylogenet. Evol. 40, 724–738. doi: 10.1016/j.ympev.2006.04.010
Binks R. M., Byrne M., McMahon K., Pitt G., Murray K., Evans R. D. (2019). Habitat discontinuities form strong barriers to gene flow among mangrove populations, despite the capacity for long-distance dispersal. Divers. Distrib. 25, 298–309. doi: 10.1111/ddi.12851
Catchen J., Hohenlohe P. A., Bassham S., Amores A., Cresko W. A. (2013). Stacks: an analysis tool set for population genomics. Mol. Ecol. 22, 3124–3140. doi: 10.1111/mec.12354
Chen S.-F., Rossiter S. J., Faulkes C. G., Jones G. (2006). Population genetic structure and demographic history of the endemic Formosan lesser horseshoe bat (Rhinolophus monoceros): population history of rhinolophus monoceros. Mol. Ecol. 15, 1643–1656. doi: 10.1111/j.1365-294X.2006.02879.x
Clark P. U., Dyke A. S., Shakun J. D., Carlson A. E., Clark J., Wohlfarth B., et al. (2009). The last glacial maximum. Science 325, 710–714. doi: 10.1126/science.1172873
Cobos M. E., Peterson A. T., Barve N., Osorio-Olvera L. (2019). kuenm: an R package for detailed development of ecological niche models using Maxent. PeerJ 7, e6281. doi: 10.7717/peerj.6281
Colautti R. I., Lau J. A. (2015). Contemporary evolution during invasion: evidence for differentiation, natural selection, and local adaptation. Mol. Ecol. 24, 1999–2017. doi: 10.1111/mec.13162
Deng D., Wang C., Peng P. (2019). Basic characteristics and evolution of geological structures in the eastern margin of the qinghai-tibet plateau. Earth Sci. Res. J. 23, 283–291. doi: 10.15446/esrj.v23n4.84000
De Vos S., Van Stappen G., Sorgeloos P., Vuylsteke M., Rombauts S., Bossier P. (2019). Identification of salt stress response genes using the Artemia transcriptome. Aquaculture 500, 305–314. doi: 10.1016/j.aquaculture.2018.09.067
Du J. (2021). Role of tectonic uplift and expansion within and outside the northeastern Tibetan Plateau in the formation and evolution of river and desert landscapes. [PhD thesis (Beijing (China: University of Chinese Academy of Sciences, Aerospace Information Innovation Research Institute).
Duan H., Jin Y., Shao X., Sun P., Wang X., Sui L. (2022). Stable primary embryonic cells of Artemia are suitable for tracing the process of V. Anguillarum and V. parahaemolyticus infection. Aquaculture 560, 738598. doi: 10.1016/j.aquaculture.2022.738598
Duan R., Zhang L., Chen D., Yang F., Yang J., Yang W. (2014). Two p90 ribosomal S6 kinase isoforms are involved in the regulation of mitotic and meiotic arrest in Artemia. J. Biol. Chem. 289, 16006–16015. doi: 10.1074/jbc.M114.553370
Eimanifar A., Van Stappen G., Wink M. (2015). Geographical distribution and evolutionary divergence times of Asian populations of the brine shrimp Artemia (Crustacea, Anostraca): Divergence times of Asian Artemia. Zool. J. Linn. Soc. 174, 447–458. doi: 10.1111/zoj.12242
Escalante M. A., Perrier C., García-De León F. J., Ruiz-Luna A., Ortega-Abboud E., Manel S. (2020). Genotyping-by-sequencing reveals the effects of riverscape, climate and interspecific introgression on the genetic diversity and local adaptation of the endangered Mexican golden trout (Oncorhynchus chrysogaster). Conserv. Genet. 21, 907–926. doi: 10.1007/s10592-020-01297-z
Evans A., Jacquemyn H. (2020). Impact of mating system on range size and niche breadth in Epipactis (Orchidaceae). Ann. Bot. 126, 1203–1214. doi: 10.1093/aob/mcaa142
Favre A., Päckert M., Pauls S. U., Jähnig S. C., Uhl D., Michalak I., et al. (2015). The role of the uplift of the Qinghai-Tibetan Plateau for the evolution of Tibetan biotas. Biol. Rev. 90, 236–253. doi: 10.1111/brv.12107
Fernández I. C., Morales N. S. (2019). One-class land-cover classification using MaxEnt: the effect of modelling parameterization on classification accuracy. PeerJ 7, e7016. doi: 10.7717/peerj.7016
Fu P., Sun S., Hollingsworth P. M., Chen S., Favre A., Twyford A. D. (2022). Population genomics reveal deep divergence and strong geographical structure in gentians in the Hengduan Mountains. Front. Plant Sci. 13. doi: 10.3389/fpls.2022.936761
Funk W. C., Blouin M. S., Corn P. S., Maxell B. A., Pilliod D. S., Amish S., et al. (2005). Population structure of Columbia spotted frogs (Rana luteiventris) is strongly affected by the landscape: landscape genetics of frogs. Mol. Ecol. 14, 483–496. doi: 10.1111/j.1365-294X.2005.02426.x
Gasse F. (2000). Hydrological changes in the African tropics since the Last Glacial Maximum. Quaternary. Sci. Rev. 19, 189–211. doi: 10.1016/S0277-3791(99)00061-X
Gavin D. G., Fitzpatrick M. C., Gugger P. F., Heath K. D., Rodríguez-Sánchez F., Dobrowski S. Z., et al. (2014). Climate refugia: joint inference from fossil records, species distribution models and phylogeography. New Phytol. 204, 37–54. doi: 10.1111/nph.12929
Georgiev B. B., Sánchez M. I., Vasileva G. P., Nikolov P. N., Green A. J. (2007). Cestode parasitism in invasive and native brine shrimps (Artemia spp.) as a possible factor promoting the rapid invasion of A. franciscana in the Mediterranean region. Parasitol. Res. 101, 1647–1655. doi: 10.1007/s00436-007-0708-3
Goetze E. (2003). Cryptic speciation on the high seas; global phylogenetics of the copepod family Eucalanidae. Proc. R. Soc. Lond. Ser. B. 270, 2321–2331. doi: 10.1098/rspb.2003.2505
Han X., Ren Y., Ouyang X., Zhang B., Sui L. (2021). Construction of a high-density genetic linkage map and QTL mapping for sex and growth traits in Artemia franciscana. Aquaculture 540, 736692. doi: 10.1016/j.aquaculture.2021.736692
Han X., Xu R., Zheng Y., Gao M., Sui L. (2019). Development of EST-SSR markers and genetic diversity analysis among three Artemia species from different geographic populations. Crustaceana 92, 841–851. doi: 10.1163/15685403-00003916
Hewitt G. (2000). The genetic legacy of the Quaternary ice ages. Nature 405, 907–913. doi: 10.1038/35016000
Hewitt G. M. (2004). Genetic consequences of climatic oscillations in the Quaternary. Philos. T. Roy. Soc. B. 359, 183–195. doi: 10.1098/rstb.2003.1388
Hou Z., Jin P., Liu H., Qiao H., Sket B., Cannizzaro A. G., et al. (2022). Past climate cooling promoted global dispersal of amphipods from Tian Shan montane lakes to circumboreal lakes. Global Change Biol. 28, 3830–3845. doi: 10.1111/gcb.16160
Hu X., Garzanti E., Wang J., Huang W., An W., Webb A. (2016). The timing of India-Asia collision onset – Facts, theories, controversies. Earth-Sci. Rev. 160, 264–299. doi: 10.1016/j.earscirev.2016.07.014
Jenkins T. L., Castilho R., Stevens J. R. (2018). Meta-analysis of northeast Atlantic marine taxa shows contrasting phylogeographic patterns following post-LGM expansions. PeerJ 6, e5684. doi: 10.7717/peerj.5684
Jia Q., Anufriieva E., Liu X., Kong F., Shadrin N. (2015). Intentional introduction of Artemia sinica (Anostraca) in the high-altitude Tibetan lake Dangxiong Co: the new population and consequences for the environment and for humans. Chin. J. Oceanol. Limn. 33, 1451–1460. doi: 10.1007/s00343-015-4371-8
Kalyaanamoorthy S., Minh B. Q., Wong T. K. F., von Haeseler A., Jermiin L. S. (2017). ModelFinder: fast model selection for accurate phylogenetic estimates. Nat. Methods 14, 587–589. doi: 10.1038/nmeth.4285
Kappas I., Abatzopoulos T. J., Van Hoa N., Sorgeloos P., Beardmore J. A. (2004). Genetic and reproductive differentiation of Artemia franciscana in a new environment. Mar. Biol. 146, 103–117. doi: 10.1007/s00227-004-1420-9
Kappas I., Baxevanis A. D., Abatzopoulos T. J. (2011). Phylogeographic patterns in Artemia: a model organism for hypersaline crustaceans (Florida: CRC Press).
Kozich J. J., Westcott S. L., Baxter N. T., Highlander S. K., Schloss P. D. (2013). Development of a dual-index sequencing strategy and curation pipeline for analyzing amplicon sequence data on the MiSeq Illumina sequencing platform. Appl. Environ. Microb. 79, 5112–5120. doi: 10.1128/AEM.01043-13
Kumar S., Stecher G., Li M., Knyaz C., Tamura K. (2018). MEGA X: molecular evolutionary genetics analysis across computing platforms. Mol. Biol. Evol. 35, 1547–1549. doi: 10.1093/molbev/msy096
Lavens P., Sorgeloos P. (1996). Manual on the production and use of live food for aquaculture in SearchWorks catalog (Rome: FAO Press).
Lemmon E. M., Lemmon A. R., Cannatella D. C. (2007). Geological and climatic forces driving speciation in the continentally distributed trilling chorus frogs (Pseudacris). Evolution 61, 2086–2103. doi: 10.1111/j.1558-5646.2007.00181.x
Li D. (2008). Tectonic deformation on northwestern margin of Tibetan Plateau during Pliocene-Pleistocene and uplift of the Tibetan Plateau (Beijing (China: Chinese Academy of Geological Sciences).
Li W. J., Chen P. P., Sui L. Y., Sun S. C. (2024). Temporal genetic variation mediated by climate change-induced salinity decline, a study on Artemia (Crustacea: Anostraca) from Kyêbxang Co, a high altitude salt lake on the Qinghai-Tibet Plateau. Gene 902, 148160. doi: 10.1016/j.gene.2024.148160
Li H., Durbin R. (2009). Fast and accurate short read alignment with Burrows–Wheeler transform. Bioinformatics 25, 1754–1760. doi: 10.1093/bioinformatics/btp324
Li H., Handsaker B., Wysoker A., Fennell T., Ruan J., Homer N., et al. (2009). The sequence alignment/map format and SAMtools. Bioinformatics 25, 2078–2079. doi: 10.1093/bioinformatics/btp352
Li X., He Y., Zeng Z., Lian X., Wang X., Du M., et al. (2018). Spatiotemporal pattern of terrestrial evapotranspiration in China during the past thirty years. Agr. For. Meteorol. 259, 131–140. doi: 10.1016/j.agrformet.2018.04.020
Li D., Li Z., Liu Z., Yang Y., Khoso A. G., Wang L., et al. (2023). Climate change simulations revealed potentially drastic shifts in insect community structure and crop yields in China’s farmland. J. Pest Sci. 96, 55–69. doi: 10.1007/s10340-022-01479-3
Liang D., McManus G. B., Wang Q., Sun X., Liu Z., Lin S., et al. (2022). Genetic differentiation and phylogeography of rotifer Polyarthra dolichoptera and P. vulgaris populations between Southeastern China and eastern North America: High intercontinental differences. Ecol. Evol. 12, e8912. doi: 10.1002/ece3.8912
Liao S., Cui K., Tian B., Zhang Z., Liu A., Li K., et al. (2015). The effect of long-term historical habitat fragmentation on genetic diversity of the relictual conifer Calocedrus macrolepis (Cupressaceae) in China. Braz. J. Bot. 38, 567–577. doi: 10.1007/s40415-015-0168-4
Liu H., Xiong F., Zhai D., Duan X., Chen D., Chen Y., et al. (2022). Genetic diversity and population differentiation of chinese lizard gudgeon (Saurogobio dabryi) in the upper yangtze river. Front. Ecol. Evol. 10. doi: 10.3389/fevo.2022.890475
Mamat M., Shan W., Dong P., Zhou S., Liu P., Meng Y., et al. (2023). Population genetics analysis of Tolai hares (Lepus tolai) in Xinjiang, China using genome-wide SNPs from SLAF-seq and mitochondrial markers. Front. Genet. 13. doi: 10.3389/fgene.2022.1018632
Mao K., Wang Y., Liu J. (2021). Evolutionary origin of species diversity on the Qinghai–Tibet Plateau. J. Syst. Evol. 59, 1142–1158. doi: 10.1111/jse.12809
McKenna A., Hanna M., Banks E., Sivachenko A., Cibulskis K., Kernytsky A., et al. (2010). The Genome Analysis Toolkit: a MapReduce framework for analyzing next-generation DNA sequencing data. Genome Res. 20, 1297–1303. doi: 10.1101/gr.107524.110
Milá B., Surget-Groba Y., Heulin B., Gosá A., Fitze P. S. (2013). Multilocus phylogeography of the common lizard Zootoca vivipara at the Ibero-Pyrenean suture zone reveals lowland barriers and high-elevation introgression. BMC Evol. Biol. 13, 192. doi: 10.1186/1471-2148-13-192
Naganawa H., Mura G. (2017). Two new cryptic species of artemia (branchiopoda, anostraca) from Mongolia and the possibility of invasion and disturbance by the aquaculture industry in east asia. Crustaceana 90, 1679–1698. doi: 10.1163/15685403-00003744
Neaves L. E., Zenger K. R., Prince R. I. T., Eldridge M. D. B. (2012). Impact of Pleistocene aridity oscillations on the population history of a widespread, vagile Australian mammal, Macropus fuliginosus: Phylogeography in Macropus fuliginosus. J. Biogeogr. 39, 1545–1563. doi: 10.1111/j.1365-2699.2012.02702.x
Nguyen L. T., Schmidt H. A., von Haeseler A., Minh B. Q. (2015). IQ-TREE: A fast and effective stochastic algorithm for estimating maximum-likelihood phylogenies. Mol. Biol. Evol. 32, 268–274. doi: 10.1093/molbev/msu300
Orsini L., Vanoverbeke J., Swillen I., Mergeay J., De Meester L. (2013). Drivers of population genetic differentiation in the wild: isolation by dispersal limitation, isolation by adaptation and isolation by colonization. Mol. Ecol. 22, 5983–5999. doi: 10.1111/mec.12561
Peakall R., Smouse P. E. (2012). GenAlEx 6.5: genetic analysis in Excel. Population genetic software for teaching and research—an update. Bioinformatics 28, 2537–2539. doi: 10.1093/bioinformatics/bts460
Phillips S. J., Anderson R. P., Schapire R. E. (2006). Maximum entropy modeling of species geographic distributions. Ecol. Model. 190, 231–259. doi: 10.1016/j.ecolmodel.2005.03.026
Pickrell J. K., Pritchard J. K. (2012). Inference of population splits and mixtures from genome-wide allele frequency data. PloS Genet. 8, e1002967. doi: 10.1371/journal.pgen.1002967
Price A. L., Patterson N. J., Plenge R. M., Weinblatt M. E., Shadick N. A., Reich D. (2006). Principal components analysis corrects for stratification in genome-wide association studies. Nat. Genet. 38, 904–909. doi: 10.1038/ng1847
Qi W., Wu J., Xia Y., Zhang X., Li Z., Chang J., et al. (2021). Influence of ionic composition on minerals and source rocks: An investigation between carbonate-type and sulfate-type lacustrine sediments based on hydro chemical classification. Mar. Petrol. Geol. 130, 105099. doi: 10.1016/j.marpetgeo.2021.105099
Reusch T. B. H. (2014). Climate change in the oceans: evolutionary versus phenotypically plastic responses of marine animals and plants. Evol. Appl. 7, 104–122. doi: 10.1111/eva.12109
Reynolds C., Miranda N. A. F., Cumming G. S. (2015). The role of waterbirds in the dispersal of aquatic alien and invasive species. Divers. Distrib. 21, 744–754. doi: 10.1111/ddi.12334
Sainz-Escudero L., López-Estrada E. K., Rodríguez-Flores P. C., García-París M. (2021). Settling taxonomic and nomenclatural problems in brine shrimps, Artemia (Crustacea: Branchiopoda: Anostraca), by integrating mitogenomics, marker discordances and nomenclature rules. PeerJ 9, e10865. doi: 10.7717/peerj.10865
Sánchez M. I., Green A. J., Castellanos E. M. (2006). Temporal and spatial variation of an aquatic invertebrate community subjected to avian predation at the Odiel salt pans (SW Spain). Arch. Hydrobiol. 166, 199–223. doi: 10.1127/0003-9136/2006/0166-0199
Schoener T. W. (1968). Sizes of feeding territories among birds. Ecology 49, 123–141. doi: 10.2307/1933567
Schrieber K., Lachmuth S. (2017). The Genetic Paradox of Invasions revisited: the potential role of inbreeding × environment interactions in invasion success. Biol. Rev. 92, 939–952. doi: 10.1111/brv.12263
Scotti-Saintagne C., Giovannelli G., Scotti I., Roig A., Spanu I., Vendramin G. G., et al. (2019). Recent, Late Pleistocene fragmentation shaped the phylogeographic structure of the European black pine (Pinus nigra Arnold). Tree Genet. Genomes. 15, 76. doi: 10.1007/s11295-019-1381-2
Shen C., Zhang C., Chen J., Guo Y. (2021). Clarifying recent adaptive diversification of the chrysanthemum-group on the basis of an updated multilocus phylogeny of subtribe artemisiinae (Asteraceae: anthemideae). Front. Plant Sci. 12.
Shengwu J., Qing Z., Gongqi S., Guangchun L. (2016). Improving conservation of cranes by modeling potential wintering distributions in China. J. Resour. Ecol. 7, 44–50. doi: 10.5814/j.issn.1674-764X.2016.01.006
Shepard D. B., Burbrink F. T. (2009). Phylogeographic and demographic effects of Pleistocene climatic fluctuations in a montane salamander, Plethodon fourchensis. Mol. Ecol. 18, 2243–2262. doi: 10.1111/j.1365-294X.2009.04164.x
Shi Z., Xin C., Liu H., Jiao Z., Wang L. (2022). Geoheritage geomorphology of an alpine region in northwest China: introduction to the yeliguan national geopark. Geoheritage 14, 61. doi: 10.1007/s12371-022-00690-z
Song L., Zhuang Q., Yin Y., Zhu X., Wu S. (2017). Spatio-temporal dynamics of evapotranspiration on the Tibetan Plateau from 2000 to 2010. Environ. Res. Lett. 12, 014011. doi: 10.1088/1748-9326/aa527d
Sorgeloos P., Dhert P., Candreva P. (2001). Use of the brine shrimp, Artemia spp., in marine fish larviculture. Aquaculture 200, 147–159. doi: 10.1016/S0044-8486(01)00698-6
Sun X., Liu D., Zhang X., Li W., Liu H., Hong W., et al. (2013). SLAF-seq: an efficient method of large-scale de novo SNP discovery and genotyping using high-throughput sequencing. PloS One 8, e58700. doi: 10.1371/journal.pone.0058700
Sung Y. Y., Pineda C., MacRae T. H., Sorgeloos P., Bossier P. (2008). Exposure of gnotobiotic Artemia franciscana larvae to abiotic stress promotes heat shock protein 70 synthesis and enhances resistance to pathogenic Vibrio campbellii. Cell Stress Chaperon. 13, 59–66. doi: 10.1007/s12192-008-0011-y
Torrentera L., Dodson S. I. (2004). Ecology of the brine shrimp Artemia in the Yucatan, Mexico, Salterns. J. Plankton. Res. 26, 617–624. doi: 10.1093/plankt/fbh057
Triantaphyllidis G., Abatzopoulos T., Sorgeloos P. (1998). Review of the biogeography of the genus Artemia (Crustacea, Anostraca). J. Biogeogr. 25, 213–226. doi: 10.1046/j.1365-2699.1998.252190.x
Van Stappen G., Sui L., Hoa V. N., Tamtin M., Nyonje B., Medeiros Rocha R., et al. (2020). Review on integrated production of the brine shrimp Artemia in solar salt ponds. Rev. Aquacult. 12, 1054–1071. doi: 10.1111/raq.12371
Vest J. L., Conover M. R. (2011). Food habits of wintering waterfowl on the great salt lake, utah. Waterbirds 34, 40–50. doi: 10.1675/063.034.0105
Von Oheimb P. V., Albrecht C., Riedel F., Bössneck U., Zhang H., Wilke T. (2013). Testing the role of the Himalaya Mountains as a dispersal barrier in freshwater gastropods (Gyraulus spp.). Biol. J. Linn. Soc 109, 526–534. doi: 10.1111/bij.12068
Warren D. L., Glor R. E., Turelli M. (2008). Environmental niche equivalency versus conservatism: quantitative approaches to niche evolution. Evolution 62, 2868–2883. doi: 10.1111/j.1558-5646.2008.00482.x
Warren D. L., Glor R. E., Turelli M. (2010). ENMTools: a toolbox for comparative studies of environmental niche models. Ecography 33, 607–611. doi: 10.1111/j.1600-0587.2009.06142.x
Wei S., Li Z., Momigliano P., Fu C., Wu H., Merilä J. (2020). The roles of climate, geography and natural selection as drivers of genetic and phenotypic differentiation in a widespread amphibian Hyla annectans (Anura: Hylidae). Mol. Ecol. 29, 3667–3683. doi: 10.1111/mec.15584
Wu S., Wang Y., Wang Z., Liu J. (2022). Species divergence with gene flow and hybrid speciation on the Qinghai–Tibet Plateau. New Phytol. 234, 392–404. doi: 10.1111/nph.17956
Wurtsbaugh W. A., Maciej Gliwicz Z. (2001). Limnological control of brine shrimp population dynamics and cyst production in the Great Salt Lake, Utah. Hydrobiologia 466, 119–132. doi: 10.1023/A:1014502510903
Yan F., Zhou W., Zhao H., Yuan Z., Wang Y., Jiang K., et al. (2013). Geological events play a larger role than Pleistocene climatic fluctuations in driving the genetic structure of Quasipaa boulengeri (Anura: Dicroglossidae). Mol. Ecol. 22, 1120–1133. doi: 10.1111/mec.12153
You X., Shan X., Shi Q. (2020). Research advances in the genomics and applications for molecular breeding of aquaculture animals. Aquaculture 526, 735357. doi: 10.1016/j.aquaculture.2020.735357
Zhang J., Zhang F., Tay W. T., Robin C., Shi Y., Guan F., et al. (2022). Population genomics provides insights into lineage divergence and local adaptation within the cotton bollworm. Mol. Ecol. Resour. 22, 1875–1891. doi: 10.1111/1755-0998.13581
Zhao W., Sun Y., Pan J., Sullivan A. R., Arnold M. L., Mao J., et al. (2020). Effects of landscapes and range expansion on population structure and local adaptation. New Phytol. 228, 330–343. doi: 10.1111/nph.16619
Zheng M., Liu X. (2009). Hydrochemistry of salt lakes of the qinghai-tibet plateau, China. Aquat. Geochem. 15, 293–320. doi: 10.1007/s10498-008-9055-y
Keywords: Artemia, genetic structure, single nucleotide polymorphism, geological event, climatic change, gene flow
Citation: Li K, Zhang R, Sui L-Y, Zhang C and Han X-K (2024) Genetic structure of ten Artemia populations from China: cumulative effects of ancient geological events, climatic changes, and human activities. Front. Mar. Sci. 11:1375641. doi: 10.3389/fmars.2024.1375641
Received: 24 January 2024; Accepted: 15 March 2024;
Published: 05 April 2024.
Edited by:
Khaled Mohammed Geba, Menoufia University, EgyptReviewed by:
Eva Garcia-Vazquez, Universidad de Oviedo Mieres, SpainMohamed A. M. Eltabakh, Al-Azhar University, Egypt
Copyright © 2024 Li, Zhang, Sui, Zhang and Han. This is an open-access article distributed under the terms of the Creative Commons Attribution License (CC BY). The use, distribution or reproduction in other forums is permitted, provided the original author(s) and the copyright owner(s) are credited and that the original publication in this journal is cited, in accordance with accepted academic practice. No use, distribution or reproduction is permitted which does not comply with these terms.
*Correspondence: Xue-Kai Han, hanxk@tust.edu.cn; Chi Zhang, zc0891@163.com