Quantitative analysis and comprehensive evaluation of coarse aggregate morphology for asphalt pavement
 Chen Zhang
 Shiqiang Cheng2
 - 1School of Energy and Architecture, Xi’an Aeronautical Institute, Xi’an, Shaanxi, China
- 2Key Laboratory of Civil Aviation Intelligent Construction and Maintenance, Chang’an University, Xi’an, Shaanxi, China
- 3Hangzhou Communications Investment Group Co., Ltd., Hangzhou, Zhejiang, China
- 4Ankang Transportation Construction Investment Group Co., Ltd., Ankang, Shaanxi, China
The morphological characteristics of coarse aggregate play a crucial role in the mechanical properties, durability, and construction performance of asphalt mixtures and pavements in highway engineering. This study aims to quantitatively analyze the morphological characteristics of coarse aggregate and establish comprehensive evaluation indicators for its quality and performance. Two-dimensional cross-sectional images of coarse aggregates are obtained using the self-developed laser scanning equipment, and edge features are extracted using the Canny operator and edge tracing algorithm. Six morphological characteristic indicators are selected, and factor analysis is employed to propose comprehensive shape and edge feature for coarse aggregates. The results show that the proposed evaluation indicators effectively capture the shape and edge feature of coarse aggregates, with the exception of roughness, which is deemed unsuitable for evaluation. Factor analysis of six indicator values in 2,700 two-dimensional images led to the proposal of Shape Factor (SF) and Edge Feature Factor (EFF) as significant factors affecting aggregate shape and edge characteristics, respectively. Following optimization, SF ranged from 0.041 to 1.793, while EFF ranged from 0.368 to 1.745. The spearman’s rank correlation coefficient revealed strong correlations between the evaluation of coarse aggregate shape and edge features using the line laser-based comprehensive evaluation index. Specifically, correlation coefficients of 0.864 and 0.805 exceeded those of commonly used methods such as AIMS and X-ray CT, indicating the rationality and accuracy of the self-developed laser scanning device in evaluating aggregate morphology. This research provides strong support for the construction of highway engineering and optimization of coarse aggregate production and supply.
1 Introduction
The role of coarse aggregate in highway engineering is very important. It is one of the main components of asphalt mixtures, providing bearing capacity and stabilityto the road surface (Hassan et al., 2021). The morphological characteristics of coarse aggregate have significant effects on the mechanical properties, durability, and construction performance of asphalt mixtures and asphalt pavements (Busang and Maina, 2022). In recent years, scholars at home and abroad have conducted extensive research on the morphological characteristics of coarse aggregates, mainly including the following aspects: 1) classification and evaluation criteria of coarse aggregate morphology; 2) the influence of morphology on the performance of concrete and asphalt pavements; 3) testing methods and techniques for morphology; 4) methods for improving morphology. Cui et al. (2018) identified the effect of single morphological variable on the adhesion of aggregate and the mechanical properties of asphalt mixture, and used Aggregate Image Measurement Systems (AIMS) to accurately quantify the morphological characteristics of aggregates. Wang et al. (2013) assess the commonly used imaging techniques for analyzing the morphological characteristics of aggregates, taking into account various factors such as equipment cost, repeatability, reliability, accuracy, and the measured morphological parameters. Candra et al. (2020) identifies the optimal use of 2-centimeter diameter coarse aggregates in porous asphalt pavements to balance porosity with stability, ensuring desired asphalt characteristics and Optimum Asphalt Level. Guo et al. (2021) found that in warm-mix asphalt containing recycled materials, reclaimed asphalt pavement (RAP) content primarily affects high-temperature stability, while aggregate shape and asphalt surface free energy also influence performance and moisture resistance. Gao et al. (2020) studied how the three-dimensional angularity of coarse aggregates, measured by X-ray computed tomography, impacts the skid resistance, high-temperature stability, and compaction of asphalt mixtures, assessing texture depth, pendulum ratings, dynamic stability, rutting depth, and specimen height variations during compaction. Castillo et al. (2018) utilizes a refined microstructure generator to computationally create random aggregate particles for asphalt mixtures, capturing material heterogeneity and uncertainty in mechanical response. Virtual specimens with lower angularity and higher form indices exhibited reduced damage and modulus. Yu et al. (2023) prepared the coarse aggregates with diverse wearing times and compacted the corresponding asphalt mixture samples to evaluate the impact of coarse aggregate morphology on the mechanical performance of the asphalt mixture and evaluated the morphology characteristics of coarse aggregate under diverse wearing times by an image measurement system. Li et al. (2021) examines the movement of coarse aggregates in asphalt mixtures during gyratory compaction, finding that their displacement and rotation are closely linked to mixture densification, with aggregate mobility increSFng at higher asphalt content or temperature and varying compaction stages. Pouranian and Haddock (2021) develops a framework for defining the aggregate structure of asphalt mixtures, proposing an analytical model for binary mixtures that considers size ratio and air volume. Validated through 3D discrete element simulations, the model defines three aggregate structures and can be applied to multi-sized blends, aiding in the design of asphalt mixtures for improved performance. Kusumawardani and Wong (2021) assessed the effect of aggregate shape (cube, cylinder, sphere) on porous asphalt mixture (PAM) performance using shape factor and sphericity index parameters, finding that spherical aggregates require less compaction effort and aggregate sphericity generally decreases PAM mechanistic properties. Liu et al. (2020) Using the discrete element method, a virtual simulation of static compaction tested the motion of irregular polyhedral coarse aggregates in asphalt mixture, revealing that aggregate movement is tied to external loading orientation, compaction level affects aggregate displacement, and the micromechanical model clarifies asphalt mixture compaction mechanisms. Rajan and Singh (2020) examines the impact of 2S, 3S, and 4S crushing stages on aggregate morphology parameters like angularity, texture, flatness, elongation, sphericity, and form2D using digital measurement systems. The results show that aggregate shape is affected by the crushing stage, mechanism, and aggregate size, aiding in aggregate source selection and crusher monitoring for quality production. Khairandish et al. (2021) investigated the impact of aggregate gradation and shape on bituminous mixtures’ performance using traditional and 3D scanning methods, revealing that BC II and DBM II gradations outperform BC I and DBM I, and aggregate composition, texture, and morphology strongly influence mixture mechanical response. Li et al. (2019) introduces a simulation method for asphalt mixtures, considering aggregate shape and size using plane geometry factor (PGF) and the section aspect ratio (SAR) parameters. Validation through uniaxial tests confirms the effectiveness of these parameters in describing 3D aggregate characteristics. Wang et al. (2021) examined how crushing affects the shape and mineral composition of aggregates, finding that higher speeds in a vertical shaft impactor (VSI) increase cracks and that mineralogy influences particle shape and collision behavior, leading to recommendations for optimal crushing of granite aggregates. Ostrowski et al. (2018) found that the morphology of coarse aggregate grains, described through digital image analysis, significantly impacts the strength, stiffness, and rheological properties of self-compacting high-performance fibre-reinforced concrete (SCHPFRC), proposing a formation mechanism based on aggregate shape. Monte Carlo simulation (MCS) assesses strength variations in heterogeneous materials, linking macro properties to mesoscale irregularities. Li et al. (2023) used this with a real aggregate library and discrete element method to explore how aggregate shape impacts unbound granular material deformation. The above research shows that the morphological characteristics of aggregates have a significant impact on the performance of asphalt mixtures. The AIMS can accurately quantify the morphological characteristics of aggregates. The advantage of this method lies in its repeatability, reliability, and accuracy, but the equipment cost may be high. The influence of aggregate morphology on the performance of asphalt mixtures is an important research area. The shape, size, angle, surface free energy, and other morphological characteristics of aggregates have a significant impact on the high-temperature stability, skid resistance, compaction, damage, modulus, and other properties of asphalt mixtures. Overall, these studies provide important theoretical bSFs for understanding and optimizing the performance of asphalt mixtures. However, despite the extensive research, there are still gaps in the understanding of the morphological characteristics of coarse aggregates. For instance, there is a lack of comprehensive evaluation indicators that can accurately measure and analyze the morphological characteristics of coarse aggregates. This research endeavors to bridge extant gaps in knowledge through a meticulous exploration of the evaluation indicators pertaining to the morphological characteristics of coarse aggregates. The principal objective is to establish a comprehensive shape parameter and a thorough edge feature parameter for coarse aggregates utilizing the factor analysis method. The validity of the proposed comprehensive evaluation indicators will be scrutinized for rationality through empirical validation. By precise measurement and analysis of the morphological characteristics of coarse aggregates, the paper contributes to the evaluation of their quality and performance, thereby furnishing substantial support for the domain of highway engineering. Simultaneously, it offers a framework to adapt and optimize the production and supply of coarse aggregates in accordance with real-world conditions, aligning with the specific requirements of highway engineering.
2 Methodology
In this study, the Canny edge detection operator, edge tracking algorithm, and factor analysis method were employed. The Canny edge detection operator serves as a crucial tool in image processing for the precise identification of image edges. It accomplishes this by calculating changes in image grayscale to locate contours or textural variations of objects. This operator effectively suppresses noise, allowing for accurate edge localization while ensuring that each edge is detected only once. The edge tracking algorithm, on the other hand, is a technique utilized in image processing to connect discrete edge points and form continuous contours. By tracing along the image edges, this algorithm links the edge points, facilitating accurate object boundary delineation, noise suppression, and extraction of key features. The factor analysis is a multivariate statistical technique aimed at extracting a small number of latent common factors from a large set of interrelated variables. These common factors capture the essential information shared among the variables, enabling data simplification and dimensionality reduction.
This article mainly conducts research on the evaluation indicators of the morphological characteristics of coarse aggregates. Firstly, multiple cross-sectional images of coarse aggregates are obtained through laser scanning. The edge features of coarse aggregates are obtained by using the Canny edge detection operator and edge tracing algorithm. The adopted line laser scanning equipment is the “Digital Test System for Aggregate Morphology” independently developed by the research group, and its software and hardware structure is shown in Figure 1.
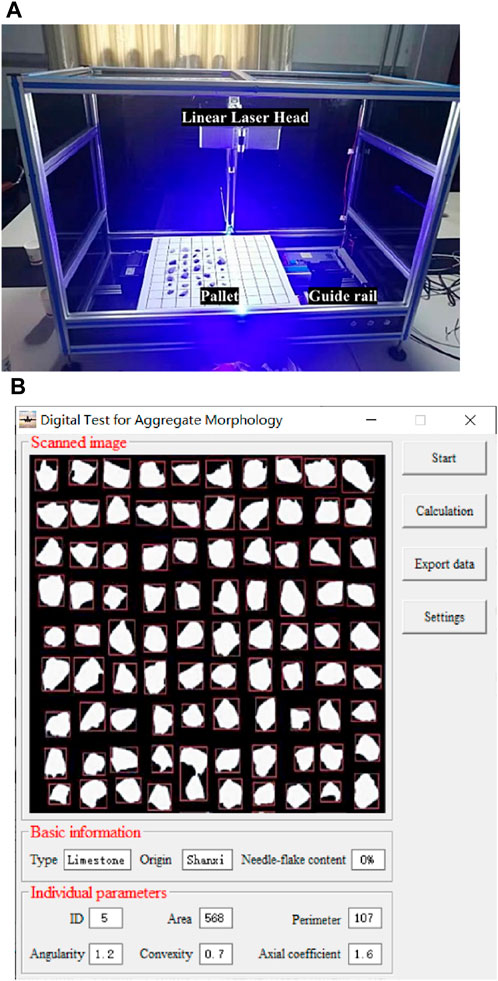
Figure 1. Digital test system for aggregate morphology. (A) Hardware structure. (B) Software.
When the device is running, first connect the device to the computer and open the control software to obtain the initial image. Then place the aggregate to be scanned on the device pallet and click the start button on the software to scan and obtain cross-sectional images of the aggregate. Multiple cross-sectional images can be obtained by setting different laser scanning depths.
Secondly, the research on the morphological characteristic indicators of coarse aggregates is established, and multiple two-dimensional image evaluation indicators are selected. The factor analysis method is used to separately propose the comprehensive shape parameter and the comprehensive edge feature parameter of coarse aggregates. Finally, the proposed comprehensive evaluation indicators are validated for rationality. The technical scheme is shown in Figure 2.
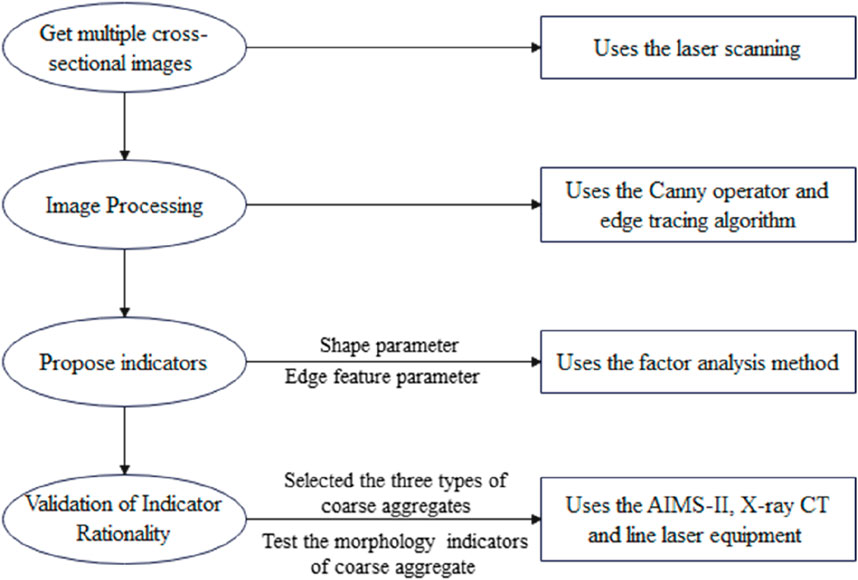
Figure 2. Technical scheme.
3 Results and discussion
3.1 Two-dimensional image processing results of coarse aggregates
The quality of edge detection results will directly affect the edge recognition work of coarse aggregate two-dimensional images, especially the success or failure of edge feature description and extraction (Yang et al., 2022). Therefore, the evaluation of the edge feature of aggregates needs to put higher requirements on edge detection. In order to propose reasonable evaluation indicators for the shape and edge feature of aggregates, the Canny edge algorithm is used to obtain the best effect of aggregate image and realize the extraction of aggregate two-dimensional images (Peng and Yang, 2023). The self-developed laser scanning equipment is used to scan the measured aggregate to obtain two-dimensional images of different horizontal sections of the aggregate. Figure 3 show the boundary processing process of an aggregate two-dimensional image.
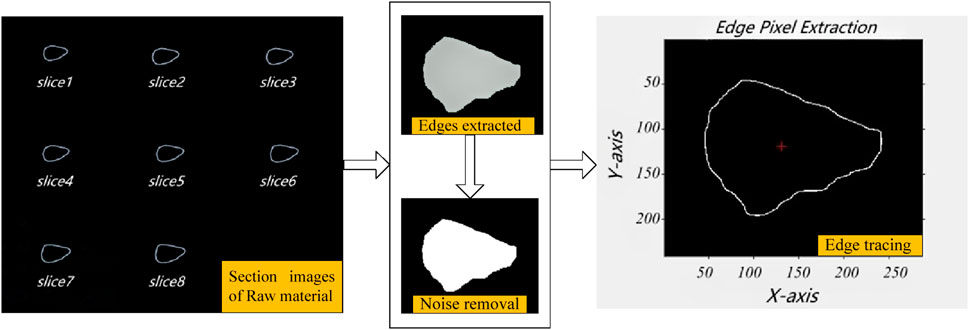
Figure 3. Edge extraction process of a single aggregate section.
From Figure 3, it can be seen that using the Canny operator and boundary tracing can better reflect the changes in edge feature of the aggregate two-dimensional image. This method not only has strong noise resistance, but also has high positioning accuracy. It can quickly identify the gradient perimeter of the image edge and the area enclosed by the image boundary, providing support for further proposing accurate and reasonable aggregate shape and edge feature evaluation indicators based on edge detect (Taheri-Shakib and Al-Mayah, 2023). Additionally, it is important to note that the segmented images in Figure 2 represent different horizontal sections of the aggregate, but they may not exhibit significant visual differences due to the consistency of the aggregate’s characteristics and smaller scan depth interval. This consistency could be attributed to the type of aggregate, its homogeneity, or the scanning resolution used.
3.2 Establishment of morphological characteristics indicators for coarse aggregates
3.2.1 Comparison and selection of shape and angularity parameters of coarse aggregates
With the continuous development of digital image processing technology, there are many types of aggregate shape evaluation indicators. According to literature research, evaluation indicators are mainly divided into methods based on three-dimensional images and methods based on two-dimensional images (Dong and Catbas, 2021). This article selects axial coefficient, convexity, roughness, angularity, roundness and rectangularity indicators for research. The calculation methods of the above six indicators are carried out according to reference (Xie et al., 2017; Li et al., 2015).
In order to verify the rationality of the proposed indicators, different sizes of regular polygons were selected for the six indicators, with aggregate size of 9.5 mm, 13.2 mm, and 16 mm respectively. Using MATLAB software, output each two-dimensional polygon image, as shown in Figure 4. The indicator values of each two-dimensional shape were calculated, and the calculation results of each polygon are shown in Figure 5.
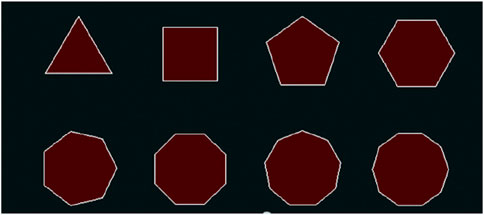
Figure 4. Recognition results of different polygons.
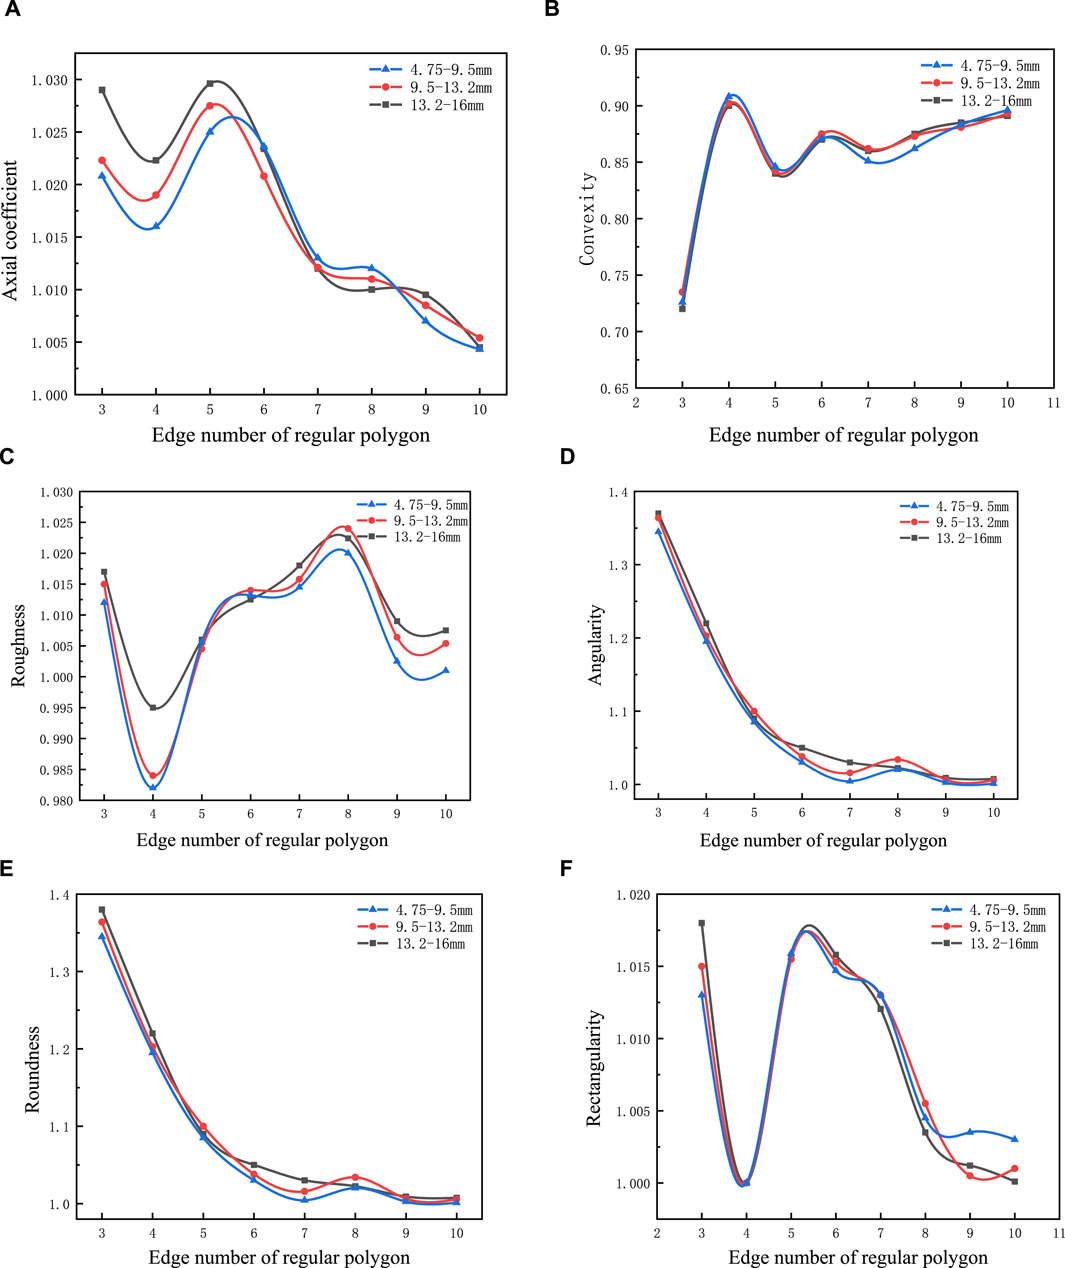
Figure 5. Calculation results of different polygon indicators. (A) Axial coefficient, (B) Convexity, (C) Roughness, (D) Angularity, (E) Roundness, (F) Rectangularity.
The data from Figures 5D, E indicate that as the number of sides of the regular polygon increases, both the angularity and roundness parameters decrease. This observation suggests that aggregates with more sides tend to have smoother edges and less angularity, which can potentially affect their interlocking ability and overall performance in asphalt mixtures. The decrease in angularity and roundness may be attributed to the increased regularity and symmetry associated with higher-sided polygons, leading to a more uniform and less jagged shape. Figures 5A, F demonstrate a linear relationship between the axial coefficient and both the rectangularity and the number of sides of the regular polygon, starting from the regular pentagon. This indicates that as the shape becomes more rectangular or as the number of sides increases, the axial coefficient follows a predictable pattern. This finding could be significant in predicting and optimizing the packing efficiency and stability of aggregates within asphalt mixtures, as the axial coefficient is closely related to these properties. However, it is important to note that not all indicators follow a clear trend with increasing polygon sides. Figures 5B, C show that convexity and roughness exhibit irregular patterns as the number of sides increases. This suggests that these indicators may be less sensitive to changes in shape or may be influenced by other factors not captured by the regular polygon representation alone. Overall, with the exception of roughness, the other five indicators appear to capture the changes in two-dimensional regular polygons to some extent. However, the sensitivity of these indicators to shape variations differs, highlighting the need for a comprehensive evaluation framework that considers multiple morphological characteristics simultaneously.
Different coarse aggregates with different particle sizes and rock types were selected for analysis. Limestone, basalt, and diabase from different quarries were selected, with three grades of particle sizes for each rock type, namely, 9.5–13.2 mm, 13.2–16 mm, and 16–19 mm. The coarse aggregates were screened, washed, and dried to eliminate the influence of mud content on the extraction of indicators. Ten two-dimensional images of horizontal sections were selected for each coarse aggregate using the self-developed laser scanning equipment, and the edge features of the coarse aggregate were traced using the Canny operator to identify and calculate six indicator values using a self-written Python program. The average value of each of the ten different indicator values was calculated and statistically analyzed using factor analysis (Finch, 2020). The collection of aggregate indicator data is shown in Figure 6.
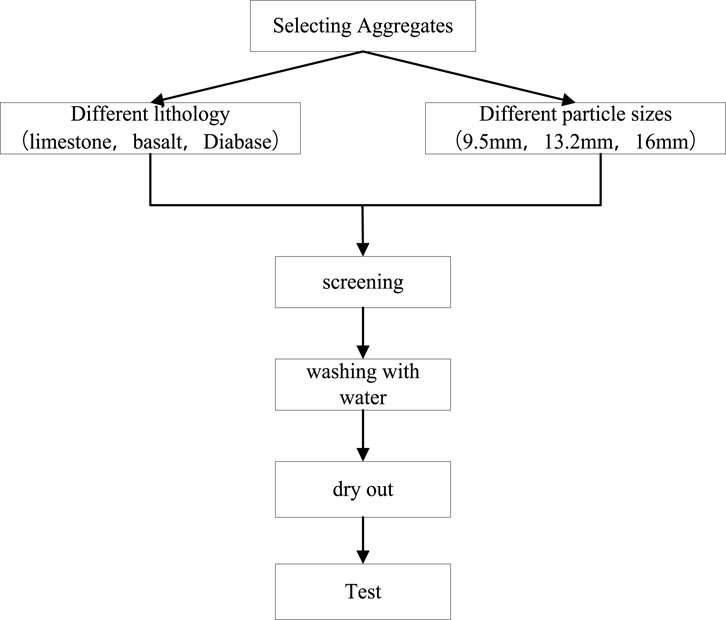
Figure 6. Data collection of aggregate indicators.
3.2.2 Factor analysis of coarse aggregate morphology
This experiment can identify the main indicators that affect the shape and edge feature of coarse aggregates by conducting specific data analysis on six indicators. Several of these indicators will be selected to describe the correlation of aggregates, and specific factors will be described through specific indicators. The factor analysis method of the experiment mainly consists of the following steps, as shown in Figure 7.

Figure 7. Factor analysis steps.
3.2.2.1 Data preparation
In order to obtain better comprehensive indicators for evaluating the shape and edge feature of aggregates, a large amount of analysis is required in this experiment. To eliminate the influence of the laser line on the selection of the aggregate horizontal section placement surface, two different aggregate placement directions were selected to reduce the impact of the aggregate placement position. In this experiment, samples of different rock types and particle sizes were randomly selected, and 300 particles were selected for each particle size under each rock type, totaling 2,700 particles and 27,000 two-dimensional images of aggregates for analysis. The index values of partial values different coarse aggregate particles are shown in Table 1.
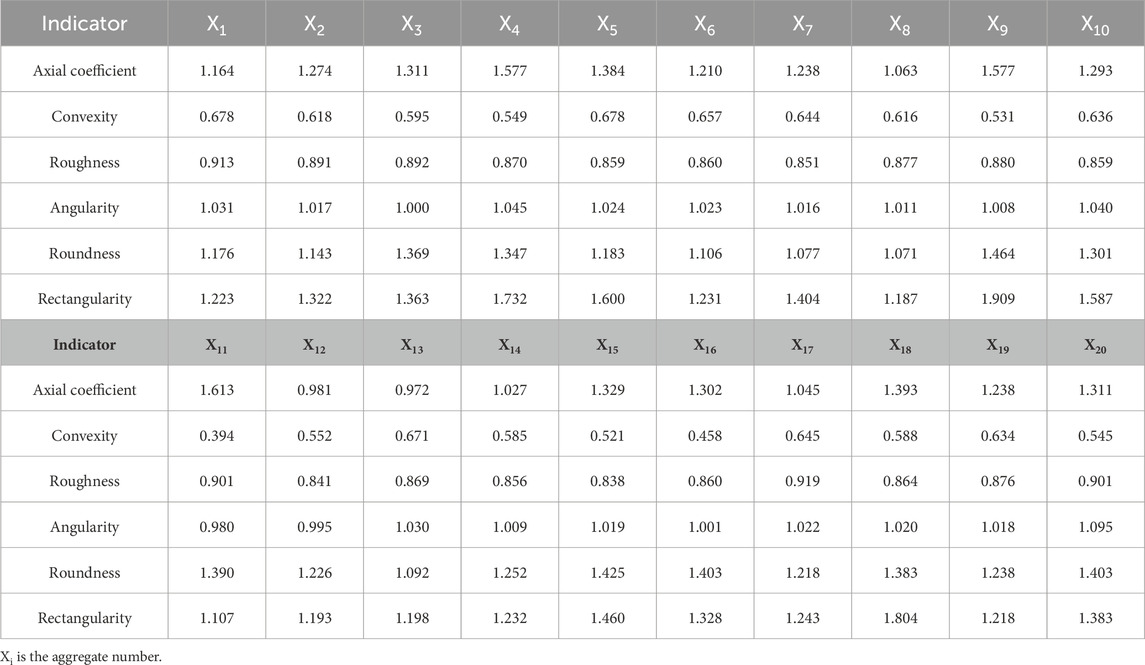
Table 1. Indicators test values of different coarse aggregate.
According to the tested sample data of the aggregate material, calculate the average, maximum, minimum, and coefficient of variation of 2,700 particles of the aggregate, as shown in Table 2.
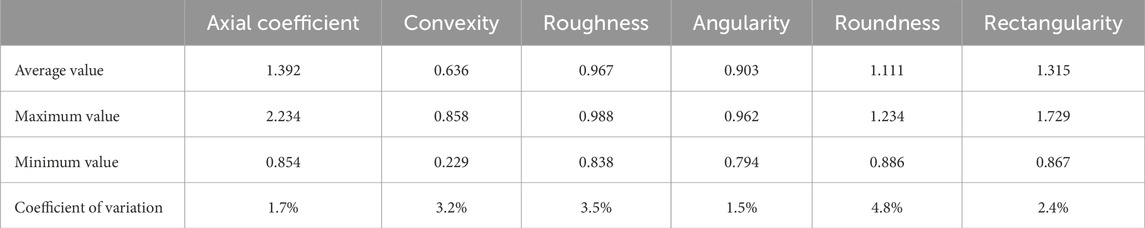
Table 2. Aggregate particle sample statistics.
To calculate the probability value of a sample, it is necessary to determine the number of groups. According to the calculation formula of the number of groups k and the sample size n, which is k = 0.87 (n-1)0.4, the value of k in this study is 16 with a sample size of n = 2,700. Based on the value of k and the maximum and minimum values of various aggregate shape indicators, the step length d of the group can be calculated using formula (1):
Analyze the normal distribution pattern of the extracted sample, draw a probability density distribution graph, and detect the normal distribution of each index based on the calculated sample skewness SK and sample kurtosis KU. Skewness measures the asymmetry of a data distribution, while kurtosis measures the steepness of a data distribution. For a normal distribution, skewness is approximately 0, and kurtosis is approximately 3. If the skewness and kurtosis of sample data are close to these values, it can be considered that the data is close to a normal distribution. Based on the principle of standard deviation, this article considers data points that exceed the mean plus or minus 2 or 3 standard deviations as outliers, and then replaces these outliers with the median, mean, or other appropriate values. If X1, X2 … , Xn is a sample that describes the characteristics of the population, then its kth central moment is shown in formula 2, sample skewness is shown in formula 3, and sample kurtosis is shown in formula 4.
When SK > 0, it is positively skewed; when SK < 0, it is negatively skewed, which can reflect the symmetry information of the overall density curve of the coarse aggregate morphology and various test indicators. When KU > 0, the peak is high; when KU < 0, the peak is low, which can reflect the steepness of the various test indicators at the peak of the coarse aggregate morphology (Weng et al., 2022).
At a significance level of a = 0.01 and p = 0.95 for the test indicators, based on a sample size of 2,700, the critical value table for skewness and kurtosis tests is shown in Table 3.
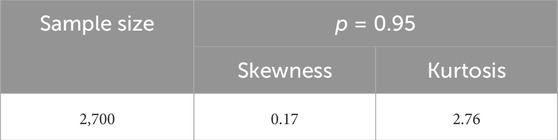
Table 3. Critical values for skewness test and kurtosis test.
Based on the judgment of the graphical characteristics of the probability density cumulative curve described above, the normality of various aggregate morphology test indicators was determined using the calculation formula. MATLAB was used to test axial coefficient, convexity, roughness, angularity, roundness, and rectangularity, and the six indicators were arranged in ascending order. Based on the step size and k value, the probability density distribution of the six indicators was plotted as shown in Figure 8.
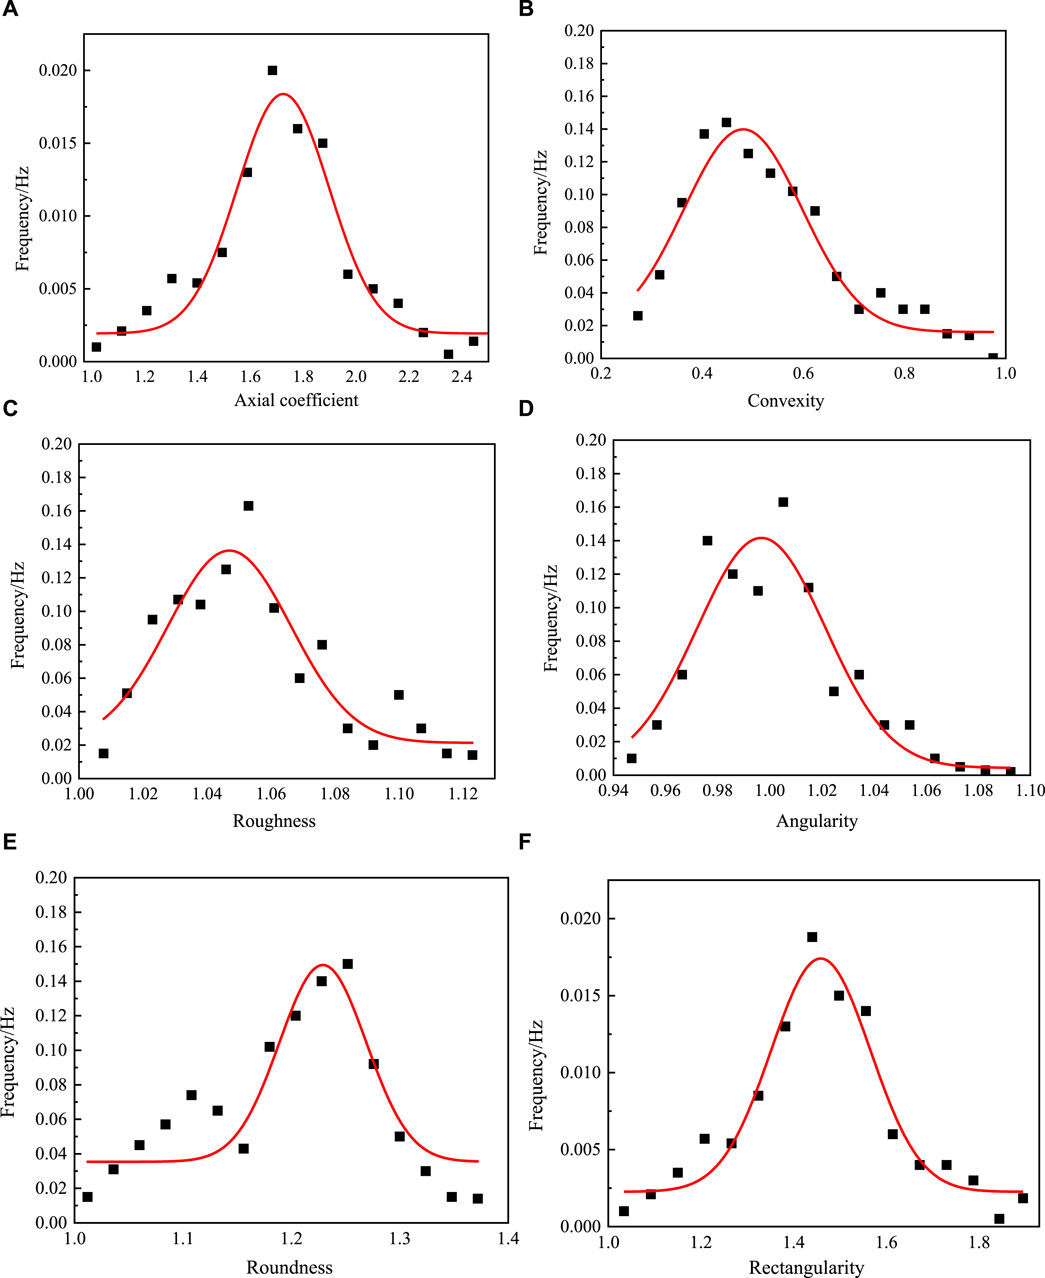
Figure 8. Probability density distribution of different indicators. (A) Axial coefficient, (B) Convexity, (C) Roughness, (D) Angularity, (E) Roundness, (F) Rectangularity.
From Figure 8, it can be seen that according to the skewness test, the axial coefficient and rectangularity conform to normal distribution (skewness = 0), while convexity, roughness, and angularity exhibit left-skewed distribution, and roundness exhibits right-skewed distribution. According to the kurtosis test, the axial coefficient conforms to normal distribution, and the angularity exhibits a thin tail (kurtosis value < 3), while roundness, roughness, convexity, and rectangularity exhibit a thick tail (kurtosis value > 3). The sample data for all six indicators were adjusted based on skewness and kurtosis to ensure that all indicators conform to a completely normal distribution, and the data were re-adjusted and assigned values accordingly.
After assigning values to the data, it was analyzed and found that different indicators have certain differences. To eliminate the differences in the size of the values of different indicators, the data was standardized, so that the data falls within the range of [0,1]. This ensures that the differences in the values of different indicators can be ignored, and forward normalization was also performed. This method is called Min-max normalization, and the calculation method for the conversion function is as follows (Arora et al., 2021). The formula for calculating the positive directional indicator is shown as formula 5.
The formula for calculating the negative directional indicator is shown as formula 6.
Which, the max and the min refer to the maximum and minimum values of each indicator tested for coarse aggregate.
According to the above method, all obtained coarse aggregate indicator data were standardized and normalized. The positive and negative directions of the indicators are shown in Table 4, so that the range of all indicators is within the [0,1] interval. The closer the value is to 1, the better the shape or angular characteristics of the aggregate. This is done to eliminate the different effects of each indicator in the comprehensive analysis. The results are shown in Table 5.
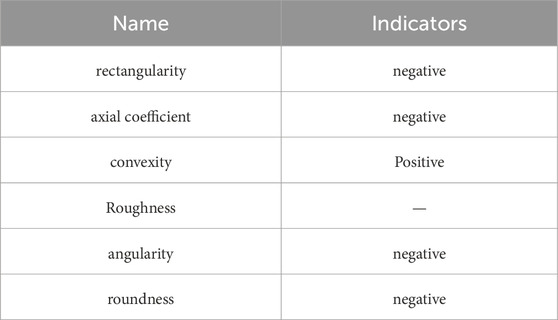
Table 4. Positive and negative directions of evaluation indicators.
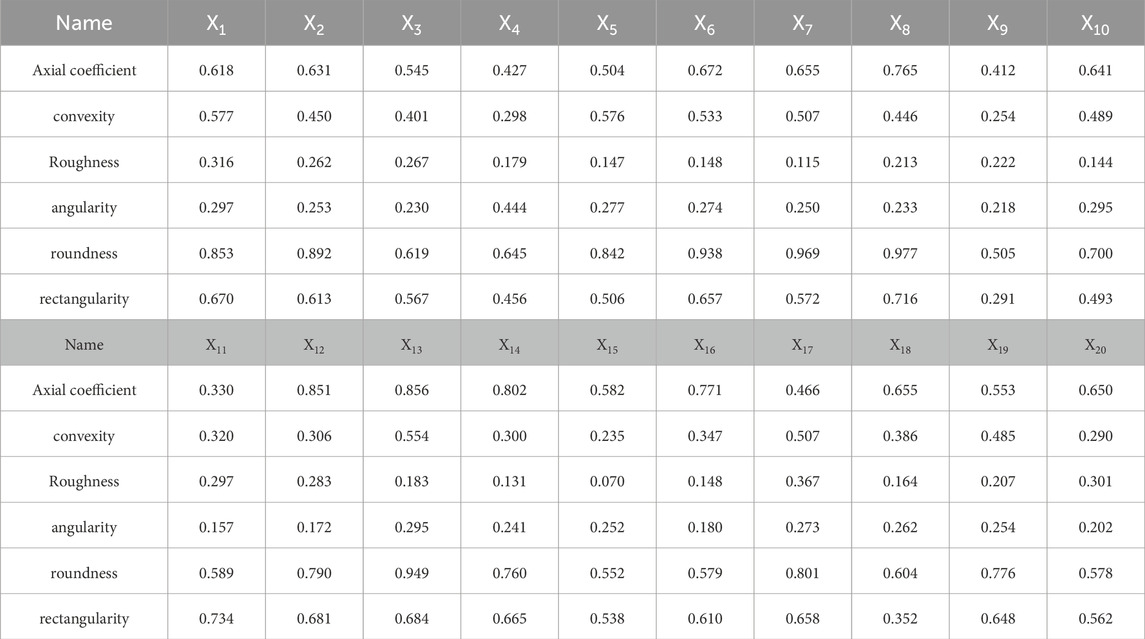
Table 5. Test results of different coarse aggregate particle indicators.
3.2.2.2 Data analysis
In order to investigate the influence of different coarse aggregate particle sizes and rock types on the indicators, the comprehensive score model coefficients for different indicators were calculated using limestone, basalt, and diabase from different quarries. The comprehensive score coefficients for different indicators were calculated using particle sizes of 9.5–13.2 mm, 13.2–16 mm, and 16–19 mm. The results of the two calculations are shown in Figure 9.
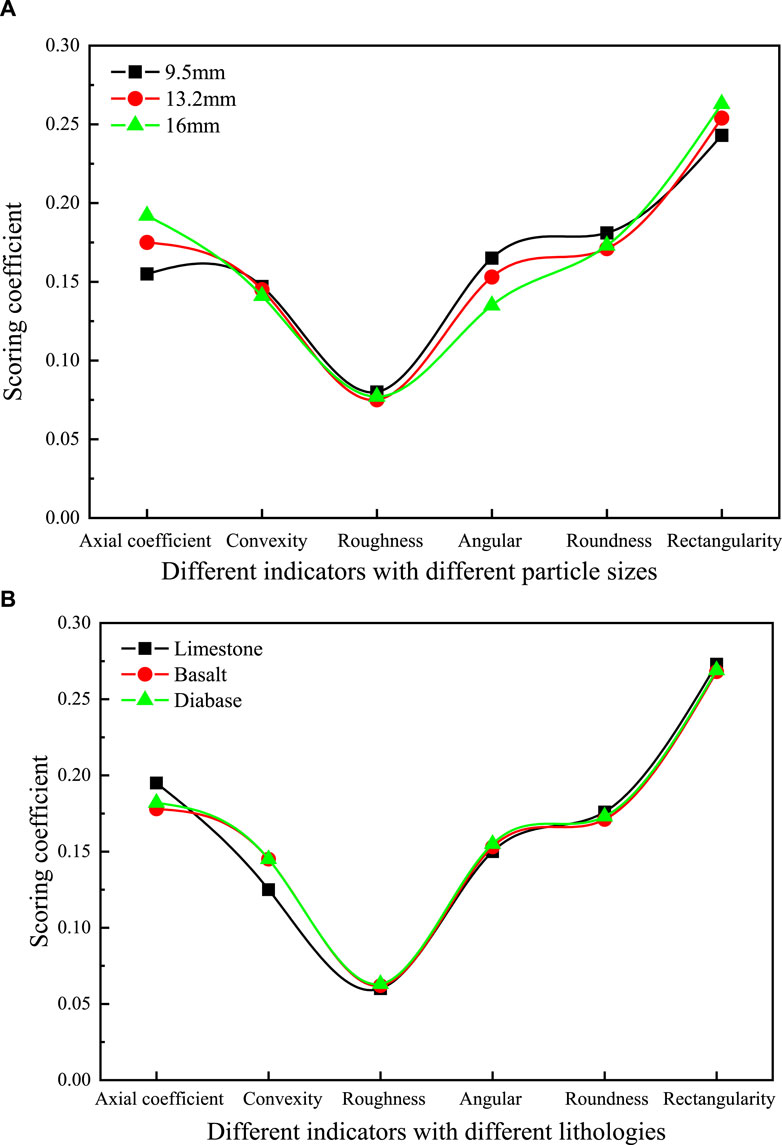
Figure 9. Comprehensive scoring coefficient. (A) Comprehensive score coefficient of each indicator for different particle sizes, (B) Comprehensive score coefficient of each indicator for different lithologies
From Figure 9, it can be seen that the score coefficients of different aggregate particle size indicators remain basically unchanged. The rectangularity and axial coefficient increase with the increase of aggregate particle size, and the comprehensive score coefficient continues to increase. The convexity and angularity parameters decrease with the increase of particle size, and the comprehensive score coefficient of the indicators continuously decreases. This may be due to the influence of the change in aggregate particle size on each indicator. The larger the particle size of the aggregate, the greater the degree of influence of shape than that of edge feature. The comprehensive score model coefficients of different indicators are different, and there is no obvious trend in the comprehensive score model coefficients of different aggregate lithologies. It can be concluded that lithology has little effect on the morphology indicators of aggregates.
3.2.2.3 Analysis of results
Kaiser-Meyer-Olkin (KMO) and Bartlett’s test were used to examine the correlation between the indicator data and the coarse aggregate indicator variables (Sang et al., 2023). The Kaiser-Meyer-Olkin (KMO) test is a sampling adequacy test whose statistic compares the simple correlation coefficients among variables with their partial correlation coefficients. The KMO value ranges from 0 to 1, and a value closer to 1 indicates stronger correlations among variables, making the original variables more suitable for factor analysis. Conversely, if the KMO value is close to 0, the correlations among variables are weak, making factor analysis unsuitable. On the other hand, Bartlett’s test is a method for testing null hypotheses based on the correlation matrix of variables. If the correlation matrix is not an identity matrix (i.e., all elements on the diagonal of the correlation matrix are not 1, or the elements off the diagonal are not 0), then the statistic for Bartlett’s test will be relatively large, and the corresponding accompanying probability value will be less than the significance level. In this case, it is believed that there is a correlation among the original variables, making them suitable for factor analysis. This article uses a scree plot for factor extraction. The scree plot is a graphical tool used to display the size of the eigenvalues for each factor. In a scree plot, it is typically observed that the eigenvalues exhibit a distinct elbow point. Factors before the elbow point have larger eigenvalues, while those after the elbow point decrease rapidly. It is a common practice to select the factors before the elbow point as the extracted factors. The results are shown in Table 6, with a KMO value of 0.883 > 0.6, indicating that the test data for the coarse aggregate indicators is suitable for factor analysis.
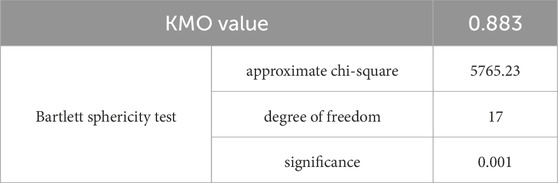
Table 6. KMO and Bartlett test.
Due to the lack of consideration of the expected number of factors during the analysis, the number of factors was determined by analyzing the data and obtaining the scree plot and variance explained table. The scree plot is shown in Figure 10, and the variance explained is shown in Table 7.
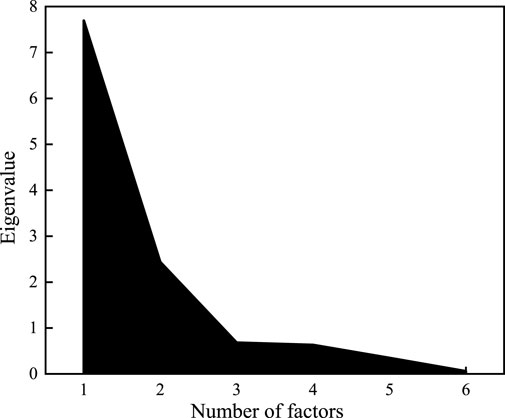
Figure 10. Scree plot.

Table 7. Variance explanation rate.
The variance explanation rate table is shown in Table 7.
When the eigenvalues are greater than 1, one factor can be extracted. The eigenvalues of factor 1 and factor 2 are 7.583 and 2.365, respectively, indicating the preliminary extraction of two factors.
The Variance explanation rate table can also be used to determine how many factors are appropriate to extract and the variance explained ratio of each factor. The larger the variance explanation rate, the more original data information is included. Since the data has been normalized and all indicator values are in the [0,1] interval, the variance explanation rate before and after rotation is the same. Therefore, this study’s data can extract 2 factors, and the variance explanation rate after rotation of these two factors is 54.86% and 30.65%, respectively. The cumulative variance explained ratio after rotation is 85.52%, indicating that extracting two factors can express 85.52% of the information of the research data with little loss of information. In summary, the expression of the two factors can express the morphological characteristics of the coarse aggregate.
3.2.2.4 Results correction
Calculate the loading coefficients of the rotated factors for the six indicators studied, calculate the communality of the factors, and process the concentrated factors. The loading coefficients of the rotated factors are shown in Figure 11.
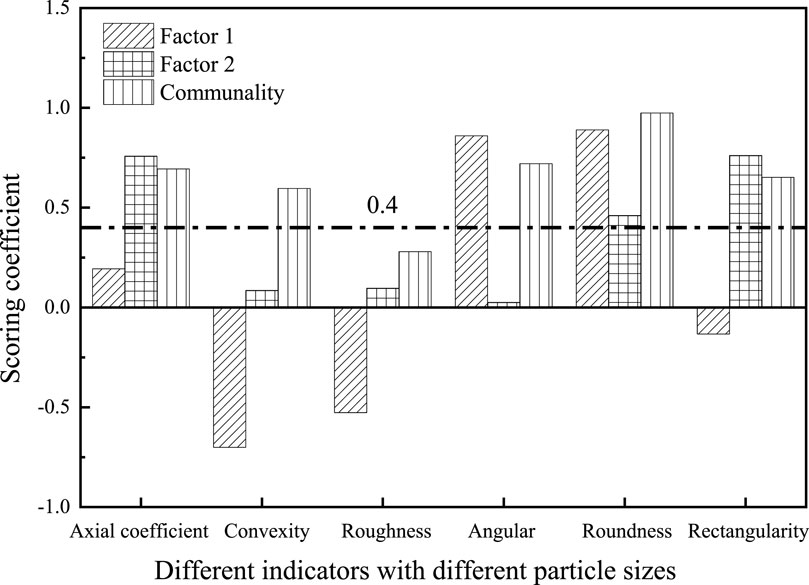
Figure 11. Factor load coefficient after rotation.
By judging whether the commonality is greater than 0.4, it is determined whether the indicator can evaluate the research content (Shrestha, 2021). As shown in the figure above, the commonality of axial coefficient, convexity, angularity, roundness and rectangularity are all greater than 0.4, so they can be used to evaluate the morphological characteristics of coarse aggregates, and the commonality of roughness is 0.28, which is less than 0.4, so roughness cannot evaluate the morphological characteristics of coarse aggregates. According to the rotated factor loading coefficients, two factors are obtained. Factor 1 is mainly determined by convexity, angularity, and roundness, while factor 2 is mainly determined by axial coefficient, rectangularity, and roundness. Based on previous research and the actual characteristics of coarse aggregate morphology, factor 1 mainly evaluates the edge feature of coarse aggregates, while factor 2 mainly evaluates the shape of coarse aggregates.
3.2.2.5 Factor naming
By conducting data research on a set of rectangularity, axial coefficient, and roundness, and another set of convexity, roundness, and angularity, the rotation factor load coefficients of the coarse aggregate factor 1 and factor 2 can be calculated, and the communality can be obtained. The factor load coefficients after rotation are shown in Table 8.
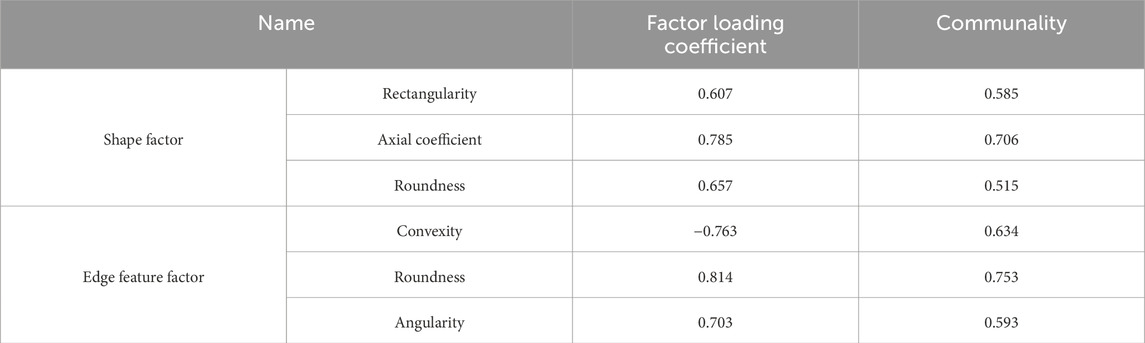
Table 8. Shape factor load coefficient after rotation.
3.2.3 Establishment of comprehensive shape and edge feature for coarse aggregates
By adjusting the results, the factor score relationship can be obtained as shown in formula 7
By using the model expressed by the above factor expression, two common factors are proposed. Based on the factor loading coefficients of each indicator mentioned above, the previously standardized data calculation formula is substituted into the factor loading coefficients to obtain two factor score expressions for the shape and edge feature of coarse aggregates. The calculation expression for the research data is shown as formula 8 and formula 9.
Which, Z-Rectangularity; A-Axial coefficient; R-Roundness; C-Convexity; Ap-Angularity; SF-Shape factor; EFF-Edge feature factor.
All data is subjected to inverse standardization processing by SPSS software to obtain the comprehensive expression of coarse aggregate shape, which are respectively the Aggregate Shape factor (SF) and the Aggregate Edge feature factor (EFF). The calculation formulas for inverse standardization processing are shown in formula 10 and 11:
Comprehensive shape factor of coarse aggregate (SF) as shown in follow:
Comprehensive edge feature factor of coarse aggregate (EFF) as shown in follow:
According to the expressions of the comprehensive shape factor and comprehensive edge feature factor based on coarse aggregate, the index values of 2,700 aggregates were calculated and ranked. The maximum and minimum values of SF and EFF were obtained. The calculation results of some index values are shown in Table 9.
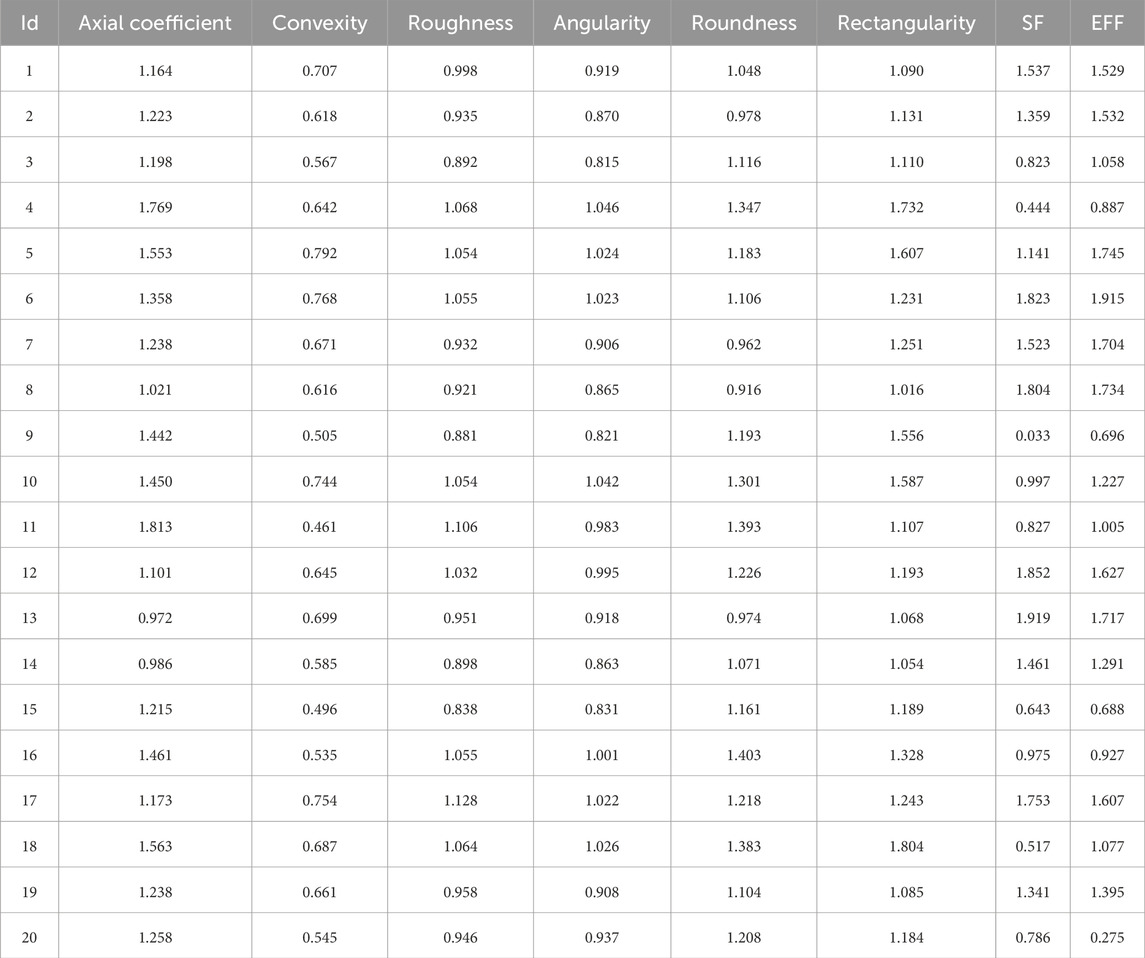
Table 9. Partial values of SF and EFF Indicator.
According to the calculation table of 2,700 particles, the range of SF is [0.007, 1.919], and the range of EFF is [0.104, 1.915]. The larger the value of the comprehensive shape factor, the closer the coarse aggregate is to a sphere, and the smaller the value, the closer it is to a needle-shaped aggregate. The larger the value of the comprehensive edge feature factor, the richer the edge feature of the coarse aggregate, and the smaller the value, the poorer the edge feature of the coarse aggregate.
Statistical analysis was performed on the SF and EFF index values obtained from testing 2,700 coarse aggregates, as shown in Figure 12 and Figure 13.
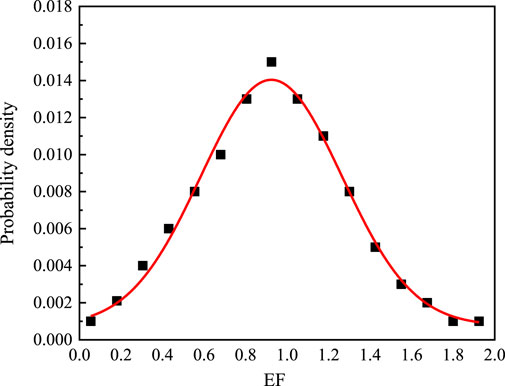
Figure 12. Probability density distribution diagram of SF.
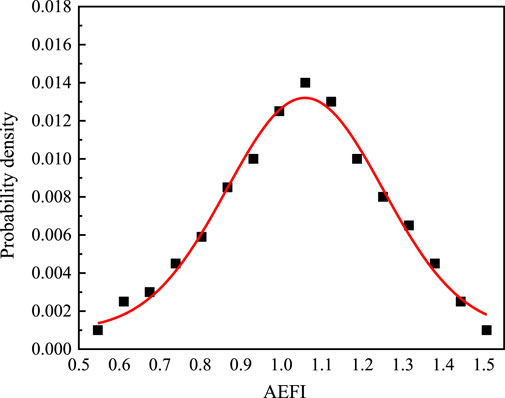
Figure 13. Probability density distribution diagram of EFF.
From Figure 12 and Figure 13, it can be seen that after standardization and positive transformation of six indicators data including axial coefficient, convexity, roughness, angularity, roundness and rectangularity, the SF obtained through factor analysis can well represent the variation characteristics of shape and edge feature of coarse aggregate, and conforms to normal distribution with 2,700 coarse aggregate data. Through calculation, it can be obtained that μSF = 0.932 and σSF = 0.364, μEFF = 1.375 and σEFF = 0.316. Among them, μSF and μEFF are the mean values of the indicator values tested by EFF and SF, and σSF and σEFF are the standard deviations of the indicator values tested by EFF and SF.
According to the Lydall criterion, the index values of the 2,700 coarse aggregate tests should all be concentrated withinThe probability of falling within this range the range of (μ-3σ, μ+3σ). The probability of falling within this range exceeds 99%. Points falling outside of ±3σ should be removed. After optimization, the range of the comprehensive shape factor of coarse aggregate is [0.041, 1.793], and the range of the comprehensive edge feature factor of coarse aggregate is [0.368, 1.745].
To achieve interval division of the shape and edge feature of coarse aggregates, combined with manual testing data analysis of the shape and edge feature of coarse aggregates during actual testing, the index values of the (μ-3σ, μ-σ) interval are defined, the index values of the (μ-σ, μ+σ) interval are defined, and the (μ+σ, μ+3σ) interval is defined. The interval division diagram of the SF and EFF index values can be obtained as shown in Figure 14.
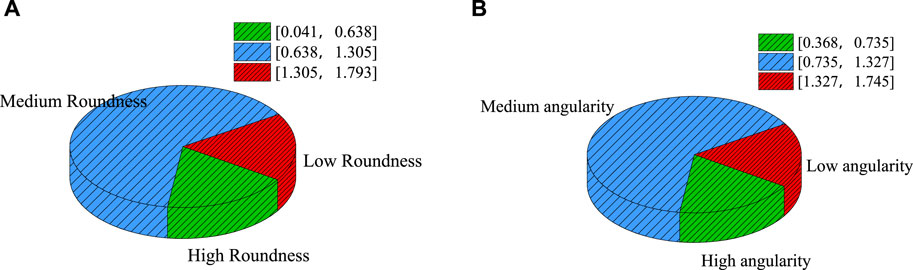
Figure 14. Evaluation of Coarse aggregate angularity and roundness. (A) SF index, (B) EFF index.
The above diagram distinguishes between different shapes and edge feature of coarse aggregates. When the SF index range is [1.305, 1.793], the coarse aggregate is of high roundness, and at this time, the coarse aggregate is close to being roundness or cubic in shape. When the index range is [0.638, 1.305], the coarse aggregate is of medium roundness, and most of the coarse aggregates are concentrated within this range, and the coarse aggregate is closer to being roundness or cubic in shape. When the index range is [0.041, 0.638], the coarse aggregate is of low roundness, and at this time, the coarse aggregate has a significant difference in roundness and is closer to being needle-like in shape.
For coarse aggregate angularity, when the EFF index range is [1.127, 1.575], the coarse aggregate is high angularity, and the surface of the coarse aggregate is rich in angularity and has more fracture surfaces. When the index range is [0.835, 1.127], the coarse aggregate is medium angularity, and most of the coarse aggregate is concentrated within this range, with a moderate level of angularity on the surface. When the index range is [0.368, 0.835], the coarse aggregate is low angularity, and the surface of the coarse aggregate is relatively smooth and closer to that of a pebble.
3.3 Results verification
Three types of coarse aggregates were selected, with a particle size range of 9.5–13.2 mm. Among them, limestone samples were collected from Zhejiang-Wenzhou, Guangdong-Foshan, and Shaanxi-Ankang. Basalt samples were collected from Zhejiang-Ningbo and Guangdong-Shandou. Diabase samples were collected from Guangdong-Huizhou and Zhejiang-Jiaxing. Using AIMS, X-ray-CT and the self-developed laser scanning equipment to measure the roundness parameters and angularity parameters of seven different lithological aggregates. The average values of each indicator were determined and are shown in Table 10.
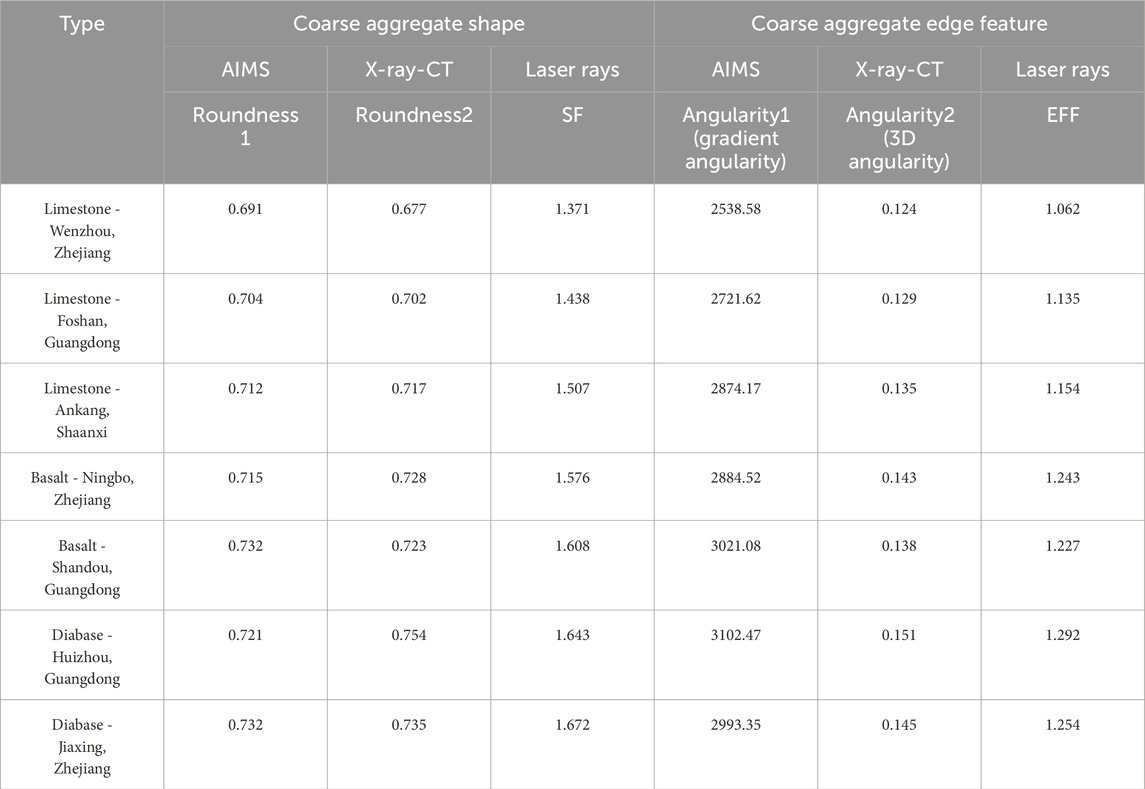
Table 10. Average value of coarse aggregate indicators for different equipment.
In order to further evaluate three methods for evaluating the characteristics of coarse aggregate morphology and verify the rationality of the proposed evaluation index for coarse aggregate morphology characteristics, this article uses AIMS and X-ray-CT equipment to test the indicators of coarse aggregate morphology and compares them with the comprehensive evaluation method based on line laser for the same coarse aggregate. Based on the above results, 7 types of coarse aggregates with different rock types and origins were tested, and the ranking of 7 coarse aggregate shape and edge characteristics was conducted. The coarse aggregate comprehensive shape and edge feature indicators with different sizes were taken as the horizontal axis, and the indicator values tested by AIMS and X-ray-CT were taken as the Y-axis. A straight line was fitted, and the R2 value was calculated. The fitting curves for the coarse aggregate shape and edge feature tested by different methods are shown in Figure 15.
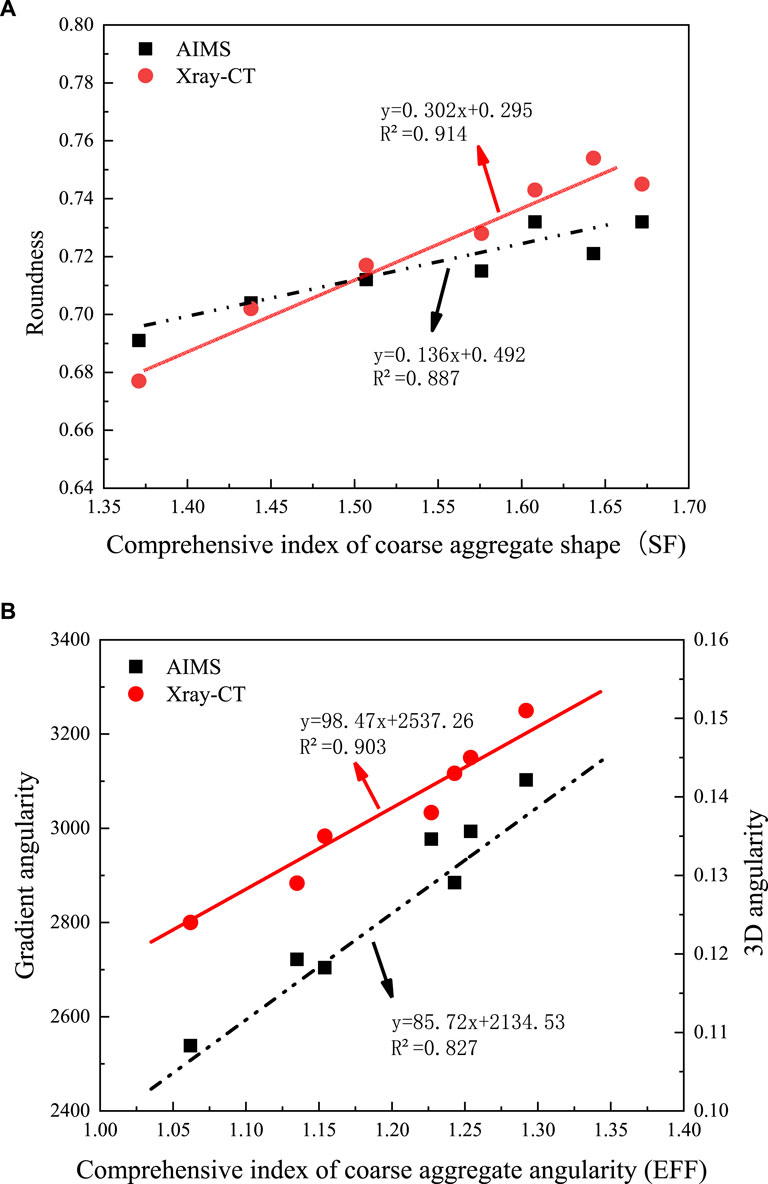
Figure 15. Correlation between the morphology evaluation index of coarse aggregates and other indicators. (A) Correlation analysis between SF and Roundness, (B) Correlation analysis between EFF and GA, 3DA.
This article conducts variance analysis tests on various indicators, determines the differences between the results of methods in various tests on the shape and angularity of coarse aggregates, and conducts quantitative analysis to show the reliability and rationality of the comprehensive index of coarse aggregate morphology. The calculation formula for Spearman’s rank correlation coefficient q is as follows (Temizhan et al., 2022). If the correlation coefficient q obtained through the measurement method is close to 1, it indicates that the indicator is more reasonable for evaluating the characteristics of coarse aggregate morphology. The relationship between the analysis results is shown in formula 12.
In formula 12, where n is the sample size, x and y represent the rankings of visual and image analysis results, respectively. The value of the Spearman rank correlation coefficient ranges from −1 to 1. A Spearman rank correlation coefficient of zero indicates no correlation between X and Y (where x and y are the rankings of X and Y, respectively), while a coefficient close to 1 indicates a monotonic correlation between X and Y, even if they are not linearly related. The results of various testing methods for the Spearman rank correlation coefficient analysis are shown in Figure 16.
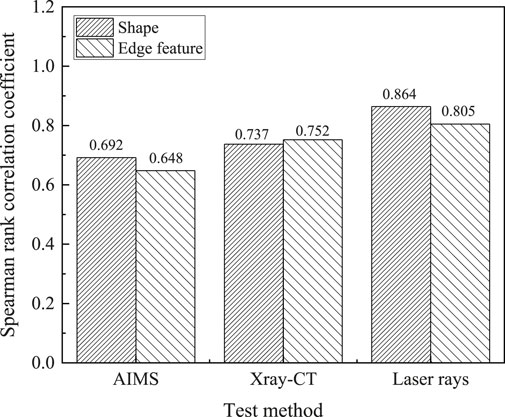
Figure 16. Results of Spearman rank correlation coefficient analysis.
The Spearman rank correlation coefficient shows that when using the comprehensive evaluation index based on line laser, the evaluation of the shape and edge feature of coarse aggregates has a high correlation coefficient, reaching 0.864 and 0.805, respectively. These correlation coefficients are higher than the morphological indexes of AIMS and X-ray-CT commonly used, indicating that the comprehensive index of coarse aggregates has rationality and accuracy in evaluation.
4 Conclusion
(1) After employing a self-developed laser scanning device for batch scanning of aggregates, multiple two-dimensional images of aggregates’ cross-sections were obtained. The implementation of the Canny operator along with the boundary tracking algorithm demonstrated robust noise resistance and high positional accuracy, resulting in an accurate representation of edge feature variations in the acquired images.
(2)To validate the proposed six aggregate morphology indicators, different sizes of regular polygons were utilized to simulate various shapes of aggregates. Results indicated that aggregates with more edges exhibited smoother edges and lower angularity, suggesting reduced interlocking ability in asphalt mixtures. Moreover, a stronger linear relationship was observed between edge number and axial coefficient with increasing edges. These findings are pivotal for predicting and optimizing the packing efficiency and stability of aggregates in asphalt mixtures, with the exception of roughness, all indicators effectively captured changes in two-dimensional regular polygons to some extent.
(3) Factor analysis of six indicator values in 2,700 two-dimensional images led to the proposal of Shape Factor (SF) and Edge Feature Factor (EFF) as significant factors affecting aggregate shape and edge characteristics, respectively. Following optimization, SF ranged from 0.041 to 1.793, while EFF ranged from 0.368 to 1.745. Within SF ranges of 1.305–1.793, 0.638 to 1.305, and 0.041 to 0.638, aggregates demonstrated high, medium, and low roundness, respectively. Similarly, EFF ranges of 1.127–1.575, 0.835 to 1.127, and 0.368 to 0.835 corresponded to high, medium, and low angularity of coarse aggregates, respectively.
(4) By conducting variance analysis tests on multiple indicators, this study examined differences in outcomes from various methods assessing the shape and angularity of aggregates. A comprehensive index of coarse aggregate morphology was quantitatively analyzed to establish its reliability and rationality. Notably, Spearman’s rank correlation coefficient revealed strong correlations between the evaluation of coarse aggregate shape and edge features using the line laser-based comprehensive evaluation index. Specifically, correlation coefficients of 0.864 and 0.805 exceeded those of commonly used methods such as AIMS and X-ray CT, indicating the rationality and accuracy of the self-developed laser scanning device in evaluating aggregate morphology.
Data availability statement
The original contributions presented in the study are included in the article/supplementary material, further inquiries can be directed to the corresponding author.
Author contributions
CCZ: Conceptualization, Methodology, Writing–review and editing. SC: Methodology, Writing–review and editing. QK: Conceptualization, Data curation, Writing–original draft. YJ: Writing–review and editing, Methodology.
Funding
The author(s) declare that financial support was received for the research, authorship, and/or publication of this article. This research was funded by the Basic Research Program of Natural Science of Shaanxi Province (2022JQ-535), Science and Technology Program of Department of Transport of Shaanxi Province (22–20k), Open Fund from Key Laboratory of Civil Aviation Intelligent Construction and Maintenance (300102213529), and the Ankang Science and Technology Research and Development Plan Project (AK2023-GY-14).
Conflict of interest
Author QK was employed by Hangzhou Communications Investment Group Co. Author YJ was employed by Ankang Transportation Construction Investment Group Co.
The remaining authors declare that the research was conducted in the absence of any commercial or financial relationships that could be construed as a potential conflict of interest.
Publisher’s note
All claims expressed in this article are solely those of the authors and do not necessarily represent those of their affiliated organizations, or those of the publisher, the editors and the reviewers. Any product that may be evaluated in this article, or claim that may be made by its manufacturer, is not guaranteed or endorsed by the publisher.
References
Arora, I., Gambhir, J., and Kaur, T. (2021). Data normalisation-based solar irradiance forecasting using artificial neural networks. Arabian J. Sci. Eng. 46, 1333–1343. doi:10.1007/s13369-020-05140-y
Busang, S., and Maina, J. (2022). Influence of aggregates properties on microstructural properties and mechanical performance of asphalt mixtures. Constr. Build. Mater. 318, 126002. doi:10.1016/j.conbuildmat.2021.126002
Candra, A. I., Mudjanarko, S. W., Poernomo, Y. C. S., and Vitasmoro, P. (2020). Analysis of the ratio of coarse aggregate to porous asphalt mixture. J. Phys. Conf. Ser. 1569 (4), 042029. doi:10.1088/1742-6596/1569/4/042029
Castillo, D., Caro, S., Darabi, M., and Masad, E. (2018). Influence of aggregate morphology on the mechanical performance of asphalt mixtures. Road Mater. Pavement Des. 19 (4), 972–991. doi:10.1080/14680629.2017.1283357
Cui, P., Xiao, Y., Yan, B., Li, M., and Wu, S. (2018). Morphological characteristics of aggregates and their influence on the performance of asphalt mixture. Constr. Build. Mater. 186, 303–312. doi:10.1016/j.conbuildmat.2018.07.124
Dong, C. Z., and Catbas, F. N. (2021). A review of computer vision–based structural health monitoring at local and global levels. Struct. Health Monit. 20 (2), 692–743. doi:10.1177/1475921720935585
Finch, W. H. (2020). Using fit statistic differences to determine the optimal number of factors to retain in an exploratory factor analysis. Educ. Psychol. Meas. 80 (2), 217–241. doi:10.1177/0013164419865769
Gao, J., Wang, H., Bu, Y., You, Z., Zhang, X., and Irfan, M. (2020). Influence of coarse-aggregate angularity on asphalt mixture macroperformance: skid resistance, high-temperature, and compaction performance. J. Mater. Civ. Eng. 32 (5), 04020095. doi:10.1061/(asce)mt.1943-5533.0003125
Guo, P., Chen, S., Xie, F., Feng, Y., Cao, Z., Chen, C., et al. (2021). Influence of coarse aggregate morphological properties on the performances of warm-mix asphalt containing recycled asphalt pavement. J. Mater. Civ. Eng. 33 (5), 04021081. doi:10.1061/(asce)mt.1943-5533.0003681
Hassan, H. M. Z., Wu, K., Huang, W., Chen, S., Zhang, Q., Xie, J., et al. (2021). Study on the influence of aggregate strength and shape on the performance of asphalt mixture. Constr. Build. Mater. 294, 123599. doi:10.1016/j.conbuildmat.2021.123599
Khairandish, M. I., Chopra, A., Singh, S., Chohan, J. S., and Kumar, R. (2021). Effect of gradation and morphological characteristics of aggregates on mechanical properties of bituminous concrete and dense bituminous macadam. Iran. J. Sci. Technol. Trans. Civ. Eng. 46, 293–307. doi:10.1007/s40996-021-00609-8
Kusumawardani, D. M., and Wong, Y. D. (2021). Effect of aggregate shape properties on performance of porous asphalt mixture. J. Mater. Civ. Eng. 33 (8), 04021208. doi:10.1061/(asce)mt.1943-5533.0003801
Li, J., Li, P., Su, J., Yang, L., and Wu, X. (2021). Coarse aggregate movements during compaction and their relation with the densification properties of asphalt mixture. Int. J. Pavement Eng. 22 (8), 1052–1063. doi:10.1080/10298436.2019.1659263
Li, J., Zhang, J., Qian, G., Zheng, J., and Zhang, Y. (2019). Three-dimensional simulation of aggregate and asphalt mixture using parameterized shape and size gradation. J. Mater. Civ. Eng. 31 (3), 04019004. doi:10.1061/(asce)mt.1943-5533.0002623
Li, J., Zhang, J., Yang, X., Zhang, A., and Yu, M. (2023). Monte Carlo simulations of deformation behaviour of unbound granular materials based on a real aggregate library. Int. J. Pavement Eng. 24 (1), 2165650. doi:10.1080/10298436.2023.2165650
Li, X., Bu, Y., and Wang, H. (2015). Research on quantitative evaluation of morphological characteristic of coarse aggregates. Jianzhu Cailiao Xuebao/Journal Build. Mater. 18 (3), 524. doi:10.3969/j.issn.1007-9629.2015.03.028
Liu, W., Gao, Y., Huang, X., and Li, L. (2020). Investigation of motion of coarse aggregates in asphalt mixture based on virtual simulation of compaction test. Int. J. Pavement Eng. 21 (2), 144–156. doi:10.1080/10298436.2018.1447109
Ostrowski, K., Sadowski, Ł., Stefaniuk, D., Wałach, D., Gawenda, T., Oleksik, K., et al. (2018). The effect of the morphology of coarse aggregate on the properties of self-compacting high-performance fibre-reinforced concrete. Materials 11 (8), 1372. doi:10.3390/ma11081372
Peng, Y., and Yang, H. (2023). Aggregate boundary recognition of asphalt mixture CT images based on convolutional neural networks. Road Mater. Pavement Des., 1–17. doi:10.1080/14680629.2023.2233630
Pouranian, M. R., and Haddock, J. E. (2021). A new framework for understanding aggregate structure in asphalt mixtures. Int. J. Pavement Eng. 22 (9), 1090–1106. doi:10.1080/10298436.2019.1660340
Rajan, B., and Singh, D. (2020). Investigation on effects of different crushing stages on morphology of coarse and fine aggregates. Int. J. Pavement Eng. 21 (2), 177–195. doi:10.1080/10298436.2018.1449951
Sang, F., Luo, R., Chen, Y., Ge, X., and Xiao, M. (2023). Factor analysis evaluation of asphalt pavement performance considering structural strength and hidden cracks. Constr. Build. Mater. 408, 133651. doi:10.1016/j.conbuildmat.2023.133651
Shrestha, N. (2021). Factor analysis as a tool for survey analysis. Am. J. Appl. Math. Statistics 9 (1), 4–11. doi:10.12691/ajams-9-1-2
Taheri-Shakib, J., and Al-Mayah, A. (2023). A review of microstructure characterization of asphalt mixtures using computed tomography imaging: prospects for properties and phase determination. Constr. Build. Mater. 385, 131419. doi:10.1016/j.conbuildmat.2023.131419
Temizhan, E., Mirtagioglu, H., and Mendes, M. (2022). Which correlation coefficient should be used for investigating relations between quantitative variables. Acad. Sci. Res. J. Eng. Technol. Sci. 85, 265–277.
Wang, C., Wang, H., Oeser, M., and Mohd Hasan, M. R. (2021). Investigation on the morphological and mineralogical properties of coarse aggregates under VSI crushing operation. Int. J. Pavement Eng. 22 (12), 1611–1624. doi:10.1080/10298436.2020.1714043
Wang, L., Sun, W., Tutumluer, E., and Druta, C. (2013). Evaluation of aggregate imaging techniques for quantification of morphological characteristics. Transp. Res. Rec. 2335 (1), 39–49. doi:10.3141/2335-05
Weng, Z., Ablat, G., Wu, D., Liu, C., Li, F., Du, Y., et al. (2022). Rapid pavement aggregate gradation estimation based on 3D data using a multi-feature fusion network. Automation Constr. 134, 104050. doi:10.1016/j.autcon.2021.104050
Xie, X., Lu, G., Liu, P., Wang, D., Fan, Q., and Oeser, M. (2017). Evaluation of morphological characteristics of fine aggregate in asphalt pavement. Constr. Build. Mater. 139, 1–8. doi:10.1016/j.conbuildmat.2017.02.044
Yang, D., Peng, B., Al-Huda, Z., Malik, A., and Zhai, D. (2022). An overview of edge and object contour detection. Neurocomputing 488, 470–493. doi:10.1016/j.neucom.2022.02.079
Keywords: asphalt pavement, coarse aggregate morphology, quantitative analysis, comprehensive evaluation, factor analysis
Citation: Zhang C, Cheng S, Kong Q and Jiang Y (2024) Quantitative analysis and comprehensive evaluation of coarse aggregate morphology for asphalt pavement. Front. Mater. 11:1374752. doi: 10.3389/fmats.2024.1374752
Received: 22 January 2024; Accepted: 07 March 2024;
Published: 26 March 2024.
Edited by:
Joel Oliveira, University of Minho, PortugalReviewed by:
Jue Li, Chongqing Jiaotong University, ChinaZongwu Chen, China University of Geosciences Wuhan, China
Sri Atmaja P. Rosyidi, Muhammadiyah University of Yogyakarta, Indonesia
Muhammad Naqiuddin Mohd Warid, University of Technology Malaysia, Malaysia
Copyright © 2024 Zhang, Cheng, Kong and Jiang. This is an open-access article distributed under the terms of the Creative Commons Attribution License (CC BY). The use, distribution or reproduction in other forums is permitted, provided the original author(s) and the copyright owner(s) are credited and that the original publication in this journal is cited, in accordance with accepted academic practice. No use, distribution or reproduction is permitted which does not comply with these terms.
*Correspondence: Chen Zhang, 865916600@qq.com