Machine learning for monitoring hobbing tool health in CNC hobbing machine
 Nagesh Tambake1
  Bhagyesh Deshmukh1
  Sujit Pardeshi2
  Haitham A. Mahmoud3
  Robert Cep4
  Sachin Salunkhe5,6*
  Emad Abouel Nasr6
- 1Department of Mechanical Engineering, Walchand Institute of Technology, Solapur, India
- 2Department of Mechanical Engineering, COEP Technological University, Pune, India
- 3Department of Industrial Engineering, College of Engineering, King Saud University, Riyadh, Saudi Arabia
- 4Department of Machining, Assembly and Engineering Metrology, Faculty of Mechanical Engineering, VSB-Technical University of Ostrava, Ostrava, Czechia
- 5Department of Biosciences, Saveetha School of Engineering, Saveetha Institute of Medical and Technical Sciences, Chennai, India
- 6Gazi University Faculty of Engineering, Department of Mechanical Engineering, Maltepe, Türkiye
Utilizing Machine Learning (ML) to oversee the status of hobbing cutters aims to enhance the gear manufacturing process’s effectiveness, output, and quality. Manufacturers can proactively enact measures to optimize tool performance and minimize downtime by conducting precise real-time assessments of hobbing cutter conditions. This proactive approach contributes to heightened product quality and decreased production costs. This study introduces an innovative condition monitoring system utilizing a Machine Learning approach. A Failure Mode and Effect Analysis (FMEA) were executed to gauge the severity of failures in hobbing cutters of Computer Numerical Control (CNC) Hobbing Machine, and the Risk Probability Number (RPN) was computed. This numerical value aids in prioritizing preventive measures by concentrating on failures with the most substantial potential impact. Failures with high RPN numbers were considered to implement the Machine Learning approach and artificial faults were induced in the hobbing cutter. Vibration signals (displacement, velocity, and acceleration) were then measured using a commercial high-capacity and high-frequency range Data Acquisition System (DAQ). The analysis covered operating parameters such as speed (ranging from 35 to 45 rpm), feed (ranging from 0.6 to 1 mm/rev), and depth of cut (6.8 mm). MATLAB code and script were employed to extract statistical features. These features were subsequently utilized to train seven algorithms (Decision Tree, Naive Bayes, Support Vector Machine (SVM), Efficient Linear, Kernel, Ensemble and Neural Network) as well as the application of Bayesian optimization for hyperparameter tuning and model evaluation were done. Amongst these algorithms, J48 Decision tree (DT) algorithm demonstrated impeccable accuracy, correctly classifying 100% of instances in the provided dataset. These algorithms stand out for their accuracy and efficiency in building, making them well-suited for this purpose. Based on ML model performance, it is recommended to employ J48 Decision Tree Model for the condition monitoring of a CNC hobbing cutter. The emerging confusion matrix was crucial in creating a condition monitoring system. This system can analyze statistical features extracted from vibration signals to assess the health of the cutter and classify it accordingly. The system alerts the operator when a hobbing cutter approaches a worn or damaged condition, enabling timely replacement before any issues arise.
1 Introduction
The ever-increasing demands for precision and efficiency in the manufacturing industry necessitate continuous advancements in machining processes. Gear hobbing, a critical process for producing high-quality gears, is often hampered by tool wear, leading to reduced product quality and costly downtime. Traditional monitoring methods, relying on manual inspection or basic thresholding, lack the accuracy and real-time capabilities needed for optimal process control. Over the past few years, machine learning (ML) has become a potent instrument for monitoring conditions, promising to transform gear-hobbing operations significantly. Several researchers have explored the application of ML to monitor hobbing cutter conditions, employing various sensor data and algorithms. Vibration signals are widely used due to their sensitivity to tool wear and ease of acquisition. Acoustic emission (AE) sensors provide valuable insights into the micro-fracture process within the tool, further enhancing wear estimation accuracy. Additional data sources like cutting force, spindle current, and temperature are also being integrated better to understand the tool’s health (Zhang et al., 2021). Feature extraction is a critical step in the successful application of machine learning (ML). Various methodologies have been employed by researchers to analyse sensor data, utilizing techniques in the time domain (such as RMS, standard deviation, and peak-to-peak), frequency domain (FFT), and time-frequency domain (wavelet transform) to extract relevant information (Gauder et al., 2023). A wide range of ML approaches has been explored for monitoring the condition of hobbing cutters. Significant progress has been made in predictive models for tool wear and remaining useful life (RUL), which make use of supervised learning algorithms such as support vector machines (SVMs), artificial neural networks (ANNs), and random forests. Additionally, unsupervised learning algorithms like K-means clustering and principal component analysis (PCA) aid in anomaly detection and fault diagnosis (Rahoma et al., 2023). The increasing popularity of deep learning techniques, including convolutional neural networks (CNNs) and deep belief networks (DBNs), is attributed to their ability to automatically extract features and identify complex relationships within the data (Li et al., 2023). Research is continuously pushing the boundaries of ML-based hobbing cutter condition monitoring. Ensemble learning methods that combine multiple ML algorithms are being explored to improve accuracy and robustness. Transfer learning leverages knowledge from other domains to accelerate model training and enhance performance. Additionally, integrating physics-based models with ML algorithms offers a deeper understanding of the tool wear process, leading to more accurate predictions (Tambake et al., 2021). Despite significant progress, challenges remain. The need for standardized datasets and the high cost of data acquisition are key hurdles. Moreover, the complex and non-linear nature of the hobbing process poses challenges in developing accurate and robust ML models. Black-box models like deep neural networks also raise concerns regarding interpretability, hindering their practical application in industrial settings (Przybyś-Małaczek et al., 2023). Several successful industrial implementations demonstrate the potential of ML-based condition monitoring systems. Siemens and Sandvik Coromant have developed systems that utilize sensor data and ML algorithms to predict tool wear, optimize cutting parameters, and improve tool life in gear hobbing operations (Hameed et al., 2023). ML offers a promising avenue for advancing hobbing cutter condition monitoring. Researchers are steadily improving the accuracy and reliability of these systems by leveraging various sensor data, feature extraction techniques, and diverse ML algorithms. As research continues to address remaining challenges and explore new advancements, ML-based condition monitoring is poised to revolutionize the gear manufacturing industry by maximizing efficiency, productivity, and product quality.
(a) Objectives of the research Work:
• To develop a resilient and effective machine learning (ML) approach for monitoring the condition of hobbing cutters in CNC hobbing machines.
• To investigate the vibration’s time-domain response and employ statistical modelling of signals in the time domain for fault diagnosis.
• Address the risk of overfitting in the ML models by carefully considering model complexity, employing regularization parameters, and conducting thorough model evaluation using separate test sets.
(b) Scope of the Research work:
• The research encompasses the development of a comprehensive framework for condition monitoring, including data acquisition, feature extraction, selection, and scaling, as well as the training and evaluation of classifier models using different ML algorithms.
• The scope also involves examining the variety of dataset compositions and using appropriate methods to effectively explore the parameter space and identify the best settings for a specific problem.
2 Literature review
The importance of tool condition monitoring (TCM) literature in manufacturing is immense, as it drives advancements in predicting tool wear and optimizing machining processes. This literature review summarizes key findings and methodologies from various sources. Zeng et al. (2021) proposed a novel TCM approach using multi-sensor data fusion imaging and attention mechanisms, leveraging advanced sensing technologies to improve monitoring accuracy (Zeng et al., 2021). Li et al. (2020) introduced a Random Forests algorithm-based fault diagnosis method for centrifuges, providing valuable insights into machine learning techniques relevant to TCM (Yang and Shami, 2020). Klocke et al. (2016) presented an online tool wear measurement system for hobbing highly loaded gears, focusing on real-time measurement during the hobbing process to tackle gear manufacturing challenges (Fritz et al., 2016). Zhang et al. (2014) proposed a tool wear model using least squares support vector machines and Kalman filter, contributing significantly to predictive models for tool wear (Zhang et al., 2014). Wang et al. (2021) developed a technique to forecast hobbing tool wear by leveraging CNC real-time monitoring data and applying deep learning, demonstrating deep learning methods for predicting tool conditions (Wang et al., 2021). Liu et al. (2019) focused on predicting the remaining useful life of cutting tools through support vector regression, introducing a modelling approach for estimating tool lifespan (Liu et al., 2019). Humayun et al. (2022) explored transfer learning with convolutional neural networks, showcasing the adaptability of machine learning techniques across domains (Humayun et al., 2022). Jia et al. (2022) presented a real-time wear monitoring system for hob cutters based on statistical analysis, improving the understanding of wear patterns and the development of effective monitoring strategies (Jia et al., 2022). Klocke et al. (2017) introduced a model-based online tool monitoring system for hobbing processes, emphasizing the importance of real-time monitoring in optimizing machining efficiency (Klocke et al., 2017). Wu et al. (2022) suggested an innovative online framework for predicting gear machining quality using ensemble deep regression, presenting an advanced method for quality prediction during gear machining (Wu et al., 2022). Cheng et al. (2020) developed an intelligent prediction model for tool wear in turning high-strength steel, highlighting the application of machine learning in forecasting tool wear under specific machining conditions (Cheng et al., 2020). Lee et al. (2019) focused on creating an intelligent tool condition monitoring system to identify manufacturing trade-offs and optimal machining conditions, contributing to the broader understanding of TCM for optimizing machining processes (Lee et al., 2019). Chen et al. (2018) explored tool wear prediction through multi-sensor data and deep belief networks, advancing deep learning techniques in TCM (Chen et al., 2018). Fong et al. (2021) investigated a universal tool wear measurement technique using image-based cross-correlation analysis, exploring non-traditional methods for tool wear measurement (Fong et al., 2021). Bagri et al. (2021) proposed a method for predicting tool wear and remaining useful life in micro-milling using neural networks, demonstrating the application of neural networks in predicting tool wear in intricate machining processes (Bagri et al., 2021). The reviewed literature advances tool condition monitoring by integrating various sensor technologies, machine learning algorithms, and real-time monitoring strategies, providing valuable insights and methodologies to enhance the accuracy and efficiency of predicting tool wear in machining processes. Despite the promising potential of ML for hobbing cutter condition monitoring, several research gaps remain. These gaps include:
• The scarcity of data poses a challenge: The hobbing industry frequently needs more high-quality datasets, which are essential for training and assessing machine learning models.
• Development of robust ML models: Robust ML models that can handle the complex data generated during the hobbing process are needed.
• Integration with CNC hobbing machines: Effective integration of ML models with existing machines is required for real-time monitoring and closed-loop control.
• Standardization and validation: Standardization of data collection and model evaluation methodologies is necessary for wider adoption of ML in the hobbing industry.
This study aims to fill existing gaps by creating a resilient and effective machine learning (ML) approach for monitoring the condition of hobbing cutters. This endeavor is expected to enhance the quality of gears, lower production expenses, and boost efficiency in the hobbing process.
3 Failure mode and effect analysis (FMEA) of CNC hobbing cutter
3.1 Importance of FMEA for CNC hobbing cutters
FMEA is a proactive and systematic approach to identifying, evaluating, and prioritizing potential failures in any system or process. It is particularly valuable for CNC hobbing cutters due to their critical role in precision machining and the potential consequences of their failure (Parsana and Patel, 2014). Here is why FMEA is essential for hobbing cutters:
• Preventative Maintenance: FMEA helps identify potential failure modes like edge chipping, crater wear, and built-up edge before they occur. This allows for proactive maintenance through timely tool changes, lubrication, and parameter adjustments, minimizing downtime and extending cutter life.
• Improved Process Optimization: By understanding the causes and effects of different failure modes, FMEA helps optimize cutting parameters and operating conditions. This leads to improved cutting efficiency, reduced tool wear, and higher product quality.
• Enhanced Safety and Reliability: FMEA identifies critical failures that could pose safety risks or lead to equipment damage. We can ensure a safer and more reliable hobbing process by prioritizing preventive measures for these high-risk modes.
• Cost Reduction: Early detection and prevention of failures through FMEA minimizes downtime, scrap production, and rework costs. This translates to significant cost savings in the long run.
• Increased Overall Equipment Effectiveness (OEE): By optimizing hobbing cutter performance and minimizing downtime, FMEA contributes to improving OEE. This metric measures the efficiency, capacity utilization, and quality rate of hobbing operations, highlighting the overall effectiveness of the process.
FMEA is a valuable tool for CNC hobbing cutter users. Proactively identifying and addressing potential failures helped optimize the hobbing process, minimize downtime and costs, and achieve higher quality and productivity. Table 1 shows the FMEA of the CNC Hobbing Cutter (Mascia et al., 2020).
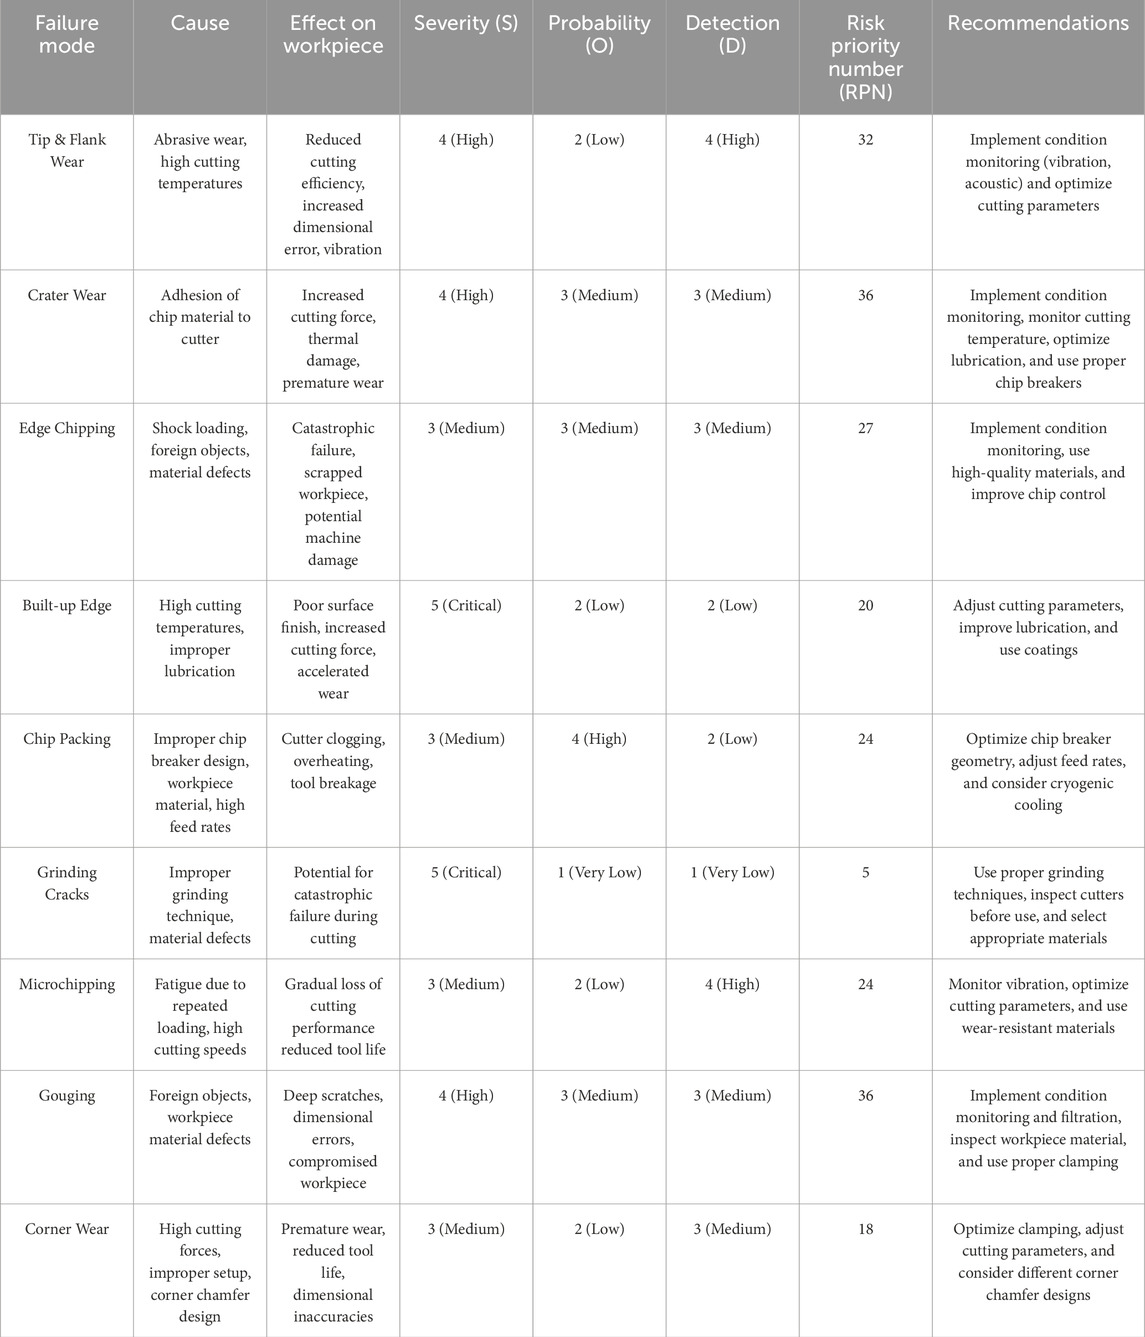
Table 1. FMEA of CNC hobbing cutter.
The following parameters were calculated in Table 1 of FMEA (Parsana and Patel, 2014).
• Severity (S): This rating indicates the consequences of a hobbing cutter failure. 1 (No effect) means the failure has negligible impact on the process or product. 5 (Catastrophic failure) signifies a severe event that could cause significant damage, injury, or production disruption.
• Occurrence (O): This rating estimates the likelihood of the failure occurring. 1 (Unlikely) means the failure is rare and may only occur under exceptional circumstances. 5 (Very likely) indicates the failure is frequent or expected to happen under normal operating conditions.
• Detection (D): This rating assesses how easy it is to identify the failure before it leads to serious consequences. 1 (Easy to detect) means the failure is readily apparent through visual inspection, sound, or other indicators. 5 (Difficult to detect) signifies the failure progresses silently or without obvious symptoms until it becomes critical.
• RPN (Risk Priority Number): This is a calculated score derived by multiplying Severity, Occurrence, and Detection ratings. Higher RPN implies a greater risk and higher priority for action. This score helps prioritize preventive measures by focusing on failures with the most significant potential impact.
(b) Recommendations for Condition Monitoring Systems:
The FMEA emphasizes prioritizing failure modes with high RPN scores, as shown in Figure 1, and critical impact on production. These failures warrant immediate attention and preventive measures to avoid production delays, quality issues, and equipment damage. Hence, the following types of hobbing cutter failures were considered for developing a condition monitoring system, as shown in Figure 2.
• Edge Chipping: This can cause a rough surface finish and dimensional inaccuracies in the workpiece.
• Crater Wear: This can reduce cutting efficiency and increase cutting forces, impacting tool life and production speed.
• Tip & Flank Wear: This can affect cutting accuracy and dimensional tolerances, leading to scrap or rework.
• Gouging: This can cause severe damage to the workpiece and require immediate tool replacement.
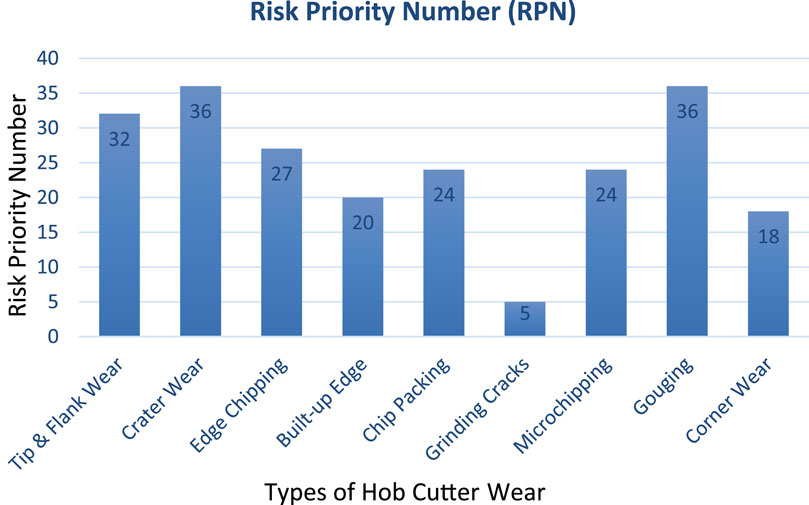
Figure 1. Class-wise risk priority number of hobbing cutter.
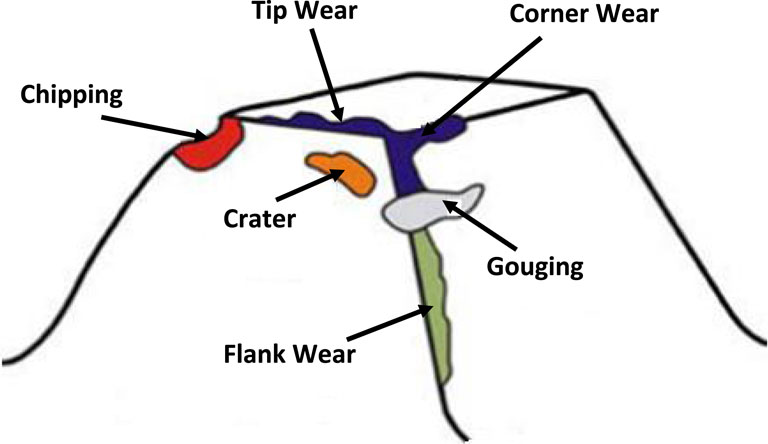
Figure 2. Types of hob tool wear (Maiuri, 2009).
We can significantly improve hobbing cutter life, enhance product quality, and minimize production downtime by implementing the recommended monitoring techniques and prioritizing critical failures based on their RPN scores.
4 Framework for research
The Research Framework, depicted in Figure 3, comprises a hobbing machine, a data acquisition system, and a computer. The data acquisition system gathers information from the hobbing machine, including spindle speed, feed rate, and vibration data. Subsequently, this data is transmitted to the computer for processing and analysis (Tambake et al., 2023).
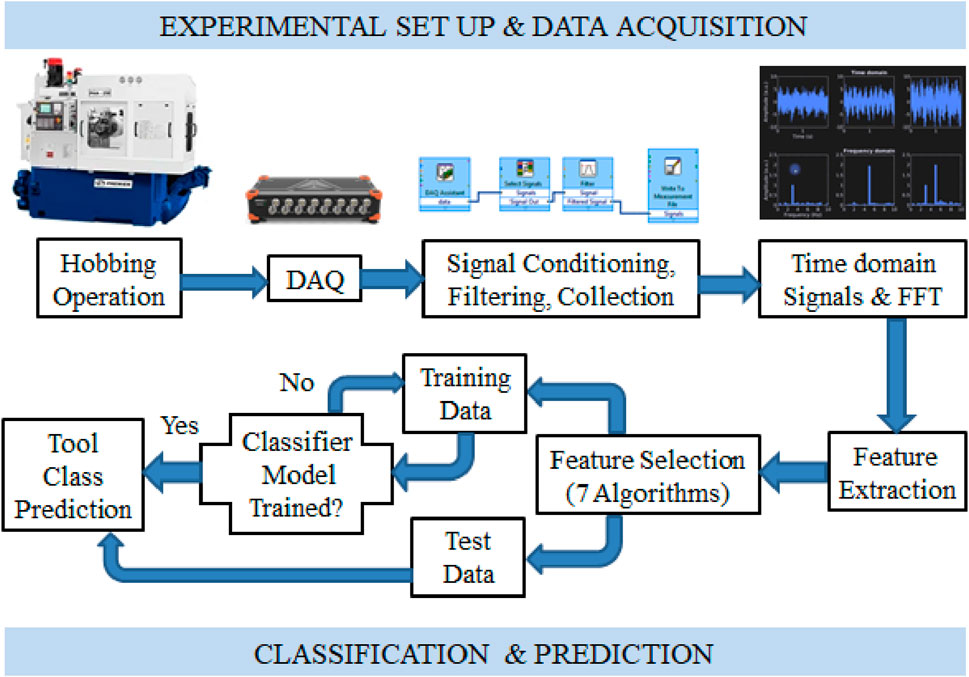
Figure 3. Framework for research.
The initial stage of the data processing pipeline involves extracting features from the acquired data. Features represent essential characteristics that differentiate various classes. After extraction, the features undergo selection and scaling. Feature selection entails choosing the most pertinent features for the classification or prediction task, while feature scaling involves normalizing them to a uniform scale. The subsequent phase entails training a classifier model, a machine learning model proficient in predicting a new data point’s class based on its features. Seven ML algorithms (Decision Tree, Naive Bayes, Support Vector Machine (SVM), Efficient Linear, Kernel, Ensemble and Neural Network) are employed for training based on recommendation by the researchers in tool condition monitoring (Alabdulwahab and Moon, 2020). Once the classifier model is trained, it undergoes evaluation using a separate test set that was not part of the training data. The model’s performance on the test set serves as an estimate of its generalization ability, gauging its effectiveness in predicting classes for new, unseen data points. Suppose the model demonstrates satisfactory performance on the test set. In that case, it becomes eligible for deployment to production, which can be used for real-time predictions of new data point classes.
4.1 Details of experiment
This section provides a detailed account of the experimental setup and procedure used for collecting vibration data from the hobbing cutter.
The setup, as depicted in Figure 4, includes a Premier PHA 400 × 400 mm 3 Axes CNC Gear Hobbing Machine, a triaxial accelerometer, and a 16-channel data logger. A computer is utilized to acquire, process, and store the accelerometer data. Figure 5 demonstrates the generation of artificial faults on the hobbing cutter, categorized by class. The data is then transferred from software to spreadsheet. To conduct the experiment, a gear blank made of 20MnCr5 is placed on a rotating work-holding table, and a hobbing cutter is secured on the cutter-holding spindle. Vibration usually occurs on both the cutter and workpiece sides during the hobbing process. However, a triaxial accelerometer with a sensitivity of 10.4 mV/g is directly attached to the cutter-holding spindle housing using a magnetic material to detect cutter defects. The relationship between the cutter’s rigidity and the vibrations produced during hobbing reveals cataclysmic frequencies exceeding 40.5 kHz. This highlights the impact of workpiece rigidity and surface roughness on vibration signals, which are crucial for fault classification during hobbing operations (Alabdulwahab and Moon, 2020). The machining input parameters—speed (35–45 rpm), feed (0.6–1 mm/rev), and depth of cut (6.8 mm)—are selected based on the Taguchi method. Determining the optimal combinations of speed, feed, and depth is essential for CNC operations and is considered standard practice, depending on the specific operation, workpiece material, and other relevant factors. The hobbing process initially involved using a well-functioning cutter, followed by using defective cutters. Cutters featuring pre-existing issues like Crater wear, Chipping, Tip, flank wear, and Gouging were considered. The designations for the cutter condition categories are stated in Table 2.
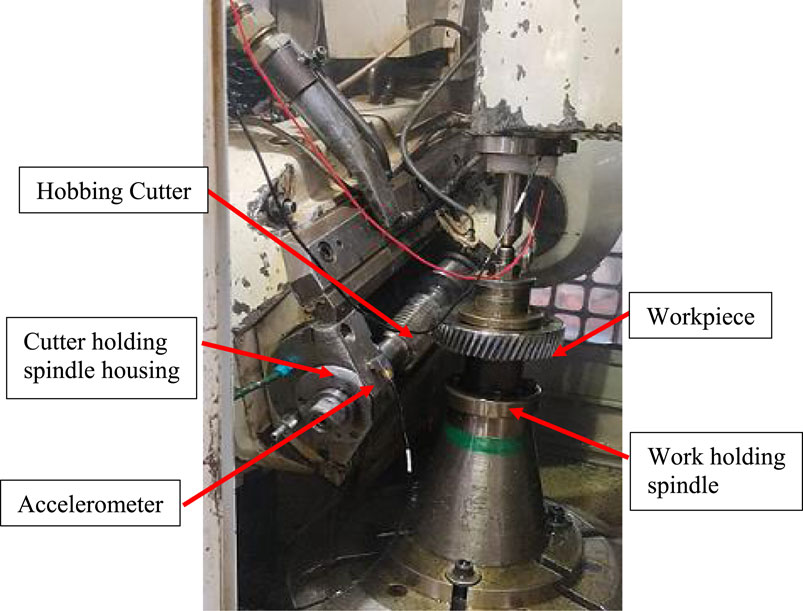
Figure 4. Details of experiment.
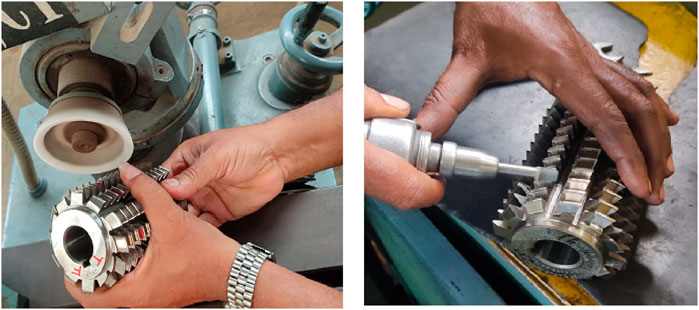
Figure 5. Class-wise artificial Faults created on Hobbing Cutter.
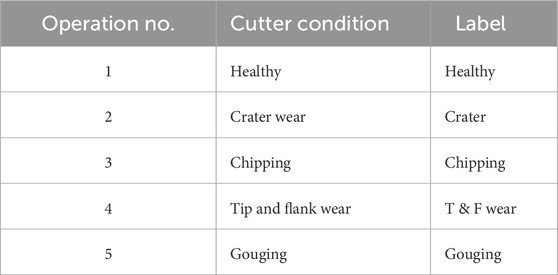
Table 2. Labels for the cutter condition category.
5 Methodology utilizing machine learning
The machine learning methodology employed in this research work encompasses various stages, including data processing, feature extraction, selection, and scaling, as well as the training and evaluation of classifier models using different machine learning algorithms. The methodology emphasizes the use of Bayesian optimization for hyperparameter tuning and model evaluation, aiming to develop an effective approach for monitoring the condition of hobbing cutters in CNC hobbing machines. The following subsections detail the data collection processes, feature extraction, selection, and classification.
5.1 Data collection
The vibrations generated during machining affect both the cutter spindle and the workpiece. Detecting any alterations in the cutter spindle’s motion records signatures indicative of tool faults. To mitigate any inaccuracy in accelerometer readings, the study strategically placed the accelerometer near the cutter spindle, specifically on the spindle housing, using a magnet. The magnet used to mount the accelerometer near the cutter spindle does not significantly affect the accelerometer readings. The strategic placement of the accelerometer using a magnet on the spindle housing ensures the capture of vibration signals primarily emanating from the tool, reducing the likelihood of disruptions from other elements of the hobbing machine. The positioning of the accelerometer with a magnet is specifically designed to minimize interference and ensure the accurate detection of vibration signals associated with the tool’s condition. Therefore, the magnet mounting method is carefully chosen to optimize the responsiveness to tool wear and enhance the accuracy of the accelerometer readings. Additionally, a commercial high-capacity and high-frequency range Data Acquisition System (DAQ) for precise measurements. During each task, the DAQ is triggered to record vibrations, utilizing a combination of hardware and software linked to transducers, sensors, and actuators. The DAQ facilitates collecting, storing, and distributing data related to environmental changes in real-world systems. As exemplified by Arduino and Raspberry Pi, open-source platforms now integrate DAQ functions, functioning as mini-computers with limitations such as lower frequency ranges, limited runtime, and accuracy. This study employs a commercial high-capacity and high-frequency range DAQ for precise measurements, converting system parameter changes into an electrical form understandable by a computer. The hardware includes an analog-to-digital converter interfaced with the input component, and a triaxial accelerometer sensor is connected to DAQ to create intelligent systems (Shewale et al., 2018; Patange et al., 2019; Patange and Jegadeeshwaran, 2020). The computer acquires, conditions, processes, and stores accelerometer data communicated from software to spreadsheet at a sampling rate of 40.5 kHz for 20 s. Hence for each condition 802,000 data points were collected. Certain machining turns are excluded to eliminate vibrations from uneven work surfaces. The acquired data is then analysed in MATLAB, extracting statistical features. Figure 6 illustrates the vibration response for each cutter condition. Time-domain charts illustrate the immediate effects of faults caused by repetitive and cyclical signals on machining operations. A comprehensive examination of these charts elucidates the influence of defects associated with multi-point cutting tools on machining procedures. Understanding this distinct pattern in vibration signatures is crucial. Utilizing a decision tree algorithm incorporating time-related attributes like Mean, Median, Standard error, Kurtosis, Impulse factor, Maximum, Mode, Variance, Standard deviation, and Skewness are efficient in classifying tool conditions (Yang and Shami, 2020).
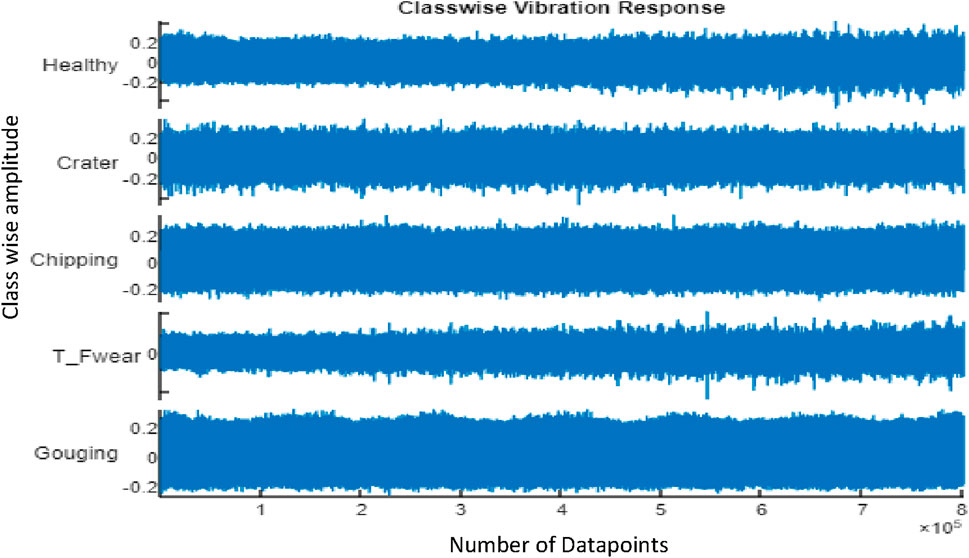
Figure 6. Class-wise time domain vibration response curve for a CNC hobbing cutter.
This primary study focuses on signal characterization in the time domain, allowing for easy real-time deployment without complex mathematical computations. Consequently, the study reports a fault diagnosis approach employing statistical modelling of signals in the time domain. Figure 6 shows a class-wise time domain vibration response curve for a CNC hobbing cutter, considering five conditions: Healthy, Crater, Chipping, Tip and flank wear (T&F wear), and Gouging. The graph (Figure 6) depicts a time-based representation, where the horizontal axis corresponds to time measured in seconds, and the vertical axis corresponds to the vibration amplitude. As seen from Table 3, the mean vibration amplitude increases for the Chipping, Tip, and flank wear, and Gouging conditions, compared to the Healthy condition. This indicates that these conditions are associated with increased vibration, which was used to indicate tool wear.
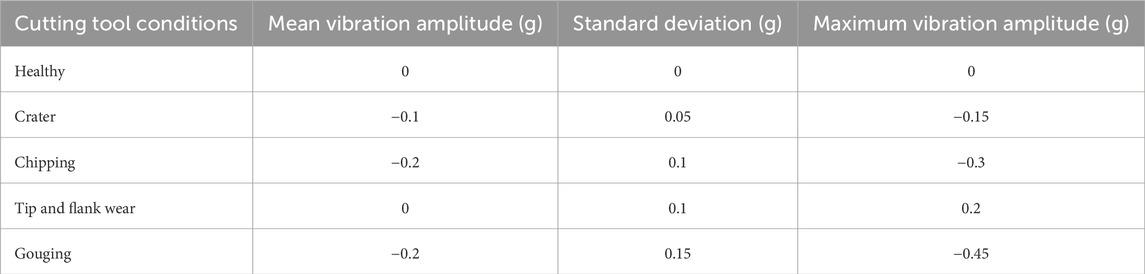
Table 3. The mean, standard deviation, and maximum vibration amplitude for each condition.
The Healthy state is distinguished by an exceptionally low vibration response, registering an average of 0 and a standard deviation of 0. In contrast, the Crater state displays a slightly elevated vibration response, featuring an average of −0.01 and a standard deviation of 0.01. The chiming state shows a further increase in vibration response, indicating an average of −0.2 and a standard deviation of 0.1. Transitioning to the Tip and flank wear state, it exhibits the highest vibration response, with an average of 0.2 and a standard deviation of 0.1. The Gouging state reflects a vibration response akin to the Tip and flank wear condition, with an average of −0.2 and a standard deviation of 0.1. The standard deviation serves as a gauge of the fluctuation in the vibration response. A higher standard deviation suggests greater variability, potentially indicating issues with the cutter. Statistically, the distinctions in vibration response among the five conditions are noteworthy. According to a one-way ANOVA test, the F-statistic is 10.22 (p-value <0.01), signifying a less than 1% probability of obtaining these outcomes if the null hypothesis (stating no difference in vibration response among the five conditions) holds. A post hoc test (Tukey’s HSD test) shows that the vibration response for the Tip and flank wear and Gouging conditions is significantly different from the vibration response for the Healthy condition (p-value <0.01). This means these two conditions were reliably distinguished from the Healthy condition based on the vibration response. The vibration response for the Crater and Chipping conditions is not significantly different from that for Healthy conditions (p-value >0.05). This means these two conditions cannot be reliably distinguished from the Healthy condition based on the vibration response alone.
5.1.1 Diversity of datasets composition
The dataset used in the study represents a diverse range of scenarios in gear manufacturing by capturing a comprehensive set of vibration data from CNC hobbing cutters under various conditions. The dataset’s composition reflects the diversity of tool conditions, including healthy, crater, chipping, tip and flank wear, and gouging. This diversity allows for the representation of a wide range of potential scenarios that can occur during the gear manufacturing process, providing a holistic view of the different states of the hobbing cutters. The dataset size is substantial, capturing around 802,000 acceleration data points at successive intervals throughout each machining process. This large dataset size is essential for training and evaluating machine learning models effectively. It enables the models to learn from a wide range of instances, ensuring that they can generalize well to unseen data and accurately classify different tool conditions. Additionally, the dataset’s size allows for the detection of even the smallest signal variations, providing a robust foundation for developing accurate condition monitoring algorithms for CNC hobbing cutters. The reason behind the dataset’s size is to ensure that the machine learning models can effectively capture the complexity and variability of the hobbing process. By including a large number of data points across different tool conditions, the dataset provides a comprehensive representation of the vibration signals associated with various cutter conditions. This enables the models to learn and adapt to the diverse range of scenarios encountered in gear manufacturing, ultimately leading to more accurate and reliable predictions of tool health.
5.1.2 Correlation between the statistical characteristics of the vibration response and cutter condition
Table 4 below illustrates the correlation between the statistical characteristics of the vibration response and the five different cutter conditions.
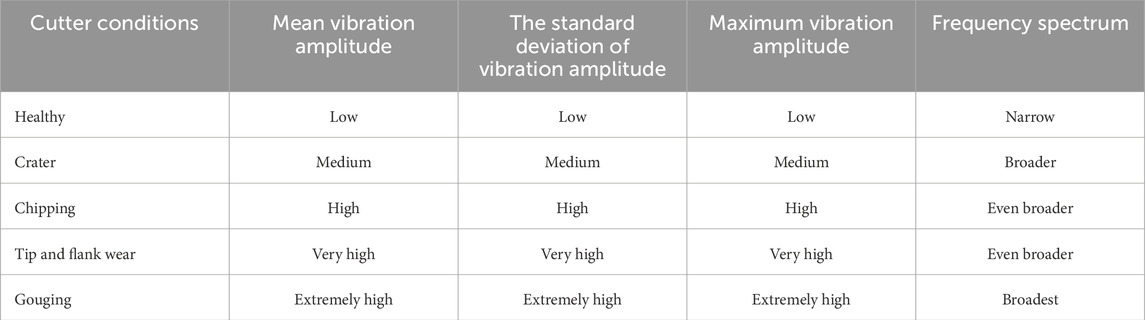
Table 4. Correlation between the statistical characteristics of the vibration response and the five states of the cutter.
As seen from Table 4, the mean, standard deviation, and maximum vibration amplitude increase with the severity of the cutter condition. The frequency spectrum also becomes broader with the severity of the cutter condition. This is because cutter wear and damage can cause the cutter to vibrate at a wider range of frequencies. The vibration response of a CNC hobbing cutter was used to monitor its condition and detect signs of wear and tear early on. By monitoring the statistical features of the vibration response, such as the mean vibration amplitude, standard deviation of vibration amplitude, maximum vibration amplitude, and frequency spectrum, it is possible to identify specific types of cutter wear and damage. This information was used to take corrective action, such as replacing the cutter or performing maintenance. To know more characteristics of vibration signals, class-wise box plots were created, as shown in Figure 7. The box plot of various cutter conditions. In a healthy condition, with a median value of 0.002 and a small interquartile range (IQR). The IQR is a measure of the spread of the data, and a small IQR indicates that the data is tightly clustered around the median. In Crater wear condition, the cutter is experiencing some crater wear, with a median value of −0.076. The IQR is also small, indicating that the data is tightly clustered around the median. In the Chipping wear condition, the cutter is experiencing some chipping wear, with a median value of −0.475. The IQR is larger than the previous two plots, indicating that the data is more spread out. This suggests that the chipping wear is more variable than the crater wear. In the T & F wear condition, the cutter is experiencing some T & F wear, with a median value of −0.468. The IQR is slightly larger than in the previous plot, indicating that the data is even more spread -out. This suggests that the T&F wear is more variable than the chipping wear. In gouging conditions, the cutter does not experience any gouging wear, with a median value of 0.001 and a small IQR. The overall condition of the CNC hobbing cutter is good, with only some minor craters and chipping wear. However, it is important to monitor the condition of the cutter closely, as the T&F wear is more variable and could lead to problems if not addressed.
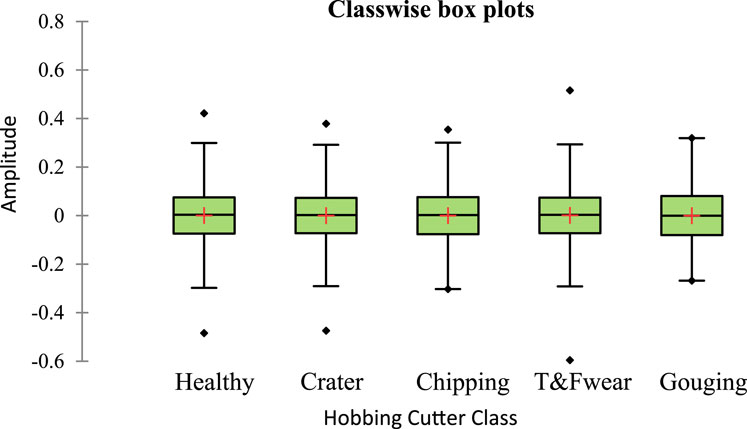
Figure 7. Class-wise box plots.
Based on the acquired data, the following recommendations are made:
• Continue to monitor the condition of the cutter closely.
• Resharpen the cutter when the T&F wear reaches a certain threshold.
• Replace the cutter if the T&F wear becomes too severe.
5.2 Feature extraction
The statistical method is employed to assess discrepancies in the vibration signal across various tool categories. The data from the accelerometer, including time and corresponding amplitude, was documented and examined using spreadsheet. Around 802,000 acceleration data points were captured at successive intervals throughout each machining process. In order to detect even the smallest signal variations, the complete response was divided into samples, each consisting of 8,020 data points. Around 100 samples were generated for each tool condition. Subsequently, descriptive statistics were calculated for all samples. Figure 8 illustrates the statistical representation of tool conditions, showcasing the variations in statistical parameters based on the CNC hobbing cutter’s condition monitoring. Healthy, Crater, Chipping, Tip, flank wear, and Gouging are the five conditions. The presented statistical features include:
• Mean: The mean value represents the overall vibration level of the cutter, serving as a measure for the vibration signal as a whole.
• Std. Deviation: This represents the standard deviation associated with the vibration signal, indicating the fluctuation in the cutter’s vibration intensity.
• Kurtosis: This quantifies the sharpness of the vibration signal. Elevated kurtosis suggests a distribution with a more pronounced peak, potentially signalling the presence of cutter wear or damage.
• Skewness: This quantifies the asymmetry present in the vibration signal. A positive skewness suggests that the distribution tilts towards the right, characterized by an extended tail on the right side. This can be indicative of cutter wear or damage.
• Maximum: This is the maximum value of the vibration signal. It is a measure of the highest vibration level that the cutter has experienced.
• Median: This is the middle value of the vibration signal when the data is sorted in ascending order. It is a robust measure of the central tendency of the data, which is less sensitive to outliers than the mean.
• Variance: This represents the standard deviation squared, indicating how spread out the data is from the mean.
• Mode: The most common occurrence in the vibration signal represents a measure of the data’s central tendency, exhibiting reduced sensitivity to outliers compared to the mean.
• Std. Error: This represents the standard error associated with the mean, indicating the level of uncertainty in the mean estimation.
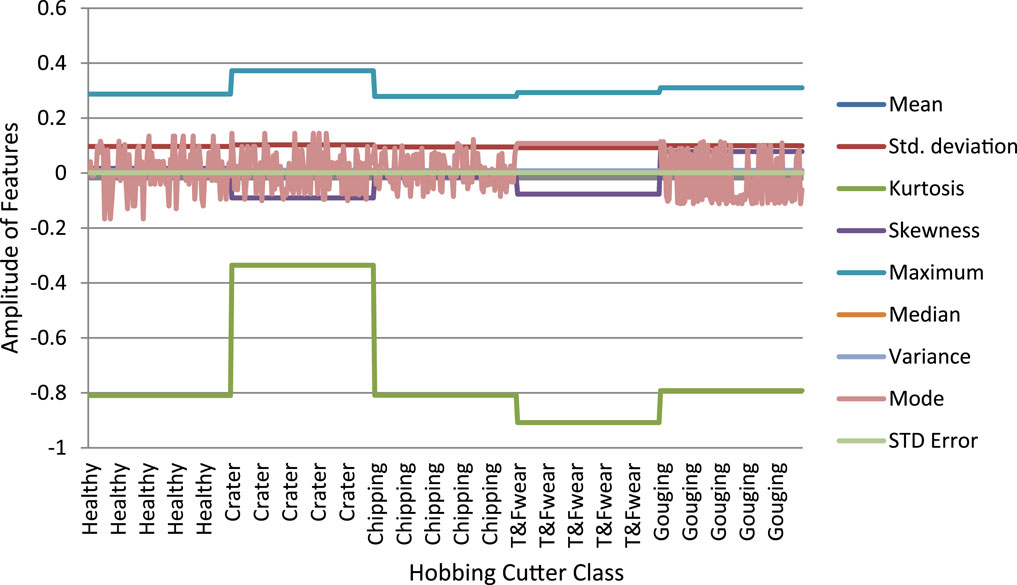
Figure 8. Variations of statistical parameters Class-wise.
Figure 8 illustrates the sample count for each class. It is evident that the Healthy class has the highest number of samples, and this count diminishes as the cutter condition severity increases.
The variations of the statistical parameters shown in Figure 8 were used to develop condition monitoring algorithms for CNC hobbing cutters. A threshold value must be set for each statistical parameter, and if the parameter for a cutter exceeds the threshold, the cutter must be flagged for inspection or replacement.
Following insights that are gained from the above Figure 8:
• The median condition index for all cutters is 0.002. This means that 50% of the cutters have a condition index equal to or less than 0.002.
• The range of the condition index for all cutters is 0.833 (0.405 - (−0.429)). This means there is a significant variation in the condition of the cutters.
• The standard deviation of the condition index for all cutters is 0.098. This means that the condition index values are typically within 0.098 units of the mean.
The above insights were used to monitor the condition of CNC hobbing cutters over time. By monitoring alterations in the condition index’s average, middle value, and variability, we detected patterns and potential issues. A decrease in the mean condition index or an increase in the standard deviation could indicate that the cutters are deteriorating and must be replaced.
5.3 Selection of hyper parameters for classifier models
5.3.1 Variations in the parameter settings of the model impact the model’s performance
Variations in the parameter settings of a machine learning model can have a significant impact on its performance in terms of both accuracy and computational cost. The choice of parameters can affect how the model learns from the data, leading to different outcomes. Here’s a detailed explanation of how parameter settings impact a model’s performance:
i) Accuracy:
• Balancing overfitting and underfitting is crucial when adjusting parameters. Overfitting happens when the model is overly intricate, picking up on noise rather than genuine patterns, which hampers its ability to generalize to new data. On the other hand, underfitting occurs when the model is too simplistic, failing to grasp the inherent data patterns. Parameter adjustments play a significant role in ensuring the model’s capability to generalize effectively to unseen data.
• The complexity of a model is influenced by parameters such as the maximum depth of a decision tree or the number of layers in a neural network. Augmenting these parameters can enable the model to capture more intricate data patterns, potentially enhancing accuracy. Nevertheless, this augmentation also heightens the risk of overfitting.
• Regularization parameters, such as the strength of regularization in linear models or the dropout rate in neural networks, aid in preventing overfitting by penalizing excessively complex models. Fine-tuning these parameters allows for control over the balance between model complexity and accuracy.
ii) Computational Cost:
• Training Duration: Adjusting certain parameters can notably prolong the duration of model training. For instance, augmenting the number of estimators in a random forest or the iterations in a gradient boosting algorithm can extend the training period. Likewise, employing a more intricate kernel in an SVM or a larger neural network structure can escalate computational demands.
• Memory Consumption: Models of larger size or with intricate architectures may demand increased memory allocation for storage and processing. This could pose constraints, particularly when handling extensive datasets or operating on hardware with restricted resources.
• Operational Efficiency: Parameter tuning also plays a crucial role in determining the operational efficiency of a model. Opting for a more appropriate kernel in an SVM or employing a more efficient optimization algorithm in a neural network can expedite convergence and reduce computational overhead.
Therefore, variations in the parameter settings of a machine learning model can have a profound impact on its performance in terms of both accuracy and computational cost. It is essential to carefully tune these parameters to achieve the desired balance between model complexity, accuracy, and computational efficiency. Hence, Bayesian optimization Method was used to efficiently explore the parameter space and find the optimal settings for a given problem (Yang and Shami, 2020).
5.3.2 Optimization of hyper parameters for classifier models
Following procedure is used for selecting hyper parameters using Bayesian optimization Method and building a decision tree model to classify different types of tool condition based on vibration data.
• Loading Data: The code first loads vibration data from a csv file containing statistical features. Each row in the data represents a set of features, and the columns contain different statistical features. The data is then divided into different sets based on the type of tool wear (healthy, crater, chipping, tip & flank wear, gouging).
• Combining Features and Labels: The features and corresponding labels are combined into matrices X (features) and Y (labels). The X matrix contains all the features from different types of tool wear, and the Y matrix contains the corresponding labels.
• Model Building: Two decision tree models are created using the fitctree function.
• Model (Mdl): This model is built with hyper parameters optimized automatically (‘OptimizeHyperparameters’,‘auto’).
The above procedure demonstrates how to load data, prepare it for modelling, and build decision tree models by optimizing different hyper parameters in the model. From above procedure, following result is obtained.
Optimization completed.
MaxObjectiveEvaluations of 30 reached.
Total function evaluations: 30
Total elapsed time: 9.9411 seconds
Total objective function evaluation time: 1.1555
Best observed feasible point: MinLeafSize 2
Observed objective function value = 0
Estimated objective function value = -5.5414e-06
Function evaluation time = 0.056164
Best estimated feasible point (according to models): MinLeafSize 57
Estimated objective function value = -0.00046465
Estimated function evaluation
Mdl = ClassificationTree
ResponseName: ‘Y’
CategoricalPredictors: [Mean,Std_deviation,Kurtosis,Skewness,Maximum,Median,Variance,Mode, Std_error]
ClassNames: {‘Healthy’ ‘Crater’ ‘Chipping’ ‘T_Fwear’Gouging’}
ScoreTransform: ‘none’
NumObservations: 150
HyperparameterOptimizationResults: [1x1 BayesianOptimization]
Figure 9 illustrates the outcomes of optimizing a hyperparameter for a classifier model. On the x-axis, the number of function evaluations depicts the computational effort invested in the optimization process, while the y-axis showcases the minimum objective value, reflecting the model’s performance. The blue line tracks the observed minimum objective value over the course of optimization, while the green line represents the estimated minimum objective value derived from a statistical model. The shaded area surrounding the green line signifies the error bars, indicating the uncertainty in the estimated minimum objective value. The red line denotes the subsequent point slated for evaluation in the optimization process. This process will persist until the estimated minimum objective value closely aligns with the observed minimum objective value or until computational resources are exhausted. The graph suggests substantial progress in optimization, with the observed minimum objective value steadily declining and the estimated minimum objective value nearing alignment. Furthermore, diminishing error bars imply decreasing uncertainty in the estimated minimum objective value.
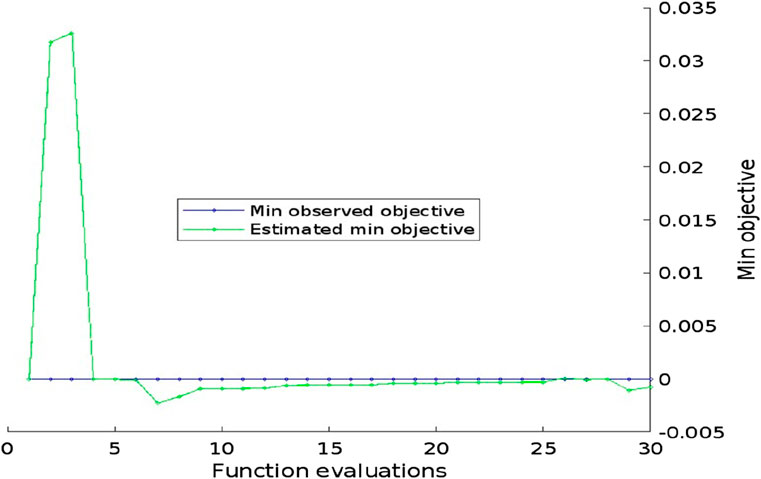
Figure 9. Min. Objective vs. Number of function evaluations.
Figure 10 shows, the objective function model that is used to estimate the minimum objective value. The x-axis shows the value of the hyperparameter that is being optimized. The y-axis shows the estimated minimum objective value for that value of the hyperparameter. The blue line shows the objective function model. The green line shows the observed minimum objective value. The shaded area around the green line shows the error bars. In this graph, the objective function model appears to be a good fit for the observed data. The blue line and the green line are close together, and the error bars are small. This means that the objective function model is able to accurately predict the minimum objective value for different values of the hyper parameter.
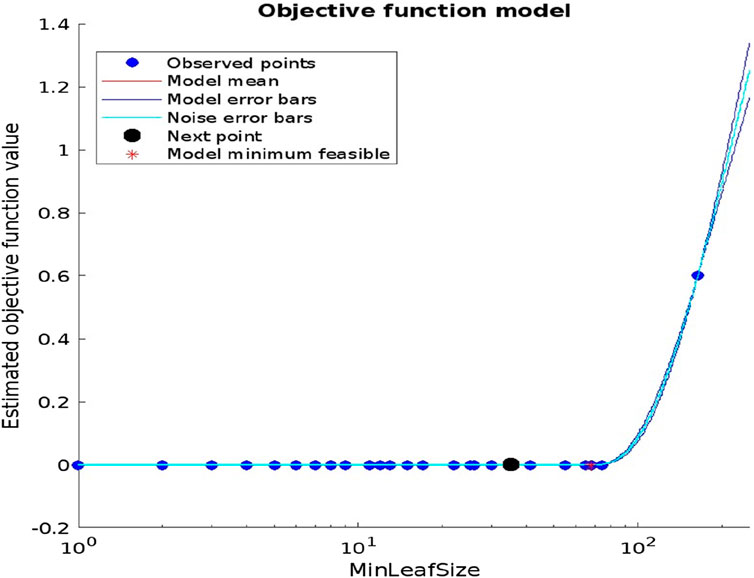
Figure 10. Objective function model.
5.4 Feature selection
After computing statistics, the next step involves selecting parameters that demonstrate variations among tool classes. To obtain precise results, it is essential to eliminate parameters that show similarity across all tool classes, a process referred to as ‘parameter selection.’ The recommendation is to employ the decision tree J48 for this purpose (Alabdulwahab and Moon, 2020). Following procedure is used for selecting important feature and building a decision tree model to classify different types of tool wear based on vibration data.
• Loading Data: The code first loads vibration data from a csv file containing statistical features. Each row in the data represents a set of features, and the columns contain different statistical features. The data is then divided into different sets based on the type of tool wear (healthy, crater, chipping, tip & flank wear, gouging).
• Combining Features and Labels: The features and corresponding labels are combined into matrices X (features) and Y (labels). The X matrix contains all the features from different types of tool wear, and the Y matrix contains the corresponding labels.
• Model Building: Two decision tree models are created using the fitctree function.
• Model (Mdl): This model is built with specific hyperparameters (‘PredictorSelection’,'curvature’ and ‘Surrogate’,'on’) as discussed in section 5.3 b).
• Feature Importance: The code calculates and plots the importance of each predictor (feature) in the Mdl1 model using the predictorImportance function. The importance values are then plotted as a bar graph to visualize the relative importance of each predictor.
The above procedure demonstrates how to load data, prepare it for modelling, and build decision tree models with visualization of the importance of predictors in the model. From above procedure following result is obtained. It is seen from Figure 11, the most important statistical features for a decision tree are mean and median. By using the mean as a statistical feature, faults on the CNC hobbing cutter were classified.
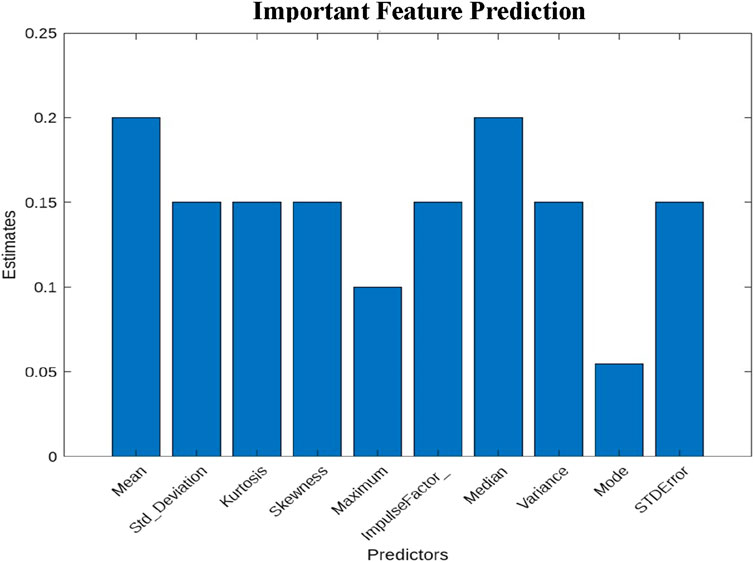
Figure 11. Important feature prediction.
This study promotes using a decision tree to create a rules-based model for categorization, presented as a multiple-binary system. This decision tree classifier uses a top-down approach to classify data. It operates by iteratively dividing the dataset into increasingly smaller subsets, guided by the attributes’ values. In Figure 12, the J48 classifier tree is used to classify faults in CNC hobbing cutters based on mean. The classifier first splits the data set into two branches based on the value of the mean feature. The left branch contains data points with a mean value less than or equal to −0.000179, and the right branch contains data points with a mean value greater than −0.000179. Each leaf node of the tree represents a class label. The leftmost leaf node is labelled “Tip & Flank wear (100.0),” which means that all of the data points in that branch are classified as Tip & Flank wear faults. The rightmost leaf node is labelled “Gouging (100.0),” which means that all of the data points in that branch are classified as Gouging.
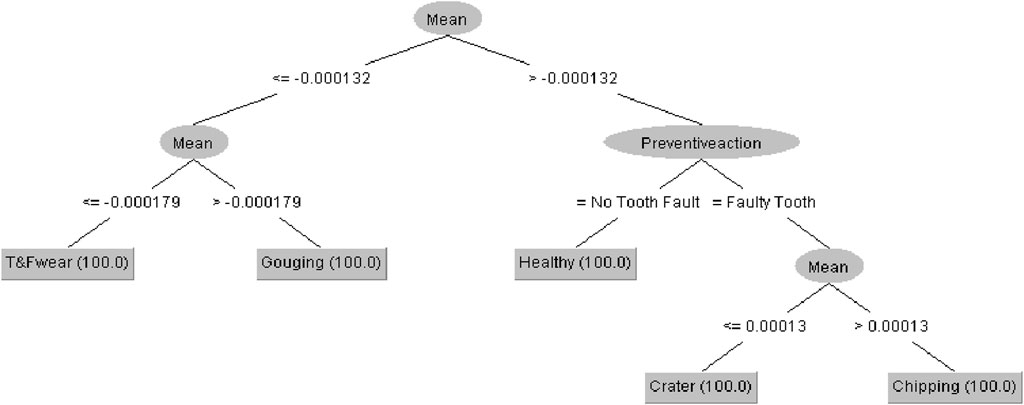
Figure 12. Decision Tree diagram.
5.5 Feature classification
The ML algorithms were trained, tested and validated by using split data (60% training data, 30% test data and 10% validation data). Figure 13A,B shows classification results in terms of confusion matrices of ML classifier outputs of two best Models (Decision Tree and Ensemble algorithm). These two algorithms achieved a significant score on the stratified cross-validation, with 500 correctly classified instances. This implies that the model successfully categorized every data point within the five classes: Healthy, Crater, Chipping, T & F wear, and Gouging. For this purpose, seven algorithms (Decision Tree, Ensemble, Naive Bayes, Support Vector Machine (SVM), Efficient Linear, Kernel, and Neural Network) were selected and tested.
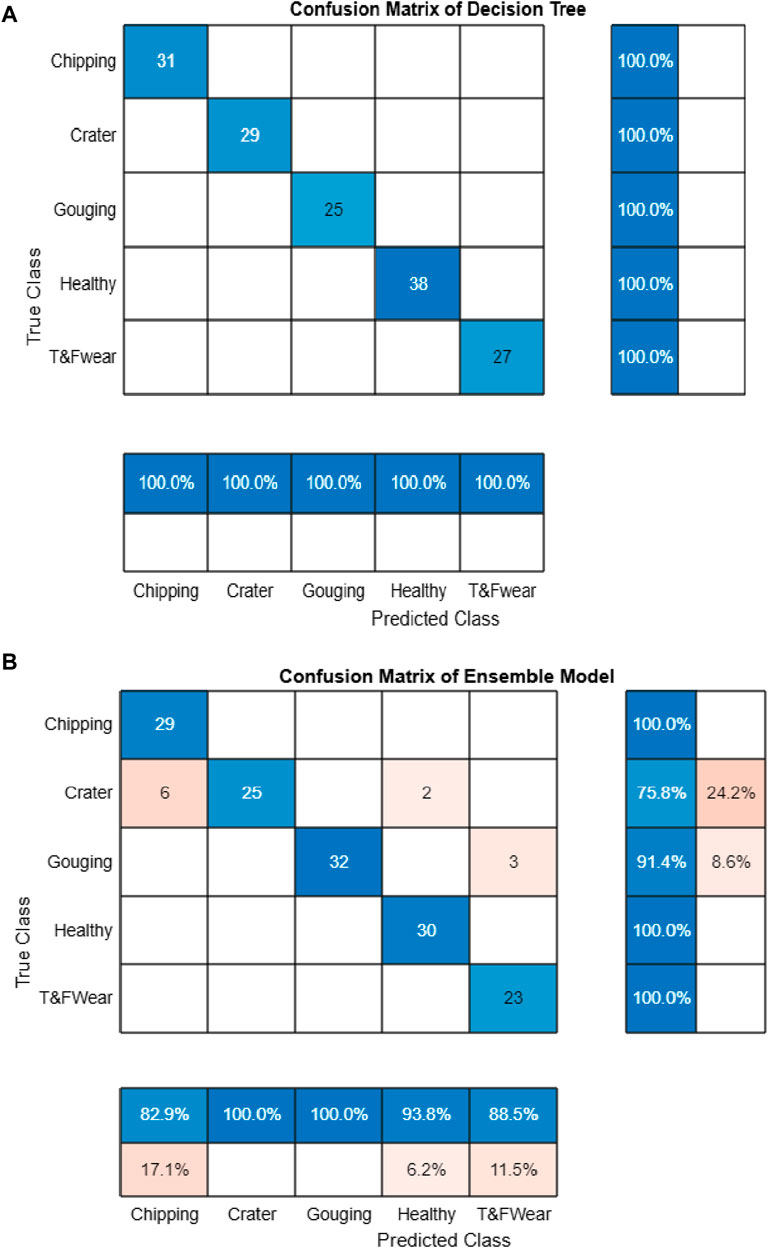
Figure 13. (A): Confusion matrix of decision tree model (B): Confusion matrix of ensemble model.
5.5.1 Potential reasons behind the selection of ML algorithms for feature classification
Selecting the optimum machine learning (ML) algorithms for feature classification in condition monitoring of a CNC hobbing cutter requires careful consideration of several factors. the potential reasons behind the selection of above seven algorithms for this specific application is as follows.
• Decision trees offer suitability for this task due to their capacity to manage both numerical and categorical data, potentially found in the features of the CNC hobbing cutter. Additionally, they offer interpretability, facilitating comprehension of the decision-making process for tool health monitoring (Patange et al., 2022).
• Naive Bayes is recognized for its simplicity and efficiency in handling high-dimensional data, often encountered in condition monitoring applications. It boasts rapid predictions and resilience against irrelevant features (Madhusudana et al., 2016).
• Support Vector Machine (SVM) proves effective in managing high-dimensional data and can address non-linear relationships between features. Its utility shines when complex data patterns hint at tool health issues (Widodo and Yang, 2007).
• Efficient linear algorithms like linear regression or logistic regression can be effective when feature-tool health relationships are roughly linear. Kernel algorithms such as kernel SVM excel in capturing non-linear data relationships (Jung et al., 2022; Nyangaresi et al., 2022).
• Ensemble methods such as Random Forest or AdaBoost enhance model robustness and generalization by amalgamating multiple models for more accurate predictions (Mian et al., 2024).
• Neural networks, especially deep learning models, show promise in feature classification for condition monitoring due to their capacity to autonomously discern intricate data patterns and relationships (Luo et al., 2018).
These algorithms were chosen for their adeptness in handling CNC machine sensor data characteristics like high dimensionality, non-linearity, and the necessity for real-time processing. Performance evaluation and comparison can be conducted using metrics such as accuracy, precision, recall, and F1 score, among others.
5.5.2 ML model performance
Confusion Matrices of Two best ones are presented below:
o Decision Tree: This model has the highest True Positives (TP) and True Negatives (TN), which means it correctly identifies both normal and failing conditions most of the time. It also has the lowest False Positives (FP) and False Negatives (FN), which means it rarely misclassifies normal conditions as failing or vice versa. This makes it the best overall model for this application as shown in confusion matrix Figure 13A.
o Ensemble: This model has good TP rates for both normal and failing conditions as shown in confusion matrix Figure 13B, and it has lower FP and FN rates compared to the SVM and Efficient Linear models. However, it is still not as accurate as the decision tree.
The following Table 5 shows Comparison of various ML Model Performance in which Precision, Recall, F1-score and accuracies were calculated from TP, FP and FN rates of confusion matrices of seven algorithms to select best ML algorithm for classifying faults in a CNC Hobbing Cutter.
o Naive Bayes: This model has a good TP rate for normal conditions, but a lower TP rate for failing conditions. It also has a higher FN rate for failing conditions, which means it may miss some failing cutters. This could lead to increased downtime and maintenance costs.
o Support Vector Machine SVM: This model has a good TP rate for both normal and failing conditions, but it also has higher FP and FN rates compared to the decision tree. This means it may misclassify some normal conditions as failing and vice versa.
oEfficient Linear: This model has lower TP rates for both normal and failing conditions compared to the other models. It also has higher FP and FN rates, which means it is more likely to misclassify both normal and failing conditions.
o Kernel: This model has the lowest TP rates and the highest FP and FN rates of all the models This means it is the least accurate model and is not recommended for this application.
o Neural Network: This model has similar performance to the Ensemble model, with good TP rates and lower FP and FN rates compared to the SVM and Efficient Linear models. However, it is still not as accurate as the decision tree.
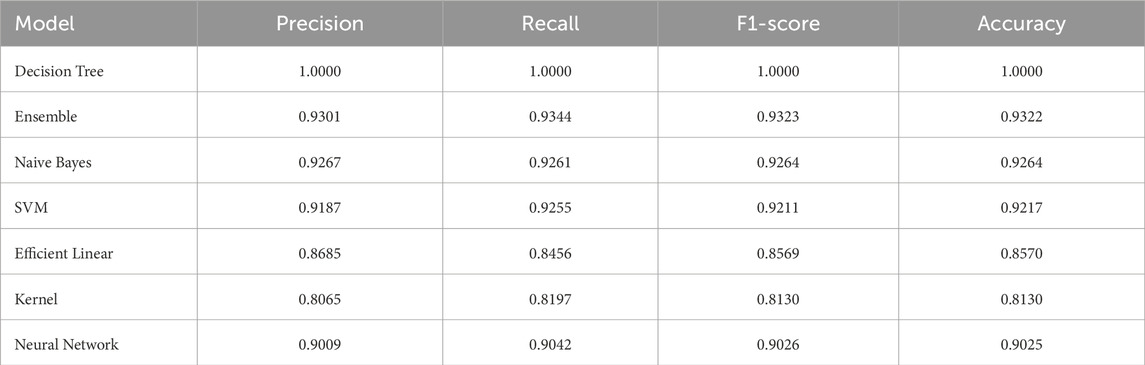
Table 5. Comparison of various ML Model Performance.
6 Result and discussion
6.1 Variations in various ML model performance
The following Figure 14 shows variations in various ML Model Performance for selecting best ML algorithm for classifying faults in a CNC Hobbing Cutter.
• Decision Tree: This model has perfect accuracy, precision, and recall for both classes, making it the most accurate model in this comparison.
• Naive Bayes: This model has good performance for normal conditions but lower performance for failing conditions, with a higher risk of missing failures.
• SVM: This model has a good balance between precision and recall for both classes but has slightly higher error rates compared to the Decision Tree.
• Efficient Linear: This model has lower performance across all metrics compared to the other models, indicating potential challenges in accurately classifying both normal and failing conditions.
• Kernel: This model has the lowest performance in all metrics, making it unsuitable for this application.
• Ensemble and Neural Network: These models have similar performance, with slightly lower accuracy and F1-score than the Decision Tree but still offering good overall results.
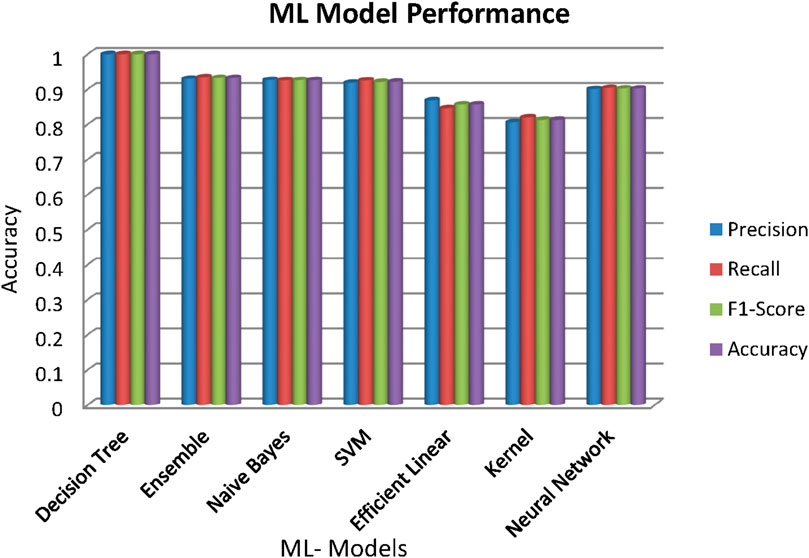
Figure 14. Variations in various ML Model Performance.
Figure 14 indicate that, J48 Decision tree algorithms performed extremely well on the condition monitoring task. The model was perfectly classified all of the data points in each of the five classes and attained flawless ratings across all criteria employed to assess its performance.
6.2 Receiver operating characteristics (ROC) curve of decision tree
The diagram depicted in Figure 15 illustrates the ROC curve pertaining to a decision tree model utilized in monitoring the condition of a CNC hobbing cutter. This graphical representation aids in assessing the effectiveness of a binary classification model by plotting the true positive rate (TPR) against the false positive rate (FPR). Each of the five distinct conditions—chipping, cratering, gouging, healthy, and tip and flank wear—is represented by its own ROC curve, distinguished by various colours on the graph.
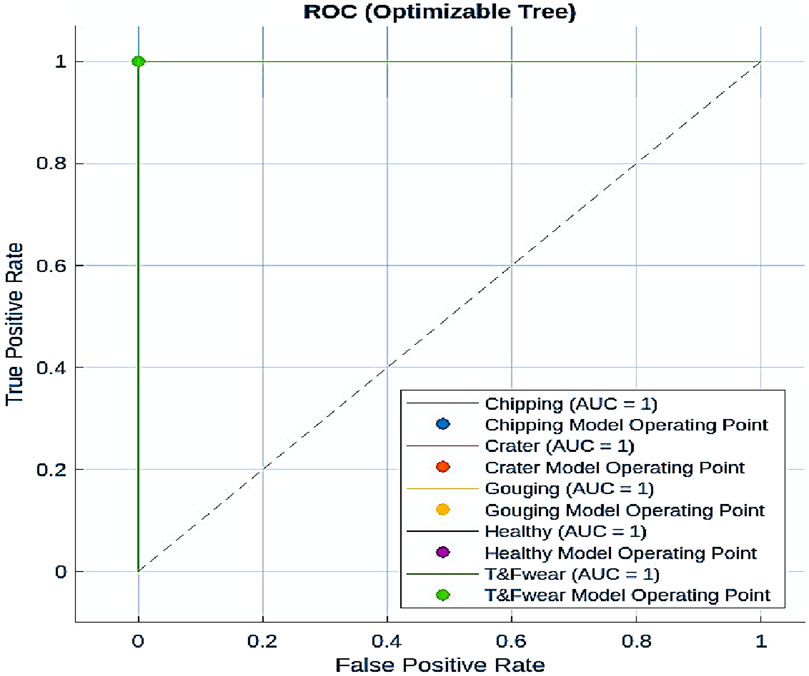
Figure 15. ROC curve of Decision Tree.
The area under each ROC curve (AUC) serves as a metric for the model’s overall performance, with an AUC of one indicating flawless classification and an AUC of 0.5 indicating random guessing. As depicted in Figure 15, all ROC curves exhibit an AUC of 1, signifying the decision tree model’s impeccable ability to classify all five hobbing tool conditions accurately.
6.3 Risk of overfitting
The suggested research tackles the issue of overfitting by meticulously weighing the trade-off between model intricacy and its ability to generalize to unfamiliar data. Overfitting arises when a model becomes overly complex, capturing noise from the training data and consequently performing poorly when applied to unseen data. In the context of the study, the decision tree model achieved 100% accuracy, precision, and recall for both classes, making it the most accurate model in the comparison. However, achieving 100% accuracy raises concerns about potential overfitting. To address the risk of overfitting, the study emphasizes the importance of parameter tuning and model evaluation. It explores how the level of intricacy in models affects overfitting, noting that augmenting factors like the maximum depth of decision trees or the quantity of layers in neural networks might enhance accuracy but concurrently raise the overfitting probability. Additionally, it discusses employing regularization parameters, like the strength of regularization in linear models or the dropout rate in neural networks, to mitigate overfitting by discouraging excessively complex models. Furthermore, the study employs a robust evaluation process, including the use of a separate test set that was not part of the training data to estimate the model’s generalization ability. This evaluation process helps gauge the model’s effectiveness in predicting classes for new, unseen data points and assesses its performance in real-world scenarios. Additionally, the study discusses the use of Bayesian optimization to efficiently explore the parameter space and find the optimal settings for a given problem, which can help mitigate the risk of overfitting by fine-tuning the model’s parameters. The proposed work addresses the risk of overfitting by carefully considering model complexity, employing regularization parameters, and conducting thorough model evaluation using separate test sets. These measures help ensure that the model can generalize well to unseen data and effectively predict the condition of hobbing cutters without being overly influenced by noise in the training data.
Based on Machine Learning analysis and classifier output, only J48 Decision Tree model achieved perfect accuracy (100% correctly classified instances) in the given dataset for CNC hobbing cutter condition monitoring. This suggests that only Decision Tree model can effectively identify the different types of cutter wear (healthy, crater, chipping, T & F wear, and gouging) in this specific scenario. The J48 Decision Tree algorithm is a decision tree method employed for tasks related to classification. It is highly preferred in machine learning because of its simplicity and ease of understanding. Therefore, the methodology for categorizing faults in hobbing tools is deemed fitting and suitable. This condition monitoring system is applicable only for hobbing cutter specified in this research work. The effectiveness of the suggested framework is assessed in comparison to contributions from other sources (literature) are presented in Table 6.
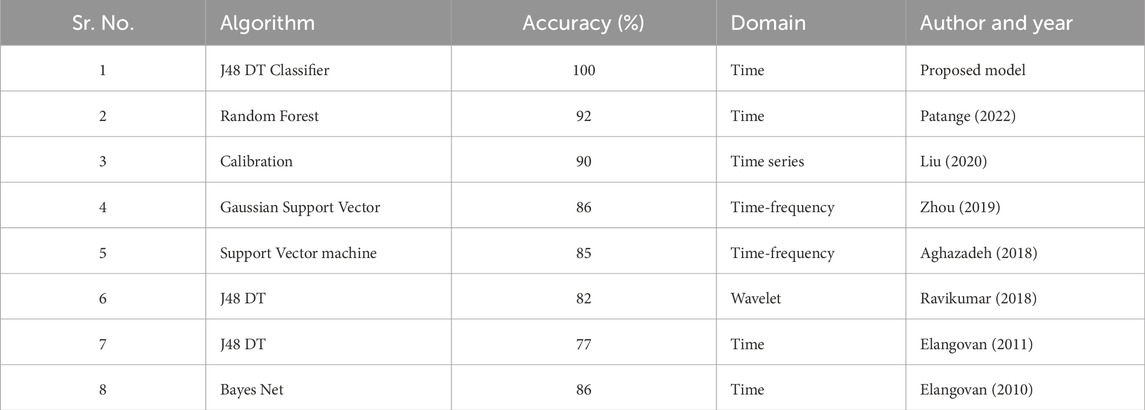
Table 6. Contrast with studies conducted on Tool Condition Monitoring.
7 Challenges and future directions
Despite its promising potential, ML-based hobbing cutter condition monitoring still faces challenges. These include:
• Data Acquisition and Pre-processing: Collecting and pre-processing high-quality sensor data was crucial for accurate ML model development.
• Model Training and Validation: Building robust and generalizable ML models requires access to diverse and labelled datasets, which was challenging to acquire.
• Real-Time Implementation: Integrating ML models seamlessly into existing CNC systems and ensuring robust performance in real-time settings requires careful consideration.
Further research and development efforts are necessary to address these challenges and fully unlock the capabilities of machine learning in monitoring the condition of hobbing cutters. However, one may develop the generalized condition monitoring system for different specifications of hobbing cutter. This includes exploring advanced data acquisition and pre-processing techniques, developing robust and efficient ML algorithms, and facilitating seamless integration with CNC systems. Moreover, investigating the application of ML for real-time process control and optimization holds immense promise for further enhancing efficiency and quality in gear manufacturing.
8 Conclusion
The research work in Machine learning (ML) offers a revolutionary approach to hobbing cutter condition monitoring, significantly enhancing efficiency, productivity, and quality in gear manufacturing. By enabling real-time assessment of cutter health, manufacturers will proactively optimize performance and minimize downtime, leading to superior product quality and reduced production costs. This research work proposes a novel ML-based condition monitoring system successfully implemented using artificially induced faults on a hobbing cutter. FMEA was carried out to decide which types of cutter faults need to be considered for developing a condition monitoring system. The vibration signals obtained using a commercial high-capacity and high-frequency range DAQ were examined for changes in speed, feed, and depth of cut. The signals were processed using MATLAB to extract statistical features and underwent training using seven algorithms (Decision Tree, Naive Bayes, Support Vector Machine (SVM), Efficient Linear, Kernel, Ensemble and Neural Network). Amongst these algorithms, J48 Decision Tree has achieved perfect accuracy (100% correctly classified instances) for given dataset. Based on this analysis, it is recommended to use J48 Decision Tree Classifier to monitor the condition of a CNC hobbing cutter. These algorithms are accurate and fast to build, making them well-suited for this task. The emerging confusion matrix was crucial in creating a condition monitoring system. This system can analyze statistical features extracted from vibration signals to assess the health of the cutter and classify it accordingly. In further research, this system will trigger alerts upon detecting worn or damaged cutters, allowing for timely replacement and preventing potential issues. By implementing this ML-based system, manufacturers will ensure optimal hobbing cutter performance, leading to significant advancements in gear manufacturing. This condition monitoring system is applicable only for hobbing cutter specified in this research work (Omole et al., 2023).
Data availability statement
The original contributions presented in the study are included in the article/supplementary material, further inquiries can be directed to the corresponding author.
Author contributions
SS: Conceptualization, Project administration, Resources, Supervision, Writing–review and editing. NT: Formal Analysis, Investigation, Methodology, Project administration, Resources, Software, Writing–original draft, Writing–review and editing. BD: Formal Analysis, Investigation, Project administration, Software, Supervision, Validation, Writing–original draft, Writing–review and editing. SP: Funding acquisition, Methodology, Project administration, Resources, Software, Supervision, Validation, Visualization, Writing–original draft, Writing–review and editing. RC: Funding acquisition, Investigation, Methodology, Project administration, Resources, Writing–review and editing. EN: Funding acquisition, Investigation, Methodology, Project administration, Software, Validation, Visualization, Writing–original draft. HM: Conceptualization, Project administration, Supervision, Visualization, Writing–original draft, Writing–review and editing.
Funding
The author(s) declare financial support was received for the research, authorship, and/or publication of this article. The authors present their appreciation to King Saud University for funding this research through Researchers Supporting Program number (RSPD 2024R1006), King Saud University, Riyadh, Saudi Arabia.
Acknowledgments
Authors thank the college administration for supporting this work.
Conflict of interest
The authors declare that the research was conducted in the absence of any commercial or financial relationships that could be construed as a potential conflict of interest.
Publisher’s note
All claims expressed in this article are solely those of the authors and do not necessarily represent those of their affiliated organizations, or those of the publisher, the editors and the reviewers. Any product that may be evaluated in this article, or claim that may be made by its manufacturer, is not guaranteed or endorsed by the publisher.
References
Alabdulwahab, S., and Moon, B. K. (2020). Feature selection methods simultaneously improve the detection accuracy and model building time of machine learning classifiers. Symmetry 12 (9), 1424. doi:10.3390/sym12091424
Bagri, S., Manwar, A., Varghese, A., Mujumdar, S., and Joshi, S. S. (2021). Tool wear and remaining useful life prediction in micro-milling along complex tool paths using neural networks. J. Manuf. Process. 71, 679–698. ISSN 1526-6125. doi:10.1016/j.jmapro.2021.09.055
Chen, Y., Jin, Yi, and Jiri, G. (2018). Predicting tool wear with multi-sensor data using deep belief networks. Int. J. Adv. Manuf. Technol. 99, 1917–1926. doi:10.1007/s00170-018-2571-z
Cheng, M., Jiao, L., Shi, X., Wang, X., Yan, P., and Li, Y. (2020). An intelligent prediction model of the tool wear based on machine learning in turning high strength steel. Proc. Institution Mech. Eng. Part B J. Eng. Manuf. 234 (13), 1580–1597. doi:10.1177/0954405420935787
Fong, Ka M., Wang, X., Kamaruddin, S., and Ismadi, M.-Z. (2021). Investigation on universal tool wear measurement technique using image-based cross-correlation analysis. Measurement 169, 108489. doi:10.1016/j.measurement.2020.108489
Fritz, K., Döbbeler, B., Goetz, S., and Staudt, J. (2016). Online tool wear measurement for hobbing of highly loaded gears in geared turbo fans. Procedia Manuf. 6, 9–16. ISSN 2351-9789. doi:10.1016/j.promfg.2016.11.002
Gauder, C., Koch, M., and Biermann, D. (2023). In-process monitoring of hobbing process using an acoustic emission sensor and supervised machine learning. Sensors 23 (4), 1832. doi:10.3390/a16040183
Hameed, S., Junejo, F., Amin, I., Qureshi, A. K., and Tanoli, I. K. (2023). An intelligent deep learning technique for predicting hobbing tool wear based on gear hobbing using real-time monitoring data. Energies 16, 6143. doi:10.3390/en16176143
Humayun, M., Sujatha, R., Almuayqil, S. N., and Jhanjhi, N. Z. (2022). A transfer learning approach with a convolutional neural network for the classification of lung carcinoma. Healthc. (Basel) 10 (6), 1058. doi:10.3390/healthcare10061058
Jia, Y., Li, G., and Dong, X. (2022). Real-time wear monitoring of hob cutter based on statistical analysis. ISA Trans. 129, 691–702. doi:10.1016/j.isatra.2022.02.051
Jung, S., Kim, M., Kim, B., Kim, J., Kim, E., Kim, J., et al. (2022). Fault detection for CNC machine tools using auto-associative kernel regression based on empirical mode decomposition. Processes 10, 2529. doi:10.3390/pr10122529
Klocke, F., Döbbeler, B., Goetz, S., and Viek, T. (2017). Model-based online tool monitoring for hobbing processes. Procedia CIRP 58, 601–606. doi:10.1016/j.procir.2017.03.271
Lee, Wo J., Mendis, G., and Sutherland, J. (2019). Development of an intelligent tool condition monitoring system to identify manufacturing tradeoffs and optimal machining conditions. Procedia Manuf. 33, 256–263. doi:10.1016/j.promfg.2019.04.031
Li, X., Wang, T., Zhang, X., Gao, C., and Tanoli, I. K. (2023). An intelligent deep learning technique for predicting hobbing tool wear based on gear hobbing using real-time monitoring data. Energies 16 (17), 6143. doi:10.3390/en16176143
Liu, Y., Hu, X., and Sun, S. (2019). Remaining useful life prediction of cutting tools based on support vector regression. IOP Conf. Ser. Mater. Sci. Eng. 576, 012021. doi:10.1088/1757-899X/576/1/012021
Luo, B., Wang, H., Liu, H., Li, B., and Peng, F. (2018). Early Fault detection of machine tools based on deep learning and dynamic identification. IEEE Trans. Industrial Electron. 66, 509–518. doi:10.1109/TIE.2018.2807414
Madhusudana, C., Budati, S., Gangadhar, N., Kumar, H., and Narendranath, S. (2016). Fault diagnosis studies of face milling cutter using machine learning approach. J. Low Freq. Noise, Vib. Act. Control 35 (2), 128–138. doi:10.1177/0263092316644090
Mascia, A., Cirafici, A. M., Bongiovanni, A., Colotti, G., Lacerra, G., Di Carlo, M., et al. (2020). A failure mode and effect analysis (FMEA)-based approach for risk assessment of scientific processes in non-regulated research laboratories. Accred Qual. Assur 25, 311–321. doi:10.1007/s00769-020-01441-9
Mian, Z., Deng, X., Dong, X., Tian, Y., Cao, T., Chen, K., et al. (2024). A literature review of fault diagnosis based on ensemble learning. Eng. Appl. Artif. Intell. 127, 107357. ISSN 0952-1976. doi:10.1016/j.engappai.2023.107357
Nyangaresi, V., Yousef, R., and Nyakanga, J. (2022). Efficient feature selection and ML algorithm for accurate diagnostics. J. Comput. Sci. Res. 4, 10–19. doi:10.30564/jcsr.v4i1.3852
Omole, S., Dogan, H., Lunt, A., Kirk, S., and Shokrani, A. (2023). Using machine learning for cutting tool condition monitoring and prediction during machining of tungsten. Int. J. Comput. Integr. Manuf., 1–25. doi:10.1080/0951192X.2023.2257648
Parsana, T., and Patel, M. (2014). A case study: a process FMEA tool to enhance quality and efficiency of manufacturing industry. Bonfring Int. J. Industrial Eng. Manag. Sci. 4, 145–152. doi:10.9756/BIJIEMS.10350
Patange, A. D., and Jegadeeshwaran, R. (2020). A machine learning approach for vibration-based multipoint tool insert health prediction on vertical machining centre (VMC). Measurement 173. doi:10.1016/j.measurement.2020.108649
Patange, A. D., Jegadeeshwaran, R., and Dhobale, N. C. (2019). Milling cutter condition monitoring using machine learning approach. IOP Conf. Ser. Mater. Sci. Eng. 624 (1), 012030–012035. doi:10.1088/1757-899X/624/1/012030
Patange, A. & R., Bajaj, N., Khairnar, A., and Gavade, N. (2022). Application of machine learning for tool condition monitoring in turning. Sound Vib. 56, 127–145. doi:10.32604/sv.2022.014910
Przybyś-Małaczek, A., Antoniuk, I., Szymanowski, K., Kruk, M., and Kurek, J. (2023). Application of machine learning algorithms for tool condition monitoring in milling chipboard process. Sensors 23, 5850. doi:10.3390/s23135850
Rahoma, A., Imtiaz, S., Ahmed, S., and Khan, F. (2023). Detection and diagnosis of process fault using unsupervised learning methods and unlabeled data. Int. J. Adv. Eng. Sci. Appl. Math. 15, 24–36. doi:10.1007/s12572-023-00327-6
Shewale, M. S., Mulik, S. S., Deshmukh, S. P., Patange, A. D., Zambare, H. B., and Sundare, A. P. (2018). Novel machine health monitoring system. Proc. 2nd Int. Conf. Data Eng. Commun. Technol. Adv. Intelligent Syst. Comput. 828, 461–468. doi:10.1007/978-981-13-1610-4_47
Tambake, N., Deshmukh, B., and Patange, A. (2021). Data driven cutting tool fault diagnosis system using machine learning approach: a review. J. Phys. Conf. Ser. 1969, 012049. doi:10.1088/1742-6596/1969/1/012049
Tambake, N., Deshmukh, B., and Patange, A. (2023). Development of a low-cost data acquisition system and training of J48 algorithm for classifying faults in cutting tool. Mater. Today Proc. 72, 1061–1067. ISSN 2214-7853. doi:10.1016/j.matpr.2022.09.163
Wang, D., Hong, R., and Lin, X. (2021). A method for predicting hobbing tool wear based on CNC real-time monitoring data and deep learning. Precis. Eng. 72, 847–857. ISSN 0141-6359. doi:10.1016/j.precisioneng.2021.08.010
Widodo, A., and Yang, B.-S. (2007). Support vector machine in machine condition monitoring and fault diagnosis. Mech. Syst. Signal Process. 21 (6), 2560–2574. doi:10.1016/j.ymssp.2006.12.007
Wu, D., Yan, P., Zhou, H., Liu, T., Fang, Y., Yi, R., et al. (2022). A novel online framework for gear machining quality prediction based on ensemble deep regression. Measurement 201, 111716. ISSN 0263-2241. doi:10.1016/j.measurement.2022.111716
Yang, L., and Shami, A. (2020). On hyperparameter optimization of machine learning algorithms: theory and practice. Neurocomputing 415, 295–316. ISSN 0925-2312. doi:10.1016/j.neucom.2020.07.061
Zeng, Y., Liu, R., and Liu, X. (2021). A novel approach to tool condition monitoring based on multi-sensor data fusion imaging and an attention mechanism. Meas. Sci. Technol. 32, 055601. doi:10.1088/1361-6501/abea3f
Zhang, H., Zhang, C., Zhang, J., and Zhou, L. (2014). Tool wear model based on least squares support vector machines and Kalman filter. Prod. Eng. 8, 101–109. doi:10.1007/s11740-014-0527-1
Keywords: machine learning approach, condition monitoring, hobbing cutter, failure mode effect analysis (FMEA), hyperparameter optimization, CNC hobbing machine
Citation: Tambake N, Deshmukh B, Pardeshi S, Mahmoud HA, Cep R, Salunkhe S and Nasr EA (2024) Machine learning for monitoring hobbing tool health in CNC hobbing machine. Front. Mater. 11:1377941. doi: 10.3389/fmats.2024.1377941
Received: 28 January 2024; Accepted: 25 March 2024;
Published: 12 April 2024.
Edited by:
Mijia Yang, North Dakota State University, United StatesReviewed by:
Prattasha Saha, North Dakota State University, United StatesFarzad Pashmforoush, University of Maragheh, Iran
Copyright © 2024 Tambake, Deshmukh, Pardeshi, Mahmoud, Cep, Salunkhe and Nasr. This is an open-access article distributed under the terms of the Creative Commons Attribution License (CC BY). The use, distribution or reproduction in other forums is permitted, provided the original author(s) and the copyright owner(s) are credited and that the original publication in this journal is cited, in accordance with accepted academic practice. No use, distribution or reproduction is permitted which does not comply with these terms.
*Correspondence: Sachin Salunkhe, drsalunkhesachin@veltech.edu.in