Poro-Viscoelastic Effects During Biomechanical Testing of Human Brain Tissue
- 1Department Mechanical Engineering, Institute of Applied Mechanics, Friedrich-Alexander-University Erlangen-Nürnberg, Erlangen, Germany
- 2Institute of Functional and Clinical Anatomy, Friedrich-Alexander-University Erlangen-Nürnberg, Erlangen, Germany
- 3Department of Operative Surgery and Topographic Anatomy, Sechenov University, Moscow, Russia
- 4Institute of Biomechanics, Graz University of Technology, Graz, Austria
- 5Department of Structural Engineering, Norwegian University of Science and Technology (NTNU), Trondheim, Norway
- 6Glasgow Computational Engineering Centre, University of Glasgow, Glasgow, United Kingdom
- 7Serra Húnter Fellow, Department of Physics, Laboratori de Càlcul Numéric (LaCàN), Universitat Politècnica de Catalunya (UPC), Barcelona, Spain
Brain tissue is one of the softest tissues in the human body and the quantification of its mechanical properties has challenged scientists over the past decades. Associated experimental results in the literature have been contradictory as characterizing the mechanical response of brain tissue not only requires well-designed experimental setups that can record the ultrasoft response, but also appropriate approaches to analyze the corresponding data. Due to the extreme complexity of brain tissue behavior, nonlinear continuum mechanics has proven an expedient tool to analyze testing data and predict the mechanical response using a combination of hyper-, visco-, or poro-elastic models. Such models can not only allow for personalized predictions through finite element simulations, but also help to comprehensively understand the physical mechanisms underlying the tissue response. Here, we use a nonlinear poro-viscoelastic computational model to evaluate the effect of different intrinsic material properties (permeability, shear moduli, nonlinearity, viscosity) on the tissue response during different quasi-static biomechanical measurements, i.e., large-strain compression and tension as well as indentation experiments. We show that not only the permeability but also the properties of the viscoelastic solid largely control the fluid flow within and out of the sample. This reveals the close coupling between viscous and porous effects in brain tissue behavior. Strikingly, our simulations can explain why indentation experiments yield that white matter tissue in the human brain is stiffer than gray matter, while large-strain compression experiments show the opposite trend. These observations can be attributed to different experimental loading and boundary conditions as well as assumptions made during data analysis. The present study provides an important step to better understand experimental data previously published in the literature and can help to improve experimental setups and data analysis for biomechanical testing of brain tissue in the future.
1 Introduction
In recent years, it has increasingly been recognized that mechanical signals play an important role for brain development (Budday et al., 2015b; Koser et al., 2016; Thompson et al., 2019), injury (Meaney et al., 2014; Hemphill et al., 2015; Keating and Cullen, 2021), and disease (Murphy et al., 2016; Barnes et al., 2017; Gerischer et al., 2018; Park et al., 2018). In silico modeling based on the theory of nonlinear continuum mechanics has therefore proven a valuable tool to, on the one hand, computationally test hypotheses that complement experimental studies and provide a predictive understanding of processes in the brain under physiological and pathological conditions (Goriely et al., 2015; Budday et al., 2020). On the other hand, computational modeling can assist diagnosis and treatment of neurological disorders through personalized predictions (Angeli and Stylianopoulos, 2016; Lytton et al., 2017; Weickenmeier et al., 2017).
A major challenge when aiming to explore the role of brain mechanics in health and disease is reliably quantifying the mechanical properties of brain tissue. Brain tissue is ultrasoft—arguably softer than any other tissue in the human body—and deforms noticeably when it is taken out of its physiological environment within the skull, e.g., for ex vivo mechanical testing. In addition, it has an exceptionally high water content, 0.83 g/ml in gray matter and 0.71 g/ml in white matter (Whittall et al., 1997). From the total of about 80% water, approximately 20–40% is free-flowing cerebrospinal fluid, while the rest resides inside the cells. The extreme softness and biphasic nature of brain tissue pushes mechanical testing and modeling approaches to their limits. Early studies had therefore significantly overestimated the stiffness of brain tissue (Galford and McElhaney, 1970; Chatelin et al., 2010), but more recent studies indicate that the stiffness lies on the order of 1 kPa (Budday et al., 2020). Still, the exact values have varied notably depending on the testing setup (Chatelin et al., 2010; Budday et al., 2020). It is thus difficult to control specimen geometry, local deformation states, and their relation to the recorded forces (Rashid et al., 2012).
Partially, the observed discrepancies can be attributed to the fact that different testing techniques measure the properties on different length scales (cell, tissue, organ) and different time scales (quasistatic, dynamic). But even on a seemingly similar spatial and temporal resolution, experimental observations may differ, both qualitatively and quantitatively. For instance, gray matter shows a stiffer response than white matter during large-strain compression, tension, and shear experiments (Budday et al., 2017a), while one observes the opposite regional trends during tissue-scale indentation (Van Dommelen et al., 2010; Budday et al., 2015a). Here, we hypothesize that these observations may be attributed to different boundary and drainage conditions in combination with the biphasic, poro-viscoelastic nature of brain tissue (Franceschini et al., 2006; Comellas et al., 2020). Depending on the testing setup, the fluid is trapped within the tissue or free to escape, which may largely affect the recorded reaction forces. Therefore, realistic computational predictions and the profound understanding of brain tissue behavior require sophisticated mechanical models that capture the complex and unique characteristics of this ultrasoft and biphasic tissue.
Several poroelastic models have been proposed to reproduce the biphasic nature of brain tissue, but with specific applications in mind, e.g., drug delivery (Ehlers and Wagner, 2015), hydrocephalus (Kim et al., 2015), tumor growth and treatment (Angeli and Stylianopoulos, 2016), decompressive craniotomy (Fletcher et al., 2016), or tissue fracture (Terzano et al., 2021). Early numerical studies that specifically focused on elucidating the mechanisms behind the observed mechanical properties of brain tissue studied its nonlinear ultrasoft viscous behavior without incorporating the biphasic nature of the tissue (Bilston et al., 2001; Prevost et al., 2011; Budday et al., 2017b,c).
Initial models incorporating both porous and viscous responses aimed at fitting a single experimental setup (Cheng and Bilston, 2007) or included important analytical simplifications and were tailored to particular applications related to cerebrospinal fluid circulation (Mehrabian and Abousleiman, 2011; Hasan and Drapaca, 2015; Mehrabian et al., 2015). To our knowledge, the formulation proposed by our group (Comellas et al., 2020) and the model described by Hosseini-Farid et al. (2020) are the only approaches to date with the potential of capturing the wide range of characteristics observed in the response of brain tissue under different biomechanical loading scenarios.
In this study, we use a finite poro-viscoelastic model to evaluate the individual porous and viscous contributions in numerical simulations of quasi-static unconfined compression and tension as well as indentation experiments (with loading frequencies on the order of 0.01 Hz). Through systematic parameter studies, we identify parameter ranges that can explain the phenomenon observed when comparing the mechanical properties of gray and white matter brain tissue, where indentation yields the opposite regional trend than large-strain compression experiments. By exploring the effects of permeability, shear moduli, nonlinearity, and viscosity on the numerical response during the different experimental loading conditions, we discuss their individual physical meaning by closely considering the underlying poro-viscoelastic modeling framework.
2 Materials and Methods
2.1 Human Brain Experiments
As a reference and to confirm the validity of seemingly contradictory results in the literature, we performed indentation and large-strain compression and tension experiments on exactly the same sample extracted from human gray and white matter tissue, respectively, as illustrated in Figure 1. Human brain tissue was extracted from a body donor (female, age 77) who had given her written consent to donate her body to research. The study was additionally approved by the Ethics Committee of Friedrich-Alexander-University Erlangen-Nürnberg, Germany, with the approval number 405_18 B.
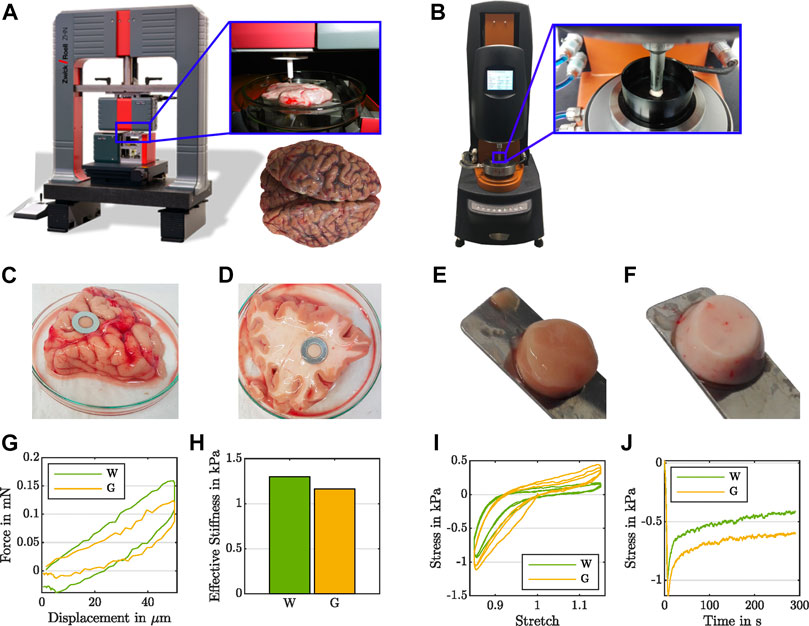
FIGURE 1. Experimental evidence for the effect of the testing setup on the recorded regional mechanical response of human brain tissue. During indentation measurements (A), white matter (D) shows higher forces (G) and a higher effective modulus (H) than gray matter (C). During rheometer measurements (B) under large-strain cyclic compression and tension (I) as well as compression relaxation (J), white matter (F) yields lower stresses than gray matter (E).
For indentation experiments, we used the ZHN-Nanoindenter by ZwickRoell GmbH and Co. KG (Ulm, Germany), as shown in Figure 1A, and closely followed the indentation procedure established in Budday et al. (2015a). We prepared tissue slices in a 120 mm-diameter Petri dish and stabilized the samples using a 10 mm-diameter stainless steel washer (see Figures 1C,D). To ensure a homogeneous specimen response, we used a circular flat punch indenter with a diameter of 1.8 mm and a ceramic shaft extension. We conducted all indentation tests at room temperature under displacement control using a trapezoidal loading-holding-unloading profile with a maximum indentation depth of 50 μm, as illustrated in Figure 2, bottom right, and recorded the corresponding force (see Figure 1G).
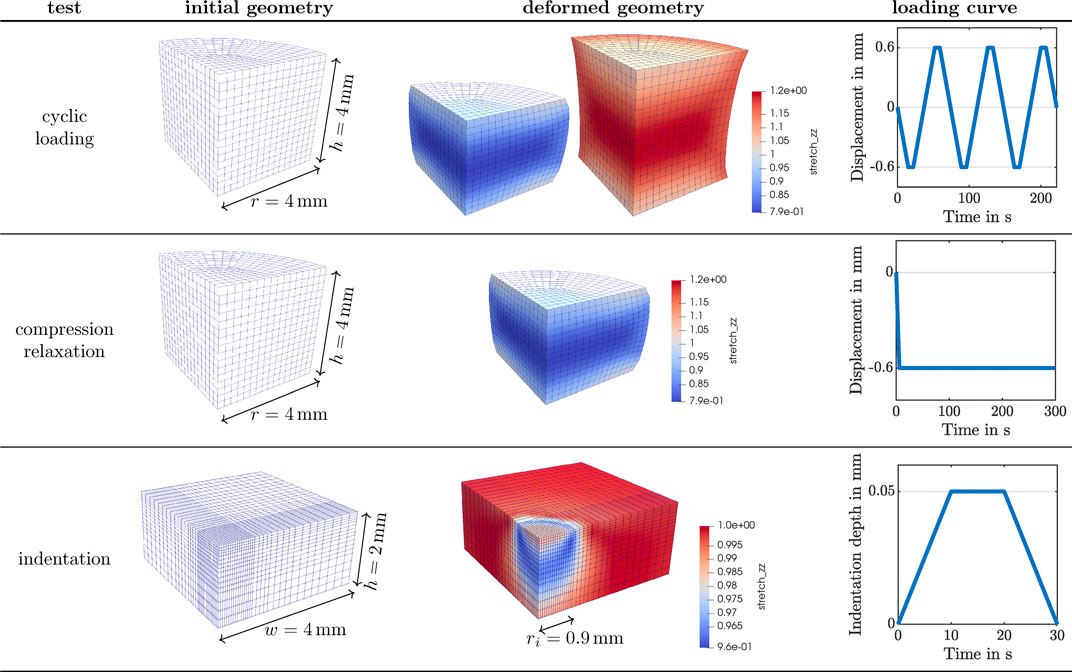
FIGURE 2. Numerical setup for the three experimental studies described in Figure 1 simulated with the poro-viscoelastic model. Finite element discretization of sample geometries, predicted deformed states using the base material parameters, and loading curves applied for each.
For compression and tension experiments, we extracted cylindrical samples with a radius of r = 4 mm (see Figures 1E,F) and used a Discovery HR-3 rheometer from TA instruments (New Castle, Delaware, United States), as shown in Figure 1B. We fixed the specimens to the upper and lower specimen holder using sandpaper and superglue. After a waiting period of 30–60 s to let the glue dry, we immersed the specimen in PBS to keep it hydrated during the experiment. We conducted all rheometer tests at 37°C. We note that previous studies have indicated that the mechanical response of brain tissue is not significantly affected by temperature in the range between 22°C and 37°C (Rashid et al., 2012). We first applied three cycles of compression and tension with a loading velocity of 40 μm/s, and minimum and maximum overall vertical stretches of λ = [h + Δz]/h = 0.85 and λ = 1.15, where h denotes the initial specimen height and Δz the displacement in the direction of loading (see Figure 1I). Subsequently, we performed a compression relaxation test at λ = 0.85 with a loading velocity of 100 μm/s and a holding period of 300 s (see Figure 1J). We recorded the corresponding force fz and determined the nominal stress as Pexp = fz/A, where A = πr2 is the undeformed cross-sectional area of the specimen. For more details on the testing procedure, we refer to Linka et al. (2021).
2.2 Nonlinear Poro-Viscoelastic Model
We model brain tissue as a poro-viscoelastic material where the viscoelastic solid represents the network of cells embedded within the extracellular matrix (ECM) and the free-flowing pore fluid is the interstitial fluid bathing the ECM. We use the numerical framework based on the Theory of Porous Media presented in our previous work (Comellas et al., 2020). In this section we summarize the main characteristics of the formulation, which assumes a fully-saturated compressible biphasic material, and that the solid and fluid constituents are separately incompressible. A detailed description of the derivation of all equations presented here can be found in Comellas et al. (2020) and its supplementary material.
2.2.1 Continuum Kinematics
Following the Theory of Porous Media, the same spatial position x in the current configuration at a given time t is occupied simultaneously by the solid and fluid components. However, the material particles of each component originate from different reference positions at time t0. Then, the constituent deformation map is x = χS(XS, t) = χF(XF, t), where XS and XF indicate the reference position of the solid and fluid components, respectively. The displacement of the solid component is, thus,
and
is its material deformation gradient.
2.2.2 Governing Equations
The weak form of the governing equations in the reference configuration is
The linear momentum balance Eq. 3 introduces the viscoelastic solid displacement test function δu while the mass balance Eq. 4 introduces the fluid pore pressure test function δp. Both equations are defined in the reference configuration
2.2.3 Constitutive Equations
The deformation gradient of the solid component is split multiplicatively into elastic and viscous parts,
Based on previous studies (Budday et al., 2017a, Budday et al., 2020), we select a one-term Ogden material model for both the equilibrium and non-equilibrium parts. Then,
where α∞ and μ∞ are the equilibrium Ogden shear and nonlinearity parameters,
The non-equilibrium counterpart is
where α1 and μ1 are the non-equilibrium Ogden shear and nonlinearity constitutive parameters, which again are related to the corresponding classical shear modulus through
An evolution equation is required to complete the definition of the viscous solid behavior. To this aim, we introduce
which assumes isotropy and introduces the viscosity of the solid component, η, such that we a priori satisfy a non-negative viscous dissipation term, i.e.,
The viscous dissipation density rate
Finally, the definition of the solid stress tensor 5) is completed with the volumetric contribution,
where λ* is the first Lamé parameter of the solid component and
The constitutive behavior of the fluid component follows a Darcy-like law,
where μFR is the effective shear viscosity of the pore fluid and
Like its counterpart
which will always be non-negative, given that μFR and K0 are necessarily positive and
2.2.4 Finite Element Implementation
We implemented the discretized governing equations using the open source finite element library deal.ii (Arndt et al., 2020). A detailed derivation of the constitutive equations and dissipation terms as well as the discretization and numerical implementation details are available in Comellas et al. (2020) and its associated supplementary material.
2.2.5 Numerical Setup
We investigate the behavior of the poro-viscoelastic formulation for three distinct loading scenarios corresponding to the experimental studies in Section 2.1: 1) cyclic compression-tension (see Figure 1I) and 2) compression relaxation (see Figure 1J) of a cylindrical specimen (see Figures 1E,F) using a rheometer (see Figure 1B) as well as 3) indentation with a flat punch (see Figures 1A,C,D,G,H). Figure 2 summarizes the numerical setup for the three test cases. A quarter of the cylindrical specimen is spatially discretized with 384 full integration Q2P1 elements for the cyclic loading and compression relaxation studies. That is, we approximate the solid displacement with quadratic shape functions and the pore pressure with linear ones. A quadrature of order 3 is considered. The degrees of freedom at the bottom of the geometry are fixed in space, while the vertical displacement shown in the right-most column is prescribed to the top surface. Symmetry boundary conditions are applied to the flat lateral surfaces. Solely the cylinder hull is drained, i.e. fluid can only leave the solid through the curved lateral surface. The deformed geometry depicts the local vertical stretch distribution on the fully compressed and extended states of the specimen for the cyclic loading, and the fully compressed state for the compression relaxation test. These states correspond to a 15% overall vertical strain. The spatial discretization to simulate the indentation experiments is composed of 2048 full integration Q2P1 elements. Again, in order to save computational effort, the computations are carried out only on one quarter of the real geometry. The finite element mesh is refined towards the center of the sample to approximate the flat punch indentation as accurately as possible, while maintaining a feasible computational cost. The bottom of the geometry is fixed in space and a vertical load shown in the bottom right of Figure 2 is applied to the degrees of freedom within the radius of the flat punch. Symmetry boundary conditions are applied to the inner lateral surfaces. All surfaces are undrained, except the unloaded part of the top surface, which is drained.
The material parameters used are given in Table 1. The initial solid volume fraction is set to 0.75. The first Lamé parameter λ* is fixed to a value large enough that the quasi-incompressibility of the solid component is correctly enforced. The effective shear fluid viscosity of the free-flowing fluid in the brain tissue is assumed to be that of water at room temperature. Based on our previous findings (Budday and Steinmann, 2018; Budday et al., 2020), the same nonlinearity Ogden parameter is used for the equilibrium and non-equilibrium parts α = α∞ = α1. Throughout our simulations, we vary the equilibrium shear modulus
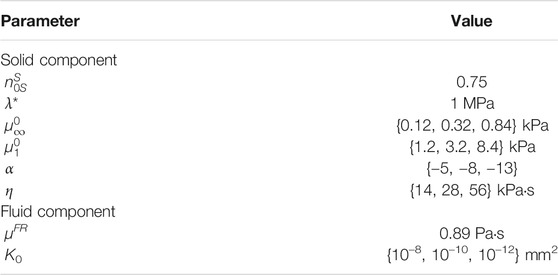
TABLE 1. Poro-viscoelastic material parameters used in the simulations described in Figure 2.
The numerical implementations of the three new experimental setups in the original code available from the deal.ii code gallery website and an exemplary input file for each type are provided in Supplementary Material.
2.3 Data Analysis
We derive a series of useful quantities based on the experiments and our finite element results with the aim of analyzing the effect of different material parameters on computational measures with a direct experimental counterpart or numerical quantities that have a recognizable physical meaning.
The total reaction force on the loaded surfaces is computed at each integration point of the element faces of the loaded boundary
Here, σ = τ/JS is the total Cauchy stress and N is the outward unit vector of the loaded surface with area element dA0S, which is defined in the reference configuration of the solid component. Based on the definition of the Kirchhoff stress (5), the reaction force can also be split into a solid and a fluid contribution,
For the cyclic loading and compression relaxation tests, we calculate the total, solid, and fluid contributions to the nominal stresses as the vertical component of the corresponding reaction force divided by the original cross-section of the sample. The total reaction force and total nominal stress are measures that are comparable to those typically obtained in experimental setups, as shown in Figure 1. Our modeling approach allows us to break them into solid and fluid contributions, and, in this way, explore how they respond to different loading scenarios and material parameters.
We compute numerically the values of the viscous and porous total dissipation rates in the whole sample at each time step from the corresponding dissipation density rates defined in Eq. 9 and Eq. 12, respectively. In particular,
where i = {p, v} for the porous and viscous contributions, respectively. Here,
The solid volume of the sample is numerically computed as
where the term
Similarly to the reaction forces, the fluid flow across the drained boundaries
Here, w is the volume-weighted seepage velocity as defined in Eq. 11 and N is the outward unit vector of the drained surface with area element dA0S, which is defined in the reference configuration of the solid component. The fluid flow predicted in our simulations provides additional insights into the porous behavior of the material and can potentially be related to experimental measures, e.g., fluid collected after confined compression of a sample.
Finally, following the procedure described in Budday et al. (2015a), we compute the effective modulus for the indentation simulations as
from the contact stiffness k and the punch radius ri. The contact stiffness k is defined as the average slope of the upper 50% of the reaction force curve during loading, as commonly used for the analysis of indentation experiments (Oliver and Pharr, 2004; Gupta et al., 2007; Budday et al., 2015a).
3 Results
To evaluate the influence of different material properties on the response of human brain tissue during different quasi-static biomechanical experiments, we perform parameter studies in the following and systematically vary the intrinsic permeability, equilibrium and non-equilibrium shear moduli, nonlinearity, and viscosity. We simulate the tissue behavior during cyclic compression–tension experiments, stress relaxation in compression, and indentation measurements, and analyze the corresponding behavior. The parameter ranges are chosen to represent different brain regions, e.g., cortex and corona radiata, with the aim to explain the contradictory results between large-strain compression and indentation experiments illustrated in Figure 1 based on the complex poro-viscoelastic model introduced in Section 2.2 with the setup-dependent boundary conditions introduced in Section 2.2.5.
3.1 The Effect of the Intrinsic Permeability
Figure 3 illustrates the effect of varying initial intrinsic permeabilities K0 on the response during cyclic compression–tension experiments. The total nominal stress is plotted on the left, the solid contribution in the middle and the fluid contribution on the right. While the total stress is only marginally affected by the intrinsic permeability, the individual contributions of the solid and fluid component change significantly. The solid nominal stress decreases with decreasing permeabilities, while the fluid nominal stress increases: A lower permeability results in a higher fluid contribution to the total nominal stress. For intrinsic permeabilities of K0 ≥ 10–6 mm2, the contribution of the fluid is negligible, while it makes up about one sixth of the total nominal stress under compressive loading and about one fourth under tensile loading for smaller permeabilities.

FIGURE 3. Cyclic compression–tension test up to 15% strain. Total nominal stress (left), solid nominal stress (middle) and fluid nominal stress (right) versus overall stretch for
Depending on the intrinsic permeability, the stress-stretch curves for the fluid nominal stress change notably. This can be directly related to the fluid’s ability to move through the solid faster or slower, which may generate inertial-like effects due to a delayed response or resistance to change of the fluid flow. For high permeabilities, the fluid moves easily through the solid structure such that, after overcoming inertia effects when the loading rate or direction changes, the fluid stress decreases rapidly. In contrast, for low permeabilities, the fluid moves slower through the solid experiencing more resistance. For the case with the smallest permeability, the fluid stress increases throughout the entire loading time before a delayed response to the change of loading direction takes place, resulting in stress-stretch curves more similar to the viscous solid itself.
Figure 4 shows the accumulated viscous dissipation over the set of three cycles on the left, the accumulated porous dissipation in the middle and the volume change of the solid component on the right. For the present choice of parameters, the viscous dissipation is distinctly larger than the porous dissipation. In addition, changing the intrinsic permeability barely influences the viscous dissipation. Interestingly, for the porous dissipation, we observe a maximum for an intrinsic permeability of K0 = 10−10 mm2. This effect is associated with Eq. 12, which indicates that a decreasing initial intrinsic permeability leads to an increase in the porous dissipation but also a decrease in the volume-weighted seepage velocity w, which results in the observed maximum.

FIGURE 4. Cyclic compression–tension test up to 15% strain. Accumulated viscous dissipation (left), accumulated porous dissipation (middle) and solid volume (right) over time for
The slight variations in the solid volume in Figure 4, right, show that the intrinsic permeability affects how strictly the incompressibility is enforced. As the formulation has a volumetric stress defined in terms of the first Lamé parameter λ* (see Eq. 10), we have selected a constant λ* instead of a constant Poisson’s ratio ν in our parameter study. Enforcing a constant ν when exploring variations of the shear modulus and nonlinearity parameter in the Ogden model would result in different λ* values for each combination of parameters, given that λ* = 2μ0ν/(1 − 2ν), where μ0 is the classical shear modulus. By selecting a constant λ*, we ensure that the volumetric part of the stress is independent of these parameters and, hence, avoid unwanted interference in the sensitivity study. In addition, initial attempts to explore the effect of the Poisson’s ratio on the predicted material response resulted in numerical instabilities around peak loading times for the compression relaxation tests, even with values above 0.49. In these simulations we converted the Poisson’s ratio to λ* using the equilibrium shear modulus, i.e., with
During stress relaxation and indentation experiments, trends in fluid flow over the boundary can directly be tied to the behavior over time of the fluid nominal stresses, as illustrated in Figures 5, 6. For high permeabilities, we observe that the fluid stresses adopt positive values as soon as the loading rate is zero (holding period). This can be attributed to the fact that fluid immediately starts to flow back into the sample. For lower permeabilities, in contrast, fluid continues to flow out, but at smaller rates. Therefore, we suppose that there is a longer period of inertial-like effects. It is interesting to note that we may observe a negative fluid flow over the boundary, i.e., overall fluid is entering the sample, but locally have fluid flowing outwards. This can, for instance, be seen during indentation experiments in Supplementary Figure S1. Another interesting effect we observe is that when the biphasic material deforms and occupies new volume in space, it can potentially incorporate new fluid. This occurs when the loading inertia forcing fluid outwards is negligible or does not offer enough resistance to the potential inward flow. In summary, as the sample is immersed in fluid during the experiments to avoid dehydration, small and slow displacements may result in fluid flow into the sample across drained boundaries.
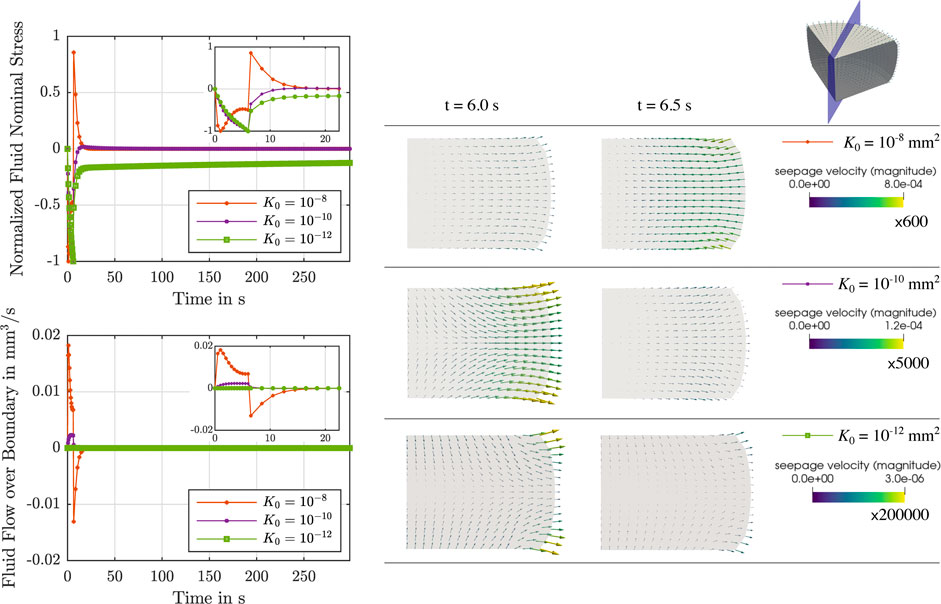
FIGURE 5. Compression relaxation test up to 15% strain. Left: Normalized fluid nominal stress (top left) and fluid flow over the boundary (bottom left) over time for
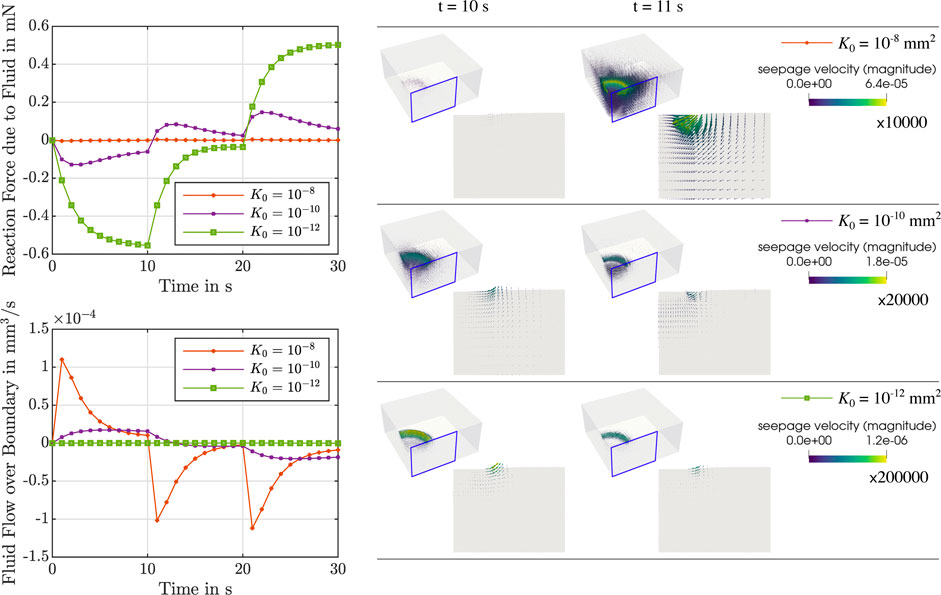
FIGURE 6. Indentation test with an indentation depth of 50 μm. Left: Reaction force due to the fluid (top left) and fluid flow over the boundary (bottom left) over time for μ∞ = 0.32 kPa, μ1 = 8.4 kPa, α = −8, η = 14 kPa ⋅s and different initial intrinsic permeabilities K0 = {10−8, 10−10, 10−12} mm2. Right: Corresponding finite element results of the seepage velocity at the end of loading (t = 10 s) and for the subsequent time step (t = 11 s). Results are shown for the whole sample and for the indicated vertical cross-section. The depicted arrows are sized proportional to the magnitude of the seepage velocity, given in mm/s, scaled by the factor indicated below each colorbar legend. Corresponding videos with the full simulation results on the vertical cross-section are available in Supplementary Material.
In the sequel, we will evaluate the effects of the equilibrium and non-equilibrium shear moduli, nonlinearity, and viscosity on the tissue response for different initial intrinsic permeabilities K0 = {10−8, 10−10, 10−12} mm2.
3.2 The Effect of the Shear Modulus
Figure 7, first column, shows the effect of varying shear moduli
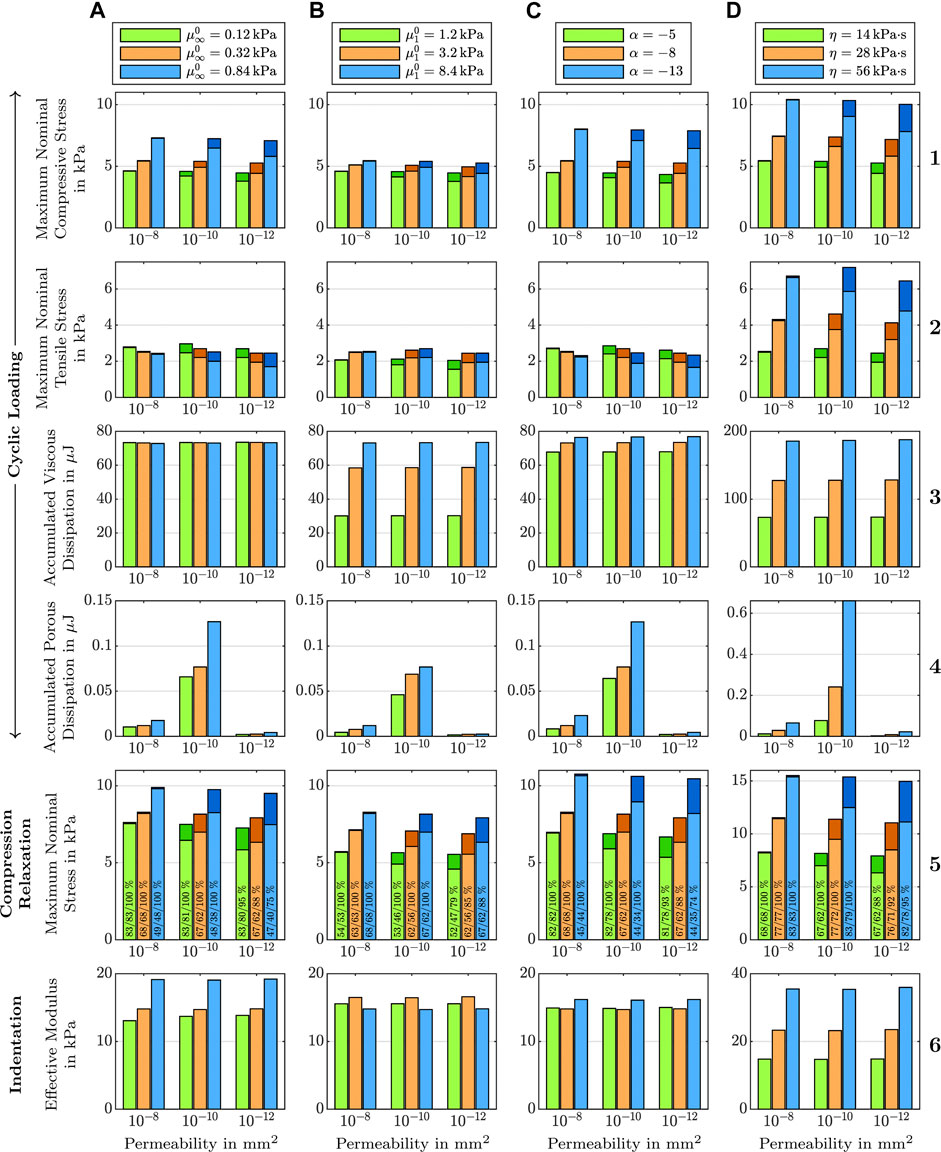
FIGURE 7. Effect of (A) the equilibrium shear modulus
The viscous dissipation remains almost constant for different shear moduli and permeabilities (see Figure 7 A3). The porous dissipation, in contrast, shows a coupled dependency on the shear modulus and the intrinsic permeability (see Figure 7 A4). It increases with increasing shear modulus and again shows its maximum for an intrinsic permeability of K0 = 10−10 mm2. These results demonstrate that the stiffness of the solid has a strong influence on the fluid response. Varying the shear modulus also noticeably affects the stress-stretch curves for the fluid nominal stress, as illustrated in Figure 8, first row. We note that, depending on the shear modulus, the maximum tensile stress is not necessarily reached for the maximum stretch.
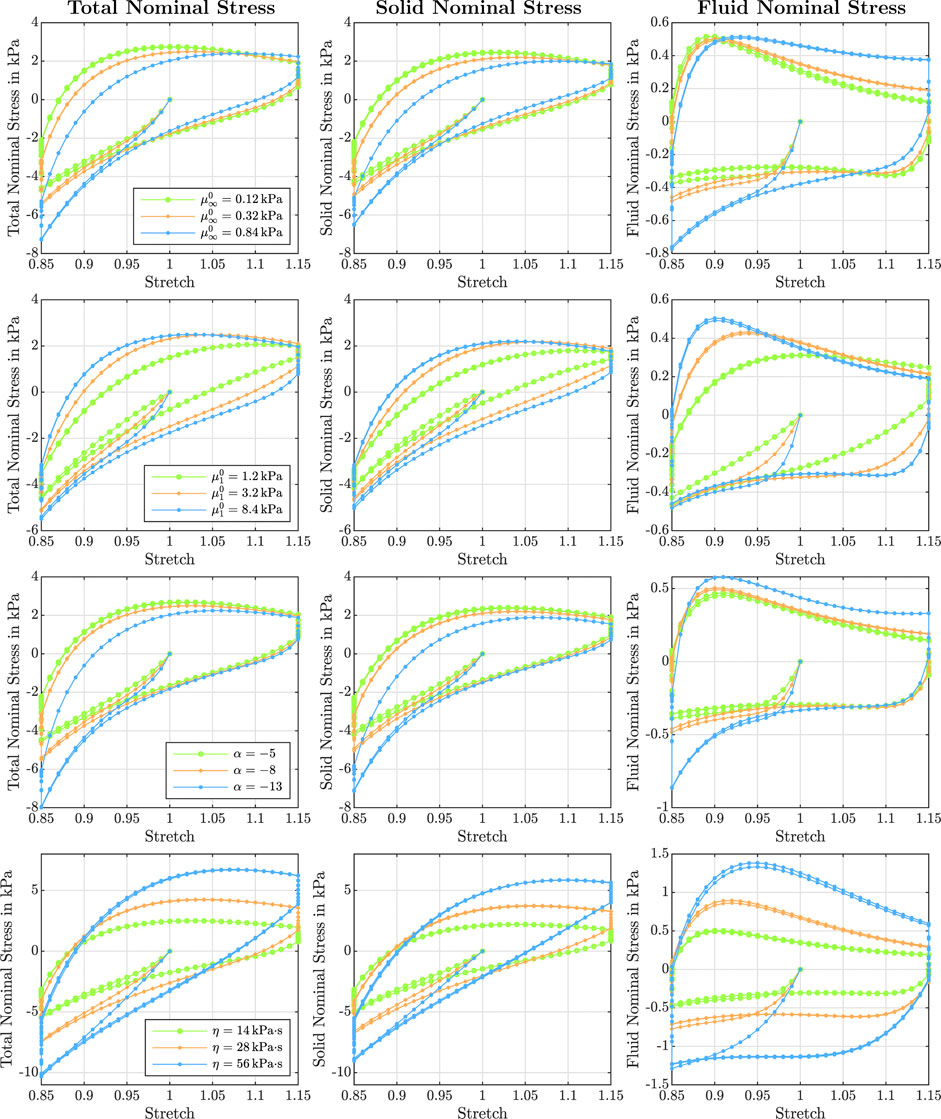
FIGURE 8. Effect of the equilibrium shear modulus
The stress relaxation experiments in Figure 7 A5 reveal that the stress relaxed after 300 s of holding time decreases with increasing shear modulus. Independent of the shear modulus and permeability, the fluid stress relaxes faster than the solid stress. While for higher permeabilities, the fluid stress has fully relaxed after five minutes, it still contributes to the total stress for the lowest intrinsic permeability of K0 = 10−12 mm2 as only between 75 % and 95% of the fluid nominal stress have relaxed. Still, the overall stress relaxation remains almost constant, as the increasing fluid contribution takes over some part of the solid relaxation.
Figure 7, second column, shows the effect of the non-equilibrium shear modulus
3.3 The Effect of the Nonlinearity
Figure 7, third column, shows the effect of the nonlinearity parameter α on cyclic compression–tension, compression stress relaxation, and indentation experiments. We chose negative values for α to capture the stiffer response under compression than under tension, which is an important feature of brain tissue behavior, as shown in Figure 1I. Under compressive loading, increasing α values result in an increase of the maximum nominal stress, both in cyclic loading and stress relaxation (Figure 7 C1 and C5). Under tensile loading, we observe the opposite trend (Figure 7 C2), similar to the effect of
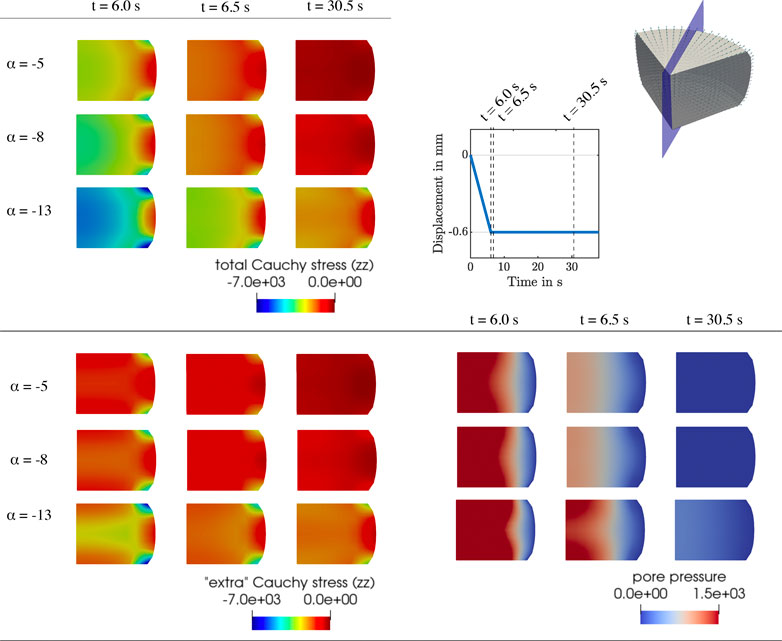
FIGURE 9. Compression relaxation test up to 15% strain. Finite element results for K0 = 10−10 mm2,
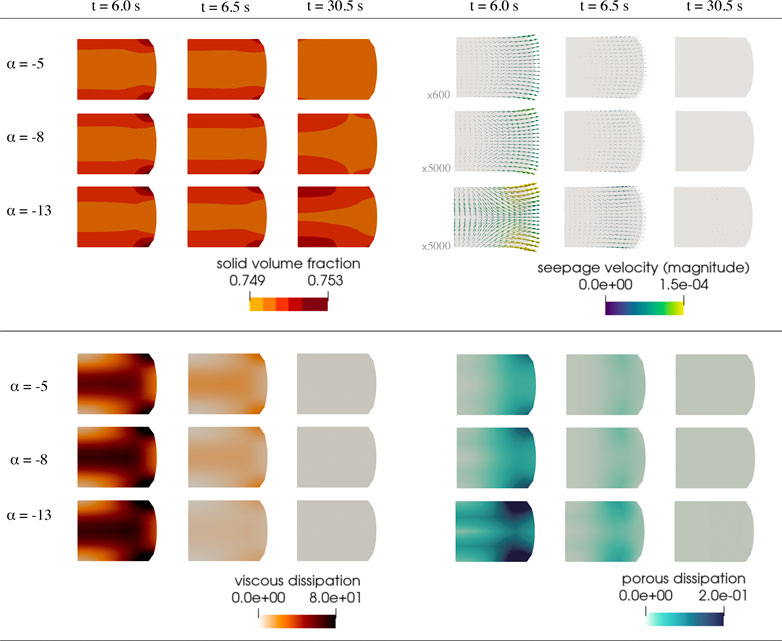
FIGURE 10. Additional finite element results corresponding to the simulation described in Figure 9. Solid volume fraction (top left), seepage velocity (top right), viscous dissipation rate (bottom left) and porous dissipation rate (bottom right). Dissipation rates are given in nJ/s. The depicted arrows representing the seepage velocity are sized proportional to its magnitude, given in mm/s, scaled by the factor indicated to the left of each row. Corresponding videos with the full simulation results are available in Supplementary Material.
Since the nonlinearity parameter has an exponential character, its influence becomes more pronounced for larger deformations. Therefore, the indentation results (see Figure 7 C6), which are associated with smaller strains than the compression and tension experiments, are only marginally affected by changes in α. Interestingly, the effective modulus is lowest for the intermediate α, and increases for higher or smaller values. This shows that the relation between α and the indentation modulus is not linear.
3.4 The Effect of the Viscosity
Figure 7, fourth column, shows the effect of the viscosity η on cyclic compression–tension, compression stress relaxation, and indentation experiments. Increasing the viscosity leads to a significant increase in the maximum nominal stress during both compression and especially tension (see Figure 7 D1, D2, and D5). Interestingly, increasing the viscosity leads to a less nonlinear and less compression–tension asymmetric response (see Figure 8, bottom left). In addition, the fluid contribution to the total nominal stress increases notably. The effect of the viscosity on the fluid nominal stress can also be seen in the corresponding stress-stretch curves in Figure 8, bottom right. Depending on η, the amount of stretch at which the maximum fluid stress is reached shifts. In addition, both viscous and porous dissipation increase significantly for increasing viscosity (see Figure 7 D3 and D4). As expected, also the stress relaxed after 5 min during stress relaxation experiments increases with increasing η (see Figure 7 D5). Finally, the viscosity largely affects the effective modulus from indentation simulations (see Figure 7 D6)—more than any other material parameter.
4 Discussion
In this work, we have used a poro-viscoelastic computational model for brain tissue behavior to systematically analyze the viscous and porous contributions to the quasi-static response recorded during common biomechanical testing setups, i.e., large-strain compression and tension as well as indentation experiments. Through systematic parameter studies, we have demonstrated the effects of the initial intrinsic permeability, shear moduli, nonlinearity, and viscosity on the test-setup-dependent recorded mechanical response and associated read-outs. Our analyses allow us to evaluate and explain differences in the reported data on human brain tissue mechanics that stem from poro-viscoelastic effects in combination with different drainage and loading conditions that differ greatly depending on the experimental procedure.
4.1 The Poro-Viscoelastic Nature of Brain Tissue Explains Discrepancies Between Indentation and Compression Experiments
Common biomechanical testing techniques to quantify the quasi-static, continuum scale, region-dependent mechanics of brain tissue include indentation experiments (Van Dommelen et al., 2010; Chen et al., 2015; Budday et al., 2015a; MacManus et al., 2017, 2018) and large-strain measurements under multiple loading modes, i.e., compression (Galford and McElhaney, 1970; Miller and Chinzei, 1997), tension (Miller and Chinzei, 2002), shear (Donnelly and Medige, 1997; Prange and Margulies, 2002; Chatelin et al., 2012), or combinations thereof (Jin et al., 2013; Budday et al., 2017a). Strikingly, while white matter tissue shows a “stiffer” response than gray matter during indentation measurements, we observe the opposite trend during large-strain compression, tension, and shear. To confirm this trend, we have tested one and the same human brain tissue specimens with both indentation and large-strain compression–tension experiments, as illustrated in Figure 1. While the effective modulus from indentation is higher for white matter (see Figures 1G,H), the maximum stresses reached during cyclic compression–tension and compression relaxation are higher for gray matter tissue (see Figures 1I,J).
In this study, we have made an effort to trace this observation to the poro-viscoelastic nature of brain tissue—and the differences in the permeability, shear moduli, nonlinearity, and viscosity in different regions—through systematic numerical simulations. Our results show the tight coupling between the properties of the viscoelastic solid and the fluid behavior; the porous dissipation is highest for intermediate permeabilities and largely depends on the shear moduli, nonlinearity, and viscosity of the solid. Naturally, these complex and nonlinear dependencies cannot be captured by a single effective modulus determined from indentation experiments at relatively low strains or maximum stresses during large-strain loading. Such values may change depending on the loading and boundary conditions and do not necessarily represent the actual stiffness of the material. Since the nonlinearity parameter α has an exponential character, for instance, its influence becomes more pronounced for larger deformations during compression and tension experiments than during indentation measurements. Therefore, certain material properties may affect the maximum stresses during large-strain compression differently than the effective modulus from indentation. Our results demonstrate that increasing
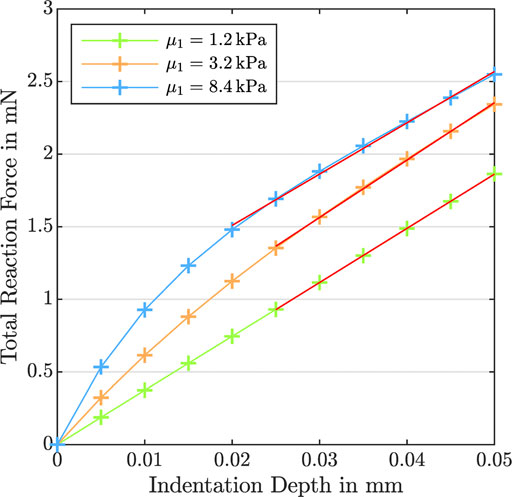
FIGURE 11. Indentation test with an indentation depth of 50 μm. Total reaction force versus indentation depth for K0 = 10−10 mm2,
These considerations emphasize that when testing ultrasoft and biphasic materials such as brain tissue, one needs to be particularly careful when post-processing recorded experimental data. Our simulations further show that the fluid flow within and across the boundaries of the sample is key to the overall response of the tissue (as measured by traditional methods). Therefore, also experimental setups should be carefully designed in the future to avoid unwanted effects and measure the particular property relevant for a certain application. In this respect, finite element modeling provides a useful tool to explore the complex behavior under different loading conditions and better understand the role of individual material properties, such as permeability, stiffness, nonlinearity, and viscosity, on the measured response, as discussed in detail in the following.
4.2 The Role of the Intrinsic Permeability on the Tissue Response
Although the initial intrinsic permeability K0 barely affects the total nominal stress and effective modulus (see Figures 3, 7), the individual fluid and solid contributions change noticeably. The permeability regulates how “fast” the fluid flow reacts to loading. In addition, our results demonstrate that there are significant local variations in the fluid flow within the sample for the different testing setups investigated here (e.g., see Figures 5, 6). We consistently observe that the amount of fluid “trapped” in the viscoelastic solid network is proportional to the contribution of the fluid part to the biphasic tissue response: Lower intrinsic permeabilities result in a larger fluid contribution to the total nominal stresses (see rows 1,2 and 5 in Figure 7). From a physical perspective, one can explain these trends considering that lower intrinsic permeabilities result in smaller relative movement between solid and fluid phases and, hence, less overall fluid flowing out of the loaded sample. Therefore, the incompressible fluid is “trapped” inside the sample and notably contributes to the stress response. For higher permeabilities, in contrast, there is a smaller proportion of fluid component in the biphasic material, so that the solid part must take on a larger part of the load.
Interestingly, our simulations further show that variations in the intrinsic permeability can result in extreme differences in the temporal course of the response, as observed in Figures 5, 6. Here, we see for both compression relaxation and indentation loading that abrupt changes in loading rate, e.g., from loading to the holding period, can completely reverse the fluid flow and increase its magnitude (K0 = 10−8 mm2) or only reduce the magnitude without changing the flow direction (K0 = 10−10 mm2 and K0 = 10−12 mm2). As the fluid flow has a direct impact on the global material response, reliably and accurately assessing the permeability of tissue samples in experiments is key to thoroughly understand how brain tissue deforms under different loading scenarios. This becomes an imperative under ‘“real-life” loading conditions that are not homogeneous, where we see complex local interactions of the biphasic tissue deformation, seepage velocity and resulting fluid flow directions.
Our results demonstrate that for the testing setups considered here, unconfined large-strain compression and tension as well as indentation experiments, the fluid flow within the sample and across the boundary is not well controlled. Therefore, it may be important to redesign experimental setups in the future in order to avoid unwanted effects of the fluid flow on the measured response, especially when comparing different regions of brain tissue where there seem to be local differences in permeability. This becomes even more relevant as we observed that the fluid flow also depends on the viscoelastic properties (as discussed in detail in the next section) and such coupling effects can lead to additional effects during experiments that are rather related to different boundary conditions than the actual material properties.
4.3 Coupling Between Viscous and Porous Effects
The thorough exploration of the poro-viscoelastic parameters in our computational model confirms that the viscous and porous responses to loading are highly interrelated. Typically, we associate the fluid constituent behavior to the porous response, while the solid component is linked to the viscous one. Yet, changes in a single parameter, either linked to the viscoelastic solid (
Porous dissipation results, surprisingly, are not directly proportional to the initial intrinsic permeability (see Figure 4 center and Figure 7, row 4), but rather peak for intermediate values of K0. This hints at complex interactions between the deforming viscoelastic solid and the fluid flow behavior under loading. From a numerical perspective, and considering the definitions (11) and (12), the unexpected response can be attributed to the coupling between the pressure and displacement variables. Solid deformation and stresses are affected by a hydrostatic component due to the fluid constituent exerting pressure on the solid. At the same time, seepage velocity incorporates the effect of the deformations in the changing intrinsic permeability value to account for the “closing” of the pores under loading. However, for different values of the solid parameters and loading conditions, we observe important variations in local pressure distributions and, hence, in the gradients of pressure, which determine seepage velocity together with the intrinsic permeability. Consequently, from a computational perspective, the pressure variable is the key—and its effects are nuanced as we have repeatedly observed in our simulations.
Our results indicate that the viscoelastic solid influences the porous response to a much larger extent than the fluid constituent affects the viscous response. While the solid nominal stress shows a slight dependence on the intrinsic permeability (Figure 3 center), the accumulated viscous dissipation remains unaltered by the change in K0 (see Figure 4, left, and Figure 7, row 3). These observations are highly relevant when aiming to design experimental procedures and protocols to reliably determine poro- and viscoelastic material parameters for brain tissue. We could previously show that a combination of cylic and stress relaxation experiments under multiple loading modes are well suited to calibrate viscoelastic material parameters (Budday et al., 2017b; Budday and Steinmann, 2018). By considering multiple loading modes simultaneously, one can avoid that the optimization problem is ill-posed. To reliably calibrate poro-viscoelastic models for brain tissue, however, experimental designs need to be adopted to test the unique property of interest. Ideally, experimental setups are optimized under close consideration of the modeling framework and with the help of computational simulations. This has the advantage that the effects we have observed in the current study can be taken into account.
4.4 Perspectives and Future Directions
In this study, we have performed computational parameter studies to systematically understand the individual viscous and porous contributions to brain tissue behavior under different biomechanical testing conditions, but have not aimed at calibrating material parameters through an inverse parameter identification scheme. The reason for that is that current experimental setups and data available in the literature are not sufficient to reliably determine the model parameters. For the setups investigated here, for instance, which have previously been successfully used to calibrate viscoelastic material parameters (Budday et al., 2017b; Budday and Steinmann, 2018), porous and viscous effects are strongly coupled. This makes it difficult to uniquely identify poro-viscoelastic parameter sets. Also, previously reported viscoelastic parameters are not readily transferable. As an example, the first Lamé parameter in our poro-viscoelastic model is not equivalent to the first Lamé parameter in a single-phase viscoelastic material because ours only represents the solid component behavior, while the latter implicitly incorporates the whole tissue behavior, including the fluid contribution to the material bulk behavior. Therefore, in the future we plan to design new experimental setups and protocols, e.g., to determine the intrinsic permeability of brain tissue, under close consideration of the continuum mechanics modeling framework and systematic predictions from finite element simulations. The latter are a valuable tool to evaluate the sensitivity of certain parameters towards specific loading conditions and, like this, optimize experiments. This will eventually allow us to develop more realistic simulations for personalized medicine.
We note that we only focused on quasi-static experiments in the current work, which are relevant for applications on intermediate time scales, such as the well-known phenomenon of brain shift: When the skull is open during a neurosurgery, brain tissue immediately undergoes large deformations and “shifts” compared to the situation on preoperative images. This is a major issue in neuronavigation (Gerard et al., 2017). In the future, the model can also be adopted to study effects during further experimental setups, for instance magnetic resonance elastography (MRE) and ultrasound elastography (USE), where the brain is loaded under small strains at high frequencies. Importantly, these techniques allow for in vivo measurements. Therefore, it will be interesting to investigate, on the one hand, the capability of the model to capture the tissue behavior in this small-strain high-frequency regime, and, on the other hand, to evaluate the suitability of in vivo measurements for the calibration of biphasic, large-strain mechanical models as the one presented here. Expanding our numerical inquires to additional experimental setups will also provide a more comprehensive set of data to analyze the general sensitivity of the model parameters.
From a purely modeling perspective, it would be interesting to challenge certain assumptions made in the current form of the formulation. In particular, an alternative to Darcy’s law for the fluid behavior would likely have a significant impact on the results, especially the effect of the intrinsic permeability. For example, one could introduce a direct solid-dependence in the definition of the volume-weighted seepage velocity (11) to model stress-assisted diffusion. Regarding the well-known regional differences in brain tissue, these could be numerically investigated in several ways, e.g., with a non-isotropic permeability tensor and/or viscous evolution equation that better reflect the local microstructure of the tissue. In addition, adhesion effects could be introduced. Finally, for certain applications, it may be necessary to incorporate the effects of gravity as well as an osmotic pressure to predict swelling in the brain. The computational approach presented in this study provides a robust numerical framework on which to build increasingly sophisticated models tailored to specific applications.
Data Availability Statement
The raw data supporting the conclusions of this article will be made available by the authors, without undue reservation.
Ethics Statement
The studies involving human participants were reviewed and approved by Ethics Committee of Friedrich-Alexander-University Erlangen-Nürnberg, Germany, with approval number 405 18 B. The patients/participants provided their written informed consent to participate in this study.
Author Contributions
EC and SB conceptualized the study. PS, GAH, EC, and SB developed the model. EC implemented the initial computational code. AG implemented the numerical setups and performed the simulations. AG analyzed the computational data and prepared the figures with the help of EC. FP provided human brain tissue. NR performed the mechanical experiments and analyzed the corresponding data. AG, EC, and SB wrote the first draft. GAH, PS, EC and SB acquired funding. SB supervised the project. All authors have discussed the results, reviewed and edited the final manuscript.
Funding
We gratefully acknowledge the funding by the Deutsche Forschungsgemeinschaft (DFG, German Research Foundation) through the grants BU 3728/1-1 to SB, BU 3728/3-1—STE 544/70-1 to SB, PS and GH, as well as PA 738/15-1 to FP. This project has received funding from the European Union’s Horizon 2020 research and innovation programme under the Marie Sklodowska-Curie grant agreement No 841047 to EC.
Conflict of Interest
The authors declare that the research was conducted in the absence of any commercial or financial relationships that could be construed as a potential conflict of interest.
Publisher’s Note
All claims expressed in this article are solely those of the authors and do not necessarily represent those of their affiliated organizations, or those of the publisher, the editors and the reviewers. Any product that may be evaluated in this article, or claim that may be made by its manufacturer, is not guaranteed or endorsed by the publisher.
Acknowledgments
We cordially thank Sarah Nistler for her valuable help in performing the indentation experiments as well as Lars Bräuer and Lisa Stache for preparing the human brain.
Supplementary Material
The Supplementary Material for this article can be found online at: https://www.frontiersin.org/articles/10.3389/fmech.2021.708350/full#supplementary-material
References
Angeli, S., and Stylianopoulos, T. (2016). Biphasic Modeling of Brain Tumor Biomechanics and Response to Radiation Treatment. J. Biomech. 49, 1524–1531. doi:10.1016/j.jbiomech.2016.03.029
Arndt, D., Bangerth, W., Blais, B., Clevenger, T. C., Fehling, M., Grayver, A. V., et al. (2020). The deal.II Library, Version 9.2. J. Numer. Maths. 0 28 (3), 131–146. doi:10.1515/jnma-2020-0043
Barnes, J. M., Przybyla, L., and Weaver, V. M. (2017). Tissue Mechanics Regulate Brain Development, Homeostasis and Disease. J. Cell. Sci. 130, 71–82. doi:10.1242/jcs.191742
Bilston, L. E., Liu, Z., and Phan-Thien, N. (2001). Large Strain Behaviour of Brain Tissue in Shear: Some Experimental Data and Differential Constitutive Model. Biorheology 38, 335–345.
Budday, S., Nay, R., de Rooij, R., Steinmann, P., Wyrobek, T., Ovaert, T. C., et al. (2015a). Mechanical Properties of gray and white Matter Brain Tissue by Indentation. J. Mech. Behav. Biomed. Mater. 46, 318–330. doi:10.1016/j.jmbbm.2015.02.024
Budday, S., Ovaert, T. C., Holzapfel, G. A., Steinmann, P., and Kuhl, E. (2020). Fifty Shades of Brain: A Review on the Mechanical Testing and Modeling of Brain Tissue. Arch. Comput. Methods Eng. 27, 1187–1230. doi:10.1007/s11831-019-09352-w
Budday, S., Sommer, G., Birkl, C., Langkammer, C., Haybaeck, J., Kohnert, J., et al. (2017a). Mechanical Characterization of Human Brain Tissue. Acta Biomater. 48, 319–340. doi:10.1016/j.actbio.2016.10.036
Budday, S., Sommer, G., Haybaeck, J., Steinmann, P., Holzapfel, G. A., and Kuhl, E. (2017b). Rheological Characterization of Human Brain Tissue. Acta Biomater. 60, 315–329. doi:10.1016/j.actbio.2017.06.024
Budday, S., Sommer, G., Steinmann, P., Holzapfel, G. A., and Kuhl, E. (2017c). Viscoelastic Parameter Identification of Human Brain Tissue. J. Mech. Behav. Biomed. Mater. 74, 463–476. doi:10.1016/j.jmbbm.2017.07.014
Budday, S., Steinmann, P., and Kuhl, E. (2015b). Physical Biology of Human Brain Development. Front. Cell. Neurosci. 9, 257. doi:10.3389/fncel.2015.00257
Budday, S., and Steinmann, P. (2018). On the Influence of Inhomogeneous Stiffness and Growth on Mechanical Instabilities in the Developing Brain. Int. J. Sol. Structures 132-133, 31–41. doi:10.1016/j.ijsolstr.2017.08.010
Chatelin, S., Constantinesco, A., and Willinger, R. (2010). Fifty Years of Brain Tissue Mechanical Testing: from In Vitro to In Vivo Investigations. Biorheology 47, 255–276. doi:10.3233/bir-2010-0576
Chatelin, S., Vappou, J., Roth, S., Raul, J.-S., and Willinger, R. (2012). Towards Child versus Adult Brain Mechanical Properties. J. Mech. Behav. Biomed. Mater. 6, 166–173. doi:10.1016/j.jmbbm.2011.09.013
Chen, F., Zhou, J., Li, Y., Wang, Y., Li, L., and Yue, H. (2015). Mechanical Properties of Porcine Brain Tissue in the Coronal Plane: Interregional Variations of the corona Radiata. Ann. Biomed. Eng. 43, 2903–2910. doi:10.1007/s10439-015-1350-3
Cheng, S., and Bilston, L. E. (2007). Unconfined Compression of white Matter. J. Biomech. 40, 117–124. doi:10.1016/j.jbiomech.2005.11.004
Comellas, E., Budday, S., Pelteret, J.-P., Holzapfel, G. A., and Steinmann, P. (2020). Modeling the Porous and Viscous Responses of Human Brain Tissue Behavior. Comput. Methods Appl. Mech. Eng. 369, 113128. doi:10.1016/j.cma.2020.113128
Donnelly, B., and Medige, J. (1997). Shear Properties of Human Brain Tissue. J. Biomech. Eng. 119, 423–432. doi:10.1115/1.2798289
Ehlers, W., and Eipper, G. (1999). Finite Elastic Deformations in Liquid-Saturated and Empty Porous Solids. Transp. Porous Media 34, 179–191. doi:10.1023/A:1006565509095
Ehlers, W., and Wagner, A. (2015). Multi-component Modelling of Human Brain Tissue: a Contribution to the Constitutive and Computational Description of Deformation, Flow and Diffusion Processes with Application to the Invasive Drug-Delivery Problem. Comput. Methods Biomech. Biomed. Engin. 18, 861–879. doi:10.1080/10255842.2013.853754
Fletcher, T. L., Wirthl, B., Kolias, A. G., Adams, H., Hutchinson, P. J. A., and Sutcliffe, M. P. F. (2016). Modelling of Brain Deformation after Decompressive Craniectomy. Ann. Biomed. Eng. 44, 3495–3509. doi:10.1007/s10439-016-1666-710.1007/s10439-016-1666-7
Franceschini, G., Bigoni, D., Regitnig, P., and Holzapfel, G. A. (2006). Brain Tissue Deforms Similarly to Filled Elastomers and Follows Consolidation Theory. J. Mech. Phys. Sol. 54, 2592–2620. doi:10.1016/j.jmps.2006.05.004
Galford, J. E., and McElhaney, J. H. (1970). A Viscoelastic Study of Scalp, Brain, and Dura. J. Biomech. 3, 211–221. doi:10.1016/0021-9290(70)90007-2
Gerard, I. J., Kersten-Oertel, M., Petrecca, K., Sirhan, D., Hall, J. A., and Collins, D. L. (2017). Brain Shift in Neuronavigation of Brain Tumors: A Review. Med. Image Anal. 35, 403–420. doi:10.1016/j.media.2016.08.007
Gerischer, L. M., Fehlner, A., Köbe, T., Prehn, K., Antonenko, D., Grittner, U., et al. (2018). Combining Viscoelasticity, Diffusivity and Volume of the hippocampus for the Diagnosis of Alzheimer’s Disease Based on Magnetic Resonance Imaging. NeuroImage: Clin. 18, 485–493. doi:10.1016/j.nicl.2017.12.023
Goriely, A., Geers, M. G., Holzapfel, G. A., Jayamohan, J., Jérusalem, A., Sivaloganathan, S., et al. (2015). Mechanics of the Brain: Perspectives, Challenges, and Opportunities. Biomech. Model. Mechanobiol. 14, 931–965. doi:10.1007/s10237-015-0662-4
Gupta, S., Carrillo, F., Li, C., Pruitt, L., and Puttlitz, C. (2007). Adhesive Forces Significantly Affect Elastic Modulus Determination of Soft Polymeric Materials in Nanoindentation. Mater. Lett. 61, 448–451. doi:10.1016/j.matlet.2006.04.078
Hasan, M. M., and Drapaca, C. S. (2015). A Poroelastic-Viscoelastic Limit for Modeling Brain Biomechanics. Mater. Res. Soc. Symp. Proc. 1753, 53–59. doi:10.1557/opl.2015.111
Hemphill, M. A., Dauth, S., Yu, C. J., Dabiri, B. E., and Parker, K. K. (2015). Traumatic Brain Injury and the Neuronal Microenvironment: A Potential Role for Neuropathological Mechanotransduction. Neuron 85, 1177–1192. doi:10.1016/j.neuron.2015.02.041
Hosseini-Farid, M., Ramzanpour, M., McLean, J., Ziejewski, M., and Karami, G. (2020). A Poro-Hyper-Viscoelastic Rate-dependent Constitutive Modeling for the Analysis of Brain Tissues. J. Mech. Behav. Biomed. Mater. 102, 103475. doi:10.1016/J.JMBBM.2019.103475
Jin, X., Zhu, F., Mao, H., Shen, M., and Yang, K. H. (2013). A Comprehensive Experimental Study on Material Properties of Human Brain Tissue. J. Biomech. 46, 2795–2801. doi:10.1016/j.jbiomech.2013.09.001
Keating, C. E., and Cullen, D. K. (2021). Mechanosensation in Traumatic Brain Injury. Neurobiol. Dis. 148, 105210. doi:10.1016/j.nbd.2020.105210
Kim, H., Min, B.-K., Park, D.-H., Hawi, S., Kim, B.-J., Czosnyka, Z., et al. (2015). Porohyperelastic Anatomical Models for Hydrocephalus and Idiopathic Intracranial Hypertension. J. Neurosurg. 122, 1–11. doi:10.3171/2014.12.JNS14516
Koser, D. E., Thompson, A. J., Foster, S. K., Dwivedy, A., Pillai, E. K., Sheridan, G. K., et al. (2016). Mechanosensing Is Critical for Axon Growth in the Developing Brain. Nat. Neurosci. 19, 1592–1598. doi:10.1038/nn.4394
Linka, K., Reiter, N., Würges, J., Schicht, M., Bräuer, L., Cyron, C. J., et al. (2021). Unraveling the Local Relation between Tissue Composition and Human Brain Mechanics through Machine Learning. Front. Bioeng. Biotechnol. Submitted 9, 704738. doi:10.3389/fbioe.2021.704738
Lytton, W. W., Arle, J., Bobashev, G., Ji, S., Klassen, T. L., Marmarelis, V. Z., et al. (2017). Multiscale Modeling in the Clinic: Diseases of the Brain and Nervous System. Brain Inform. 4, 219–230. doi:10.1007/s40708-017-0067-5
MacManus, D. B., Murphy, J. G., and Gilchrist, M. D. (2018). Mechanical Characterisation of Brain Tissue up to 35% Strain at 1, 10, and 100/s Using a Custom-Built Micro-indentation Apparatus. J. Mech. Behav. Biomed. Mater. 87, 256–266. doi:10.1016/j.jmbbm.2018.07.025
MacManus, D. B., Pierrat, B., Murphy, J. G., and Gilchrist, M. D. (2017). Region and Species Dependent Mechanical Properties of Adolescent and Young Adult Brain Tissue. Sci. Rep. 7, 13729. doi:10.1038/s41598-017-13727-z
Meaney, D. F., Morrison, B., and Bass, C. D. (2014). The Mechanics of Traumatic Brain Injury: a Review of what We Know and what We Need to Know for Reducing its Societal burden. J. Biomech. Eng. 136, 021008. doi:10.1115/1.4026364
Mehrabian, A., and Abousleiman, Y. (2011). General Solutions to Poroviscoelastic Model of Hydrocephalic Human Brain Tissue. J. Theor. Biol. 291, 105–118. doi:10.1016/j.jtbi.2011.09.011
Mehrabian, A., Abousleiman, Y. N., Mapstone, T. B., and El-Amm, C. A. (2015). Dual-porosity Poroviscoelasticity and Quantitative Hydromechanical Characterization of the Brain Tissue with Experimental Hydrocephalus Data. J. Theor. Biol. 384, 19–32. doi:10.1016/j.jtbi.2015.08.001
Miller, K., and Chinzei, K. (1997). Constitutive Modelling of Brain Tissue: experiment and Theory. J. Biomech. 30, 1115–1121. doi:10.1016/s0021-9290(97)00092-4
Miller, K., and Chinzei, K. (2002). Mechanical Properties of Brain Tissue in Tension. J. Biomech. 35, 483–490. doi:10.1016/s0021-9290(01)00234-2
Murphy, M. C., Jones, D. T., Jack, C. R., Glaser, K. J., Senjem, M. L., Manduca, A., et al. (2016). Regional Brain Stiffness Changes across the Alzheimer’s Disease Spectrum. NeuroImage: Clin. 10, 283–290. doi:10.1016/j.nicl.2015.12.007
Oliver, W. C., and Pharr, G. M. (2004). Measurement of Hardness and Elastic Modulus by Instrumented Indentation: Advances in Understanding and Refinements to Methodology. J. Mater. Res. 19, 3–20. doi:10.1557/jmr.2004.19.1.3
Park, K., Lonsberry, G. E., Gearing, M., Levey, A. I., and Desai, J. P. (2018). Viscoelastic Properties of Human Autopsy Brain Tissues as Biomarkers for Alzheimer’s Diseases. IEEE Trans. Biomed. Eng. 66, 1705–1713. doi:10.1109/TBME.2018.2878555
Prange, M. T., and Margulies, S. S. (2002). Regional, Directional, and Age-dependent Properties of the Brain Undergoing Large Deformation. J. Biomech. Eng. 124, 244–252. doi:10.1115/1.1449907
Prevost, T. P., Balakrishnan, A., Suresh, S., and Socrate, S. (2011). Biomechanics of Brain Tissue. Acta Biomater. 7, 83–95. doi:10.1016/j.actbio.2010.06.035
Rashid, B., Destrade, M., and Gilchrist, M. D. (2012). Temperature Effects on Brain Tissue in Compression. J. Mech. Behav. Biomed. Mater. 14, 113–118. doi:10.1016/j.jmbbm.2012.04.005
Reiter, N., Roy, B., Paulsen, F., and Budday, S. (2021). Insights into the Microstructural Origin of Brain Viscoelasticity. J. Elasticity. doi:10.1007/s10659-021-09814-y
Terzano, M., Spagnoli, A., Dini, D., and Forte, A. E. (2021). Fluid-solid Interaction in the Rate-dependent Failure of Brain Tissue and Biomimicking Gels. J. Mech. Behav. Biomed. Mater., 104530. doi:10.1016/j.jmbbm.2021.104530
Thompson, A. J., Pillai, E. K., Dimov, I. B., Foster, S. K., Holt, C. E., and Franze, K. (2019). Rapid Changes in Tissue Mechanics Regulate Cell Behaviour in the Developing Embryonic Brain. eLife 8, e39356. doi:10.7554/eLife.39356
Van Dommelen, J., Van der Sande, T., Hrapko, M., and Peters, G. (2010). Mechanical Properties of Brain Tissue by Indentation: Interregional Variation. J. Mech. Behav. Biomed. Mater. 3, 158–166. doi:10.1016/j.jmbbm.2009.09.001
Weickenmeier, J., Butler, C., Young, P., Goriely, A., and Kuhl, E. (2017). The Mechanics of Decompressive Craniectomy: Personalized Simulations. Comp. Methods Appl. Mech. Eng. 314, 180–195. doi:10.1016/j.cma.2016.08.011
Keywords: human brain, viscoelasticity, poroelasticity, constitutive modeling, mechanical properties, biomechanical testing, indentation, finite element analysis
Citation: Greiner A, Reiter N, Paulsen F, Holzapfel GA, Steinmann P, Comellas E and Budday S (2021) Poro-Viscoelastic Effects During Biomechanical Testing of Human Brain Tissue. Front. Mech. Eng 7:708350. doi: 10.3389/fmech.2021.708350
Received: 11 May 2021; Accepted: 03 August 2021;
Published: 17 August 2021.
Edited by:
Hanxing Zhu, Cardiff University, United KingdomReviewed by:
Ralph Sinkus, INSERM U1148 Laboratoire de Recherche Vasculaire Translationnelle, FranceAlessio Gizzi, Campus Bio-Medico University, Italy
Shan Tang, Dalian University of Technology, China
Copyright © 2021 Greiner, Reiter, Paulsen, Holzapfel, Steinmann, Comellas and Budday. This is an open-access article distributed under the terms of the Creative Commons Attribution License (CC BY). The use, distribution or reproduction in other forums is permitted, provided the original author(s) and the copyright owner(s) are credited and that the original publication in this journal is cited, in accordance with accepted academic practice. No use, distribution or reproduction is permitted which does not comply with these terms.
*Correspondence: Ester Comellas, ester.comellas@upc.edu; Silvia Budday, silvia.budday@fau.de
 Alexander Greiner
 Nina Reiter
 Friedrich Paulsen
 Gerhard A. Holzapfel
 Paul Steinmann1,6
  Ester Comellas
 Silvia Budday