Detection technology application based on spectral subtraction and vibro acoustic principle in the measurement of ship reliability level
 Hongyu Jin
- Hangzhou Applied Acoustics Research Institute, Hangzhou, China
Introduction: As an important part of ship manufacturing, parts are of great significance in the calculation of its reliability level.
Methods: To achieve rapid damage detection of ship parts, a method for measuring the reliability level of ship casting and forging parts based on spectral subtraction and vibration-acoustic principles was proposed. This method improves the spectral subtraction method by adding a percussion vibration signal and time-frequency analysis, and uses the principle of resonance acoustics to complete the construction of the test platform to obtain the natural frequency of the part and achieve non-destructive testing of the part.
Results: The results show that using the Fabric data set as the task data set for experiments, the accuracy of the research method is 98.54%; the uncertainty is 5.58; the sensitivity detection is 0.26 μm. In the comparison of the spectrogram of the sound signal after noise reduction, this method has fewer yellow spots remaining on the spectrogram of the noise reduction sound signal, and almost no excess noise remains. In the comparison of modal simulation data of ship parts, the maximum relative error between the simulation data obtained by this method and the natural frequency value obtained from the experimental data is 2.3%, and there is no value exceeding 2.5%, so the error is small.
Discussion: The above results show that this method can obtain more accurate natural frequencies of parts, can effectively calculate the reliability level of ship casting and forging parts, and provides a new method reference for the safe operation of ships.
1 Introduction
With the rapid advancement of the global shipping industry and modern technology, the Internet era has begun to arrive, and intelligent manufacturing technology has begun to be widely used in various fields. As an important manufacturing industry in my country, the shipbuilding industry’s parts reliability level plays a vital role in ensuring maritime traffic safety, improving transportation efficiency, and reducing operating costs (Danjuma et al., 2022; Chauhan et al., 2024a). However, during long-term maritime voyages, ships will inevitably be affected by various environmental factors, leading to structural damage and performance degradation. At the same time, ship manufacturing is inseparable from tens of thousands of parts, and its reliability must be reflected in the quality of the parts. However, in the parts that make up the ship, manufacturing defects such as inclusions, shrinkage holes and cracks are still difficult to avoid, which can easily have serious adverse effects on the safety of the ship (Liu et al., 2021a). Therefore, how to accurately evaluate the reliability level of ship manufacturing parts and promptly discover potential safety hazards has become an urgent problem in the shipping field. Traditional detection technology mainly relies on manual inspection and maintenance. This method has low detection efficiency and is difficult to monitor the ship’s operating status in real time (Vashishtha et al., 2021). For another example, in the current inspection methods, ultrasonic imaging technology is difficult to clearly image parts with complex structures, while other inspection methods such as X-rays have problems such as being too costly or time-consuming (Vashishtha and Kumar, 2023). In recent years, with the advancement of acoustic signal processing technology, detection technology based on vibroacoustic principles has begun to become a research hotspot. At the same time, Spectral Subtraction (Spectral Subtraction, SS), as an effective part noise suppression technology, has been widely used in related fields such as acoustic signal processing, but its application in ship parts reliability testing is still in its infancy. In view of this, the research innovatively improved the traditional SS method, and combined with the principles of vibroacoustics to form a new rapid detection technology, which is expected to further improve the ship reliability level measurement effect.
The novelty of the experiment is to use a test platform built based on vibroacoustic principles to obtain the natural frequencies of ship parts; then the SS method is improved, and the SS method is used to reduce the noise of the acoustic vibration signals generated by the parts to improve the noise detection of ship parts accuracy and real-time.
The main contribution of the experiments can be divided into two parts. First, the SS method and vibroacoustic principles are combined to optimize the characteristics of reliability assessment of ship manufacturing parts, and a set of innovative testing processes and methods are proposed to effectively improve the accuracy of ship parts reliability level measurement. Second, theory and practice are combined to verify the detection effect of parts production at different scales.
The research consists of four main sections. The first section provides an overview of the current domestic and international status regarding the reliability level of mechanical operations, SS techniques, and the application of resonance acoustics principles. The second section focuses on constructing an experimental platform using resonance acoustics and implementing the improved SS method to evaluate the effectiveness of ship parts detection. The third section involves the analysis of the performance and practical application effects of the developed detection platform. Finally, in the fourth section, a comprehensive summary and evaluation of the performance and practical application effects of the research institute’s built platform are presented.
2 Related works
With the advancement of science and technology, vibroacoustics and SS techniques have found extensive applications across various domains. Denisov MS et al. proposed a noise model based on an optimal recursive filtering algorithm to address the complexity introduced by harmonic noise in source data processing. This method successfully eliminated harmonic noise through SS and realized noise model prediction for different order harmonics. In the practical application of vibroseis data, the algorithm effectively separated harmonic noise, demonstrating its efficacy (Denisov et al., 2021). Li C. et al. (2021a) introduced SS as a solution for music noise reduction, incorporating an optimized iterative SS. This approach processed the noise signal of each frame by leveraging the correlation between different frames. The noise was subsequently classified into speech frames and mute frames using a predetermined threshold. Experimental results revealed that this method outperformed most baseline methods, particularly at low SNR (Signal-Noise Ratio, SNR) levels (Li C. et al., 2021a). In the field of petroleum seismic exploration, Li Z. et al. (2021b) conducted research on the repeated removal process of seismic waves, which proved crucial for underground structure imaging. They treated adaptive SS as a nonlinear problem and minimized network parameters during training to mitigate overfitting. Through testing on a data set, their method achieved a remarkable 20.5 dB improvement in SNR, confirming the effectiveness of their research (Li Z. et al., 2021b). Yadav and Mehta (2021) discussed the impact of DC bias in DC transmission lines on transformers, leading to increased noise and vibration. To address this, they developed an expansion model for high voltage DC converter transformers based on vibroacoustics and analyzed the model accordingly. Through various optimization techniques, they enhanced the fitting process to obtain the most suitable method (Yadav and Mehta, 2021).
With the continuous advancement of vibroacoustics and SS, these techniques have demonstrated significant advantages in mechanical fault detection. Pang et al. (2022) proposed a fault damage detection technology for rolling bearings based on vibroacoustics. By introducing mode decomposition recording in vibroacoustics, they successfully extracted characteristic components from composite signal components, resulting in enhanced analysis capabilities compared to other advanced resonance analysis and detection technologies (Pang et al., 2022). Liu Y et al. presented an online method for power transistor fault detection based on vibroacoustics. They utilized a mathematical model based on vibration acoustics to solve the driving signal, enabling fault type identification through actual state comparison. Experimental results showcased the broader diagnostic range of this method (Liu and Wang, 2021). Kyriakos et al. (2022) introduced an innovative unsupervised subspace fault detection approach. Leveraging vibroacoustics, robust damage detection was conducted by deploying vibration response sensors under unquantifiable conditions. This method effectively eliminated the interference of human factors and demonstrated a simple and automatic performance. In comparison to other robust damage detection methods, it exhibited excellent detection capabilities (Kyriakos et al., 2022). Vashishtha’s team proposed a single-valued cross-entropy method (ACMD) based on adaptive chirp mode decomposition to diagnose centrifugal pump impeller defects. The ACMD method can help select prominent models to enhance their own performance. The results show that the performance of this method is significantly superior to other traditional techniques (Vashishtha et al., 2022). Vashishtha et al. proposed a fault diagnosis method based on improved wavelet transform to analyze the health status of the impact wheel. During the experiment, principal component analysis based on expectation maximization and extreme learning machine were used to reduce the dimensionality of the feature matrix, and other artificial intelligence methods were combined to eliminate redundant data generated by the impact wheel. The data shows that the calculation time of training and testing of this method is small, and it has high detection accuracy (Vashishtha and Kumar, 2022). In order to analyze the friction force experienced by titanium alloy during wear, Chauhan and other scholars proposed a detection technology based on the improved lobster algorithm and support vector machine. The experiment selected the CEC2014 benchmark function to conduct quantitative and qualitative analysis of the algorithm. The results showed that the overall accuracy of friction detection by the algorithm was greater than 95%, and the calculation time was only 26.85 s (Chauhan et al., 2024b). Researchers such as Chauhan proposed improving the slime mold algorithm and evolutionary algorithm in parallel and serial ways. After the improvement, the global search capabilities and efficiency of these two algorithms are significantly improved, and their performance is very superior (Chauhan and Govind Vashishtha, 2023).
In conclusion, besides its application in noise removal, SS and vibroacoustics demonstrate robust exploration and analysis capabilities in the field of fault detection. While previous research has yielded some results, there is a scarcity of studies focusing on ship parts detection, which plays a crucial role in enhancing ship reliability and safety. Consequently, a novel detection technology based on SS and vibration acoustics is proposed to address this gap. This technology aims to detect mechanical parts of ships and improve the overall level of ship reliability.
3 Reliability level detection technology of ship parts based on spectral subtraction and vibro acoustic principle
With the rapid development of China’s economy, the shipbuilding industry has experienced significant growth. As a result, enterprises have gained increased purchasing power, and both buyers and manufacturers have raised their quality standards for ships. Consequently, effectively detecting the reliability level of ships has become a top priority. In light of this context, a detection technology based on SS and the vibration principle is proposed. This innovative approach aims to achieve rapid and accurate nondestructive detection of ship reliability levels, meeting the growing demand for high-quality ships in the industry.
3.1 Experimental detection technology based on vibro acoustic principle
Nondestructive testing technology refers to a method of inspection and testing that relies on modern technology and instruments. It involves analyzing changes in the response of materials, parts, and equipment without causing damage or affecting the performance and internal structure of the tested object. Vibration is inherent in various aspects of daily life and is particularly prevalent in mechanical fields such as automobile and ship manufacturing (Festa et al., 2021). Recognizing the significance of this phenomenon and the need to mitigate its negative effects, numerous scholars have delved into the study of mechanical vibration and vibration systems. As an illustration, let’s consider a single-degree-of-freedom system, where the primary forces acting upon it are depicted in Figure 1.
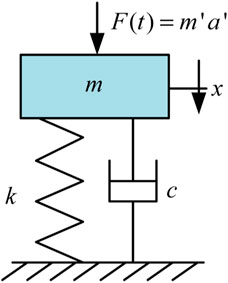
Figure 1. Schematic diagram of object SDOF.
In Figure 1,
In Eq. 1,
In Eq. 2,
In Eq. 3,
In Eq. 4, the obtained frequency formula is actually a
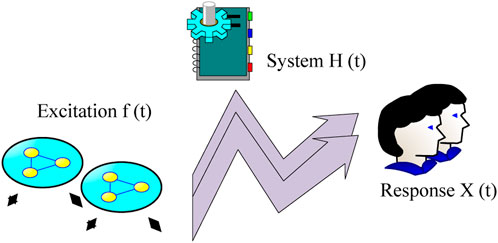
Figure 2. Experimental modal analysis.
In Figure 2, it can be observed that during experimental modal analysis, it is essential to collect complete sets of data pertaining to system excitation and response. By utilizing this comprehensive input and output information for parameter identification, the frequency response function can be obtained, followed by the determination of modal parameters. Equation 5 is the specific expression representing the relationship.
In Eq. 5,
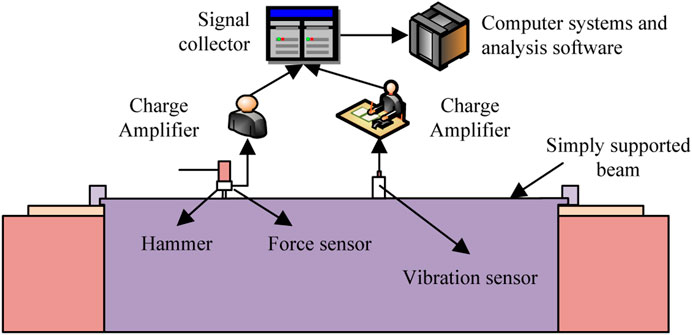
Figure 3. Example of figure consisting of multiple charts.
On the basis of all the above experiments, ANSYS, abaqus, and other simulation software are used to carry out modal analysis experiments. The ultimate purpose is to obtain the natural frequency of ship reliability (Sudo et al., 2021). For a continuous initial signal, the calculation obtained by Short-Time Fourier Transform (STFT) is shown in Eq. 6.
In Eq. 6,
In Eq. 7,
3.2 Noise reduction method design for ship reliability acoustic vibration signal
The research conducted on the Vibroacoustic nondestructive testing reliability platform, which utilizes the hammering method to obtain the natural frequency of parts, focuses on analyzing the sound signals captured by high-precision microphones.
However, during the actual quality inspection of ship parts, various types of interference may be present, necessitating the implementation of suitable methods to mitigate noise and enhance the quality of acoustic vibration signals. In this regard, SS is introduced as a noise reduction technique. Considering that the acoustic signal generated by knocking in the production process of ship parts constitutes a non-stationary and time-varying signal, it is necessary to perform framing to appropriately process the signal. It is assumed that in one frame,
In Eq. 8,
In Eq. 9,
In the process of ship parts manufacturing and production, sound signal quality is closely related to frequency amplitude spectrum generated by the parts, and there is no obvious relationship with frequency phase diagram. Therefore, this study retains the frequency phase spectrum of initial sound signal to replace frequency phase spectrum of pure sound signal, and then estimates power spectrum of the noise. The expression of noise reduction processing for sound signal is shown in Eq. 11.
In Eq. 11,
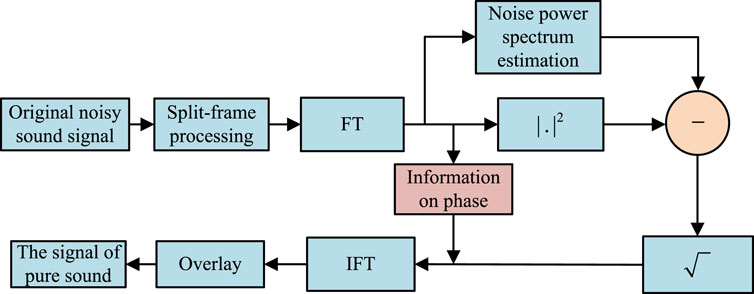
Figure 4. Noise reduction process.
In Figure 4, during the production of ship parts, when applying the SS method for noise reduction, certain challenges may arise, such as the occurrence of noise residue due to overestimation of the noise spectrum. Additionally, issues like “music noise” can occur when the noise level is too low. To address these concerns, the parameters are optimized based on an enhanced SS method and a platform noise reduction module that effectively mitigates noise interference is developed.
To overcome the problems of noise residue and “music noise”, an improved SS is proposed. The formula for resolving the negative value issue resulting from excessive noise reduction using the improved SS is presented in Eq. 12.
In the process of noise reduction using improved method, over subtraction factor and threshold parameter of the lower spectral limit are introduced to reduce residual noise and reduce “music noise” perception. Equation 13 is the noise reduction formula after introducing factors.
In Eq. 13,
In Eq. 14,
By introducing the over subtraction factor to increase the subtraction of noise spectrum, and limiting minimum value of spectrum to
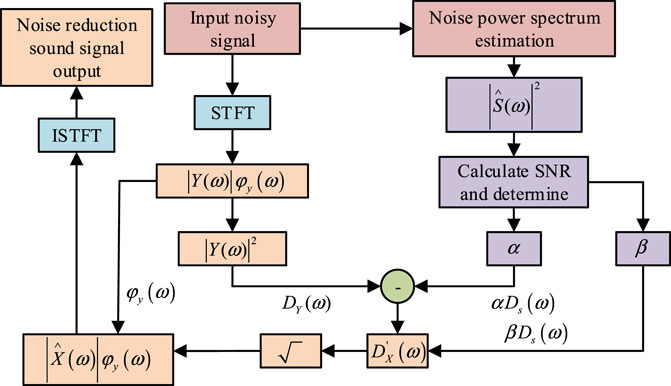
Figure 5. Basic process of improved SS.
4 Measurement model performance test and application effect of ship parts’ detection reliability level
Parts are important in reliability level of ship operation. To better analyze functions of prepared ship parts detection experimental platform, this section discusses the performance of the ship parts detection experimental platform and the application value of the platform.
4.1 Reliability level calculation model performance test for ship parts inspection
A ship is a complex floating structure that encounters various dynamic and static loads, including waves, wind, cargo loads, machinery, and more. The condition of individual structural components within a ship plays a vital role in ensuring its overall reliability. To enhance the detection and assessment of a ship’s structure and reliability, the experiment involves gathering historical data related to maintenance, repairs, and accidents of the ship. Through the application of failure mode and effect analysis, key structures and potential failure modes of the ship are identified, enabling a comprehensive understanding of its integrity.
After the optimization of the reliability level measurement system for ship parts detection, it is necessary to compare the performance of the research algorithm in the actual operation process to test its effectiveness. To ensure fairness and rationality of overall process, Spectral Subtraction (Spectral Subtraction, SS), the Improved Wavelet Transform (IWT), and the methods and research methods in literature (Liu et al., 2021b) were selected for performance comparison. Except for the special experimental parameters, the experimental parameters of all other algorithms are the same as those of the research method. The number of iterations of all algorithms is set to 150, and then the performance of different models is analyzed based on the German dagm-2007 data set and fabric data set. The convergence of four different algorithms is shown in Figure 6.
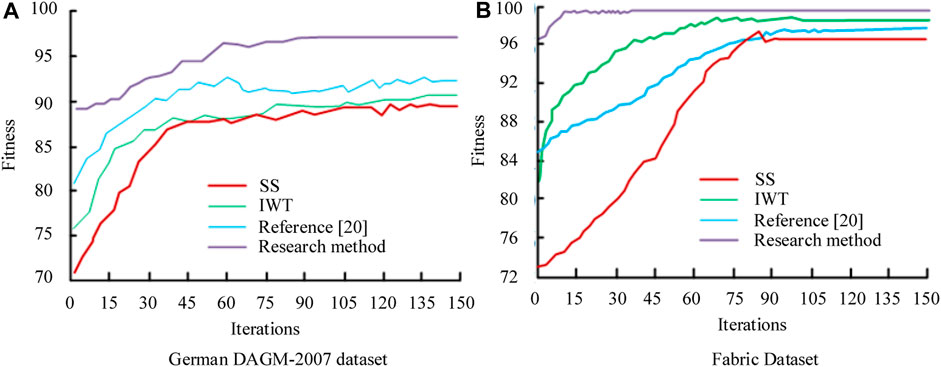
Figure 6. Comparison of convergence of four algorithms running on different datasets.
Figure 6A shows the convergence comparison on the dagm-2007 data set in Germany. As iterations of the system increased, the fitness of all algorithms showed an increase in varying degrees, accompanied by the upward and downward fluctuation of the curve. When the iteration runs to 150 times, SS, IWT and literature (Liu et al., 2021b) do not reach a stable change trend. When the iteration runs to 91 times, the maximum fitness value of the research method is 97.2, and then it keeps stable operation. Figure 6B shows the experiment of convergence on the fabric data set. During the operation of the system, the fitness values of all algorithms change rapidly and tend to be stable within 100 generations of iteration. When the iteration runs 15 times, the fitness value of the research method starts to approach 99.9; When the operation times are 105, 110 and 89 respectively, the fitness values of IWT, literature (Liu et al., 2021b) and SS methods begin to tend to be stable, which are less than the research methods. In summary, the research method has the highest fitness value and faster convergence.
Then, the German dagm-2007 data set is used as the main data set to expand the performance test, and the accuracy and recall rates of the four algorithms are compared. The specific PR (Precision Recall) line is shown in Figure 7.
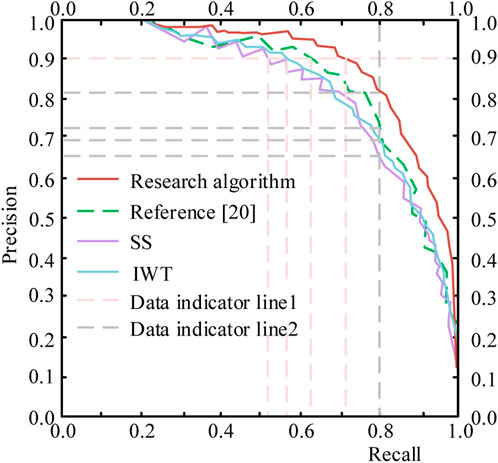
Figure 7. PR curve changes corresponding to four algorithms.
The comparison of PR curves in Figure 7 shows that when the accuracy rate of the algorithm is 0.900, the recall rate of the corresponding research method is 0.712; The recall rates of SS, IWT and literature (Liu et al., 2021b) were 0.532, 0.585, and 0.632, respectively. On the contrary, when the recall rate of all models is 0.800, the accuracy rate of the corresponding research method is 0.821; The accuracy rates of SS, IWT and literature (Liu et al., 2021b) were 0.667, 0.698, and 0.724, respectively. The results above show that when the accuracy rate or recall rate is the same value, recall rate and accuracy rate of the research method are the largest. This also means that the research method has a higher accuracy in the optimal selection of the reliability level measurement system for ship parts detection, and can provide a more comprehensive service for ship parts detection. At the same time, a higher recall rate can improve the overall utilization rate of ship reliability level measurement in the market.
The research compares the reliability detection accuracy, uncertainty, sensitivity and confidence interval of different models under the fabric (Fabric) data set test, as shown in Table 1.
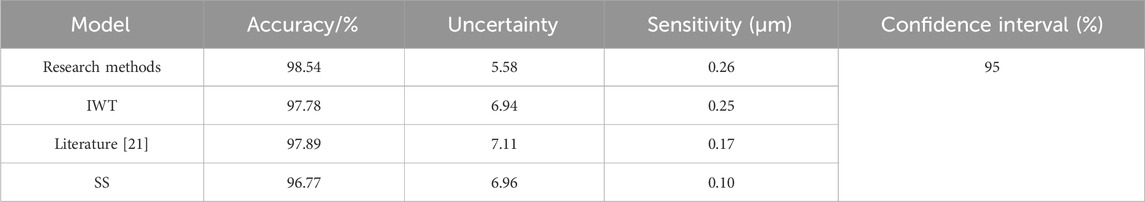
Table 1. Comparison of four indicators of different models.
As shown in Table 1, under the fabric (Fabric) data set test, the accuracy of the research method is 98.54%; the uncertainty is 5.58; the sensitivity detection is 0.26 μm; the confidence intervals of the four algorithms are all 95%. Among the other three algorithms, the IWT algorithm has the best performance. The accuracy of this algorithm is 97.78%, the uncertainty is 6.94, and the sensitivity is 0.25 μm. The accuracy of the literature [21] and the SS method are 97.89% and 96.77% respectively, which is far less than the accuracy of the method constructed in the study. From the comparison, it can be seen that the research method has a higher accuracy in detecting ship parts, and the correct prediction of parts detection accounts for a larger proportion, which is consistent with the change trend of the PR curve, which further proves that the research method can maintain good robustness during operation.
To more comprehensively verify the robustness of the constructed method, the Fabric data set was then used as the main task data set to analyze the F1 values of the four algorithms for comparison. The results are shown in Figure 8.
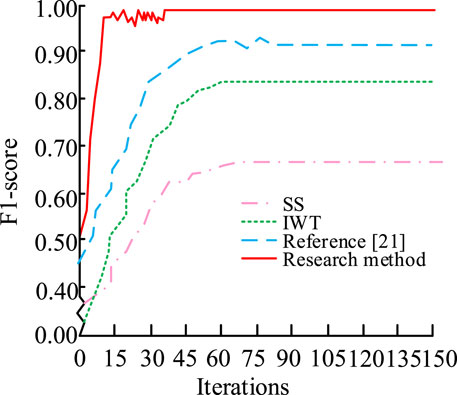
Figure 8. Comparison of F1 values of four algorithms.
As can be seen in Figure 8, as the number of iterations increases, the F1 value of the research method has always been at the maximum, approaching 1.00. And the F1 value is greater than 0.5 at the beginning of the iteration. The F1 values of the remaining three algorithms have always been smaller than the research method, and the values fluctuated greatly. The final F1 value was also far smaller than the F1 value of the research method. This shows that the error in ship parts detection under the operation of the research method is small and has excellent robustness.
4.2 Reliability level detection model application effect for ship parts
To simulate environmental noise during the actual operation of the ship, this study mixes the blower, voice dialogue and low amplitude high-frequency noise to briefly simulate the industrial noise that will appear on the assembly line of the ship parts quality inspection workshop, and uses the research method for noise reduction. To carry out regular testing and evaluation of ship parts smoothly, this experiment selects Ultrasonic Testing (UT) and Radiographic Testing (RT) to assist in testing the reliability level of ship parts. In the reliability level detection of ship parts, the application of high-frequency eigenmode or modal analysis can provide engineers and maintenance personnel with the location of ship cracks and defects, ship material degradation, contact and friction problems, and loosening of bolt joints Interference with parts, etc. In conclusion, high-frequency eigenmode or modal analysis provides an effective tool for reliability level detection of ship components and can help diagnose various potential structural and material problems. The research method is applied to noise reduction in the actual environment. The sound signal waveform changes before and after SS noise reduction are shown in Figure 9.
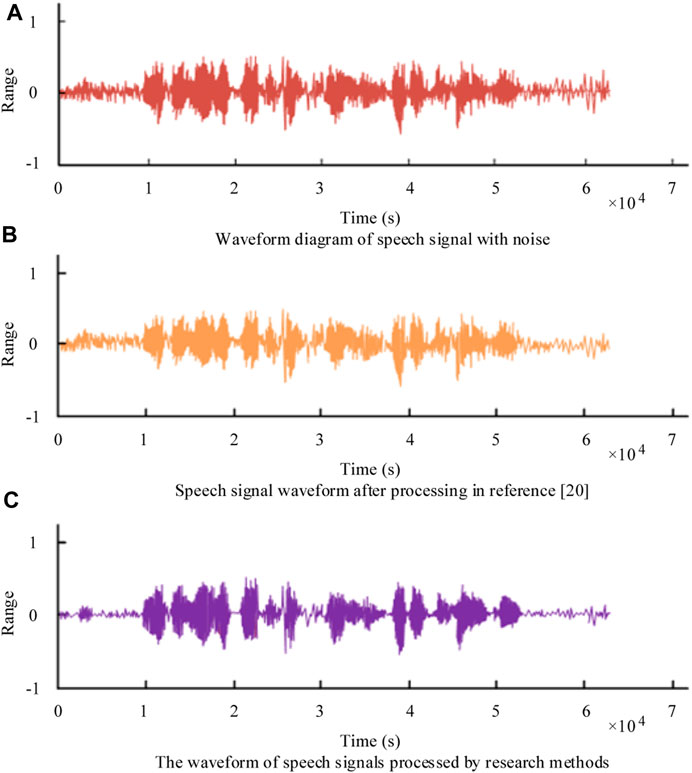
Figure 9. Sound signal waveform before and after SS processing.
Figure 9A is a noise-free speech signal; Figure 9B is a noisy speech signal; Figure 9C is the spectrogram of the noise-reduced speech signal. Comparing the three spectrograms, it can be found that the spectrogram obtained after using the improved spectral subtraction method to de-noise the sound signal has fewer residual yellow spots and almost no excess noise remains. This shows that the research method is significantly better than the noise speech signal processing effect. This may be because this research method uses vibroacoustic principles to preprocess noise before noise reduction.
Meanwhile, to more accurately show the advantages of the research method, improved SS method can compare spectrograms of noise-reduced sound signals, as shown in Figure 10.
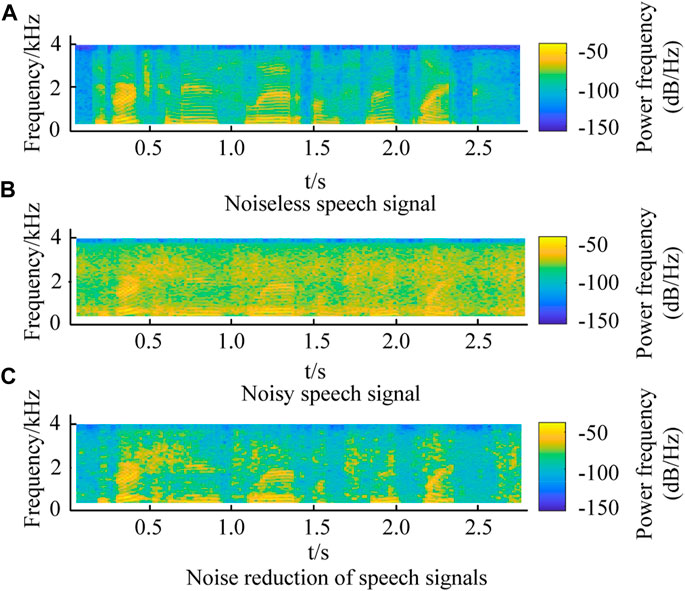
Figure 10. Comparison of speech spectrum of sound signal after noise reduction of research method.
Figure 10A is a noise-free speech signal; Figure 10B is a noisy speech signal; Figure 10C is the spectrogram of the speech signal after noise reduction. Comparing the three spectrograms, it can be found that the spectrogram obtained after using the improved spectral subtraction method to de-noise the sound signal has fewer residual yellow spots and almost no excess noise remains. This shows that the research method is significantly better than the noise speech signal processing effect. This may be because this research method uses vibroacoustic principles to preprocess noise before noise reduction. Using the sound function in MATLAB to monitor and detect the signal, it can be found that the sound signal after the improved SS de-noising basically has no noise residue and “music noise”. Results show that improved SS has high feasibility in noise reduction. Figure 11 shows the time domain comparison of three kinds of knocking signals.
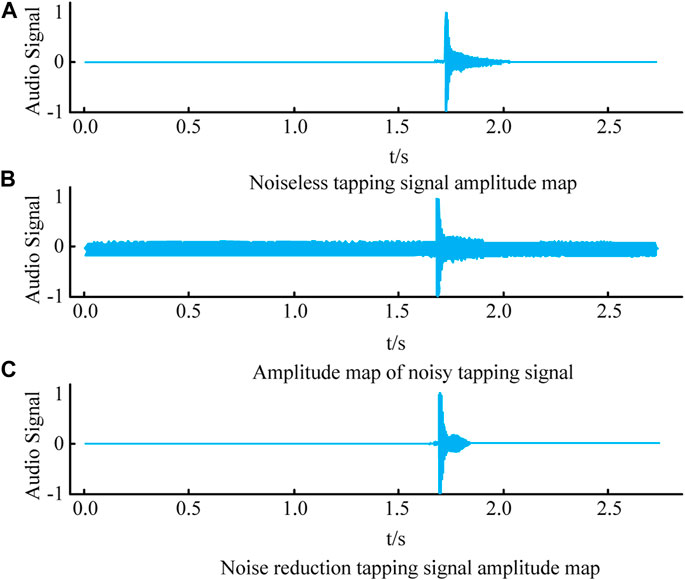
Figure 11. Time domain comparison of three different knocking signals.
Figure 11A is the amplitude diagram of the noiseless tapping signal; Figure 11B is the amplitude diagram of the noise tapping signal; Figure 11C is the amplitude diagram of the noise-reduced tapping signal. It can be found that the amplitude of the noise in the sound signal after noise reduction processing has been reduced to a very low level, and there is basically no difference compared with the noiseless tapping signal. This means that the research method has eliminated most of the noise signals. From the above results, research method has superior detection performance for ship parts detection, and can realize the accurate detection of parts through noise reduction, so as to ensure the calculation of ship reliability level. Finally, the modal simulation data of ship parts are compared with the experimental data through the experimental platform. Based on the above experimental results, this experiment generates simulation data by fitting the model to the existing data and using the model to predict the future situation.
In the experiment, six structural elements including ship deck, mast, keel, cabin, propeller and double bottom were selected for natural frequency detection. The specific results obtained are shown in Table 2.
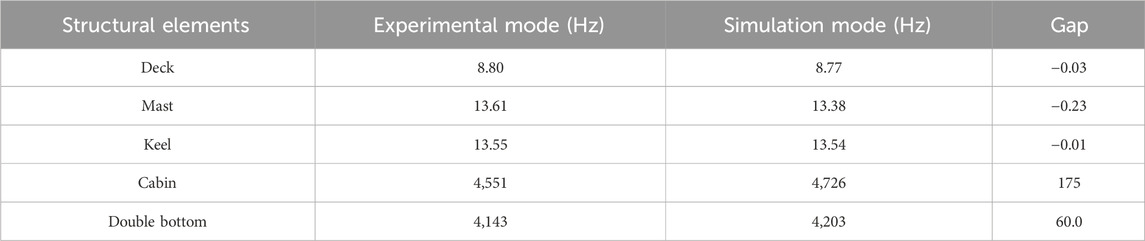
Table 2. Comparison of experimental data and simulation data.
As shown in Table 2, the difference between the natural frequencies obtained by the simulation data and the experimental data is small, and the smallest natural frequency difference is the keel component of the ship, and the natural frequency difference is only 0.01; and the largest natural frequency difference is for the double bottom element of the ship, the natural frequency difference is 60.00. At the same time, due to the inevitable errors in the process of modeling, it can be considered that the ship parts detection platform under the research method can obtain the accurate natural frequency of parts and ensure structure reliability level in the process of ship operation.
The natural frequency obtained in the experiment is relatively high. For ship components, the high natural frequency may mean that the component is not easy to enter the resonance state when it is subjected to common external disturbances (such as waves, wind, etc.), which is beneficial. However, that doesn't mean detecting tiny flaws on ship components isn't useful. Here are a few reasons: First, the natural frequency of a part may change over time due to environmental factors, material aging, or other reasons. These changes can be accelerated if a tiny defect exists on a part. Second, although natural frequency is an important parameter, there are many other factors that need to be considered when evaluating the performance and integrity of ship components. This also means that even if the natural frequencies of the experimentally detected ship parts are high, it still makes sense to regularly inspect the parts and repair minor defects.
5 Conclusion
The advancement of ship intelligence has raised the bar for calculating its reliability level. Firstly, addressing issues like noise residue and “music noise” resulting from traditional SS noise reduction, we optimized parameters and constructed a platform noise reduction module. An oversubtraction factor is introduced to increase the subtraction of the noise spectrum, effectively reducing the perception of “music noise.” Additionally, a nondestructive testing test platform is developed by combining the hammering method and the principle of resonance acoustics, enabling rapid detection of ship parts. The results show that in the German DAGM-2007 data set, the proposed method has a maximum fitness value of 97.2 when iterations are run to 91 times. In the time domain comparison of different tapping signals, the amplitude of the noise in the sound signal processed by this method has been reduced to a very low level, and there is basically no difference compared with the noiseless tapping signal. In the comparison of simulation data and experimental data, the relative errors of this method are all below 2.5%. The above results all show that the proposed method is more accurate in the optimization selection of ship parts inspection reliability level measurement system; it can reduce time costs and resource costs, is suitable for rapid inspection and production of different parts batches, and helps to promote ship parts Realistic developments in the parts industry. However, the current experiments have only completed relevant tests in the laboratory, and have not conducted research on the effects of actual factory environment, temperature, noise, and vibration. The real environment may be more complicated. Therefore, in the future implementation process, corresponding changes must be made according to the actual environment. At the same time, various situations will occur during the actual operation of ships, and subsequent research can also be conducted on the reliability of ship parts for different autonomous navigation.
Data availability statement
The original contributions presented in the study are included in the article/Supplementary Material, further inquiries can be directed to the corresponding author.
Author contributions
HJ: Conceptualization, Data curation, Formal Analysis, Funding acquisition, Investigation, Methodology, Project administration, Resources, Software, Supervision, Validation, Visualization, Writing–original draft, Writing–review and editing.
Funding
The author(s) declare that no financial support was received for the research, authorship, and/or publication of this article.
Conflict of interest
The author declares that the research was conducted in the absence of any commercial or financial relationships that could be construed as a potential conflict of interest.
Publisher’s note
All claims expressed in this article are solely those of the authors and do not necessarily represent those of their affiliated organizations, or those of the publisher, the editors and the reviewers. Any product that may be evaluated in this article, or claim that may be made by its manufacturer, is not guaranteed or endorsed by the publisher.
References
Chauhan, S., and Govind, V. (2023). A synergy of an evolutionary algorithm with slime mould algorithm through series and parallel construction for improving global optimization and conventional design problem. Eng. Appl. Artif. Intell. 118, 105650. doi:10.1016/j.engappai.2022.105650
Chauhan, S., Vashishtha, G., Gupta, M. K., Korkmaz, M. E., Demirsöz, R., Noman, K., et al. (2024b). Parallel structure of crayfish optimization with arithmetic optimization for classifying the friction behaviour of Ti-6Al-4V alloy for complex machinery applications. Knowledge-Based Syst. 286, 111389. doi:10.1016/j.knosys.2024.111389
Chauhan, S., Vashishtha, G., Kumar, R., Zimroz, R., Gupta, M. K., and Kundu, P. (2024a). An Adaptive feature mode decomposition based on a novel health indicator for bearing fault diagnosis. Measurement 226, 114191. doi:10.1016/j.measurement.2024.114191
Danjuma, M. U., Yusuf, B., and Yusuf, I. (2022). Reliability, availability, maintainability, and dependability analysis of cold standby series parallel system. J. Comput. Cognitive Eng. 1 (4), 193–200. doi:10.47852/bonviewjcce2202144
Denisov, M. S., Egorov, A., and Shneerson, M. B. (2021). Optimization-based recursive filtering for separation of signal from harmonics in vibroseis. Geophys. Prospect. 69 (4), 779–798. doi:10.1111/1365-2478.13084
Festa, M., Tower, F., Tavornmas, A., and Gauterin, F. (2021). Human response to vehicle vibrations and acoustics during transient road excitations. Vibration 4 (2), 357–368. doi:10.3390/vibration4020023
Kyriakos, V. S., Spilios, F., and John, S. (2022). An automated hypersphere-based healthy subspace method for robust and unsupervised damage detection via random vibration response signals. Struct. Health Monit. 21 (2), 465–484. doi:10.1177/14759217211004429
Li, C., Jiang, T., and Wu, S. (2021a). Single-channel speech enhancement based on improved frame iterative spectral subtraction in the modulation domain. China Commun. China Commun. 18 (9), 100–115. doi:10.23919/jcc.2021.09.009
Li, Z., Sun, N., Gao, H., Qin, N., and Li, Z. (2021b). Adaptive subtraction based on u-net for removing seismic multiples. Ieee Trans. Geoscience Remote Sens. 59 (11), 9796–9812. doi:10.1109/tgrs.2021.3051303
Liu, J., Xu, M., Zhang, X., Yan, R., and Chen, X. (2021a). Fast multiline spectral reshaping algorithm for active vibration control. J. Low Freq. Noise, Vib. Act. Control 40 (1), 481–496. doi:10.1177/1461348419886745
Liu, J., Xu, M., Zhang, X., Yan, R., and Chen, X. (2021b). Fast multiline spectral reshaping algorithm for active vibration control. J. Low Freq. Noise, Vib. Act. Control 40 (1), 481–496. doi:10.1177/1461348419886745
Liu, Y., and Wang, R. (2021). Fault diagnosis of power transistors in a power converter of SRM drive based on a state inverse solution. Iet Electr. Power Appl. 15 (3), 231–242. doi:10.1049/elp2.12018
Pang, B., Nazari, M., Sun, Z., Li, L., and Tang, G. (2022). An optimized variational mode extraction method for rolling bearing fault diagnosis. Struct. Health Monit. 21 (2), 558–570. doi:10.1177/14759217211006637
Sudo, Y., Itoyama, K., Nishida, K., and Nakadai, K. (2021). Multichannel environmental sound segmentation: with separately trained spectral and spatial features. Appl. Intell. Int. J. Artistic Intell. Neural Netw. Complex Problem Solving Technol. 51 (11), 8245–8259. doi:10.1007/s10489-021-02314-5
Tsalera, E., Papadakis, A., and Samarakou, M. (2021). Novel principal component analysis-based feature selection mechanism for classroom sound classification. Comput. Intell. 37 (4), 1827–1843. doi:10.1111/coin.12468
Vashishtha, G., Chauhan, S., Singh, M., and Kumar, R. (2021). Bearing defect identification by swarm decomposition considering permutation entropy measure and opposition-based slime mould algorithm. Measurement 178, 109389. doi:10.1016/j.measurement.2021.109389
Vashishtha, G., Chauhan, S., Yadav, N., Kumar, A., and Kumar, R. (2022). A two-level adaptive chirp mode decomposition and tangent entropy in estimation of single-valued neutrosophic cross -entropy for detecting impeller defects in centrifugal pump. Appl. Acoust. 15, 197. doi:10.1016/j.apacoust.2022.108905
Vashishtha, G., and Kumar, R. (2022). Pelton wheel bucket fault diagnosis using improved shannon entropy and expectation maximization principal component analysis. J. Vib. Eng. Technol. 10, 335–349. doi:10.1007/s42417-021-00379-7
Vashishtha, G., and Kumar, R. (2023). Unsupervised learning model of sparse filtering enhanced using wasserstein distance for intelligent fault diagnosis. J. Vib. Eng. Technol. 11 (7), 2985–3002. doi:10.1007/s42417-022-00725-3
Keywords: vibration acoustics, spectral subtraction, ships, reliability level, part inspection, resonance acoustics, non-destructive testing, natural frequency
Citation: Jin H (2024) Detection technology application based on spectral subtraction and vibro acoustic principle in the measurement of ship reliability level. Front. Mech. Eng 10:1378166. doi: 10.3389/fmech.2024.1378166
Received: 29 January 2024; Accepted: 07 March 2024;
Published: 25 March 2024.
Edited by:
Govind Vashishtha, Wrocław University of Science and Technology, PolandReviewed by:
Sumika Chauhan, National Institute of Technology Delhi, IndiaPardeep Saini, Sant Longowal Institute of Engineering and Technology, India
Copyright © 2024 Jin. This is an open-access article distributed under the terms of the Creative Commons Attribution License (CC BY). The use, distribution or reproduction in other forums is permitted, provided the original author(s) and the copyright owner(s) are credited and that the original publication in this journal is cited, in accordance with accepted academic practice. No use, distribution or reproduction is permitted which does not comply with these terms.
*Correspondence: Hongyu Jin, 18758554455@163.com