Spiking signatures of spontaneous activity bursts in hippocampal cultures
- 1 Department of Neurodynamics and Neurobiology, Lobachevsky State University of Nizhny Novgorod, Nizhny Novgorod, Russia
- 2 Laboratory of Nonlinear Processes in Living Systems, Institute of Applied Physics RAS, Nizhny Novgorod, Russia
- 3 Normal Physiology Department, Nizhny Novgorod State Medical Academy, Nizhny Novgorod, Russia
Dense dissociated hippocampal cultures are known to generate spontaneous bursting electrical activity which can be recorded by multielectrode arrays. We have analyzed spatio-temporal profiles of the distribution of spikes in the bursts recorded after 2 weeks in vitro. We have found a statistically significant similarity between the spiking patterns in sequential bursting events, we refer to these spiking patterns as spiking signatures. Such spiking signatures may appear in different parts of the bursts, including the activation patterns – the first spike times in the bursts, and deactivation patterns – the last spike times in the bursts. Moreover, these patterns may display apparent time scaling, e.g., they may be replayed in the subsequent bursts at different speeds, while preserving the spiking order. We discuss how such properties of the bursts may be associated with the formation of repeatable signaling pathways in cultured networks in vitro.
Introduction
In recent years, neurons cultured on multielectrode arrays (MEAs) have attracted a growing interest as a biological model of network level plasticity and information processing. It has been found that such networks generate synchronized bursting events (of 0.5–2 s duration) with high frequency spiking elicited by a large number of cells involved in the network. Bursting activity in cultures was broadly investigated in connection with many different applications including disease treatment (Wagenaar et al., 2005), learning in neural networks (Shahaf and Marom, 2001; Marom and Shahaf, 2002; le Feber et al., 2010), signal processing at the network level (Chao et al., 2005; Bakkum et al., 2008; Vajda et al., 2008), and many others. In the course of development the cultured networks demonstrate highly variable characteristics of bursting dynamics (Van Pelt et al., 2004; Wagenaar et al., 2006). At the same time, it was noted that the burst consists of quite well-organized spatio-temporal spiking sequences. Statistically significant similarity of the burst patterns was found using correlation criteria (Segev et al., 2002), spike rate characteristics (Madhavan et al., 2007), and activation patterns, e.g., statistics of the spiking times of burst initiation (Raichman and Ben-Jacob, 2008). The presence of motifs in the activation patterns found in the latter case is especially interesting since such patterns can be repeated with a millisecond precision (Hulata et al., 2004; Rolston et al., 2007; Raichman and Ben-Jacob, 2008; Chao-Yi et al., 2009). It is particularly important for cellular mechanisms of learning when the motifs are changed during low-frequency electrical stimulation (Shahaf et al., 2008). Generation of spontaneous burst discharges can be also treated as a kind of self-organized criticality (e.g., neuronal avalanches) as it was shown in cultured slices (Beggs and Plenz, 2004) as well as in dissociated cultures (Pasquale et al., 2008). In the course of burst development, spikes from different neurons form an avalanche, leading to a high frequency sequential population discharge. Such avalanches also point to the presence of a certain synaptic organization in the cultured networks at a certain stage of development.
In this paper we address spike pattern ordering in spontaneous burst discharges recorded from dissociated hippocampal cultures in vitro. We claim that different parts of the bursts, including both activation and deactivation stages, display repeatable characteristics of the spiking order. During the burst discharges we find spatio-temporal patterns of spiking activity (spiking signatures) which occur above chance compared to surrogate data sets. We believe that these spiking signatures may reflect the structure of the underlying patterns of synaptic connectivity, revealing particular preferred signaling pathways. Moreover, the spiking signatures can be replayed at different speeds in the consequent bursts activating the signaling pathways in different time scales.
Materials and Methods
Cell Culturing
Hippocampal cells were dissociated from embryonic mice (on the 18-th day) and plated on MEAs pre-treated with adhesion promoting molecules of polyethyleneimine (Sigma P3143) with the final density of about 1600–2000 cells/mm2. C57BI6 mice were killed by cervical vertebra dislocation, according to the protocols approved by the National Ministry of Public Health for the care and use of laboratory animals. Embryos were removed and decapitated. The entire hippocampus, excluding the cortex, whole medulla, and the lower part of the pons, was dissected under sterile conditions. Hippocampuses were cut in Ca2+- and Mg2+- free phosphate-buffered saline (PBS-minus). After enzymatic digestion for 25 min by 0.25% trypsin at 37°C (Invitrogen 25200-056) cells were separated by trituration (10 passes) using a 1-ml pipette tip. After being passed the solution was centrifuged at 1500 g for 1.5 min, the cell pellet was immediately re-suspended in culture neurobasal medium (NBM; Invitrogen 21103-049) with B-27 (Invitrogen 17504-044), Glutamine (Invitrogen 25030-024), and 10% fetal calf serum (PanEco K055). The dissociated cells were seeded in a 40-μl droplet covering the center of the culture dish with 1 mm2 electrode region of the MEA, forming a dense monolayer (Potter and DeMarse, 2001). After the cells had adhered (usually in 2 h), the dishes were filled with 0.8 ml NBM supplemented with B-27 and 0.5 mM Glutamine with 10% fetal calf serum. In 24 h the plating medium was replaced by a medium containing NBM with 0.5 mM Glutamine and 10% fetal calf serum, but with no antibiotics or antimycotics. Glial growth was not suppressed, because glial cells are essential for long-term culture health. One half of the medium was changed every 2 days. The cells were cultured under constant conditions of 37°C, 5% CO2, and 95% air at saturating humidity in a cell culture incubator (MCO-18AIC, SANYO).
Phase contrast images of cultures were taken weekly to record the status of the culture using a Leica DMIL HC (Germany) inverted microscope with 10×/0.2 Ph1 objectives. Experiments were done when the cultures were 2–5 weeks in vitro.
Electrophysiological Methods
Extracellular potentials were collected by 64 planar indium tin-oxide (ITO) platinum black electrodes integrated into the MED64 system (Alpha MED Science, Japan). The MED probe (MED-P5155) had 8 × 8 (64) electrode arrays with 50 μm × 50 μm micro-electrodes spaced by 150 μm (Figure 1A). Data was recorded simultaneously in 64 channels at a sampling rate of 20 kHz/channel.
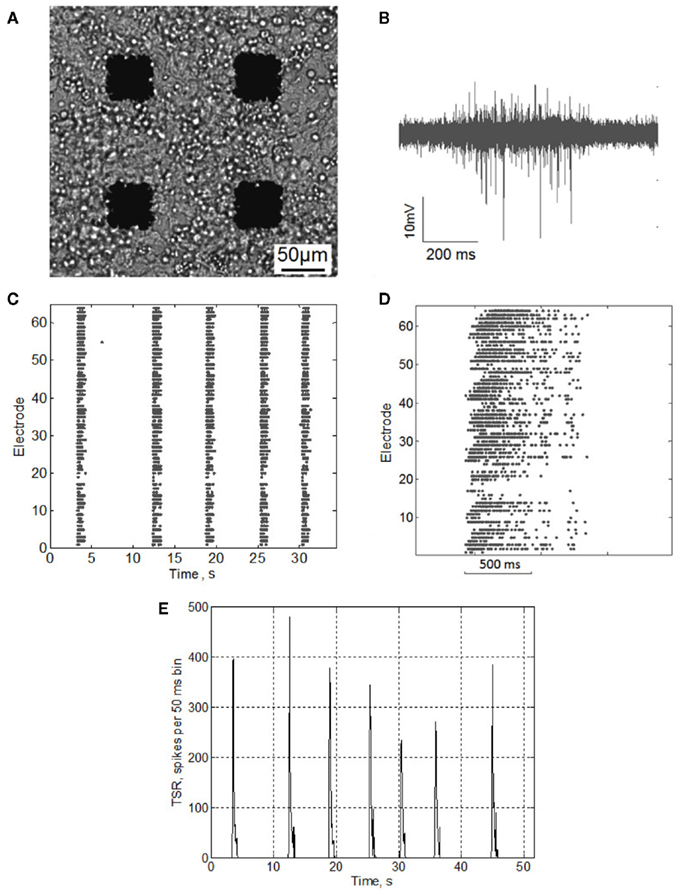
Figure 1. (A) Hippocampal neurons cultured on MEA. (B) Electrophysiological signal recorded from a single microelectrode during burst activity. (C) Raster plot of electrical spiking activity over 64 electrodes(DIV 14). (D) Raster plot of the single burst activity. (E) Total spike rate-diagram, TSR(t) – total number of spikes over all electrodes in every consequent 50 ms bin.
All signal analysis and statistics were performed using custom made software (Matlab®).
Spike Detection
Detection of extracellularly recorded spikes (Figure 1B) was based on threshold calculation of the signal median

where x is the bandpass-filtered (0.3–8 kHz) signal, σ is the estimate of the median normalized to SD of a signal with a zero number of spikes (Quiroga et al., 2004), and NS is the spike detection coefficient changing the spike detection threshold. Note that the spike detection threshold depends on spiking rate, leading to false positives in detection of low amplitude spikes. We use in (1) the median method (Quiroga et al., 2004) which is less sensitive to the spike frequency compared with traditional mean root square estimates (e.g., Maccione et al., 2009). Note also that SD of a signal containing Gaussian noise equals the median of the absolute values of the signal divided by 0.6745. Thus, we choose 0.6745 in Eq. 1 to normalize the median value to the SD of the signal.
Different values of NS correspond to different amplitudes of the spikes to be detected. In this paper we use NS = 8 for all analyzed data, which gives the amplitudes of the detected spikes in the 10- to 60-μV range. To illustrate the influence of the threshold value one of the cultures was also analyzed for higher threshold spikes, NS = 12 (Figure 3). The detected spikes were then plotted in a raster diagram (Figures 1C,D). Note that in the spike extraction algorithm based on Eq. 1 the minimal interspike interval was set to be 1.5 ms to avoid the overlapping of the neighboring spikes.
In these experiments we did not use any spike-sorting algorithms to classify spikes coming from different cells (Quiroga et al., 2004). During high frequency discharges a rather large planar electrode (50 μM in size) integrates signals from quite a large area comprising many neurons firing in avalanche and it is hardly possible to differentiate by shape local spikes coming with negligible latencies. Thus, we analyze the signals contributed by a local group of neurons near a particular electrode as a single event and follow temporal ordering on the scale of inter-electrode distance where the spike latencies are longer, which is caused by synaptic or perhaps extrasynaptic transmission.
Burst Detection
To detect bursts we calculated the total spiking rate [TSR(t)] (Figure 1E) accounting for the total number of spikes from all electrodes within 50 ms time bin. Fast appearance of a large number of spikes over all electrodes in a small (50–100 ms) time bin was used as a criterion for burst appearance.
The signal TSR(t) was analyzed to estimate burst beginning and ending points. Burst threshold was set to be TBurst = 0.1 × σTSR, where σTSR is SD of TSR(t). Note that in many experiments there are a few electrodes recording continuous high frequency spike trains (∼1 spike/10 ms). They contribute to TSR(t) values with a certain level of noise (Figure A1 in Appendix). To exclude this noise we set the burst detection threshold coefficient to 0.1, giving the best estimate for the burst initiation and ending points recognized in the raster diagram (Figure A2 in Appendix).
The initiation time of the burst, Tp, was defined as the first bin, where TSR(t) was above the threshold. Then, Tp was adjusted to the first spike after this time. The end point of the burst,  was defined as the last time bin, where TSR(t) was above the threshold. Then,
  was adjusted to the latest spike before this time. Note that compared to the burst detection algorithm proposed by Pasquale et al. (2009) our method is not self-adapting. However it is fully automatic and was capable to detect all the bursts in our recordings.
Pattern Analysis
Next, we defined a spiking pattern as a vector of spiking times  accounting for the time interval from the reference point, Tp + Δτ, to the first spike appearing in electrode i for the p-th burst in the sequence. Here, Tp is the start time of the p-th burst, Δτ is the parameter changing the reference point and varied from 0 to the burst duration, so that the pattern
  represented 64-th size vector of spiking times for the p-th burst. If Δτ = 0, then
  describes the so-called activation pattern (Raichman and Ben-Jacob, 2008). Here, we also defined the deactivation pattern
  For each burst we looked for the last spikes in each channel (electrode) and set the reference point at the time moment of the first of them. Then,
  denotes the time interval between the reference point and the last spikes in each electrode. So, the activation pattern of one burst is a set of times of appearance of the first spikes for each electrode after the burst beginning, and deactivation pattern of one burst is a set of the last spiking times for each electrode after the burst beginning.
To measure similarity of each pair of the spiking patterns we introduced the quantity
where  and
and  are the vectors of spiking times for the activation and for the deactivation patterns, respectively, for the p-th and q-th bursts. In other words, S(p,q) defines the distance between the two vectors in N-dimensional metric space, N = 64 is the number of electrodes.
Formula (2) estimates the absolute distance between the spiking patterns. We also defined a relative distance as
where  and
and  are the durations of the p-th and q-th patterns, respectively, so that each spiking time,
  of the p-th burst is normalized to its duration. Thus, the relative distance does not depend on the absolute duration of the pattern and is more sensitive to the order of spikes in the raster diagram. We used this quantity, if it is different from the absolute one, to test the presence of temporal scaling in the spiking patterns.
To estimate statistical significance of the similarity values we generated surrogate data sets composed of spiking patterns with indexes randomly shuffled with equal probability. Shuffling the neuron indexes without changing actual spiking times removes the information about mutual temporal order of the electrode spikes, preserving the other statistics. The non-parametric Mann–Whitney U test (Mann and Whitney, 1947) was used to identify statistical difference between median values of the distributions for the actual and for the surrogate patterns. If p-value given by the test was less than 0.05, then the set of the patterns is non-randomly similar.
Spiking signature was defined as the pattern of spiking times, if it is statistically different from the surrogate patterns. To analyze the fraction of non-random patterns in real data compared to surrogates we calculated the Jaccard index (Jaccard, 1901). It determines the relation between the overlapping area of real and surrogate distributions and the total area of the distributions. In other words, the Jaccard index characterizes the amount of non-randomly similar pattern pairs. Its zero value indicates that the distributions do not overlap. If it is equal to 1, then the distributions are totally overlapped and all the observed patterns are not statistically different from the surrogate patterns.
Note that the shuffling method used here to identify the spiking signatures has minimal effect on the statistics of the signal analyzed preserving, in particular, TSR(t), function for the surrogates. We also tested other algorithms, including spike jittering with uniform probability of the surrogate spike time around its original timing (Figure A3 in Appendix). The dependence of the similarity measure on the jittering time window (maximum random spike timing jitter taken from a uniform distribution) is shown in Figure A3 in Appendix. As one may expect jittering with small time windows does not make the surrogates statistically different from the original patterns in terms of the similarity measure. However, time windows where the surrogates become statistically different from the original patterns are in the range of the pattern duration (100–200 ms). This means that shuffling based on electrode index randomizing is statistically equal to the spike timing jittering with time windows in the range of pattern duration.
Note also that we did not use the widely employed ISI shuffling for the whole burst analysis, as the ISI distribution is not uniform in the burst. In particular, it was important for us to preserve higher ISIs at the beginning of the bursts and lower ISIs at their end stage (Figure 4G).
Results
Activation and Deactivation Pattern Analysis
First, we analyzed the activation patterns (Figure 2A). We were interested in determining if the activation patterns have similar characteristics from burst to burst. Distributions of the similarity measures (2) between all pairs of the activation patterns (left distribution) and surrogates of those patterns (right distribution) are shown in Figure 2C. According to the Mann–Whitney U test (see Materials and Methods), the median for the original patterns is smaller than the median for surrogate data (p-value < 0.05). This indicates that the activation patterns are statistically similar, i.e., there is a spiking signature (Figure 2A) in the recorded burst sequence. Note also that the statistical significance of the similarity of activation patterns is robust to changes in the burst detection threshold (Figure A2 in Appendix).
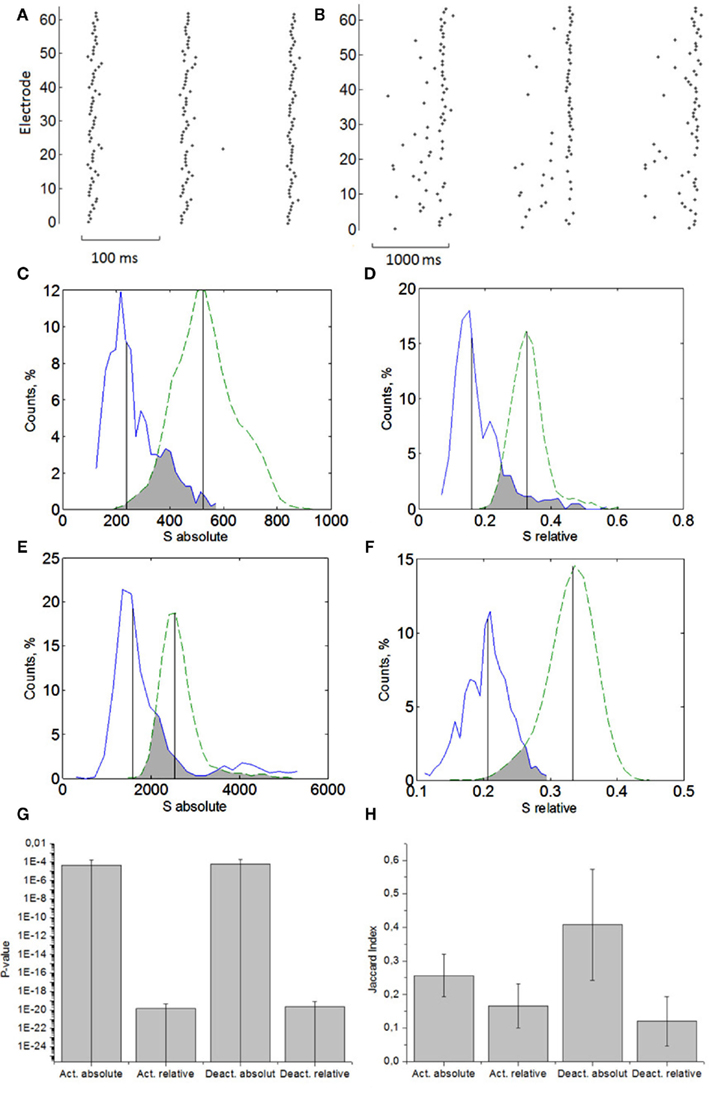
Figure 2. Profiles of the activation patterns (A) and deactivation patterns (B) in the bursts. Distributions of the absolute distance (2) computed for real data (solid curve) and for surrogates (dashed curve). Comparison of activation patterns using absolute distance (C) and relative distance (D). Comparison of deactivation patterns using absolute distance (E) and relative distance (F). Averaged p-values (G) and Jaccard index (H) of statistical significance of non-random small similarities for activation and deactivation patterns using absolute and relative spiking times (n = 6).
Next, we analyzed the statistics for the activation patterns using the relative distance (3) (Figure 2D). Under this measure the patterns are also statistically different from the surrogate data. The test shows slightly better performance than for the absolute distance.
We proceed with the deactivation patterns (Figure 2B). Both absolute (Figure 2E) and relative (Figure 2E) distance analyses show that the patterns are statistically similar (Figure 2F).
The results are summarized in Figure 2G for six different cultures of the same DIV. It was found that in the case of activation patterns, both absolute and relative measures of the similarity give essentially similar results. Then the patterns are repeatable in the sense of time sequences of spikes (absolute distance) and spiking order (relative distance). As for the deactivation patterns, they are more variable in time duration, which is indicated by the larger bar for absolute distance p-value in Figure 2G. The relative distance test reduces the time variability in the deactivation duration and is characterized by a much lower p-value. Thus, the cultures eventually demonstrate highly organized signaling not only on the time scale of synchronized bursts but also on the time scale of spike transmission inside the burst. Note that median comparison is quite a robust method to estimate statistical difference between real and surrogate data.
Next, we analyzed the data in more detail. To find how many pairs of patterns have statistically small and non-random similarities we employed the Jaccard index computation (see Materials and Methods). It also shows that the original and the surrogate data are statistically different. Surprisingly, the fraction of repeatable pairs in the deactivation patterns in the sense of their relative distance is significantly larger than in terms of their absolute distance (Figure 2H).
This difference in absolute and relative distance statistics confirms the presence of time scaling in the deactivation patterns. In other words, the spikes at the end of the bursts can be played on different timescales but in statistically the same order. Note that similar scaling properties have been also found in some in vitro and in vivo studies of cortical neurons (Ikegaya et al., 2004). Note also that scaling dynamics is a characteristic feature of neuronal avalanches in cultured networks (Pasquale et al., 2008) indicating that the burst discharges intrinsically contain different time scales.
The presence of similarity in the spiking patterns is also illustrated in Figure 3A. Average values of  describing the first spiking times in the burst are plotted in 8 × 8 matrix according to MEA electrode distribution. They apparently organize a gradient distribution. The activity is initiated in a definite spatial area different for different cultures. Otherwise one would always expect the wave to propagate in the same direction in different experiments. Such a difference excludes that the wave is an artifact of the recording facility. Otherwise, it should give generally the same direction of the wave in different experiments. Here we note, however, that the profile of the activation (deactivation) patterns may depend on the threshold of spike detection. Figure 3B shows the activation pattern for the same burst sequence as in Figure 3A but for a higher value of the spike detection coefficient (NS = 12). This means that a specific profile of the spiking signature is also sensitive to the characteristic spike amplitudes detected from the electrodes. The high amplitudes of the recorded spikes do not reflect non-random spatio-temporal patterns. Figure 3C illustrates the deactivation pattern for the same burst sequence. In contrast to Figure 3A it has no gradient trends. This means that the profiles of activation and deactivation patterns can be generally uncorrelated. Figure 3D illustrates the activation patterns for three different cultures. This kind of non-random spatio-temporal patterns was observed in four of six presented cultures and others had random patterns. For illustration we also show here (Figure 3E) the space time profiles (rasters) of the bursts presented in Figure 3A.
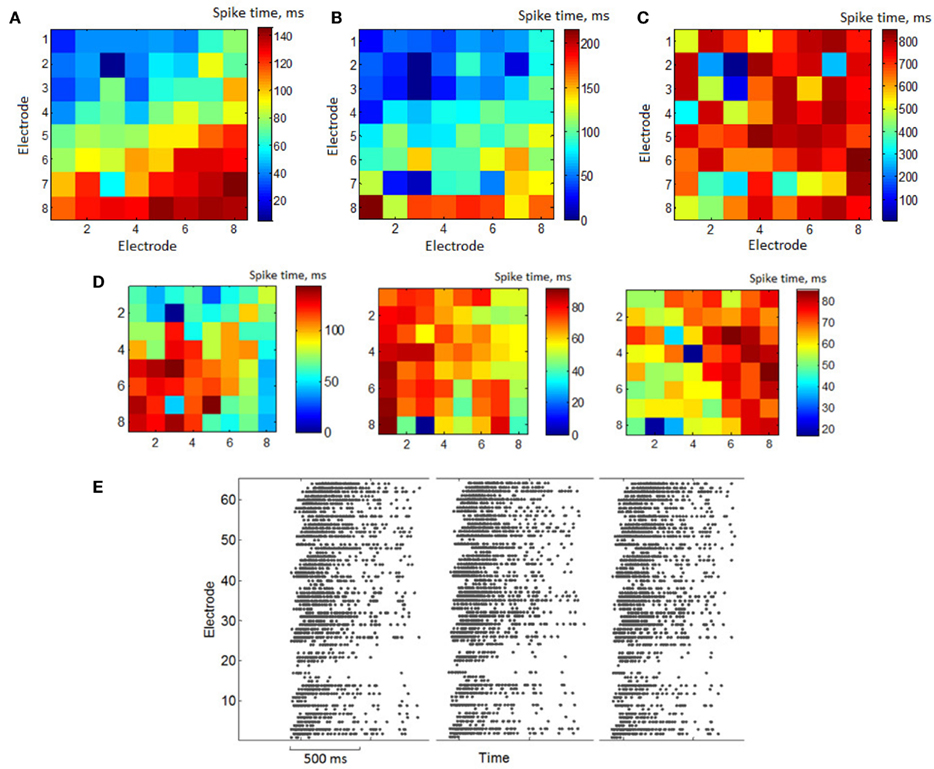
Figure 3. (A) Matrix of 8 × 8 electrodes with color representation of average first spike timing in the bursts – activation pattern. Color means first spike timing on electrode after burst starts averaged over all bursts in a set. First electrode is in the left top corner, 64-th –bottom right. Spike detection coefficient (see Materials and Methods) was set to be NS = 8. (B) Color representation activation pattern of the same activity, where spikes were detected with detection coefficient NS = 12. (C) Color representation of the average last spiking times in the bursts – deactivation pattern. (D) Examples of the average activation patterns in different cultures. (E) Raster plot of the bursts with similar activation patterns [(A) – average activation pattern of the bursts].
Analysis of the Bursts as a Sequence of Patterns
Let us now analyze the intrinsic structure of the burst using the similarity measures (2, 3) with Δτ = 50 increased in 50 ms increments from 50 to the duration of the burst. We sequentially shifted the reference point Tp + Δτ as shown schematically in Figure 4A. The corresponding patterns were defined as spiking times  according to the reference point. Note that, since the bursts in the sequence have different durations, here we additionally normalize the components of the vector
  to the corresponding burst duration. Such a procedure allows to make the absolute (2) and relative (3) distances independent of the duration of particular burst. Thus, we can assess statistical similarity of different parts of bursts.
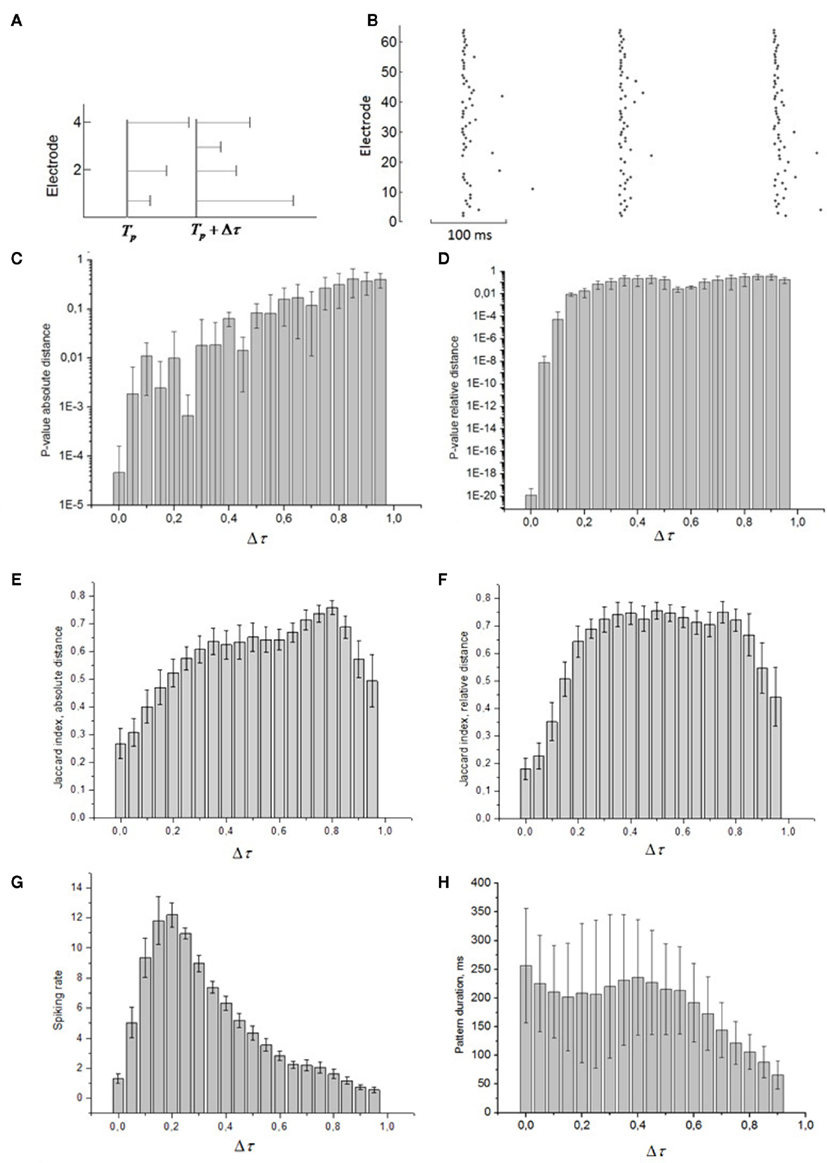
Figure 4. (A) Schematic graph of spiking patterns for different time shifts from the burst beginning time Tp. (B) Spiking patterns calculated for maximal spiking rate inside the burst. Dependence of p-value of pattern similarity using absolute (C) and relative (D) spiking times and Jaccard index using absolute (E) and relative (F) spiking times on time shift from the burst start time. Absolute values of the time shift (x-axes) from the burst starting point are normalized to burst duration. (G) Average number of spikes over all electrodes at every 50 ms interval of the bursts (n = 6). (H) Average duration of patterns taken at different reference points (parts of the bursts).
We calculated the p-value and Jaccard index at certain Δτ. Figures 4C–F illustrate their changes for different parts of the burst. Lower p-values, p < 0.05, mean that the patterns are statistically similar in terms of the median test (see Materials and Methods). Surprisingly, within the first 40% of burst duration, the absolute distance shows that the patterns are statistically repeatable (i.e., they have the spiking signature). Note that the average pattern duration is maximum if patterns are taken at the beginning of the bursts (Figure 4H). Hence, not only the initiation profile of the burst but also the spikes inside the bursts in the multielectrode data reflect repeatable activation of certain synaptic pathways (Figure A4 in Appendix). Next, we applied the relative distance test (3) for the entire burst (Figure 4C). Apparently, the interval between the first 20 and 40% of burst duration contains a series of peaks higher than p = 0.05. A possible explanation is that this interval corresponds to the highest spiking rate in the burst and, hence, the spiking order is very sensitive to pattern duration. In turn, the absolute distance (2) here is less sensitive to pattern duration because most of the spikes come almost synchronized (Figure 4B).
Then, we show the behavior of the Jaccard index with increasing Δτ. As was to be expected, due to the presence of time scaling the relative distance test shows lower values than the absolute one for the first few spiking patterns inside the bursts. However, the relative index grows faster because of the earlier mentioned sensitivity of the relative distance to the spiking rate.
Note that the last spiking patterns corresponding to the end of the burst do not show similarity, as was the case for the deactivation patterns. This is due to the different definitions of the activation patterns  related to the shifting reference point Tp + Δτ and deactivation patterns
  which explicitly determine the last spikes in the burst for each electrode.
Discussion
Spontaneous electrical activity of dissociated hippocampal neurons on MEAs at certain stages of development occurs in the form of synchronized burst discharges. On a millisecond time scales the intraburst spike distribution can be also characterized as repeatable patterns ordered in space and in time. To assess repeatability we introduced the measure of similarity between the spiking patterns as the vector of spiking times relative to some reference time line. We demonstrated, in particular, that the spiking patterns taken as the first spiking times (e.g., the activation patterns) are statistically significantly similar to each other. This fact agrees with the previous studies (Raichman and Ben-Jacob, 2008). Analysis of the whole intraburst structure showed that the deactivation patterns are also well repeatable in terms of the similarity measure. Note, however, that the patterns taken in the middle of the bursts which consist of spike sequences with higher frequency are not statistically similar above chance compared to surrogate data which shows an absence of repeatability of the spike patterns. This is, most likely, a consequence of the recording technique when the overlap of many almost synchronous spikes detected by the extracellular electrode cannot be reliably resolved. Nevertheless, patterns appearing in the first 40% of the burst duration show significant similarity.
The presence of organized timing in the activity of culture networks was addressed in many earlier works (Shahaf and Marom, 2001; Johnson, 2007, 2010; Rolston et al., 2007; Raichman and Ben-Jacob, 2008). Our results indicate that there are statistically repeatable patterns of spiking activity during burst discharges compared to surrogate data. We define that as an existence of spiking signatures in spontaneous burst discharges. Such signatures are characterized by statistically non-random distributions of spiking times relative to surrogates in different parts of the bursts. This means that the spiking sequences constituting the bursts preserve a certain order, which is statistically preferable for all bursts. The signatures do not require precise repetition of the spike positions in the consequent bursts, hence, they are a quite robust indicator of the culture functional state to spiking time jittering. In space the spiking signatures are well-organized wave-like shapes (Figure 3). The different patterns of wave propagation may be due to differences in the underlying patterns of synaptic connectivity in the cultures (Galan, 2008). In particular, this may be associated with different densities of active cell distribution. The absence of symmetry in the wave profiles (Figure 3) may also be an argument in favor of the synaptic nature of the spiking signatures. Another possible mechanism based on electrical or chemical diffusion supported by local cell discharges due to depolarization is not likely here, as it is expected to be symmetric in all directions (like concentric or spiral waves).
Furthermore, we cannot distinguish different activation patterns within the same recording. The spiking signature may indicate that there is a “dominant” pattern at this stage of culture development. We hypothesize that the functional connectivity in the culture has reached a homeostatic state in which further plasticity does not alter the “dominant signaling pathway.” This leads, in turn, to statistically repeatable spatio-temporal patterns of spiking activity during the burst discharge. Note that this does not contradict the existence of spiking motifs described earlier in cultures (Raichman and Ben-Jacob, 2008). Different motifs may contribute to the tails of the distribution classified here as “random” patterns in the sense that they are different from the dominant one.
A further argument supporting the hypothesis of spiking signatures is the scaling feature of the spiking patterns. The relative similarity measure (3) indicates better performance of the pattern repeatability test for the resolvable parts of the bursts especially for its deactivation part. We hypothesize that the spiking consequence has fractal nature of the discharge in terms of time scales and activation of multiscale synaptic pathways (e.g., the percolation effect in spike propagation). Being at different level of depression after the high frequency part of the burst, these pathways may display different synaptic efficacy, hence providing effective spike propagation at variable speed from burst to burst. That is why, for example, deactivation patterns have much higher variations in their durations.
Finally, we hope that the method of assessing of spiking patterns similarity proposed here may be a simple and robust tool for analyzing culture burst activations. Its main advantage is that different parts of the bursts recorded by MEAs can be easily tested for similarity within the same recording and for the variability between different recordings.
Conflict of Interest Statement
The authors declare that the research was conducted in the absence of any commercial or financial relationships that could be construed as a potential conflict of interest.
Acknowledgments
The research is supported by the Russian Federal Programs (Nos. 14.740.11.0075, 16.512.11.2136, P261 29.04.2010,02.740.11.0839), by Russian Foundation for Basic Research (No 11-04-12144) by the MCB RAS and by the Russian President grant MD-5096.2011.2.
References
Bakkum, D., Chao, Z., and Potter, S. (2008). Long-term activity-dependent plasticity of action potential propagation delay and amplitude in cortical networks. PLoS ONE 3, e2088. doi:10.1371/journal.pone.0002088
Beggs, J., and Plenz, D. (2004). Neuronal avalanches are diverse and precise activity patterns that are stable for many hours in cortical slice cultures. J. Neurosci. 24, 5216–5229.
Chao, Z., Douglas, J., Bakkum, D., Wagenaar, D., and Potter, S. (2005). Effects of random external background stimulation on network synaptic stability after tetanization. Neuroinformatics 3, 263–280.
Chao-Yi, D., Jisoon, L., Yoonkey, N., and Kwang-Hyun, C. (2009). Systematic analysis of synchronized oscillatory neuronal networks reveals an enrichment for coupled direct and indirect feedback motifs. Bioinformatics 25, 1680–1685.
Galan, R. F. (2008). On how network architecture determines the dominant patterns of spontaneous neural activity. PLoS ONE 3, e2148. doi:10.1371/journal.pone.0002148
Hulata, E., Baruchi, I., Segev, R., Shapira, Y., and Ben-Jacob, E. (2004). Self-regulated complexity in cultured neuronal networks. Phys. Rev. Lett. 92, 198105
Ikegaya, Y., Aaron, G., Cossart, R., Aronov, D., Lampl, I., Ferster, D., and Yuste, R. (2004). Synfire chains and cortical songs: temporal modules of cortical activity. Science 304, 559–564.
Jaccard, P. (1901). Étude comparative de la distribution florale dans une portion des Alpes et des Jura. Bull. Soc. Vaudoise Sci. Nat. 37, 547–579.
Johnson, H. A., and Buonomano, D. V. (2007). Development and plasticity of spontaneous activity and Up states in cortical organotypic slices. J. Neurosci. 27, 5915–5925.
Johnson, H. A., Goel, A., and Buonomano, D. V. (2010). Neural dynamics of in vitro cortical networks reflects experienced temporal patterns. Nat. Neurosci. 13, 917–919.
le Feber, J., Stegenga, J., and Rutten, W. L. C. (2010). The effect of slow electrical stimuli to achieve learning in cultured networks of rat cortical neurons. PLoS ONE 5, e8871. doi:10.1371/journal.pone.0008871
Maccione, A., Gandolfo, M., Massobrio, P., Novellino, A., Martinoia, S., and Chiappalone, M. (2009). A novel algorithm for precise identification of spikes in extracellularly recorded neuronal signals. J. Neurosci. Methods 177, 241–249.
Madhavan, R., Chao, Z. C., and Potter, S. M. (2007). Plasticity of recurring spatiotemporal activity patterns in cortical networks. Phys. Biol. 4, 181–193.
Mann, H. B., and Whitney, D. R. (1947). On a test of whether one of two random variables is stochastically larger than the other. Ann. Math. Stat. 18, 50–60.
Marom, S., and Shahaf, G. (2002). Development, learning and memory in large random networks of cortical neurons: lessons beyond anatomy. Q. Rev. Biophys. 35, 63–87.
Pasquale, V., Martinoia, S., and Chiappalone, M. (2009). A self-adapting approach for the detection of bursts, and network bursts in neuronal cultures. J. Comput. Neurosci. 29, 213–229.
Pasquale, V., Massobrio, P., Bologna, L. L., Chiappalone, M., and Martinoia, S. (2008). Self-organization and neuronal avalanches in networks of dissociated cortical neurons. Neuroscience 28, 221–237.
Potter, S., and DeMarse, T. (2001). A new approach to neural cell culture for long-term studies. J. Neurosci. Methods 110, 17–24.
Quiroga, R., Nadasdy, Q., and Ben-Shaul, Y. (2004). Unsupervised spike detection and sorting with wavelets and superparamagnetic clustering. Neural Comput. 16, 1661–1688.
Raichman, N., and Ben-Jacob, E. (2008). Identifying repeating motifs in the activation of synchronized bursts in cultured neuronal networks. J. Neurosci. Methods 170, 96–110.
Rolston, J. D., Wagenaar, D. A., and Potter, S. M. (2007). Precisely timed spatiotemporal patterns of neural activity in dissociated cortical cultures. Neuroscience 148, 294–303.
Segev, R., Benveniste, M., Hulata, E., and Cohen, N. (2002). Long term behavior of lithographically prepared in vitro neuronal networks. Phys. Rev. Lett. 88, 118102.
Shahaf, G., Eytan, D., Gal, A., Kermany, E., Lyakhov, V., Zrenner, C., and Marom, S. (2008). Order-based representation in random networks of cortical neurons. PLoS Comput. Biol. 4, e1000228. doi:10.1371/journal.pcbi.1000228
Shahaf, G., and Marom, S. (2001). Learning in networks of cortical neurons. J. Neurosci. 21, 8782–8788.
Vajda, I., van Pelt, J., Wolters, J., Chiappalone, M., Martinoia, S., van Someren, E., and van Ooyen, A. (2008). Low-frequency stimulation induces stable transitions in stereotypical activity in cortical networks. Biophys. J. 94, 5028–5039.
Van Pelt, J., Corner, M. A., Wolters, P. S., Rutten, W. L., and Ramakers, G. J. (2004). Longterm stability and developmental changes in spontaneous network burst firing patterns in dissociated rat cerebral cortex cell cultures on multielectrode arrays. Neurosci. Lett. 361, 86–89.
Wagenaar, D., Madhavan, R., Pine, J., and Potter, S. (2005). Controlling bursting in cortical cultures with closed-loop multi-electrode stimulation. J. Neurosci. 25, 680–688.
Wagenaar, D., Pine, J., and Potter, S. (2006). An extremely rich repertoire of bursting patterns during the development of cortical cultures. BMC Neurosci. 7, 11. doi:10.1186/1471-2202-7-11
Appendix
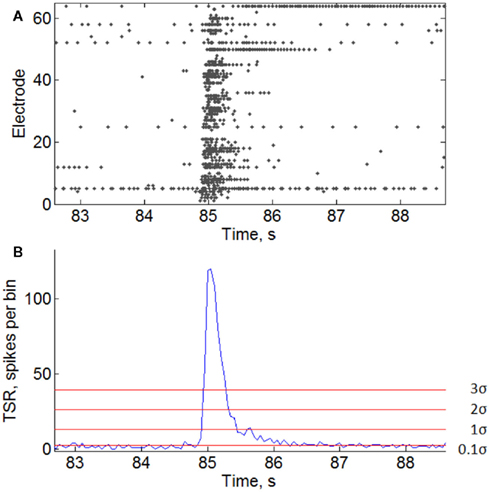
Figure A1. Burst threshold detection. (A) Raster of burst activity. Some electrodes generate continuous spike trains contributing to the noise level for burst detection. (B) Total spike rate-diagram of the burst. Horizontal lines indicate burst detection thresholds with different sensitivity coefficients T = 0.1σ, 1σ, 2σ, and 3σ (see Materials and Methods).
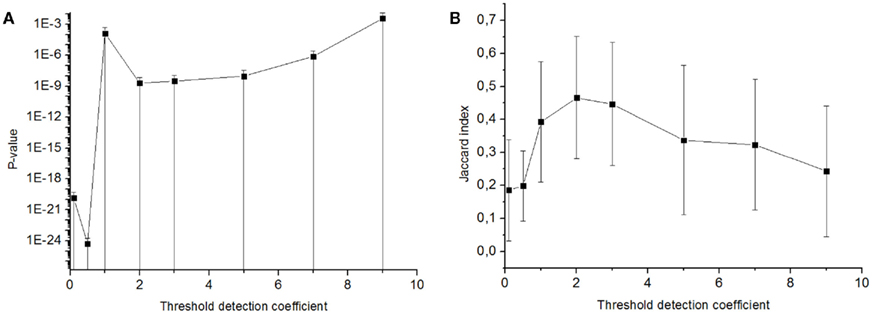
Figure A2. Statistical significance of similarity of activation patterns taken in the bursts detected with various burst detection thresholds. Probability of non-randomly small similarity in the set of patterns was represented by p-value of Mann–Whitney test (A) and by Jaccard index (B) (see Materials and Methods) depending on the burst detection threshold. p-Value < 0.05 for any burst detection threshold.
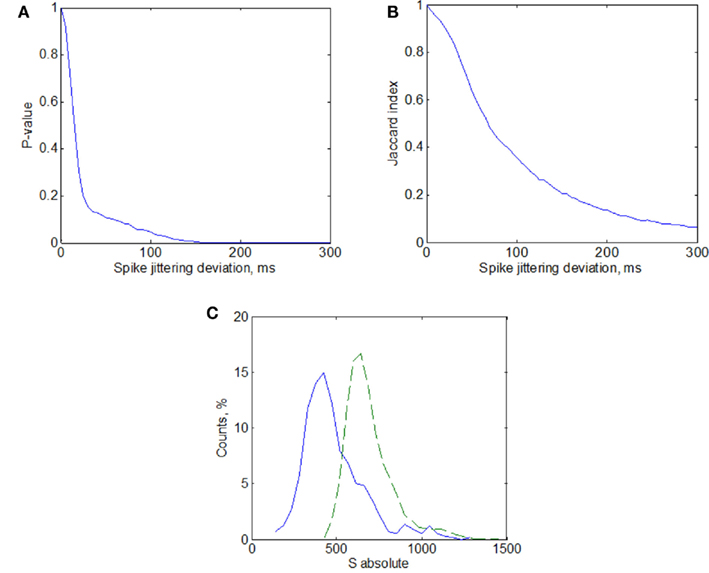
Figure A3. Statistical significance of activation patterns similarity using surrogates calculated with jittering method. (A) Probability of obtaining non-randomly small similarity of the set of patterns represented by p-value(A) and Jaccard index (B) (see Materials and Methods) as a function of jittering deviation (maximum random spike timing taken from a uniform distribution). (C) Similarity distributions of the activation patterns (solid line) and surrogates of these patterns (dashed line) calculated with jittering deviation of 150 ms.
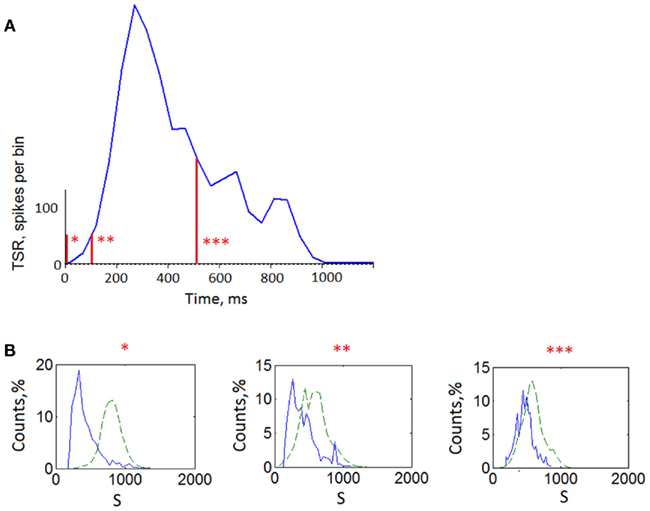
Figure A4. Similarity analysis of patterns taken from different offsets (reference points) of the bursts. (A) Average total spike rate of the bursts representing total number of the spikes from all electrodes every 50 ms. Labels “*” indicate time offsets (reference points) from which activation patterns were taken (see Materials and Methods). “*’ – 0 ms offset from the burst beginning (activation patterns), “ * * ” – 100 ms offset, “ * * * ” – 500 ms offset. (B) Similarity distributions of the three sets of activation patterns (solid line) and surrogates of these patterns (dashed line).
Keywords: neuronal network, microelectrode array, bursts in vitro, spiking patterns
Citation: Pimashkin A, Kastalskiy I, Simonov A, Koryagina E, Mukhina I and Kazantsev V (2011) Spiking signatures of spontaneous activity bursts in hippocampal cultures. Front. Comput. Neurosci. 5:46. doi: 10.3389/fncom.2011.00046
Received: 06 May 2011;
Accepted: 13 October 2011;
Published online: 11 November 2011.
Edited by:
Stefano Fusi, Columbia University, USAReviewed by:
John M. Beggs, Indiana University, USADietmar Plenz, National Institutes of Health, USA
Alexander Roxin, Institut d’Investigacions Biomèdiques August Pi i Sunyer, Spain
Copyright: © 2011 Pimashkin, Kastalskiy, Simonov, Koryagina, Mukhina and Kazantsev. This is an open-access article subject to a non-exclusive license between the authors and Frontiers Media SA, which permits use, distribution and reproduction in other forums, provided the original authors and source are credited and other Frontiers conditions are complied with.
*Correspondence: Alexey Pimashkin, Department of Neurodynamics and Neurobiology, Lobachevsky State University of Nizhny Novgorod, Gagarin prospekt 23, Nizhny Novgorod, Russia. e-mail: pimashkin@neuro.nnov.ru