Characterizing the spiking dynamics of subthalamic nucleus neurons in Parkinson's disease using generalized linear models
- 1Department of Mathematics and Statistics, Boston University, Boston, MA, USA
- 2Department of Neurosciences, Cleveland Clinic, Cleveland, OH, USA
- 3Al-Rohdan Laboratories – MGH-HMS Center for Nervous System Repair, Department of Neurosurgery, Massachusetts General Hospital, Boston, MA, USA
Accurately describing the spiking patterns of neurons in the subthalamic nucleus (STN) of patients suffering from Parkinson's disease (PD) is important for understanding the pathogenesis of the disease and for achieving the maximum therapeutic benefit from deep brain stimulation (DBS). We analyze the spiking activity of 24 subthalamic neurons recorded in Parkinson's patients during a directed hand movement task by using a point process generalized linear model (GLM). The model relates each neuron's spiking probability simultaneously to factors associated with movement planning and execution, directional selectivity, refractoriness, bursting, and oscillatory dynamics. The model indicated that while short-term history dependence related to refractoriness and bursting are most informative in predicting spiking activity, nearly all of the neurons analyzed have a structured pattern of long-term history dependence such that the spiking probability was reduced 20–30 ms and then increased 30–60 ms after a previous spike. This suggests that the previously described oscillatory firing of neurons in the STN of Parkinson's patients during volitional movements is composed of a structured pattern of inhibition and excitation. This point process model provides a systematic framework for characterizing the dynamics of neuronal activity in STN.
Introduction
Abnormal neural firing in the subthalamic nucleus (STN) of patients with Parkinson's disease (PD) is postulated to play a role in the pathogenesis of the tremor, rigidity, and akinesia that characterize the disorder (Bergman et al., 1994; Lang and Lozano, 1998; Levy et al., 2000). Modifying neuronal firing patterns in the STN using deep brain stimulation (DBS) significantly reduces the severity of these symptoms (Limousin et al., 1997, 1998; DBS Study Group, 2001). However, the mechanisms by which DBS achieves its effects remain unclear.
Studies employing microelectrode recordings from the 1-methyl-4-phenyl-1,2,3,6-tetrahydropyridine (MPTP) primate model of PD (Bergman et al., 1994) and from PD patients (Levy et al., 2000) have demonstrated an apparent increase in oscillatory and synchronized activity in STN neurons. These abnormal oscillations have been posited to play a role in the pathogenesis of PD in several possible ways. For example, low frequency oscillations (3–10 Hz) may contribute to Parkinsonian tremor whereas beta band oscillations (12–30 Hz) may block the normal flow of information through the basal ganglia, or lead to a loss of neuronal selectivity resulting in akinesia or rigidity (Kopell et al., 2006). This oscillatory activity appears to be dynamic and can be attenuated by volitional movements (Cassidy et al., 2002; Levy et al., 2002; Amirnovin et al., 2004; Gale et al., 2009). Recent studies have suggested that one of the primary mechanisms of DBS maybe the disruption of abnormal beta-band oscillations (Kopell et al., 2006; Wingeier et al., 2006; Gale et al., 2008).
For DBS to have maximal benefit, the stimulating electrode must be accurately placed in the target nucleus. This is accomplished by using stereotactic guidance and microelectrode recordings obtained while the patients are awake (Hutchison et al., 1998). Therefore, microelectrode recordings are an essential part of this therapeutic intervention. Moreover, these recordings offer a unique opportunity to characterize the spiking properties of STN neurons in awake and behaving PD patients and hence, to relate abnormal electrophysiological patterns to specific clinical features of PD.
Many previous statistical analyses of oscillatory spiking activity in the STN have focused on computing and interpreting estimators of the spectrum of the spike train time series (Levy et al., 2002; Magill et al., 2005). Such spectral estimators are useful for visualizing the power distribution of the spike train across different frequencies, but there is often other information about the structure of oscillatory spiking activity that is not clearly reflected in its power spectrum. Additionally, spectral estimators characterize oscillatory features of the spiking activity without accounting for other factors that are known to influence neural spiking, making it difficult to determine the relative importance of the oscillations and their role in the neural code. For example, recent MPTP primate studies (Lebois et al., 2007) suggest that synchronized oscillatory activity emerges after the onset of major motor symptoms and that the pathological disruption of spiking activity related to movement is more closely tied to motor dysfunction. In advanced stages of disease, activity related both to volitional movement and oscillations are present concurrently, but most studies analyze such data using separate statistical techniques for each factor influencing this activity. Here, we are interested in understanding how past spiking activity in the STN of Parkinson's patients shapes the future propensity of the neuron to spike, while simultaneously characterizing the effects of covariates related to motor intention and execution.
We present a point process generalized linear model (GLM) for characterizing the spiking activity of STN neurons, recorded from PD patients, that relates spiking probability simultaneously to factors associated with the time course of movement planning and execution, directional selectivity, refractoriness, bursting, and oscillatory dynamics. We use maximum likelihood methods to estimate the parameters of this model and compute confidence bounds about these estimates. The estimated parameter values provide insight into the structure of the firing patterns in the data. We use the time rescaling theorem (Brown et al., 2002) and a Kolmogorov–Smirnov (KS) analysis to measure the goodness-of-fit between the models and the spiking data. Finally, we measure the relative importance of the specific factors in describing the neuron's spiking propensity based on an analysis of model deviance using Akaike's Information Criterion (AIC).
Materials and Methods
Subject Selection
The 11 patients included in this study all had idiopathic PD for greater than 4 years, a Hoehn-Yahr score of 3 or higher and a documented response to L-dopa replacement therapy. All patients had a pre-operative neurological exam with detailed information on their tremor and PD symptoms. A panel that included neurologists, neuropsychologists, and neurosurgeons reviewed each DBS candidate on an individual basis before making a recommendation for surgery. Subjects were excluded from surgery if they had cognitive impairment, active psychiatric disorders, or anatomic abnormalities on magnetic resonance imaging. None of the patients had undergone prior surgery for the treatment of PD. Informed consent for participation in the study was obtained in accordance with a protocol approved by the Massachusetts General Hospital Institutional Review Board. The decision to perform surgery was made based on clinical indications and was not related to participation in this study.
Electrophysiological Recordings and Behavioral Task
In all subjects, anti-Parkinsonian medications were withheld starting at midnight before the surgery. No sedatives were given during the surgery. The general techniques of stereotactic localization and intraoperative microelectrode recordings are described elsewhere (Hutchison et al., 1998; Amirnovin et al., 2004, 2006). We performed physiologic localization using an array of three tungsten microelectrodes (1 MOhm impedance; FHC Incorporated, Bowdoin, ME), separated by 2 mm, and placed in a parasagittal orientation. The electrodes were advanced simultaneously in 10–50 micron increments using a motorized drive. Figure 1 shows a T2-weighted MR image depicting the targeting trajectory. Amplification of the neuronal signal and control of the micro-drive were handled by a dedicated intraoperative system (Alpha Omega, Nazareth, Israel). Neuronal activity was band-pass filtered (300 Hz–6 kHz) and sampled at 20 kHz. A Macintosh G4 computer using Lablib behavior software (http://maunsell.med.harvard.edu/software.html) controlled the behavioral paradigm.
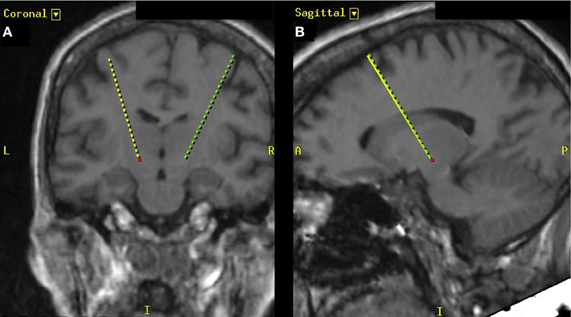
Figure 1. T2-weighted MR image depicting the targeting trajectory (dashed lines) for the placement of deep brain electrodes. (A) Depiction of electrode trajectories in the coronal plane and (B) depicts the electrode trajectory in the sagittal plane. The red dot indicates the position of the left STN.
Before the recordings were made, an electrophysiologist performed sensory-motor testing, as previously described (Baker et al., 2002), to ensure that the electrodes were positioned in the motor region of the STN. Once the microelectrodes were in the motor-STN, the subjects viewed a computer monitor and performed the behavioral task by moving a joystick with the contralateral hand. The joystick was mounted such that movements were in a horizontal orientation with the elbow flexed at approximately 45°. Figure 2 illustrates the behavioral task. Each trial began with the presentation of a small central fixation point. After a brief delay (250 ms), four small gray targets appeared arrayed in a circular fashion around the fixation point. After a 1500 ms delay a randomly selected target turned green. At this point the subject used the joystick to guide a cursor from the center of the monitor toward the green target. Once the target was reached, a tone sounded indicating the subject had successfully completed the task, and the stimuli were erased. Patients were required to reach the target within 5 s of the green cue presentation, although they typically reached the target within 1 s of the onset of the stimulus. There was an inter-trial interval of 1500 ms. Subjects were required to return the joystick to the center position before a new trial started. If the subject prematurely moved the joystick, strayed beyond the confines of an invisible corridor, or failed to reach the target the trial was aborted and excluded from analysis. Very few of these error trials occurred. The target directions were pseudo-randomized to ensure an equal number of trials in each direction. Patients typically performed 12–24 correct trials in each direction at a given site. Each recording run lasted about 3–5 min.
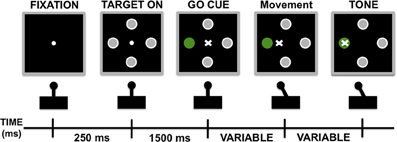
Figure 2. Schematic representation of behavioral task.
Data Analysis
Spikes were sorted using a template-matching algorithm refined by principal component analysis and cluster-cutting (Harris et al., 2000). Inter-spike interval (ISI) histograms and auto-correlograms were computed for all spike trains. Rasters and peristimulus histograms were constructed for all recorded neurons, and were aligned on the start of hand movement as determined by an initial 1° deflection of the joystick (from a possible range of 18°). Autocorrelograms (1 ms bins) were computed for each spike train, and crosscorrelograms were computed for pairs of simultaneously recorded spike trains, at rest and during movement. Periodic oscillations were detected using the correlograms of all recorded spike trains, calculated for a 500 ms offset with a bin size of 1 ms. The power spectra of the spike trains were calculated by the Fourier transform of the autocorrelograms (after removing the trough at time zero), allowing 1 Hz resolution of the frequencies (Raz et al., 2000). Further analysis was performed between 5 and 40 Hz. The signal-to-noise ratio (SNR) was calculated for each neuron using the following formula:
SNR = [(Maximum power of the peak) − (Mean of the power spectrum between 5 and 40 Hz)]/(Standard deviation of the power spectrum between 5 and 40 Hz).
Significant oscillatory activity was defined as a peak in the power spectrum exhibiting a SNR greater than three times the standard deviation of the power spectrum (Raz et al., 2000). We examined 24 neurons that were determined to have significant oscillatory behavior according to the power in the peak of the power spectrum between 5 and 40 Hz.
A Point Process Model of Subthalamic Nucleus Dynamics
We formulated a point process model to relate the spiking propensity of each STN neuron to factors associated with the movement time-course and features of the neuron's spiking history. Point processes provide a useful mathematical framework for analyzing neural spike trains (Daley and Vere-Jones, 2003; Brown, 2005). A point process is completely defined by its conditional intensity function. The well-known Poisson process is a specific example of a point process in which all events are independent (Brown, 2005). That is, the probability that a neuron spikes at a given time does not depend on the past spiking history. Since neural spiking is known to exhibit both short-term history dependence such as refractoriness and bursting and long-term dependence related to neural rhythms, we chose a more general point process model instead of a Poisson process for our analyses.
To analyze the spiking propensity of the STN neurons, we define the spiking intensity function at each time t as a function of the time relative to the start of the movement and the neuron's spiking history in the preceding 150 ms as follows:
where gl,d (t) is a basis function for a cardinal spline for the movement direction d, na:b is the number of spikes observed in the interval [a,b) and are a set of unknown parameters which relate movement time course and the neuron's spiking history to current spike rate. Cardinal splines are locally defined 3rd order polynomials that can approximate any continuous function (Frank et al., 2002). Here, we have used spline functions to capture the firing probability at a function of time relative to the start of the joystick movement. The times tstart and tend are the analysis start and stop times, respectively.
It follows from the precise definition of the conditional intensity function for a point process (Daley and Vere-Jones, 2003; Brown, 2005) that the probability of a spike in a small time interval [t, t + Δ) is approximately:
Hence by Equation 2, the intensity function defines explicitly the spiking probability in any small time interval [t, t + Δ). The parameters measure the effect of the movement planning and execution on the spiking probability. The parameters measure the effects of spiking history in the previous 10 ms and, therefore, they capture the effects of refractoriness and bursting on the spiking probability. The parameters measure the effects of the spiking history in the previous 10–150 ms, which are most likely associated with not only the neuron's individual spiking activity but also that of its local network.
Model Fitting and Data Analysis
Defining the spiking intensity function (Equation 1) so that its log is a linear function of the movement time course and spiking history means that this model can be fit to the STN spike trains using maximum likelihood methods based on the theory of GLMs (Brillinger, 1988; Truccolo et al., 2004). The GLM is an extension of the multiple linear regression model to the case in which the variable being predicted, in this case spike events, is not normally distributed (McCullagh and Nelder, 1989). GLMs provide an efficient computational scheme for model parameter estimation and a likelihood framework for conducting statistical inferences based on the estimated model.
For each of the 24 neurons, we chose Δ = 1 ms, and we fit the intensity function model in Equation 1 to its spike train. That is, we estimated the set of parameters θ for each neuron. We examined separate model fits to the data for a period prior to movement onset (tstart = −1500 ms, tend = −1000 ms) and another period during movement (tstart = 0 ms, tend = 500 ms). These periods were chosen to highlight possible changes in the spiking patterns for a period well before movement to a period during movement. In order to track the temporal spiking properties of each neuron through time, we also constructed an additional model encompassing the entire trial (tstart = −1500 ms, tend = 1500 ms) where the and parameters were fit separately for each 500 ms interval [(−1500 ms, −1000 ms), …, (1000 ms, 1500 ms)]. Significantly different parameter estimates between these intervals suggest that the temporal neural firing properties change as a function of movement and the difference reflects the magnitude of change.
To assess the goodness-of-fit of the resulting models, we applied the time-rescaling theorem (Brown et al., 2002). If the spiking model is accurate, this produces a set of rescaled times that are independent with an exponential distribution with mean 1. We construct Kolmogorov-Smirnov (KS) plots of the empirical cumulative distribution of the rescaled times versus the theoretical cumulative distribution of the exponential to visualize the quality of the model fit, and compute the KS statistic (the maximum difference between the empirical and theoretical distribution) to compare models numerically.
An additional tool for comparing the quality of two neural spiking models is AIC, which is equal to −2 times the log likelihood of the data +2 times the number of parameters in the model. This penalized likelihood measure provides a balance between models that describe the data well, and models that describe the data with a small number of parameters. By this criterion, the model with the smallest AIC provides the most parsimonious fit to the data.
Results
The firing properties of a single STN neuron during this reaching task are illustrated in Figures 3A–C. Figure 3A shows spike rasters of spiking relative to movement onset for trials in each direction. The neuron spikes with a high rate (over 100 Hz) for movements in each direction. By careful inspection, we observe a slight increase in spike rate at a time near movement onset (0 ms), but this increase is not dramatic and it is difficult to determine whether there is a significant difference for movements in each of the four directions. Figure 3B shows the autocorrelation function for this neuron's spiking. There is a clear negative correlation at lag 1 ms, which is expected because of the refractory period, and a clear positive correlation at lags 2–3 ms, suggesting a tendency to fire in rapid bursts. At longer lags, there appears to be some more subtle structure with slightly negative correlations between 20 and 30 ms and slightly positive correlations around 50 ms. This finding is corroborated by the spectral density estimator shown in Figure 3C, which identifies a large peak between 10 and 30 Hz, indicative of beta rhythm oscillatory activity.
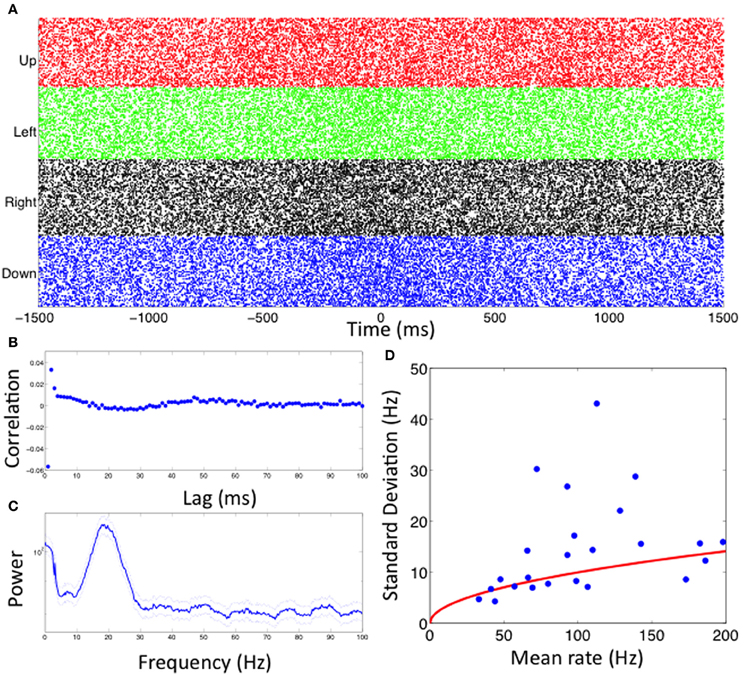
Figure 3. Visualizations of spiking activity. (A–C) Spike rasters for each movement direction, spike autocorrelation function, and spike power spectral density for one example neuron. (D) Mean and standard deviation of firing rate over trials for all neurons analyzed (blue dots). The red line indicates the expected relationship for a Poisson process.
Figure 3D shows the mean and standard deviation of the firing rate over multiple trials for all 24 of the STN neurons analyzed. The mean firing rates in this population ranged from 40 Hz to 200 Hz. The variability in the number of spikes from one trial to the next increases as the mean rate increases. The red line indicates the expected increase in the standard deviation of the spike rate if the spiking activity came from a Poisson process, that is, if each spike were independent of past spiking activity. While many of the neurons have mean and standard deviation values near this line, there are a number with much higher variability than could be explained by Poisson spiking. This suggests that history dependence may be important for characterizing the spiking properties in these neurons.
Figure 4 illustrates the model parameters and their uncertainty for the neuron whose firing properties are visualized in Figures 3A–C. Figure 4A shows the spline estimates and 95% confidence bounds of the stimulus related component as a function of time relative to movement onset, with the splines for the four directions plotted in separate colors (black—right; blue—down; green—left; red—up). In each case, the firing intensity is initially low and begins to increase about 500 ms prior to movement onset. The intensity reaches a peak between 200 ms prior to movement onset to 400 ms after movement onset, and eventually returns to initial firing levels. The shaded areas surrounding each estimate represent 95% confidence regions about the firing rate, which can be used to determine when the estimated rate in one direction is statistically different from another. For example, during movements to the upper target, indicated by the red line, the firing rate is significantly lower at movement onset than during movements to lower target, indicated by the blue line.
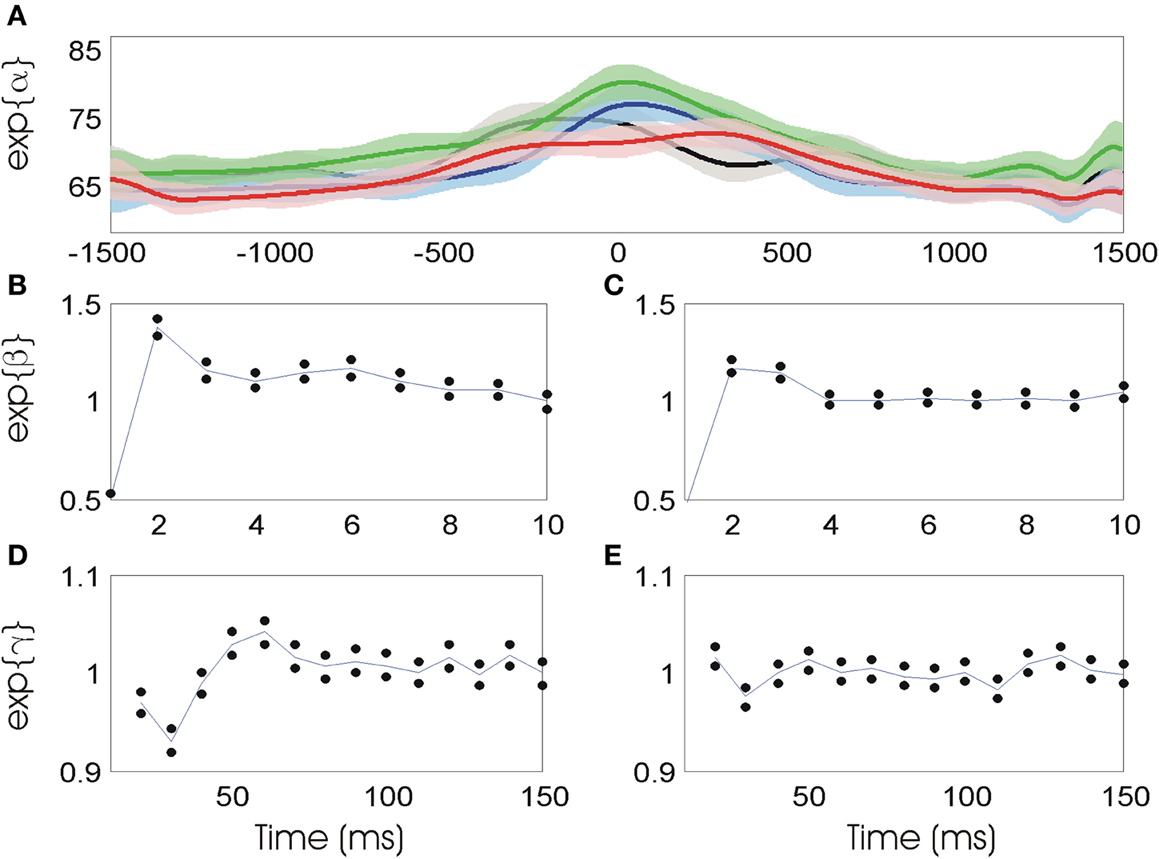
Figure 4. (A) Stimulus related firing rate estimates in each of four movement directions (black—right; blue—down; green—left; red—up). (B) Short-term history (0–10 ms) parameters prior to movement. Blue line represents parameter estimates, black dots represent confidence intervals. (C) Short-term history parameters during movement. (D) Long-term history parameters (10–150 ms) prior to movement. (E) Long-term history parameters during movement.
Figures 4B and C show the short-term history components of the model using the data 1500 ms to 1000 ms prior to movement onset and from movement onset to 500 ms into the movement, respectively. In both cases, the value of exp(β0) is approximately 0.5 and is significantly smaller than one, indicating that the probability of observing a spike in a 1 ms bin is cut in half if a previous spike was observed in the prior 1 ms bin. The values of exp(β1) and exp(β2) are significantly larger than one, indicating that the probability of firing increases 2–4 ms after a spike. This may relate to bursting activity in the spike train.
Figures 4D and E show the model parameter estimates related to long-term history effects before and during movement, respectively. In the period prior to movement onset, these parameters have a distinctive shape. Here, the parameter exp(γi), which relates the current spiking to the number of spikes occurring in the interval (10i, 10(i + 1)] in the past, is shown on the x-axis at time 10(i + 1). For example, exp(γ2), the parameter relating to ISIs between 20 and 30 ms, is significantly smaller than one while exp(γ4) and exp(γ5), relating to ISIs between 40 and 60 ms are significantly larger than one. In a population analysis across all 24 neurons analyzed, 21 revealed a similar temporal statistical spiking pattern consisting of a significantly decreased probability of firing 20–40 ms after the previous spike and a significantly increased probability 40–90 ms after a spike. During movement, the values of the long-term history parameters indicate virtually no significant effect of past spiking beyond 10 ms, with only exp(γ5) significantly different from one. Although there is still some inhibition 20–30 ms after a spike during movement, this effect is significantly reduced from the period prior to movement initiation.
Table 1 presents the population summary of the number of neurons exhibiting specific firing properties as determined by the significance levels of the model parameters, and a summary of the mean and standard deviations for specific history parameters. All of the neurons displayed refractory behavior, defined as a value of exp(β0) significantly smaller than one, and 23 out of the 24 oscillatory neurons displayed bursting behavior, defined as a value of exp(β1) significantly larger than one during the period before movement. Movement selectivity was defined as two consecutive movement parameters that are significantly larger than α0, d, and directional selectivity was defined as significantly different movement parameter corresponding to the same time interval but different directions. Of the 24 neurons we examined, 14 showed significantly increased firing at 200 ms prior to movement onset and 11 showed significant directional selectivity at this time. The pattern of long-term history dependence present in Figure 4, such that the estimate for exp(γ2) was significantly smaller than zero and the estimates for exp(γ4) through exp(γ7) were significantly larger than zero in the period before movement, was present in 21 of the 24 neurons examined. In the remaining three neurons, a similar pattern of inhibition followed by excitation was also present although the associated parameters did not reach significance. In all of the 21 neurons that did exhibit this significant pattern of inhibition and excitation, these parameters were significantly different between the premovement and movement execution periods.
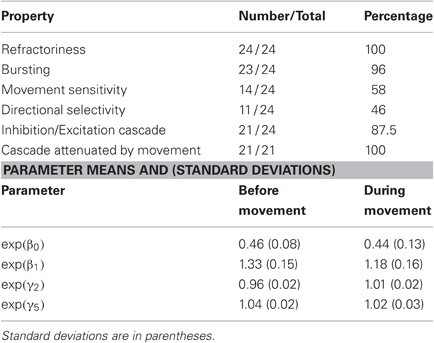
Table 1. Population summary for oscillatory neurons.
Figure 5 shows KS plots of the model fits for the cell modeled in Figure 4 using the full model in equation 1 and each of the components of that model taken individually. The closer the KS plot is to the 45° line, the closer the model fit to the data. The model that minimizes the maximum deviation, the KS statistic listed at the top of each panel, provides the best fit to the data. Not surprisingly, the complete model containing the stimulus-related component as well as the short- and long-term history components provides the best fit. Examining the component models, we found that the immediate history component most contributes to goodness-of-fit, followed by the long-term history component, followed by the stimulus-related component. This observation is further supported by the AIC values for this neuron and these models, which are displayed in Table 2. Each model is compared to a null model that treats the spiking as a Poisson process with constant firing rate. Each of the 24 oscillatory neurons analyzed exhibited similar goodness-of-fit results. In each case, the full model had the smallest KS statistic and minimum AIC score and the single component that contributed most to the overall fit was the immediate history component. On average, the model improvement related to the stimulus component, the immediate history component, and the long-term history component was 16%, 75%, and 17% of the improvement from the full model, respectively.
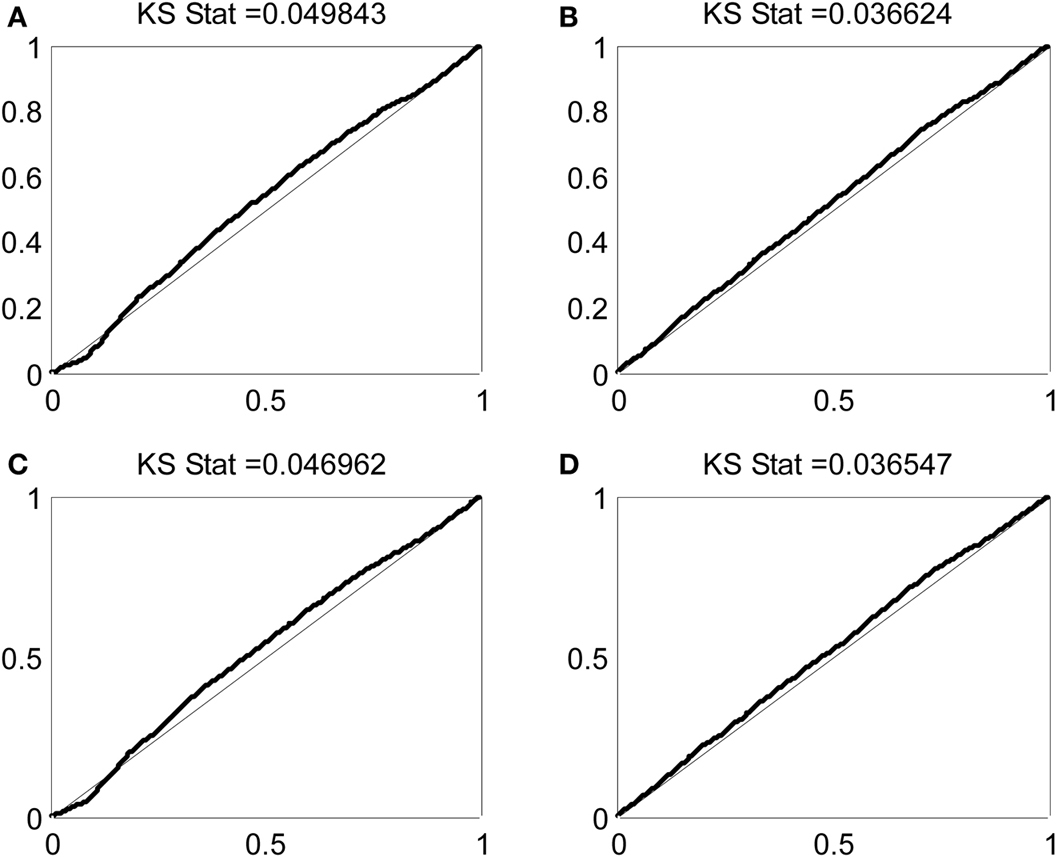
Figure 5. KS plots for models comprising (A) only stimulus related component, (B) only immediate history component, (C) long-term history component, and (D) the complete model.
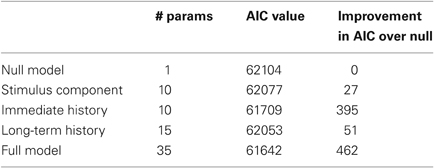
Table 2. Computation of AIC values for component and full models.
Discussion
Previous analyses of aberrant spiking patterns of STN neurons in PD have focused on features of the spike train power spectrum. In these analyses, the oscillatory behavior of STN neurons in PD when not attempting to make an explicit arm movement is described as a peak in the power spectrum between 10 and 20 Hz that is evident above the noise in the computation of the power spectrum itself. This same baseline noise could mask other features of the spiking properties of these neurons that are important in characterizing how their firing relates to the pathogenesis of PD. In the above analysis, we have used point process models to estimate the instantaneous intensity of neural spiking as a function of time relative to movement onset, movement direction, and the past spiking activity of the neuron being modeled. Using a simple GLM framework, we are able to compute optimal parameters to fit the data, which are interpretable in terms of the relation between a covariate and the observed spiking activity, to determine the statistical significance of these parameters, and to measure overall goodness-of-fit between the resulting GLM model realization and the data.
We can interpret the stimulus-related parameters as defining the spiking rate in the absence of recent spiking activity. When we compare these estimated parameters in the full model to those in the model with only the stimulus-related component, we find that they are largely identical, indicating that the inhibitory and excitatory effects of past spikes tend to average each other out. Therefore, the neuron in Figure 4 has an average firing rate of about 65 spikes per second 1.5 s before the initiation of a movement in any direction. Over half of the neurons we analyzed showed a significant increase in the firing activity that began 500–800 ms prior to movement onset, peaked sometime between 200 ms prior to movement to 500 ms following movement onset, and lasted up to a second into the movement. Amirnovin et al. (2004) found similar significance results by averaging over a population of STN neurons. Our analyses also revealed directional selectivity among a number of these oscillatory neurons, in agreement with the results of Williams et al. (2005).
The estimated values and significance levels of the history-related parameters are particularly noteworthy. We can interpret the values of these parameters as modulations of the stimulus-related intensity, based on past spiking activity. A parameter value that is less than zero, so that its exponentiated value is less than one, indicates a reduced probability of firing due to a previous spike, or an inhibitory history effect, while a value that is greater than zero indicates an increased probability, or an excitatory history effect. For any neuron, the fact that any of these parameter estimates is significantly different from one indicates that a Poisson process cannot completely describe its spiking behavior. The oscillatory neurons we observed here have significant history effects at both short and long intervals. Therefore, rate models of STN spiking that do not take firing history into account will not capture the highly non-Poisson structure in the observed spike trains.
The short-term history parameters, , relate to intrinsic firing properties of the neuron. The fact that exp(β0) was significantly smaller than one in all of the oscillatory neurons observed reflects a 0–1 ms refractoriness in the spiking of each of those neurons. In all but one of these neurons, the estimated value of exp(β1) was significantly larger than one, indicating that 1–2 ms after a previous spike, the probability of another spike is greatly increased. In a number of these cells, this increased probability of firing persisted up to 5 ms after a previous spike. This is characteristic of neurons that fire in rapid bursts of two or more spikes.
The estimated values of the long-term history parameters, , characterize the statistical structure of the oscillatory spiking behavior of these neurons. In 21 of the 24 neurons analyzed, we found a significant reduction in the firing intensity at about 20–40 ms following a spike, at which point the probability of spiking decreased by 5–10%. In all of these neurons, firing intensity is significantly increased by 2–5% between 40 and 90 ms after a spike. This suggests that the peak in the computed power spectra of these oscillatory neurons is due to an initial period of inhibition followed by a period of increased excitability. The fact that the decrease and increase in firing is only a small percentage of the stimulus related intensity suggests that the spiking behavior of these neurons is not strictly periodic, with spikes occurring at each cycle. Instead, the probability of firing is only slightly altered by past spiking. For example, for the neuron represented in Figure 4, the probability of firing at least one spike 20–30 ms after a previous spike, at the point of maximum inhibition, is 0.44, while the probability of firing at least one spike 50–60 ms after a previous spike, at the point of maximum facilitation is 0.5. This difference may not be easy to identify by eye in the spike train for a given neuron, but does show up significantly in the power spectrum and model fits with sufficient data.
Our comparative goodness-of-fit analysis on the component neural spiking models characterizes the relative contributions of covariates related to the movement signal and the short- and long-term history effects on our ability to describe and predict spiking activity. The AIC value for each component model is smaller than a null Poisson spiking model, indicating that each one of these components improves the fit to the data when added individually to the model. Additionally, the AIC of the full model is better than that of any model component alone, indicating that no one component provides complete information about the statistical spiking properties. Nevertheless, adding the immediate history component to the null model improves its fit dramatically more than adding either of the stimulus-related or long-term history effects. This suggests that most of our ability to predict spike times from this model comes from characterizing the intrinsic properties of the neuron such as refractoriness and bursting. This is not entirely surprising, as the values of the short-term history parameters tend to change the baseline firing intensity more than 50% upward and downward. By comparison, the values of the stimulus-related parameters never changes the baseline firing intensity by more than 20% and the values of the long-term history parameter never increase or decrease it by more than 10%.
While this analysis suggests that a full characterization of STN spiking must include short history terms related to the neuron's internal dynamics, it is the resulting estimates for the intermediate history terms that shed light on possible mechanisms for oscillatory behavior of STN neurons. We found that these oscillations could be described by a cycle of inhibition and excitation that takes place from 20 to 90 ms after a previous spike and that voluntary movements attenuate this spiking pattern. This suggests that beta frequency oscillations may be caused by network effects involving multiple regions of the basal ganglia rather than the intrinsic properties of individual STN neurons. One hypothesis is that synchronized firing in the STN feeds back to the globus pallidus pars externa (GPe), which then provides a wave of inhibition back to STN (Plenz and Kital, 1999). The timing of the oscillatory spike patterns would, therefore, be determined by the time course of excitation and inhibition within this recurrent loop (Montgomery, 2004). When planning and executing a voluntary movement, increased neural inputs from cortical premotor and motor areas could serve to disrupt this cycle of excitation and inhibition by stimulating the STN in a non-synchronous manner and at frequencies different from the natural oscillatory frequency, thereby disrupting the network responsible for this pattern of activity.
While this analysis focused on characterizing patterns of oscillatory spiking in the Parkinsonian STN and comparing these patterns between rest and movement periods, to understand the mechanisms underlying the disease, we would ideally like to analyze how oscillations in the Parkinsonian STN differ from spiking activity in the healthy STN. Previously, we have used analogous methods to compare spike patterns in human Parkinsonian STN to healthy non-human primate STN (Sarma et al., 2010), finding that Parkinsonian STN had significantly more cells with dominant beta oscillatory activity and significantly fewer cells with strong directional tuning. As DBS technology advances, it is likely that it will be used at earlier stages of PD, allowing for comparison of directional tuning and oscillatory activity at different stages of disease progress.
Additionally, in future work, we plan to explore variability in spiking activity over multiple locations in the STN. We hypothesize that specific subregions of STN may have spike patterns that are more affected by the disease process or more related to specific motor symptoms than others. The GLM methods outlined here provide a natural framework for comparing firing activity across spatial regions. These statistical methods may also aid in the development of improved treatments. For example, GLM analyses of spatial variability in spiking patterns may help identify specific subregions of STN where DBS stimulation is most effective. Similarly, applying these methods to simultaneous recordings from multiple structures in basal ganglia and cortex could be used to identify alternate targets for stimulation, for example specific locations in motor cortex that are statistically connected to STN activity.
These results demonstrate that point-process analyses provide an elegant approach to determining the relative contributions of intrinsic dynamics and external stimuli to the propensity of neurons to fire. This approach provides a systematic framework for characterizing subthalamic neuronal activity and differentiating normal from pathologic activity. Moreover, these data suggest that the pathophysiological mechanisms that underlie PD likely reflects abnormal network processing (Gale et al., 2009), the dynamics of which cannot be completely described using first order analysis such as firing rate and/or power spectral calculations.
Conflict of Interest Statement
The authors declare that the research was conducted in the absence of any commercial or financial relationships that could be construed as a potential conflict of interest.
Acknowledgments
This work was supported by grants from the National Science Foundation [IIS-0643995 to Uri T. Eden]; the National Institute of Neurological Disorders and Stroke [R01 NS073118 to Uri T. Eden and K08 NS041851 to Emad N. Eskandar]; and the Parkinson's Disease Foundation to Emad N. Eskandar.
References
Amirnovin, R., Williams, Z. M., Cosgrove, G. R., and Eskandar, E. N. (2004). Visually guided movements suppress subthalamic oscillations in Parkinson's disease patients. J. Neurosci. 24, 11302–11306.
Amirnovin, R., Williams, Z. M., Cosgrove, G. R., and Eskandar, E. N. (2006). Experience with microelectrode guided subthalamic nucleus deep brain stimulation. Neurosurgery 58(Suppl. 1), ONS96–ONS102.
Baker, K. B., Montgomery, E. B., Rezai, A. R., Burgess, R., and Lüders, H. O. (2002). Subthalamic nucleus deep brain stimulus evoked potentials: Physiological and therapeutic implications. Mov. Disord. 17, 969–983.
Bergman, H., Wichmann, T., Karmon, B., and DeLong, M. R. (1994). The primate subthalamic nucleus. II. Neuronal activity in the MPTP model of parkinsonism. J. Neurophysiol. 72, 507–520.
Brillinger, D. R. (1988). Maximum likelihood analysis of spike trains of interacting nerve cells. Biol. Cybern. 59, 189–200.
Brown, E. N. (2005). “Theory of point processes for neural systems,” in Methods and Models in Neurophysics, Chapter 14, eds C. C. Chow, B. Gutkin, D. Hansel, C. Meunier, and J. Dalibard (Paris: Elsenier), 691–726.
Brown, E. N., Barbieri, R., Ventura, V., Kass, R. E., and Frank, L. M. (2002). The time-rescaling theorem and its application to neural spike train data analysis. Neural Comput. 14, 325–346.
Cassidy, M., Mazzone, P., Oliviero, A., Insola, A., Tonali, P., Di Lazzaro, V., and Brown, P. (2002). Movement related changes in synchronization on the human basal ganglia. Brain 125, 1235–1246.
Daley, D. J., and Vere-Jones, D. (2003). An Introduction to the Theory of Point Processes, 2nd Edn. New York, NY: Springer.
DBS Study Group. (2001). Deep-brain stimulation of the subthalamic nucleus or the pars interna of the globus pallidus in Parkinson's disease. N. Engl. J. Med. 345, 956–963.
Frank, L. M., Eden, U. T., Solo, V., Wilson, M. A., and Brown, E. N. (2002). Contrasting patterns of receptive field plasticity in the hippocampus and the entorhinal cortex: an adaptive filtering approach. J. Neurosci. 22, 3817–3830.
Gale, J. T., Amimovin, R., Williams, Z. M., Flaherty, A. W., and Eskandar, E. N. (2008). From symphony to cacophony: pathophysiology of the human basal ganglia in Parkinson's disease. Neurosci. Biobehav. Rev. 32, 378–387.
Gale, J. T., Shields, D. C., Jain, F. A., Amirnovin, R., and Eskandar, E. N. (2009). Subthalamic nucleus discharge patterns during movement in the normal monkey and Parkinsonian patient. Brain Res. 1260, 15–23.
Harris, K. D., Henze, D. A., Csicsvari, J., Hirase, H., and Buzsaki, G. (2000). Accuracy of tetrode spike separation as determined by simultaneous intracellular and extracellular measurements. J. Neurophysiol. 84, 401–414.
Hutchison, W. D., Allan, R. J., Opitz, H., Levy, R., Dostrovsky, J. O., Lang, A. E., and Lozano, A. M. (1998). Neurophysiological identification of the subthalamic nucleus in surgery for Parkinson's disease. Ann. Neurol. 44, 622–628.
Kopell, B. H., Rezai, A. R., Chang, J. W., and Vitek, J. L. (2006). Anatomy and physiology of the basal ganglia: implications for deep brain stimulation for Parkinson's disease. Mov. Disord. 21(Suppl. 14), S238–S246.
Lang, A. E., and Lozano, A. M. (1998). Parkinson's disease: second of two parts. N. Engl. J. Med. 339, 1130–1143.
Lebois, A., Meissner, W., Bioulac, B., Gross, C. E., Hansel, D., and Borand, T. (2007). Late emergence of synchronized oscillatory activity in the pallidum during progressive parkinsonism. Eur. J. Neurosci. 26, 1701–1713.
Levy, R., Ashby, P., Hutchinson, W. D., Lang, A. E., Lozano, A. M., and Dostrovsky, J. O. (2002). Dependence of subthalamic nucleus oscillations on movement and dopamine in Parkinson's disease. Brain 125, 1196–1209.
Levy, R., Hutchinson, W. D., Lozano, A. M., and Dostrovsky, J. O. (2000). High-frequency synchronization of neuronal activity in the subthalamic nucleus of parkinsonian patients with limb tremor. J. Neurosci. 20, 7766–7775.
Limousin, P., Greene, J., Pollak, P., Rothwell, J., Benabid, A. L., and Frackowiak, R. (1997). Changes in cerebral activity pattern due to subthalamic nucleus or internal pallidum stimulation in Parkinson's disease. Ann. Neurol. 42, 283–291.
Limousin, P., Krack, P., Pollak, P., Benazzouz, A., Ardouin, C., Hoffmann, D., and Benabid, A. L. (1998). Electrical stimulation of the subthalamic nucleus in advanced Parkinson's disease. N. Engl. J. Med. 339, 1105–1111.
Magill, P. J., Sharott, A., Harnack, D., Kupsch, A., Meissner, W., and Brown, P. (2005). Coherent spike-wave oscillations in the cortex and subthalamic nucleus of the freely moving rat. Neuroscience 132, 659–664.
McCullagh, P., and Nelder, J. A. (1989). Generalized Linear Models, 2nd Edn. Boca Raton, FL: Chapman and Hall/CRC.
Montgomery, E. B. Jr. (2004). Dynamically coupled, high-frequency reentrant, non- linear oscillators embedded in scale-free basal ganglia-thalamic-cortical networks mediating function and deep brain stimulation effects. Nonlin. Stud. 11, 385–421.
Plenz, D., and Kital, S. T. (1999). A basal ganglia pacemaker formed by the subthalamic nucleus and external globus pallidus. Nature 400, 677–682.
Raz, A., Vaadia, E., and Bergman, H. (2000). Firing patterns and correlations of spontaneous discharge of pallidal neurons in the normal and the tremulous 1-methyl-4-phenyl-1-2-3-6-tetrahydropyridine vervet model of parkinsonism. J. Neurosci. 20, 8559–8571.
Sarma, S. V., Eden, U. T., Cheng, M. L., Williams, Z. M., Hu, R., Eskandar, E., and Brown, E. N. (2010). Using point process models to compare neural spiking activity in the subthalamic nucleus of Parkinson's patients and a healthy primate. IEEE Trans. Biomed. Eng. 57, 1297–1305.
Truccolo, W., Eden, U. T., Fellows, M. R., Donoghue, J. P., and Brown, E. N. (2004). Point process models for MI spiking activity: neural encoding and decoding. J. Neurophysiol. 93, 1074–1089.
Williams, Z. M., Neimat, J., Cosgrove, G. R., and Eskandar, E. N. (2005). Timing and direction selectivity of subthalamic and pallidal neurons in patients with Parkinson's disease. Exp. Brain Res. 162, 407–416.
Keywords: STN, Parkinson's, oscillations, spikes, modeling
Citation: Eden UT, Gale JT, Amirnovin R and Eskandar EN (2012) Characterizing the spiking dynamics of subthalamic nucleus neurons in Parkinson's disease using generalized linear models. Front. Integr. Neurosci. 6:28. doi: 10.3389/fnint.2012.00028
Received: 27 January 2012; Accepted: 22 May 2012;
Published online: 20 June 2012.
Edited by:
Sridevi V. Sarma, Johns Hopkins University, USAReviewed by:
Hao Zhang, Duke University, USAAdrian Rodriguez-Contreras, City College of New York, USA
Copyright: © 2012 Eden, Gale, Amirnovin and Eskandar. This is an open-access article distributed under the terms of the Creative Commons Attribution Non Commercial License, which permits non-commercial use, distribution, and reproduction in other forums, provided the original authors and source are credited.
*Correspondence: Uri T. Eden, Department of Mathematics and Statistics, Boston University, 111 Cummington Street, Boston, MA 02215, USA. e-mail: tzvi@bu.edu