Automatic deep learning method for third lumbar selection and body composition evaluation on CT scans of cancer patients
 Lidia Delrieu1
  Damien Blanc2,3
  Amine Bouhamama4
  Fabien Reyal1,5 Frank Pilleul4
  Victor Racine2 Anne Sophie Hamy1,6 Hugo Crochet7 Timothée Marchal8 Pierre Etienne Heudel9*
- 1Residual Tumor & Response to Treatment Laboratory, RT2Lab, Translational Research Department, INSERM, U932 Immunity and Cancer, Institut Curie, Paris University, Paris, France
- 2QuantaCell, Pessac, France
- 3IMAG, Université de Montpellier, Montpellier, France
- 4Department of Radiology, Centre Léon Bérard, Lyon, France
- 5Department of Surgical Oncology, Institut Curie, University Paris, Paris, France
- 6Department of Medical Oncology, Institut Curie, University Paris, Paris, France
- 7Data and Artificial Intelligence Team, Centre Léon Bérard, Lyon, France
- 8Department of Supportive Care, Institut Curie, Paris, France
- 9Department of Medical Oncology, Centre Léon Bérard, Lyon, France
Introduction: The importance of body composition and sarcopenia is well-recognized in cancer patient outcomes and treatment tolerance, yet routine evaluations are rare due to their time-intensive nature. While CT scans provide accurate measurements, they depend on manual processes. We developed and validated a deep learning algorithm to automatically select and segment abdominal muscles [SM], visceral fat [VAT], and subcutaneous fat [SAT] on CT scans.
Methods: A total of 352 CT scans were collected from two cancer centers. The detection of the third lumbar vertebrae and three different body tissues (SM, VAT, and SAT) were annotated manually. The 5-fold cross-validation method was used to develop the algorithm and validate its performance on the training cohort. Results were validated on an external independent group of CT scans.
Results: The algorithm for automatic L3 slice selection had a mean absolute error of 4 mm for the internal validation dataset and 5.5 mm for the external validation dataset. The median DICE similarity coefficient for body composition was 0.94 for SM, 0.93 for VAT, and 0.86 for SAT in the internal validation dataset whereas it was 0.93 for SM, 0.93 for VAT, and 0.85 for SAT in the external validation dataset. There were high correlation scores with sarcopenia metrics in both internal and external validation datasets.
Conclusions: Our deep learning algorithm facilitates routine research use and could be integrated into electronic patient records, enhancing care through better monitoring and the incorporation of targeted supportive measures like exercise and nutrition.
1 Introduction
Body composition plays a crucial role in the development and progression of numerous diseases, including cancer (1–3). The prevalence of the decrease in muscle mass, known as sarcopenia, varies depending on the cancer stages, ranging from 39.6% for curable cancers to 49.2% in palliative conditions (4). A recent study published in 2023, which included 20 meta-analyses involving over 52,600 patients, revealed that sarcopenia was predictive of overall and disease-specific survival in various cancer types, including lung cancer and digestive cancers (5). Its assessment has been of growing interest in recent years, as low muscle mass is also predictive of chemotherapy toxicity (6–15), dose-limiting toxicities (16) and poor prognosis (17–19).
Despite its significant impact on cancer patient care, body composition evaluation is not performed routinely or used in clinical decision-making (20). Imaging techniques such as dual energy x-ray absorptiometry and computed tomography (CT) scans are highly accurate methods for assessing body composition. In the oncology setting, CT scan cross-section at the third lumbar (L3) level is widely used for this purpose as part of routine cancer diagnostic procedures with no additional cost or toxicities (16, 21–24, 25). However, manual measurement of body composition through CT scans is time-consuming and requires expertise, which limits its practical use in daily clinical practice. Artificial intelligence using deep learning provides an opportunity to automate muscle mass assessment with high precision (26–31), but validated tools for research and integration into the electronic medical record are scarce. Accordingly, studies proposing algorithms for detecting body composition from L3 have been conducted on homogeneous populations with few challenging cases, such as patients undergoing cementoplasty or those with intra-corporeal devices, which are common in the cancer population, especially among metastatic patients. One study, conducted by Ha, focused on developing a deep learning model for L3 slice selection and a fully convolutional network (FCN)-based algorithm for segmentation of abdominal muscle and fat (30). The study demonstrated high accuracy in automatic L3 slice selection, with mean distance differences of 3.7 ± 8.4 mm and 4.1 ± 8.3 mm in internal and external validation datasets, respectively. However, challenges arose in cases involving anatomic variations, highlighting the need for improved methods in these scenarios. Kreher presented a deep learning-based approach for skeletal muscle mass segmentation at the L3 level in routine abdominal CT scans (32). Utilizing a U-Net architecture, the study achieved impressive Dice scores ranging from 0.86 to 0.95 for different muscle types. This approach demonstrated the potential to expedite the segmentation process and serve as a foundation for future biomarker development. A recent meta-analysis published in 2023 assessed the feasibility and accuracy of automatic segmentation tools for body composition through 92 studies (33). The review highlighted the success of deep learning algorithms in achieving excellent segmentation performance, especially in the context of rapid and automated volumetric body composition analysis. However, the study emphasized the need for consensus in defining accuracy and precision standards for ground-truth labelling, ensuring the reliability of these automated techniques. While these studies have undoubtedly advanced the field of automated abdominal muscle assessment and body composition analysis, they have also highlighted the need for continuous refinement, particularly in the face of challenges related to anatomic variations, segmentation accuracy, and standardization of protocols. More studies are needed to contribute significantly to the field by collecting international data on segmentation algorithms. This collaborative effort will undoubtedly propel the field of abdominal muscle assessment through CT imaging to unprecedented heights.
The main aim of this study was to develop and validate a deep learning-based algorithm to automatically select the L3 slice on abdominal CT scans from cancer patients and segment abdominal muscles (SM), visceral fat (VAT), and subcutaneous fat (SAT).
2 Materials
2.1 Ethics
The study was approved in July 2020 by the local data protection officer, on behalf of French regulatory authorities (Commission Nationale de l'Informatique et des Libertés, CNIL) in accordance with MR004 methodology (R201-004-207). All patients were informed of the possibility of their health data being used for research purposes and expressed no opposition to this possibility.
A MedExprim® tool (34) tool was used to obtain the images of the patients which were exported in batch from PACS and de-identified.
2.2 Study design
Three datasets were used to: (i) to develop an algorithm to select L3 (dataset 1); (ii) to develop an algorithm to segment body composition (dataset 2); and (iii) to validate both algorithms on an external validation cohort (dataset 3) (Figure 1). The development of the two algorithms was carried out on patients with solid cancers treated with immunotherapy at the Leon Bérard Center in Lyon. An external validation in patients with solid tumors from the Institut Curie, Paris, was also carried out.

Figure 1. Composition of the datasets.
As the two cancer facilities are both regional comprehensive cancer centers, a sake of data diversity (e.g., scanners, slice thickness, resolution) was obtained which reinforces the robustness and generalization of the algorithms. All images were included, even those with artifacts, arms in the field of view, spinal cementoplasty, or other intracorporeal devices (ureteral stents for example).
2.3 Patient characteristics
Dataset 1 for L3 selection consisted of a total of 330 cancer patients (Table 1). Among this population, 30 were excluded because the scans did not contain the L3 slice and two because of problems reading the DICOM file. The final dataset was composed of 298 cancer patients [137 women and 161 men, mean age 59.9 years (range: 18‒96)]. All patients had CT scans. A total of 286 patients had metastatic cancer and 25 had multiple cancers.

Table 1. Clinical characteristics of the study population.
Dataset 2 for body composition included 250 patients and one patient had a DICOM file reading error. Thus the final database consisted of 249 cancer patients [89 women and 160 men; mean age 58.0 years (range: 18‒85)] (Table 1). All patients had solid cancers, 224 had metastatic cancer and 15 had multiple cancers.
Dataset 3 for the external validation of the algorithm was initially composed of 60 cancer patients (Table 1). However, the DICOM files could not be opened for seven patients, leading to a final database of 53 patients (all women, mean age 61.8 years) treated for either metastatic breast cancer or lung cancer.
2.4 Manual labeling and data format
All the images were labeled by a senior radiologist (AB) to validate the L3 location and the body composition segmentation.
2.4.1 L3 selection
The DICOM format axial slices of a CT scan were evaluated to identify L3, which was then located and recorded in an Excel table (.xlsx), indicating its position in the full 3D scan.
2.4.2 Body composition segmentation
To segment the L3 scan sections manually, 3D slicer software was used. The segmentation process involved two steps: (i) an initial segmentation was performed using intensity thresholds; (ii) a manual pixel-by-pixel correction was then performed for each class. To segment the muscle tissue, an intensity threshold ranging from −29 to 150 Hounsfield units (HU) was applied. Similarly, for adipose tissue, which includes both SAT and VAT, an intensity threshold ranging from −500 to −30 HU was used (35).
2.4.3 Data preprocessing
To simplify the task and reduce resource requirements, several preprocessing steps were undertaken. A maximum Z-projection was applied to all 3D scans, resulting in a 2D coronal slice where L3 was typically visible. Intensity thresholding was then performed, followed by morphological mathematical operations to obtain a whole-body segmentation mask.
Mathematical operations include dilation and closing, fundamental image analysis techniques widely used to smooth and shape regions in binary or grayscale images. The voxels outside of this mask were reduced to zero before projection. Next, a pre-cropping procedure was performed on each scan to eliminate artifacts in irrelevant regions and to reduce the image dimensions as much as possible. The procedure consisted of two steps: (i) rough localization of the lung centroid based on an intensity threshold; followed by (ii) localization of the pelvic centroid using a skeletonization method on a bone mask. However, this method was not applied in all situations, and pre-cropping was only done when the resulting distance between the two centroids exceeded 20 cm. To standardize the dimensions, the entire dataset was scaled to 1 mm thickness per pixel and all images were padded to achieve a size of 1064 × 512. The L3 detection problem was treated as a segmentation task and thus a binary mask with a 1-pixel-thick region was used to locate L3 after the preprocessing step. To partially address the class imbalance, the L3 region was extended to a thickness of 1 cm.
2.4.4 Training procedure
One popular deep learning model for medical image segmentation is U-net, which is designed for semantic segmentation tasks and has been successfully applied to body composition analysis (26, 27, 32, 36). The U-net architecture includes a contracting path for feature extraction and a symmetric expanding path for precise localization, which allows for accurate segmentation of complex anatomic structures. The U-net model specifications were carefully designed to optimize the performance of our system. We utilized a standard U-net architecture with 3 × 3 convolutional kernels and structured the model with an encoder and decoder block of layers. Our architecture comprised 4 down-sampling and up-sampling layers, ensuring a robust and effective feature extraction process. To fine-tune our approach, we meticulously adjusted the number of filters in each convolutional layer using a progressive increase/decrease strategy. For the L3 detection task, we initiated the first layer with 64 filters and doubled the number of filters in subsequent layers, whereas for the body composition segmentation, a relatively less complex task, we started with 32 filters. Notably, our models were initialized with random weights, although we acknowledge the potential advantages of utilizing pre-trained models, especially on larger datasets. To measure the dissimilarity between predicted and ground truth segmentations, we employed the dice loss function, a common choice for segmentation tasks. Additionally, we paid close attention to the input size, padding the images to 1088 × 512 pixels for L3 detection and setting it to 512 × 512 pixels for body segmentation. This preprocessing step was crucial in adapting the images to the specific requirements of each task, ensuring accurate and reliable results. Our study showcases the careful consideration of model specifications, pre-training strategies, loss functions, and input size adjustments, highlighting the meticulous approach taken to achieve superior performance in medical image analysis using deep learning techniques.
To increase the size and variability of our training dataset and prevent overfitting, geometric data augmentation techniques were used. These techniques involved applying various transformations to the CT scans, such as rotation, scaling, translation, and elastic deformations, to generate new images with different orientations, scales, positions, and more realistic deformations. Artificial sections of the arms were also added to the L3 slices using intensity-based thresholding, and they were added at different positions and orientations to increase the variability of the training dataset. Supplementary Figure S1 shows examples of different data augmentation techniques applied on a single slice. This resulted in a much larger and more diverse training dataset, allowing deep learning models to learn more robust features in the data. The effectiveness of this technique was evaluated by comparing the performance of the U-net model with and without the additional arm sections, and the results showed that the inclusion of the augmented images significantly improved the accuracy and robustness of the U-net model. These findings suggest that this data augmentation technique could be useful for improving the performance of convolutional neural network (CNNs) in body composition analysis.
Two U-net models were trained for both L3 detection and body composition separately. Training was performed using the Adam optimizer with a learning rate of 0.0001 and a batch size of 8. Models were trained for 100 epochs on the augmented dataset with early stopping based on the validation loss. During training, the model was evaluated on the validation set after each epoch using the DICE coefficient, and the best performing model was saved for testing. The final trained model was evaluated on the test set to measure its generalization performance.
2.4.5 Testing procedure and post-processing
Both L3 detection and body composition problems were treated as segmentation problems. Therefore, each prediction was a probability map, where each pixel was assigned a probability of belonging to a certain class. In the case of L3 detection, the two classes were the L3 slice and the rest of the body, while for body composition segmentation, the classes corresponded to different tissue types (e.g., adipose tissue, muscle tissue, etc.).
For the L3 detection task, the final slice value was obtained through a post-processing step involving a projection of the probability map. Specifically, the probability map was projected onto a one-dimensional signal by taking the average probability along the vertical axis. This signal was then smoothed using a Gaussian filter to reduce the noise. The predicted L3 slice location was then determined by identifying local maxima in the smoothed signal, where the location of the global maximum corresponded to the precise location of the L3 slice.
To further refine the body composition segmentation results, a post-processing step was applied to the predicted probability maps for each class. This step involved thresholding the probability maps based on the HU values of the corresponding pixels. All pixels with HU values >150 or <−500 were ignored, as they were considered to be outside the range of interest. This helped to remove any noise or outliers in the predictions and improve the accuracy of the segmentation results.
2.4.6 Sarcopenia measurements
Skeletal muscle density (SMD) was quantified as the mean muscle radiation attenuation (in HU) of the muscle cross-sectional area across the L3 vertebral body level, and was assessed between −29 and 150 HU (37). Skeletal muscle index (SMI) (cm2/m2) was obtained by normalizing cross-sectional muscle area by patient height. Skeletal muscle gauge (SMG) (HU × cm2/m2) was calculated by multiplying muscle area by SMD. Lean body mass (LBM) was calculated according to the following equation: LBM (kg) = 0.3 × cross sectional muscle area at L3 (cm2) + 6.06 (25).
2.4.7 Performance evaluation
To evaluate the performance of the U-net model for L3 detection and body composition segmentation, a cross-validation approach was used. Cross-validation is a commonly used technique to assess the generalizability of a model by dividing the dataset into training and testing sets, and repeating the process multiple times with different partitions of the data. In this study, a 5-fold cross-validation was employed on datasets 1 and 2 to evaluate the robustness and accuracy of the U-net model. After the 5-fold cross-validation, the models were fully trained on datasets 1 and 2, and tested on dataset 3, which was not used for training.
The evaluation of the proposed algorithms was conducted at multiple levels, including the accurate detection of L3, the precise segmentation of body composition, and the reliable measurement of sarcopenia. Therefore, the performance of the models was evaluated using several metrics, including the mean absolute error (MAE), the DICE coefficient, the mean absolute percentage error (MAPE), and the R2 coefficient.
MAE is a suitable metric to measure the distance between the predicted location and the ground-truth location of L3. By using MAE, the accuracy of the model at predicting the exact location of L3 can be evaluated, regardless of whether the prediction is slightly above or below the true value. The closer MAE is to 0, the more accurate the model is.
The DICE coefficient was used to evaluate the agreement between measurements from fully automatic measurement and manual segmentation. This metric measures the overlap between the predicted and ground-truth segmentation masks (0 = no overlap; 1 = perfect overlap). Our results demonstrate that the U-net model achieved high accuracy and robustness across different datasets, indicating its potential as a reliable tool for body composition analysis in clinical practice.
MAPE measures the percentage difference between the predicted and ground-truth values, which is particularly useful when dealing with relative measurements such as muscle mass or muscle area.
The R2 score is a measure of how well the predicted values match the ground-truth values and ranges from 0 to 1, with higher values indicating better performance. These metrics provide additional insights into the accuracy and reliability of the sarcopenia measurements produced by the deep learning models, beyond the traditional MAE metric used for L3 detection.
To compare the performance of manual vs. automatic segmentation three methods were applied, MAE, MAPE, and R2 coefficient. An R2 coefficient of >0.7 would generally be seen as showing a high level of correlation, whereas a value <0.4 would show a low correlation.
All analysis was performed using Python (version 3.9) and the Tensorflow (version 2.5.0) library with a GeForce 2080Ti GPU.
3 Results
3.1 Evaluation of L3 slice selection
The accuracy of the algorithm for automatic L3 slice selection in the internal and external validation (datasets 1 and 3, respectively) is presented in Figure 2.
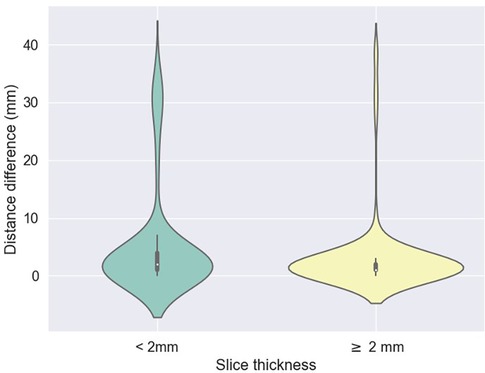
Figure 2. Difference between predicted (z) values by the L3 detection model and ground truth, stratified by scan thickness. The mean differences between the ground truth and the model predictions were 5.2 mm ± 9.1 for scans with a slice thickness less than 2 mm and 3.1 mm ± 6.7 for scans with a thickness of 2 mm or greater.
The mean absolute errors in slice selection between manual and automated L3 slice selection were 4.0 mm (±9.6) and 5.5 mm (±7.8) for the internal and external validation, respectively (datasets 1 and 3, respectively). The height of the vertebral body is approximately 40 mm (30).
In the majority of cases, automated segmentation correctly identified the L3 slice for 91.2% and 74.1% in datasets 1 and 3, respectively (Figure 3). Patients with intracorporeal devices or spinal changes had scores of 7.0 mm (±10.9) for dataset 1 (n = 31) and 5.0 mm (±6.2) for dataset 3 (n = 11).

Figure 3. Example of manual (green) and automatic (red) detection.
3.2 Evaluation of body composition
A comparison between manual and automatic segmentation is shown in Figure 4. Median DICE similarity coefficient (DSC) (and interquartile range) indicated excellent overlap >0.85 for both internal and external validation datasets (datasets 2 and 3, respectively) (Table 2). In dataset 2, our model had a DSC of 0.937 for SM and 0.927 for VAT. Similar results were found for dataset 3 with a DSC of 0.933 for SM and 0.930 for VAT. The DSC was lowest for the measurement of SAT in both datasets 2 and 3 (0.855 and 0.850, respectively).

Figure 4. Comparison between manual (left) versus automatic segmentation (right).

Table 2. Performance of the model on the validation sets.
3.3 Correlation between body composition and sarcopenia measurements
The correlations between the predicted and manually performed areas for dataset 2 were 0.79 for SM, 0.98 for VAT, and 0.98 for SAT (Table 3). For dataset 3, the results were 0.95 for SM, 1.0 for VAT, and 0.99 for SAT. A high correlation score with sarcopenia metrics was observed (SMD: 0.94, SMI: 0.73, LBM: 0.75, SMG: 0.93). High correlation scores with sarcopenia metrics were also found for both dataset 2 and dataset 3.

Table 3. Correlation between body mass index and body composition assessments in internal and external validation datasets.
4 Discussion
This study has addressed a critical issue in the field of automated body composition analysis by focusing on the automatic segmentation of L3 slices and developing a robust model for the detection of skeletal muscle, visceral adipose tissue and subcutaneous adipose tissue. We obtained highly accurate results for CT scans of L3 slices and automatic segmentation, as demonstrated by our internal and external validation dataset.
Our findings regarding the automatic selection of L3 are consistent with previous studies in the literature (3, 30, 38). While some studies might demonstrate slightly higher performance metrics, the reliability and stability of our results across diverse datasets underscore the robustness of our algorithm. In a study of 922 individuals, the mean distance difference between ground-truth and deep learning model-derived L3 slices was 3.7 and 4.1 mm for the internal (30) and external validation cohorts, respectively whereas in our study it was 4 and 5.5 mm respectively.
Despite the significant importance of sarcopenia as a potential target in oncology, routine data in this area is lacking (5). Analyzing body composition is a challenging task due to varied methods used (39). When comparing similar populations who have undergone automated body composition analysis at the L3 level, the average DICE scores for SAT, VAT, and SM are all >0.90 (26, 30, 32, 33, 40–45), which is very similar to our study. Some studies have attempted to identify lipid infiltration within muscle as an indicator of muscle quality, but the difficulty is obtaining accurate measurements and whose clinical relevance remains uncertain (27, 46).
Body composition assessment through CT scans, especially at the L3 level, is increasingly utilized in the field of research. The advantage lies in the ability to conduct analyses at the time of diagnosis, during follow-ups, both longitudinally and retrospectively. In most studies, body composition assessment is performed at the level of L3 (47–50), and sometimes L4 (51, 52). Another study showed that abdominal muscle surface area did not differ significantly between L3 and the lower part of L2 or L4, suggesting the possibility of considering margins slightly larger than 40 mm (53). Some authors have highlighted the need to find other methods that are more representative than the L3 slice to estimate participants’ body composition, as indicated by Pu et al. in 2023 (26, 27, 30, 40–45). A meta-analysis published in 2022 indicated that skeletal muscle index thresholds at the L3 level ranged from 52 to 55 cm/m2 for men and from 39 to 41 for women (54). However, due to the lack of consensus in the literature, multiple sarcopenia thresholds exist based on different vertebral locations, as studied by Derstine et al. (55). However, a systematic review of 388 articles revealed that the L3 level was most commonly used for measuring body composition (54). By adhering to the widely accepted L3 standard, our study contributes to the establishment of a unified reference framework, enabling meaningful comparisons and comprehensive.
To overcome the challenges of heterogeneity in the literature, our study offers a pivotal contribution to the integration of artificial intelligence in the domain of body composition assessment. The development of validated automatic segmentation algorithms facilitates a novel frontier for both clinical application and investigative inquiry. Such advancements herald a transformative potential for individualized patient management through enhanced early detection of body composition variations. Our work not only enriches the data landscape, fostering a deeper comprehension of cancer demographics but also lays the groundwork for establishing robust benchmarks, constructing predictive models for health outcomes, and potentially refining treatment dosing protocols. In particular, incorporating body composition metrics into clinical trial inclusion criteria may revolutionize the administration of oncological therapies (56). Tailoring drug regimens to each patient's unique physiological makeup could significantly refine therapeutic efficacy and safety, marking a new era in personalized medicine. Our research endeavors are therefore crucial stepping stones toward a more nuanced and effective healthcare paradigm.
Our study has several limitations. The algorithm was developed using CT scan images exclusively from patients with solid tumors. Increasing the sample size to include more patients with intracorporeal devices and cementoplasty in particular would also improve the model's performance and increase the heterogeneity of the data. It would be intriguing to further train the model with scenarios that are particularly unique to oncology, such as patients with ascites, extensive peritoneal carcinomatosis, or significant retroperitoneal lymph node involvement as seen in hematological malignancies. Furthermore, our algorithm does not enable the analysis of body composition for patients with chest imaging, such as head and neck cancers. Several ongoing projects utilizing our algorithm aim to: (i) investigate the associations between body composition and the survival of patients treated with immunotherapy, following an article published with body mass index, (ii) study the longitudinal changes in body composition from multiple time points, and (iii) develop predictive models for toxicity under immunotherapy.
Our manuscript marks a significant advancement in automated body composition analysis, a field currently facing a lack of robust, validated tools for routine clinical application. By meticulously validating our automated method against established manual techniques, we establish its precision and reliability, ensuring that it stands up to the rigorous demands of clinical practice. The diversity of the image data, sourced from various machines and institutions, speaks to the robustness of our algorithm. It skillfully navigates the challenges of image analysis, discerning relevant anatomical features with the capability to isolate the L3 slice while excluding non-pertinent elements, such as arms, which can confound the assessment. This level of precision in automated body composition analysis is not just a theoretical enhancement; it is a practical tool poised for integration into clinical workflows. It promises to enrich research, refine patient monitoring, and facilitate the incorporation of holistic supportive care measures—including targeted nutrition and exercise regimens—directly into patient management plans. The potential for this algorithm to be integrated into electronic health records represents a transformative step forward in the personalization and optimization of cancer care.
In conclusion, our study presents a sophisticated algorithm capable of autonomously detecting the L3 vertebra and delineating skeletal muscle, visceral, and subcutaneous adipose tissue compartments. The seamless integration of this tool into both research frameworks and routine clinical practice promises to revolutionize our understanding and utilization of body composition data. By harnessing the capabilities of artificial intelligence, we facilitate a leap forward not just in knowledge acquisition but in the actualization of enhanced, individualized patient management strategies. Our commitment to making this algorithm openly accessible to the scientific community reflects our intent to foster collective progress in this domain. This collaborative approach aims to expedite the translation of research into meaningful improvements in patient care, reinforcing our overarching goal of delivering health innovations that truly matter.
Data availability statement
The raw data supporting the conclusions of this article will be made available by the authors, without undue reservation. Subject to project approval by the project team and partnership agreement.
Author contributions
LD: Conceptualization, Data curation, Funding acquisition, Investigation, Methodology, Project administration, Resources, Supervision, Visualization, Writing – original draft, Writing – review & editing. DB: Conceptualization, Data curation, Formal Analysis, Methodology, Resources, Software, Validation, Visualization, Writing – original draft. AB: Conceptualization, Data curation, Funding acquisition, Methodology, Writing – review & editing. FR: Supervision, Writing – review & editing. FP: Methodology, Writing – review & editing. VR: Conceptualization, Data curation, Investigation, Methodology, Project administration, Resources, Software, Supervision, Writing – review & editing. ASH: Supervision, Validation, Writing – review & editing. HC: Conceptualization, Data curation, Funding acquisition, Investigation, Methodology, Project administration, Resources, Software, Supervision, Validation, Writing – original draft, Writing – review & editing. TM: Conceptualization, Data curation, Funding acquisition, Investigation, Methodology, Project administration, Resources, Supervision, Writing – review & editing. PEH: Conceptualization, Data curation, Funding acquisition, Investigation, Methodology, Project administration, Resources, Supervision, Validation, Visualization, Writing – original draft, Writing – review & editing.
Funding
The author(s) declare financial support was received for the research, authorship, and/or publication of this article.
This work was supported by the Ligue Nationale Contre le Cancer (No. AAPPRC2021.LCC/PH), Mutuelle Bleue, and Fresenius (No. I-2186-02). The funders were not involved in the study design, collection, analysis, interpretation of data, the writing of this article, or the decision to submit it for publication.
Acknowledgments
The authors thank the team of radiology manipulators as well as the Institut Curie data factory team for their help in setting up the virtual workspaces.
Conflict of interest
Authors DB and VR were employed by QuantaCell. Author DB was employed by IMAG.
The remaining authors declare that the research was conducted in the absence of any commercial or financial relationships that could be construed as a potential conflict of interest.
Publisher's note
All claims expressed in this article are solely those of the authors and do not necessarily represent those of their affiliated organizations, or those of the publisher, the editors and the reviewers. Any product that may be evaluated in this article, or claim that may be made by its manufacturer, is not guaranteed or endorsed by the publisher.
Supplementary material
The Supplementary Material for this article can be found online at: https://www.frontiersin.org/articles/10.3389/fnume.2023.1292676/full#supplementary-material
Supplementary Figure S1
Effect of data augmentation on L3 slice: (a) original image, (b) original image with added artificial arms, (c) rotated original image with artificial arms.
References
1. Caan BJ, Cespedes Feliciano EM, Kroenke CH. The importance of body composition in explaining the overweight paradox in cancer-counterpoint. Cancer Res. (2018) 78:1906–12. doi: 10.1158/0008-5472.CAN-17-3287
2. Brown JC, Cespedes Feliciano EM, Caan BJ. The evolution of body composition in oncology-epidemiology, clinical trials, and the future of patient care: facts and numbers. J Cachexia Sarcopenia Muscle. (2018) 9:1200–8. doi: 10.1002/jcsm.12379
3. Liu B, Giffney HE, Arthur RS, Rohan TE, Dannenberg AJ. Cancer risk in normal weight individuals with metabolic obesity: a narrative review. Cancer Prev Res (Phila). (2021) 14:509–20. doi: 10.1158/1940-6207.CAPR-20-0633
4. Surov A, Wienke A. Prevalence of sarcopenia in patients with solid tumors: a meta-analysis based on 81,814 patients. J Parenter Enteral Nutr. (2022) 46:1761–8. doi: 10.1002/jpen.2415
5. Surov A, Wienke A, Gutzmer R, Borggrefe J. Time to include sarcopenia into the oncological routine. Eur J Cancer. (2023) 190:112939. doi: 10.1016/j.ejca.2023.112939
6. Cushen SJ, Power DG, Teo MY, MacEneaney P, Maher MM, McDermott R, et al. Body composition by computed tomography as a predictor of toxicity in patients with renal cell carcinoma treated with sunitinib. Am J Clin Oncol. (2017) 40:47–52. doi: 10.1097/COC.0000000000000061
7. de Jong C, Chargi N, Herder GJM, van Haarlem SWA, van der Meer F, van Lindert ASR, et al. The association between skeletal muscle measures and chemotherapy-induced toxicity in non-small cell lung cancer patients. J Cachexia Sarcopenia Muscle. (2022) 13:1554–64. doi: 10.1002/jcsm.12967
8. van den Berg MMGA, Kok DE, Posthuma L, Kamps L, Kelfkens CS, Buist N, et al. Body composition is associated with risk of toxicity-induced modifications of treatment in women with stage I–IIIB breast cancer receiving chemotherapy. Breast Cancer Res Treat. (2019) 173:475–81. doi: 10.1007/s10549-018-5014-5
9. Delrieu L, Martin A, Touillaud M, Pérol O, Morelle M, Febvey-Combes O, et al. Sarcopenia and serum biomarkers of oxidative stress after a 6-month physical activity intervention in women with metastatic breast cancer: results from the ABLE feasibility trial. Breast Cancer Res Treat. (2021) 188:601–13. doi: 10.1007/s10549-021-06238-z
10. Shachar SS, Deal AM, Weinberg M, Nyrop KA, Williams GR, Nishijima TF, et al. Skeletal muscle measures as predictors of toxicity, hospitalization, and survival in patients with metastatic breast cancer receiving taxane-based chemotherapy. Clin Cancer Res. (2017) 23:658–65. doi: 10.1158/1078-0432.CCR-16-0940
11. Shachar SS, Deal AM, Weinberg M, Williams GR, Nyrop KA, Popuri K, et al. Body composition as a predictor of toxicity in patients receiving anthracycline and taxane-based chemotherapy for early-stage breast cancer. Clin Cancer Res. (2017) 23:3537–43. doi: 10.1158/1078-0432.CCR-16-2266
12. Mazzuca F, Onesti CE, Roberto M, Di Girolamo M, Botticelli A, Begini P, et al. Lean body mass wasting and toxicity in early breast cancer patients receiving anthracyclines. Oncotarget. (2018) 9:25714–22. doi: 10.18632/oncotarget.25394
13. Ueno A, Yamaguchi K, Sudo M, Imai S. Sarcopenia as a risk factor of severe laboratory adverse events in breast cancer patients receiving perioperative epirubicin plus cyclophosphamide therapy. Support Care Cancer. (2020) 28:4249–54. doi: 10.1007/s00520-019-05279-x
14. Barret M, Antoun S, Dalban C, Malka D, Mansourbakht T, Zaanan A, et al. Sarcopenia is linked to treatment toxicity in patients with metastatic colorectal cancer. Nutr Cancer. (2014) 66:583–9. doi: 10.1080/01635581.2014.894103
15. Prado CMM, Baracos VE, McCargar LJ, Mourtzakis M, Mulder KE, Reiman T, et al. Body composition as an independent determinant of 5-fluorouracil-based chemotherapy toxicity. Clin Cancer Res. (2007) 13:3264–8. doi: 10.1158/1078-0432.CCR-06-3067
16. Da Silva Dias D, Machado M, Trabulo C, Gosálbez B, Ravasco P. Impact of body composition on prognosis and dose-limiting toxicities on metastatic colorectal cancer. Front Nutr. (2022) 8:671547. doi: 10.3389/fnut.2021.671547
17. Versteeg KS, Blauwhoff-Buskermolen S, Buffart LM, de van der Schueren MAE, Langius JAE, Verheul HMW, et al. Higher muscle strength is associated with prolonged survival in older patients with advanced cancer. Oncologist. (2018) 23:580–5. doi: 10.1634/theoncologist.2017-0193
18. Ishizaki A, Okuwaki K, Kida M, Imaizumi H, Iwai T, Yamauchi H, et al. Implication of skeletal muscle loss in the prognosis of patients with pancreatic ductal adenocarcinoma receiving chemotherapy. Intern Med. (2023) 62:2783–93. doi: 10.2169/internalmedicine.0900-22
19. Graves JP, Daher GS, Bauman MMJ, Moore EJ, Tasche KK, Price DL, et al. Association of sarcopenia with oncologic outcomes of primary treatment among patients with oral cavity cancer: a systematic review and meta-analysis. Oral Oncol. (2023) 147:106608. doi: 10.1016/j.oraloncology.2023.106608
20. Deluche E, Lachatre D, Di Palma M, Simon H, Tissot V, Vansteene D, et al. Is sarcopenia a missed factor in the management of patients with metastatic breast cancer? Breast. (2022) 61:84–90. doi: 10.1016/j.breast.2021.12.014
21. Lee K, Shin Y, Huh J, Sung YS, Lee IS, Yoon KH, et al. Recent issues on body composition imaging for sarcopenia evaluation. Korean J Radiol. (2019) 20:205–17. doi: 10.3348/kjr.2018.0479
22. Engelke K, Museyko O, Wang L, Laredo J-D. Quantitative analysis of skeletal muscle by computed tomography imaging-state of the art. J Orthop Translat. (2018) 15:91–103. doi: 10.1016/j.jot.2018.10.004
23. Baracos VE, Mazurak VC, Bhullar AS. Cancer cachexia is defined by an ongoing loss of skeletal muscle mass. Ann Palliat Med. (2019) 8:3–12. doi: 10.21037/apm.2018.12.01
24. Shen W, Punyanitya M, Wang Z, Gallagher D, St-Onge M-P, Albu J, et al. Total body skeletal muscle and adipose tissue volumes: estimation from a single abdominal cross-sectional image. J Appl Physiol. (2004) 97:2333–8. doi: 10.1152/japplphysiol.00744.2004
25. Mourtzakis M, Prado CMM, Lieffers JR, Reiman T, McCargar LJ, Baracos VE. A practical and precise approach to quantification of body composition in cancer patients using computed tomography images acquired during routine care. Appl Physiol Nutr Metab. (2008) 33:997–1006. doi: 10.1139/H08-075
26. Shen H, He P, Ren Y, Huang Z, Li S, Wang G, et al. A deep learning model based on the attention mechanism for automatic segmentation of abdominal muscle and fat for body composition assessment. Quant Imaging Med Surg. (2023) 13:1384–98. doi: 10.21037/qims-22-330
27. Pu L, Gezer NS, Ashraf SF, Ocak I, Dresser DE, Dhupar R. Automated segmentation of five different body tissues on computed tomography using deep learning. Med Phys. (2022) 50:178–91. doi: 10.1002/mp.15932
28. Rigiroli F, Zhang D, Molinger J, Wang Y, Chang A, Wischmeyer PE, et al. Automated versus manual analysis of body composition measures on computed tomography in patients with bladder cancer. Eur J Radiol. (2022) 154:110413. doi: 10.1016/j.ejrad.2022.110413
29. Lee H, Troschel FM, Tajmir S, Fuchs G, Mario J, Fintelmann FJ, et al. Pixel-level deep segmentation: artificial intelligence quantifies muscle on computed tomography for body morphometric analysis. J Digit Imaging. (2017) 30:487–98. doi: 10.1007/s10278-017-9988-z
30. Ha J, Park T, Kim H-K, Shin Y, Ko Y, Kim DW, et al. Development of a fully automatic deep learning system for L3 selection and body composition assessment on computed tomography. Sci Rep. (2021) 11:21656. doi: 10.1038/s41598-021-00161-5
31. Chianca V, Albano D, Messina C, Gitto S, Ruffo G, Guarino S, et al. Sarcopenia: imaging assessment and clinical application. Abdom Radiol. (2021) 47:3205–16. doi: 10.1007/s00261-021-03294-3
32. Kreher R, Hinnerichs M, Preim B, Saalfeld S, Surov A. Deep-learning-based segmentation of skeletal muscle mass in routine abdominal CT scans. In Vivo. (2022) 36:1807–11. doi: 10.21873/invivo.12896
33. Mai DVC, Drami I, Pring ET, Gould LE, Lung P, Popuri K, et al. A systematic review of automated segmentation of 3D computed-tomography scans for volumetric body composition analysis. J Cachexia Sarcopenia Muscle. (2023) 14:1973–86. doi: 10.1002/jcsm.13310
34. Seymour K, Payoux P. Radiomics enabler®, an ETL (Extract-Transform-Load) for biomedical imaging in big-data projects. Available at: https://openreview.net/forum?id=B1n4ZKsjG
35. Heymsfield SB, Smith R, Aulet M, Bensen B, Lichtman S, Wang J, et al. Appendicular skeletal muscle mass: measurement by dual-photon absorptiometry. Am J Clin Nutr. (1990) 52:214–8. doi: 10.1093/ajcn/52.2.214
36. Ronneberger O, Fischer P, Brox T. Convolutional networks for biomedical image segmentation. (2015)
37. Goodpaster BH, Thaete FL, Kelley DE. Composition of skeletal muscle evaluated with computed tomography. Ann N Y Acad Sci. (2000) 904:18–24. doi: 10.1111/j.1749-6632.2000.tb06416.x
38. Belharbi S, Chatelain C, Hérault R, Adam S, Thureau S, Chastan M, et al. Spotting L3 slice in CT scans using deep convolutional network and transfer learning. Comput Biol Med. (2017) 87:95–103. doi: 10.1016/j.compbiomed.2017.05.018
39. Santhanam P, Nath T, Peng C, Bai H, Zhang H, Ahima RS, et al. Artificial intelligence and body composition. Diabetes Metab Syndr. (2023) 17:102732. doi: 10.1016/j.dsx.2023.102732
40. Ackermans LLGC, Volmer L, Wee L, Brecheisen R, Sánchez-González P, Seiffert AP, et al. Deep learning automated segmentation for muscle and adipose tissue from abdominal computed tomography in polytrauma patients. Sensors (Basel). (2021) 21:2083. doi: 10.3390/s21062083
41. Van Erck D, Moeskops P, Schoufour JD, Weijs PJM, Scholte Op Reimer WJM, Van Mourik MS, et al. Evaluation of a fully automatic deep learning-based method for the measurement of psoas muscle area. Front Nutr. (2022) 9:781860. doi: 10.3389/fnut.2022.781860
42. Nowak S, Theis M, Wichtmann BD, Faron A, Froelich MF, Tollens F, et al. End-to-end automated body composition analyses with integrated quality control for opportunistic assessment of sarcopenia in CT. Eur Radiol. (2022) 32:3142–51. doi: 10.1007/s00330-021-08313-x
43. Ackermans LLGC, Volmer L, Timmermans QMMA, Brecheisen R, Damink SMWO, Dekker A, et al. Clinical evaluation of automated segmentation for body composition analysis on abdominal L3 CT slices in polytrauma patients. Injury. (2022):S30–41. doi: 10.1016/j.injury.2022.05.004
44. Paris MT, Tandon P, Heyland DK, Furberg H, Premji T, Low G, et al. Automated body composition analysis of clinically acquired computed tomography scans using neural networks. Clin Nutr. (2020) 39:3049–55. doi: 10.1016/j.clnu.2020.01.008
45. Amarasinghe KC, Lopes J, Beraldo J, Kiss N, Bucknell N, Everitt S, et al. A deep learning model to automate skeletal muscle area measurement on computed tomography images. Front Oncol. (2021) 11:580806. doi: 10.3389/fonc.2021.580806
46. Byrne CA, Zhang Y, Fantuzzi G, Geesey T, Shah P, Gomez SL. Validation of skeletal muscle and adipose tissue measurements using a fully automated body composition analysis neural network versus a semi-automatic reference program with human correction in patients with lung cancer. Heliyon. (2022) 8:e12536. doi: 10.1016/j.heliyon.2022.e12536
47. Prado CMM, Lieffers JR, McCargar LJ, Reiman T, Sawyer MB, Martin L, et al. Prevalence and clinical implications of sarcopenic obesity in patients with solid tumours of the respiratory and gastrointestinal tracts: a population-based study. Lancet Oncol. (2008) 9:629–35. doi: 10.1016/S1470-2045(08)70153-0
48. Prado CMM, Baracos VE, McCargar LJ, Reiman T, Mourtzakis M, Tonkin K, et al. Sarcopenia as a determinant of chemotherapy toxicity and time to tumor progression in metastatic breast cancer patients receiving capecitabine treatment. Clin Cancer Res. (2009) 15:2920–6. doi: 10.1158/1078-0432.CCR-08-2242
49. Prado CMM, Heymsfield SB. Lean tissue imaging: a new era for nutritional assessment and intervention. JPEN J Parenter Enteral Nutr. (2014) 38:940–53. doi: 10.1177/0148607114550189
50. Martin L, Birdsell L, MacDonald N, Reiman T, Clandinin MT, McCargar LJ, et al. Cancer cachexia in the age of obesity: skeletal muscle depletion is a powerful prognostic factor, independent of body mass index. J Clin Oncol. (2013) 31:1539–47. doi: 10.1200/JCO.2012.45.2722
51. Englesbe MJ, Patel SP, He K, Lynch RJ, Schaubel DE, Harbaugh C, et al. Sarcopenia and mortality after liver transplantation. J Am Coll Surg. (2010) 211:271–8. doi: 10.1016/j.jamcollsurg.2010.03.039
52. Englesbe MJ, Lee JS, He K, Fan L, Schaubel DE, Sheetz KH, et al. Analytic morphomics, core muscle size, and surgical outcomes. Ann Surg. (2012) 256:255–61. doi: 10.1097/SLA.0b013e31826028b1
53. Park J, Gil JR, Shin Y, Won SE, Huh J, You M-W, et al. Reliable and robust method for abdominal muscle mass quantification using CT/MRI: an explorative study in healthy subjects. PLoS One. (2019) 14:e0222042. doi: 10.1371/journal.pone.0222042
54. Amini B, Boyle SP, Boutin RD, Lenchik L. Approaches to assessment of muscle mass and myosteatosis on computed tomography: a systematic review. J Gerontol A Biol Sci Med Sci. (2019) 74:1671–8. doi: 10.1093/gerona/glz034
55. Derstine BA, Holcombe SA, Goulson RL, Ross BE, Wang NC, Sullivan JA, et al. Quantifying sarcopenia reference values using lumbar and thoracic muscle areas in a healthy population. J Nutr Health Aging. (2018) 22:180–5. doi: 10.1007/s12603-017-0983-3
Keywords: body composition, computed tomography, deep learning, sarcopenia, cancer
Citation: Delrieu L, Blanc D, Bouhamama A, Reyal F, Pilleul F, Racine V, Hamy AS, Crochet H, Marchal T and Heudel PE (2024) Automatic deep learning method for third lumbar selection and body composition evaluation on CT scans of cancer patients. Front. Nucl. Med. 3:1292676. doi: 10.3389/fnume.2023.1292676
Received: 12 September 2023; Accepted: 4 December 2023;
Published: 10 January 2024.
Edited by:
Chenyang Shen, University of Texas Southwestern Medical Center, United StatesReviewed by:
Siqiu Wang, University of Texas Southwestern Medical Center, United StatesRuiqi Li, University of Texas Southwestern Medical Center, United States
© 2024 Delrieu, Blanc, Bouhamama, Reyal, Pilleul, Racine, Hamy, Crochet, Marchal and Heudel. This is an open-access article distributed under the terms of the Creative Commons Attribution License (CC BY). The use, distribution or reproduction in other forums is permitted, provided the original author(s) and the copyright owner(s) are credited and that the original publication in this journal is cited, in accordance with accepted academic practice. No use, distribution or reproduction is permitted which does not comply with these terms.
*Correspondence: Pierre-Etienne Heudel pierreetienne.heudel@lyon.unicancer.fr