The value of brain MRI functional connectivity data in a machine learning classifier for distinguishing migraine from persistent post-traumatic headache
 Gina Dumkrieger
 Catherine D Chong
 Katherine Ross2
  Visar Berisha
 Todd J Schwedt
- 1Department of Neurology, Mayo Clinic Arizona, Phoenix, AZ, United States
- 2Phoenix VA health care system, Veterans Health Administration, Phoenix, AZ, United States
- 3Department of Speech and Hearing Science and School of Electrical Computer and Energy Engineering, Arizona State University, Tempe, AZ, United States
Background: Post-traumatic headache (PTH) and migraine often have similar phenotypes. The objective of this exploratory study was to develop classification models to differentiate persistent PTH (PPTH) from migraine using clinical data and magnetic resonance imaging (MRI) measures of brain structure and functional connectivity (fc).
Methods: Thirty-four individuals with migraine and 48 individuals with PPTH attributed to mild TBI were included. All individuals completed questionnaires assessing headache characteristics, mood, sensory hypersensitivities, and cognitive function and underwent brain structural and functional imaging during the same study visit. Clinical features, structural and functional resting-state measures were included as potential variables. Classifiers using ridge logistic regression of principal components were fit on the data. Average accuracy was calculated using leave-one-out cross-validation. Models were fit with and without fc data. The importance of specific variables to the classifier were examined.
Results: With internal variable selection and principal components creation the average accuracy was 72% with fc data and 63.4% without fc data. This classifier with fc data identified individuals with PPTH and individuals with migraine with equal accuracy.
Conclusion: Multivariate models based on clinical characteristics, fc, and brain structural data accurately classify and differentiate PPTH vs. migraine suggesting differences in the neuromechanism and clinical features underlying both headache disorders.
Background
Migraine and post-traumatic headache (PTH) often share similar phenotype and most individuals with persistent PTH (PPTH) have a migraine-like phenotype (1, 2). New headaches starting in close temporal relation to traumatic brain injury (TBI) are easy to identify as PTH when pre-existing headaches are not present. However, the differentiation is more difficult when the headaches are longstanding and recollection of the timing of TBI and specific headache symptoms may be unclear. In these situations, when the diagnosis lacks certainty on clinical grounds alone, an objective method to help differentiate PPTH from migraine could be of significant value and increase confidence in the diagnosis.
Recent studies have found disease-specific differences in clinical characteristics and unique differences in brain structure and function underlying both headache disorders (3–6). In a previously published study, we developed a logistic regression classifier based on principal components (PCs) using clinical variables and brain structural data to understand the extent to which PPTH and migraine have disparate pathophysiology. In this study, machine learning classifiers incorporating functional imaging data as well as clinical and structural imaging data were constructed. In addition to clinical utility of differentiating those with migraine from those with PPTH, the classifiers provide an opportunity to learn more about the diseases and what separates them, by discovering patterns not apparent with a simpler analysis such as univariate analysis.
The goal of this current study was to assess whether adding resting state static and dynamic fc measures in these models could improve classification accuracy for differentiating those with migraine from those with PPTH.
Methods
Participant eligibility criteria
Male and female study participants ages 18–65 years were recruited from the Phoenix Veterans' Administration (VA) Health Care System and Mayo Clinic Arizona, both sites from which IRB approvals were obtained. Prior to participation, study participants completed written informed consent at the recruitment site. Diagnosis of migraine or PPTH attributed to mild TBI was made according to ICHD-3 beta (8) criteria and assigned by a headache specialist. Migraine subjects were excluded if they had any history of TBI. Individuals with PTH were excluded if they had a history of migraine or a history of moderate or severe TBI.
Thirty-four individuals with migraine and 48 participants with PPTH are included in this study. Subjects from this study have been included in prior publications which have shown differences between migraine and PPTH groups in brain structure (9, 10), fibertract profiles (11), static and dynamic functional connectivity (12), autonomic symptoms (3) and insomnia (4). Extending a classifier based on clinical data and structural imaging data (7), here for the first time we create a migraine vs. PPTH classifier including clinical data, structural and functional imaging data.
In the PPTH group 10 subjects reported one lifetime concussion, 19 reported two, 15 reported 3–10 and four PPTH subjects reported 10 + concussions. Of the group with 10 + concussions two were due to repeated impacts from sports and two were due to military training or active-duty blast-related injuries. In total 10 subjects' most recent concussions were sport related, seven were due to motor vehicle accident, 10 were due to falls and 21 were blast related.
Thirty migraine subjects met the headache frequency criteria for chronic migraine per ICHD-3 beta with the remaining four classified as episodic.
Clinical data collection
Study participants completed a battery of psychological and cognitive evaluations including the Rey Auditory Verbal Learning Test (RAVLT); immediate and delayed memory recall (13); Trail Making Test (TMT) (14); Beck Depression Inventory (BDI) (15); and State-Trait Anxiety Inventory (STAI); Form Y-1 and Form Y-2 (16). Other symptoms were assessed with Hyperacusis Questionnaire (17); Photophobia Assessment Questionnaire (PAQ) (18); Allodynia Symptom Checklist, (ASC)-12 (19); COMPASS 31 (20); Migraine Disability Assessment Scale (MIDAS) (21); a validated post-traumatic stress disorder checklist (DSM-5) (22); the Pain Catastrophizing Scale (PCS) (23, 24) and a detailed headache questionnaire developed by headache specialists at Mayo Clinic. Patients completed the Ohio State University TBI identification method questionnaire (25). A case report form containing Common Data Elements developed by the National Institute of Neurological Disorders and Stroke (26) and a 22-item Symptom Evaluation Checklist from the Sport Concussion Assessment Tool (SCAT) 5th edition (27) were used to characterize headache and TBI characteristics.
Brain imaging data
Following questionnaire completion subjects had structural and resting-state functional imaging of the brain. Images were collected on a single 3-Tesla Siemens MAGNETOM (Erlangen, Germany) scanner. 3D T1-weighted sagittal MPRAGE, axial T2-weighted imaging, Diffusion Tensor Imaging (DTI) (non-linear directions and one image without diffusion weighting) and ten minutes of blood oxygenation level dependent (BOLD) resting state imagine data were collected. For the resting state scans, participants were instructed to keep their eyes closed but to remain awake, to relax, and to try to clear their minds.
See appendix for imaging sequence details.
T1 and T2 weighted scans were reviewed by a board certified neuroradiologist. Subjects with presence of gross anatomical abnormalities on imaging (including T2 hyperintensities) were excluded from the final analysis. T1-weighted images were segmented using FreeSurfer version 6.0 (28) using the Desikan-Killiany Atlas.
DTI preprocessing was done using the automated tractography toolbox TRACULA (TRActs Constrained by Underlying Anatomy) (29). Preprocessing steps included image correction, brain extraction, within-subject registration to the individual's T1-weighted image, and co-registration to a template. The distribution of fibertracts was estimated using a Markov Chain Monte Carlo algorithm. A total of 18 fibertracts were extracted.
Resting state data were slice-time and motion corrected, and realigned. Skull and non-brain tissue were removed, data were smoothed, aligned to each subject's own T1-weighted scan, and transformed to the standardized Montreal Neurological Institute (MNI) template. Data were bandpass filtered and signals of no interest and head motion were regressed from the data.
Functional connectivity was assessed using a region of interest approach with 69 regions drawn according to findings from prior literature. Static fc was assessed by finding the correlation between the time series of two regions. Dynamic fc for each region pair was calculated by sliding window correlations with window length of 60 s and overlap of 1 frame. Window-length of 60 s was chosen to be consistent with our previous work (12) and with findings that window-lengths of approximately this length are optimal in the absence of information about the true correlation timescale (30). Regions of interest, detailed imaging parameters and preprocessing details can be found in the appendix material [Supplementary Table S1, Appendix].
Classification model
Some collected clinical data were not included as variables in the model because the data were directly tied to the classification in a way that would unfairly bias the model and artificially increase the model accuracy or because their inclusion would negatively affect the applicability of the model to other populations. For example, variables related to history of TBI were excluded because every PPTH participant had a previous TBI but history of TBI was an exclusion criterion for the Migraine group. PTSD (which would likely be much higher in the Phoenix VA PPTH population), headache frequency, years with headache, family history of migraine, and presence of aura were also excluded.
In our prior publication, clinical data, structural and fiber tract measures were standardized, converted to principal components and a logistic ridge regression model was fit on the principal components (PC) (7). Leave one out cross-validation was used to assess model performance and the ridge L2 regularization parameter was set within the cross-validation loop. Within each cross validation loop an additional, inner, leave one out cross validation (81-fold) was performed for each candidate regularization parameter. The candidate ridge parameter with the best performance over the inner cross validation loops was chosen as the ridge parameter for the primary, outer, cross validation loop.
In this analysis, the addition of the many (4692) fc derived variables necessitated variable selection prior to model fitting. Welch's t-tests were used to identify static and dynamic connectivity variables that showed group differences between migraine and PPTH. The fc variables with significant differences between groups were included as candidate variables for the classification model. Candidate variables were standardized to mean 0, and unit variance. PCs of the standardized data set were found using the PCA function from Python's scikit-learn package. Candidate variables from all data sources were utilized together to create the PCs. These PCs were the feature set for the classification model.
Leave one-out cross-validation was used to estimate model accuracy. Within the cross-validation loop, the preferred L2 penalty (regularization parameter) was determined from a list of candidates. The overall classification model was a logistic regression model with L2 penalty with PCs as the model variables. Candidate ridge parameter values and the use of 65 PCs were chosen for consistency with the previous publication.
Bias correction
When variable selection is performed outside of a cross-validation loop all data are used to select variables, including the held-out sample. This may result in a biased estimate of model accuracy. To address this, a second approach was taken in which the variable selection was performed inside the cross-validation loop, meaning that the held-out sample was not used in variable selection. This is referred to as the internal model. When the variable selection of fc data was performed within the cross-validation loop, the number of variables used to create the PCs varied by loop, but the number of PCs remained at 65. Within each cross-validation loop the entire set of candidate variables selected within that loop were utilized to create the PCs for that loop.
Variable importance
Following the model fitting, variable importance in the internal variable selection and PC creation model with fc data was estimated with the following custom metric: first the contribution of each variable to each PC was found. Then the contribution of each PC to the logistic regression was found from the standardized regression coefficients. Each value is a percentage. By multiplying the two it is possible to estimate the contribution of each variable to the model. The sum of the contribution of all variables for one model is 1. Two things must be noted about this metric. First, ridge regression does not permit a coefficient value to be set to 0, meaning that the minimum contribution of each PC to the model is greater than zero. Secondly, the contribution of an individual variable is tied to the contribution of the PCs onto which it projects. Only variables that are excluded during variable selection or which mapped entirely to PCs not passed to the regression model will have a contribution of zero. Mean variable importance over all cross-validation loops was used to rank model importance.
Results
Information on subject demographics can be found in Table 1. Thirty-four individuals with migraine and 48 PPTH participants were included. There were no significant differences in age between the migraine and PPTH groups (mean(sd): Migraine: 41.7 (10.9); PPTH: 38.1 (10.7); p = 0.120). The PPTH group had a higher proportion of males (Migraine: 35.3%; PPTH: 64.6%; p = 0.017), lower headache frequency (Migraine: 20.4 (6.2); PPTH: 16.1 (8.6); p = 0.015) and less years lived with headache (Migraine: 24.9 (14.4); PPTH: 10.6 (8.0); p < 0.001). The PPTH group also had higher scores on the BDI (Migraine: 9.0 (6.0); PPTH: 17.1 (8.9); p < 0.001), COMPASS 31 (Migraine: 27.3 (12.9); PPTH: 36.6 (14.4); p = 0.006), hyperacusis (Migraine:14.4 (8.5); PPTH:23.3 (10.7); p < 0.001) and insomnia (Migraine:18.3 (6.8); PPTH 23.5 (6.6); p = 0.002) questionnaires. There were no significant differences between the migraine and PPTH groups in percentage reporting “White/Caucasian” race (Migraine: 94.1%; PPTH: 93.8%; p = 1), Hispanic ethnicity (Migraine: 4.2%; PPTH 16.7%; p = 0.073), or in ASC-12 (Migraine: 5 (4.1); PPTH: 5.6 (5.2); p = 0.895), MIDAS (Migraine: 48.5 (33.5); PPTH: 67.9 (59.8); p = 0.305), PCS (Migraine: 19.9 (10.9); PPTH: 24.4 (13.2); p = 0.155), state anxiety (Migraine:34.8 (8.9), PPTH: 37.7 (13.4); p = 0.498) or trait anxiety (Migraine: 40 (10.3); PPTH: 45 (13.4); p = 0.062) scores. Information on income, educational level and other socioeconomic status indicators was not collected.
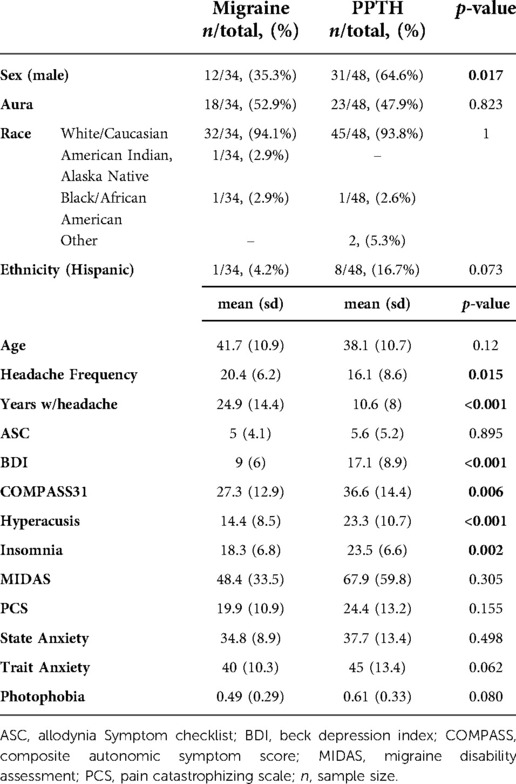
Table 1. Subject Descriptors.
Thirty subjects with migraine had 15 or more headache days per month (chronic migraine). Twenty-eight of the PPTH subjects had 15 or more headache days per month. Forty-six of the PPTH participants had a migraine-like phenotype, with the other two displaying a tension-type headache-like phenotype. On the day of the visit 26/34 (76.4%) migraine participants and 42/48 (87.5%) PPTH participants reported a current pain level greater than zero (p = 0.8226). Presence of headache at time of imaging was not recorded.
Classification models
The number of potential variables by category are shown in Table 2. All classification models described here include all of the same questionnaire data, structural imaging data, and DTI data as variables. Each classifier model created 65 PCs from those variables which were used as variables in the model's ridge regression. The classification models differ in which fc data is included and whether the PC creation occurred inside or outside of the cross-validation loop. Showing the different models illustrates the benefit of including functional connectivity data; in the way the model was created in the previous publication (Figure 1A–C) and in a more conservative approach to model appraisal where the PC creation and variable selection happen inside the cross-validation loop (Figure 1D,E). In Figure 1 A is the model from the previous publication, B and C add fc data to A. Model D uses the same data as A but with PC creation inside the cross-validation loop. Model E adds fc data to D. The same subjects are used in all cases.
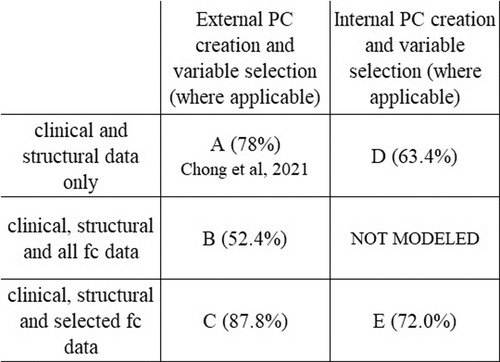
Figure 1. Model comparison. Figure shows the relationship between the classification models and each model's average accuracy. Each approach utilizes the same data set. Model A is the model from Chong et al., 2021 (78.0%). All models include the same patients, and same questionnaire data, structural and DTI data as variables. There was no variable selection on clinical or structural data in any model. The improvement in classifier accuracy by including fc data is seen in the increase in accuracy from A to C and from D to E. The performance metrics of models with internal pc creation and variable selection (D,E) are more conservative than the models with external pc creation and variable selection (A,B,C).
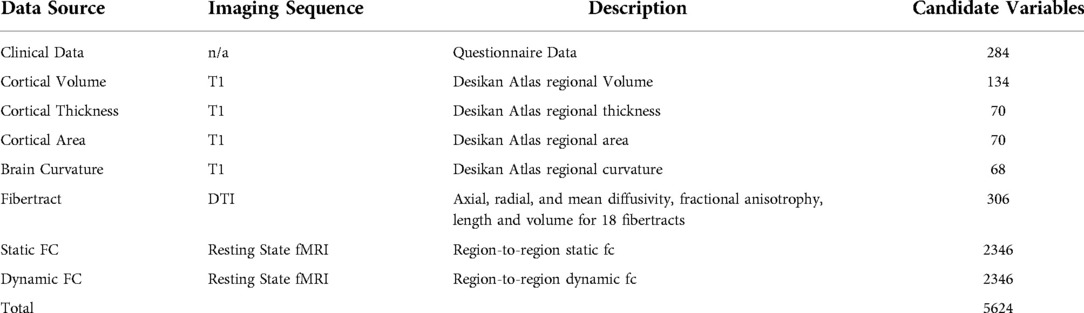
Table 2. Candidate Variables by Source.
Models with PC creation outside the cross-validation loop
When no fc data is included, and PC creation is outside of the cross-validation loop, average model accuracy is 78.0%. If all fc data is included (no variable selection), then average model accuracy is 52.4%. When variable selection of fc data prior to PC creation is implemented the number of included static fc variables decreases to 144 and the number of included dynamic fc variables to 166. The resulting classifier has an average accuracy of 87.8%.
Models with pc creation inside the cross-validation loop
To address issues potentially arising from performing variable selection outside of the cross-validation loop, we performed an additional analysis where the variable selection and PC creation was moved inside the cross-validation loop. Doing this provides a more conservative appraisal of the generalizability of the model. In these models the average accuracy with fc data is 72.0% compared to 63.4% without the fc data.
Because it is more conservative, the classification model with fc variable selection and PC creation inside the cross-validation loop was used as the basis of all further analysis in this document. The confusion matrix for this model is shown in Table 3.
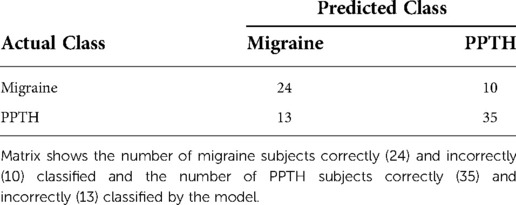
Table 3. Confusion Matrix for Model with Internal Variable Selection and PC Creation Including FC Data.
Balanced accuracy for this model is 71.8%. 72.9% of PPTH patients and 70.6% of migraine patients were correctly classified.
Variable importance
Of the 5,624 unique candidate variables, 1,521 were selected for inclusion across one or more of the cross-validation loops in the internal variable selection model, including 310 static fc variables and 287 dynamic fc variables. Of those, 101 static fc and 103 dynamic fc variables were selected in every cross-validation loop.
Of the highest contributing 100 variables in the internal variable selection approach, 24 are fiber tract/DTI data, 22 are static fc and 18 are dynamic fc (Table 4).
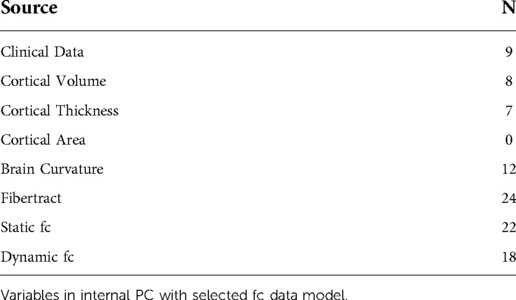
Table 4. Number of Variables in the Top 100 Most Contributing; by Source.
Figure 2 shows boxplots of contribution of the top 100 most contributing variables in the internal variable selection and PC creation model, ordered by ranking. While fiber tract data has more variables in the top 100 (24) than static fc (22) or dynamic fc (18) all the top ten most contributing variables are static or dynamic fc.
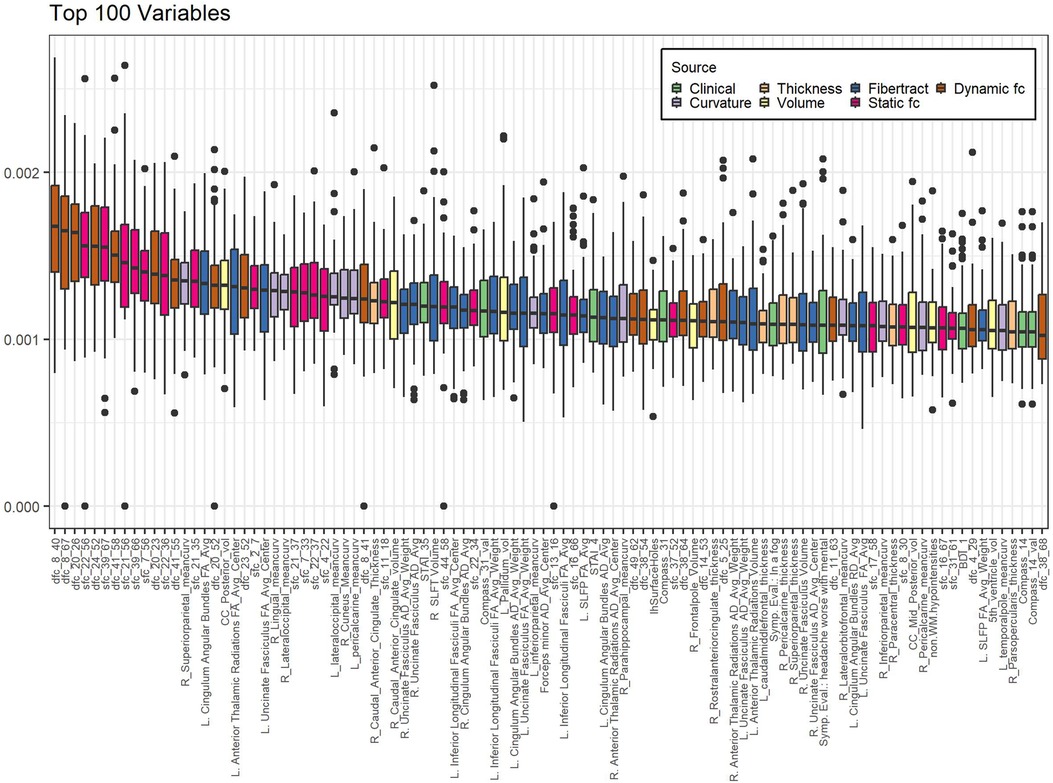
Figure 2. Variables contributing most to internal variable selection model. Internal PC with selected fc data model. Individual data points represent the contribution of a single variable to the model created in a single-cross validation loop. Data is grouped by variable to form a single boxplot for each variable on the plot. Bar indicates median, box ends at 1st and 3rd quartiles, whiskers show extent of non-outlier data. Dots are outliers. Boxes are sorted in order of decreasing ranking (mean contribution). Calculation of contribution is described in the methods section. Sfc: static functional connectivity; dfc: dynamic functional connectivity; R: right; L: left; mean_curv: mean curvature; vol: volume; RD: radial diffusivity; SLFP: superior longitudinal fasciculi - parietal; SLFT: superior longitudinal fasciculi – temporal; Symp. Eval.: Symptom Evaluation. See supplemental information for functional connectivity region number descriptions.
Static functional connectivity
Sfc pairs found in the highest contributing 100 variables are shown in Figure 3. Five of the 22 most contributing static fc variables involve the left secondary somatosensory region and three involve the right somatosensory region. The right posterior insula, left DLPFC, right hypothalamus, and left fusiform gyrus are also part of three pairwise connections each. The right lingual gyrus, periaqueductal gray, left rostral ventromedial medulla, and left superior parietal lobule are each found twice while the remaining regions are found only once.
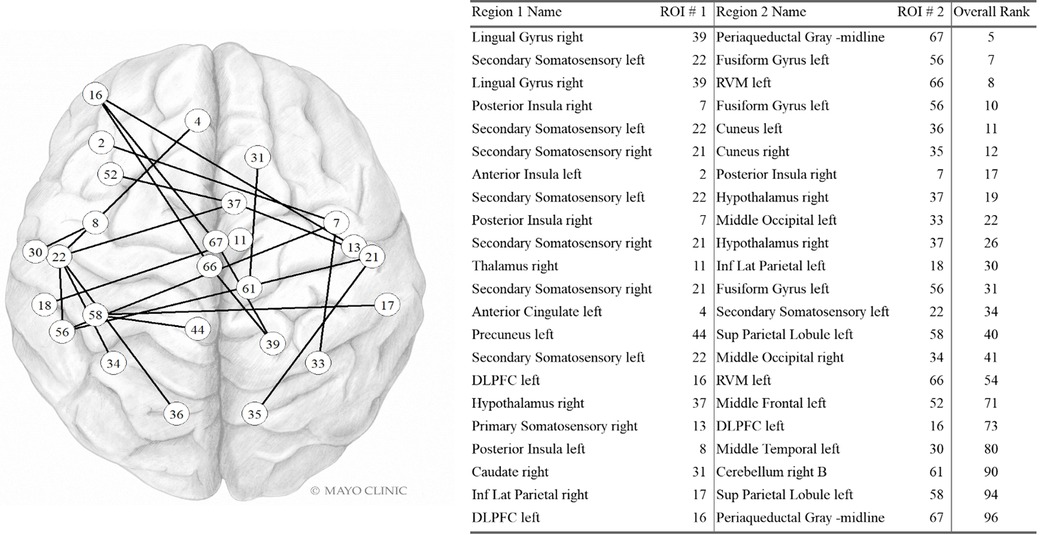
Figure 3. Static FC variables in the Top 100. Internal PC with selected fc data model. Network vertices labeled by ROI number as in Supplementary Table S1, Appendix. Vertex positions are approximate. DLPFC: Dorsolateral prefrontal cortex; Inf Lat Parietal: Inferior lateral. Used with permission of Mayo Foundation for Medical Education and Research. All rights reserved.
Dynamic functional connectivity
Dfc pairs found in the highest contributing 100 variables are shown in Figure 4. The left posterior insula, left VMPFC, right spinal trigeminal region, left hypothalamus, and left middle frontal were each part of three dynamic fc pairwise connections in the top 100 variables. The right somatomotor was involved in two dynamic fc pairwise connections in the top 100 variables. The other regions in this list were involved in a single pairwise dynamic fc connection in the top 100 variables.
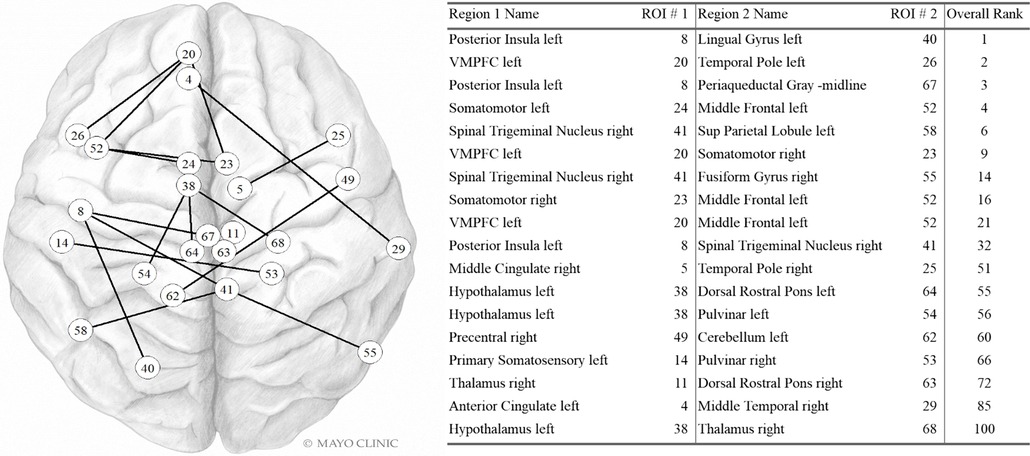
Figure 4. Dynamic FC variables in the Top 100. Internal PC with selected fc data model. Network vertices labeled by ROI number as in Supplementary Table S1, Appendix. Vertex positions are approximate. VMPFC: ventromedial prefrontal cortex; Sup Parietal: Superior Parietal. Used with permission of Mayo Foundation for Medical Education and Research. All rights reserved.
Differences between correctly and incorrectly classified
In general, the misclassified PPTH group was less severely affected than the correctly classified PPTH group. The incorrectly classified PPTH group had lower median BDI, COMPASS 31, hyperacusis, insomnia, MIDAS, photophobia, PCS, state anxiety, trait anxiety and headache symptom score than the correctly classified PPTH group. (Figure 5). Median allodynia scores (ASC) were higher for the misclassified PPTH group than the correctly classified PPTH group. The opposite pattern is repeated for the misclassified migraine group compared to the correctly classified migraine group but to a lesser degree. The exception is that the incorrectly classified migraine group had higher median allodynia than the correctly classified migraine group. It is not surprising to find the correctly classified cases at the extremes with the incorrectly classified groups between them; the cases that look most like the other group will be the hardest to distinguish. However, large differences are interesting because while the variables shown here were included in the model, they weren't found among the most influential variables.
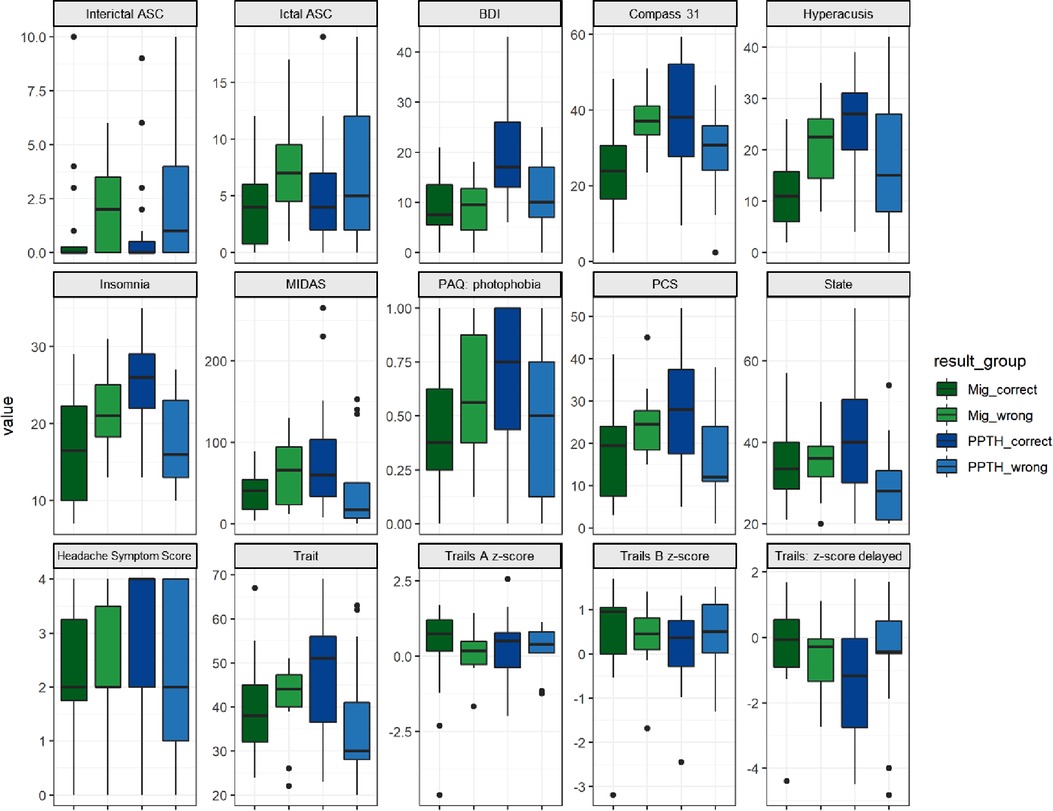
Figure 5. Instrument scores by correctly vs incorrectly classified migraine vs PPTH groups. Internal PC with selected fc data model. ASC = Allodynia Symptom Checklist; BDI = Beck Depression Inventory; COMPASS = Composite Autonomic Symptom Score; MIDAS = Migraine Disability Assessment; PAQ = Photosensitivity Assessment Questionnaire; State = state anxiety; Trait = trait anxiety. Dots are outliers.
Sex was included as a candidate variable in each model but was not found to have high importance in the final model (see Table 5). Males were more likely than females to be correctly categorized, especially within the PPTH group (Chi-sq, p = 0.008).
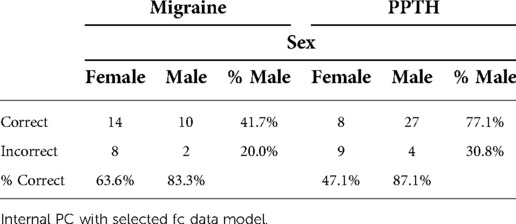
Table 5. Sex Breakdown Correctly vs Incorrectly Classified.
There were no apparent differences between the correctly and incorrectly classified subjects in terms of pain intensity, headache duration, frequency, or years with headache. This suggests their inclusion in the model would be unlikely to improve the performance.
Correctly and incorrectly classified subjects were equally likely to have taken medication in the last 48 h (Table 6) (p = 0.23, Chi-squared), suggesting having done so does not substantially impact imaging findings included in this analysis. Those with migraine were more likely to have reported a family history of migraine but it did not relate to classification success. A greater percentage of PPTH subjects who had aura were correctly classified compared to those who did not have aura, although aura was not included as a candidate variable. The two PPTH subjects with a tension-type headache phenotype were both correctly classified.
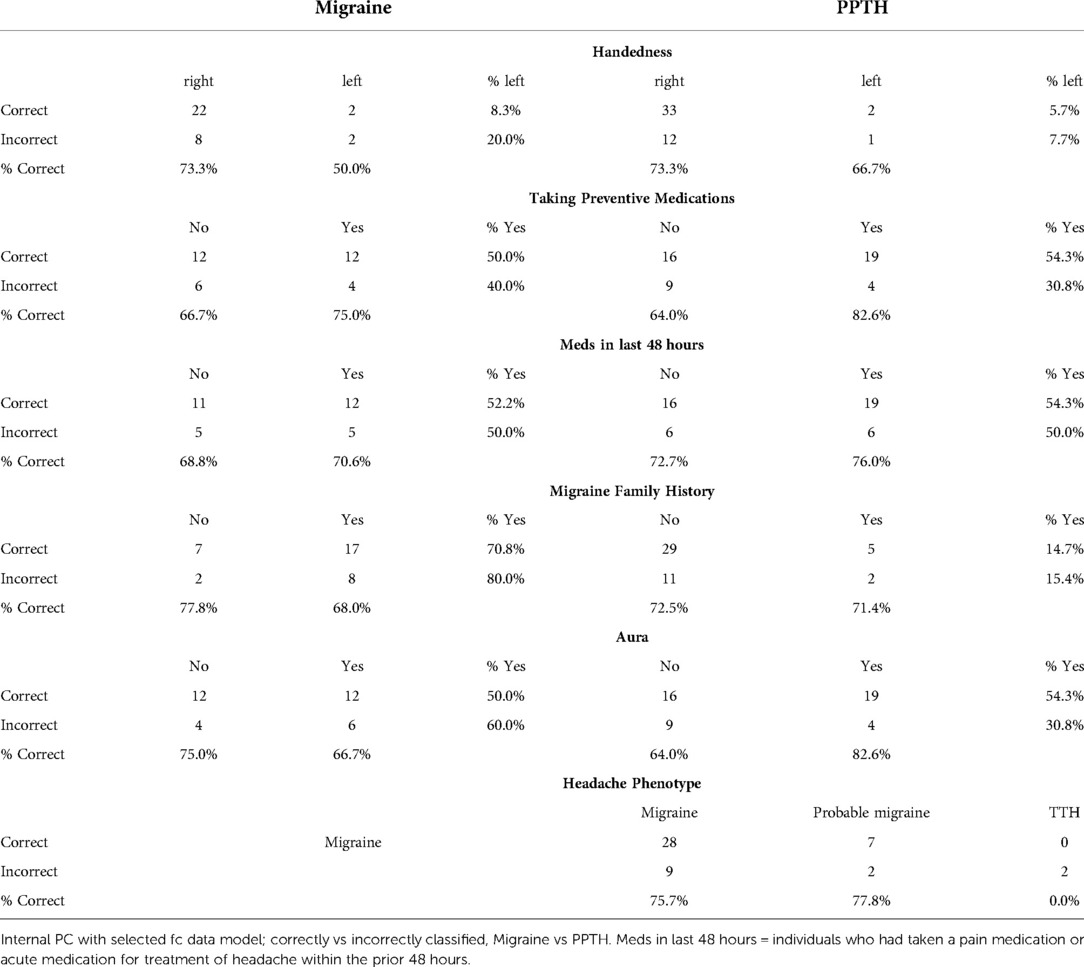
Table 6. Group Differences for Discrete Characteristics Not Included in the Classification Models.
Discussion
Adding static and dynamic fc data to a machine learning classifier based on clinical and structural data can improve classifier ability to distinguish individuals with migraine from those with PPTH. The average accuracy of our previously published model was 78.0%. However, this study showed that the addition of pre-selected functional connectivity data increased model accuracy to 87.8%. For the models with variable selection and PC creation inside the cross-validation loop the addition of fc data raised the average accuracy from 63.4% to 72.0%. Within each of these pairings (78% vs. 87.8% and 63.4% vs. 72.0%) the models being compared are directly comparable; the inclusion of fc data is the only difference, so we can confidently assert that inclusion of fc data improves the model performance. The model with variable selection and PC creation outside of the cross-validation represents a more optimistic view while the model with variable selection and PC creation on the inside represents a more conservative view.
When it is difficult to find/create a data set with the necessary variables that is large enough to allow for a separate held-out test set, cross-validation is frequently used. Cross-validation allows a data set to be used for both model training and evaluation (non-simultaneously) as well as variable selection, but the use of the data in all of these roles concurrently can lead to bias in the model and overestimation of model performance. The substantial difference in performance (∼16%) between the internal and external models, which were built with the same general method on the same data set, illustrates the importance of understanding how classification model accuracy is reported in the literature. By presenting both the internal and external model here we can have a better understanding of the potential range of performance we would be likely to see if the modeling was used to classify new groups of people with PPTH and migraine.
Given the improvement to model accuracy with inclusion of fc data it is not surprising that many of the most important variables are tied to fc. Regions that were important contributors to the model included those located within somatosensory cortex, posterior insula, prefrontal cortex, hypothalamus, periaqueductal gray, rostral ventral medulla, fusiform gyrus, and lingual gyrus. These are regions that participate in different aspects of the migraine and PPTH experience including sensory-discriminative and cognitive processing of pain (31), pain modulation (32, 33), migraine attack generation (34), and multisensory integration (35). These regions have previously been demonstrated to have atypical function amongst individuals with PPTH and/or migraine (36–40). Precise explanations for why the functional connections between specific brain regions were important for differentiating migraine and PTH are speculative. The hypothalamus is known to be involved in chronic pain, including migraine and PTH. Altered activity and functional connectivity of the hypothalamus has been identified early in the migraine attack, suggesting the hypothalamus plays a role in migraine attack generation (41–44). It has also been implicated in the premonitory and headache phases of migraine (32, 45). The role of the hypothalamus in PTH is less certain, although there is emerging literature suggesting the hypothalamus is involved in PTH. For example, a sfc study of PTH demonstrated that altered connectivity between the hypothalamus and frontal lobe correlated with headache frequency and intensity (46). In the analysis reported herein, the hypothalamus was involved with several static and dynamic functional connections that provided important contributions to the classification task. Similarly, the secondary somatosensory region was included in multiple highly contributing sfc connections. This might be expected based on its role in the processing and integration of painful and non-painful somatosensory stimuli, prior studies demonstrating alterations in responses to tactile stimulation in migraine and PTH, prior evidence for atypical pain-induced secondary somatosensory cortex activation in people with migraine and ictal allodynia, and atypical sfc of secondary somatosensory cortex in those with PTH (47–50). Since functional connectivity of the hypothalamus and secondary somatosensory cortex contributed to differentiating migraine and PTH, the contributions of these regions to the pathophysiology of these two distinct headache types might differ; further studies are needed to better explain these differences.
The variable ranked as most important for classification was the dfc between the posterior insula and the left lingual gyrus. These brain regions are known to be involved in the processing of somatic sensations and visual processing respectively. Several prior studies have demonstrated structural and functional alterations in insula and the visual network in migraine (51–53). Their inclusion together here could be indicative of differences in brain function related to visual hypersensitivities and integration of visual and somatosensory stimuli (e.g., photo-allodynia, worsening of headache when exposed to visual stimuli), a known phenomenon in both migraine and PTH. Of note, photophobia questionnaire scores did not differ by group and were not included as top ranked variables themselves. It is possible that the inclusion of this dynamic functional connectivity information, in combination with the other information captured across the included principal components, is telling us something more nuanced about migraine vs. PTH differences in photosensitivity or other forms of visual hypersensitivity than is captured by the photophobia questionnaire.
The top ranked sfc input was between the right lingual gyrus and the periaqueductal gray. The periaqueductal gray is an important region for pain modulation. Numerous prior studies have identified atypical structure and function of the periaqueductal gray in chronic pain and migraine (54–57). A PTH study demonstrated altered sfc of the periaqueductal gray in patients who were imaged within one week of their brain injuries, and the periaqueductal gray connectivity helped to predict PTH persistence at three months (58). Activation of the lingual gyrus has also been shown to vary between individuals with migraine with simple visual aura and those with complex aura (59). Our study populations were both equally likely to report the presence of aura, but the inclusion of the lingual gyrus in multiple highly ranked fc variables may reflect a more subtle difference in the type of aura experienced in each group.
Identification of regions that most contribute to differentiating migraine and PTH assist with choosing which brain regions to further interrogate in future studies interested in pathophysiological differences between migraine and PTH. These future studies might also be able to provide greater insights into clinical characteristics of migraine and PTH that associate with aberrant functional connectivity of these regions.
The internal PC model with fc data had nearly equal accuracy between the two classes; 70.6% of migraine and 72.9% of PPTH subjects were correctly classified. Positive predictive value for identifying PPTH subjects was 77.8%. This contrasts with the previous publication where 97.7% of the migraine group but only 64.6% of the PPTH group were correctly classified. This result further supports the importance of including fc data for PPTH classification.
Limitations
Our fMRI set up did not include collection of pulse, breathing or blood pressure measurements, nor did we account for spontaneous blood pressure changes that may occur at the upper limit of the frequency band (60), which are study limitations.
Machine learning models are sensitive to the choice of hyperparameters; variables which control the model's learning process. In the models reported here, the number of PCs, the ridge regression regularization parameter, and the parameters controlling the inclusion and exclusion of candidate variables are hyperparameters which must be set. The set of regularization parameter candidate values, the use of 65 PCs, and the use of p <= 0.05 in variable selection may not be absolutely optimal. Future studies should include individuals with PPTH with history of migraine pre-mTBI. Sex was accounted for by its inclusion as a model variable however future studies would benefit by utilizing cohorts that are more closely matched in sex and years lived with headache.
Similarly, the choice of sliding window length when calculating the dfc may affect the outcome. While we have made every effort to make the models directly comparable, we have not shown the statistical significance of the improvement in model accuracy due to the addition of the fc data.
We did not account for race and ethnicity in this analysis. The homogeneity of race and ethnicity overall as well as the uniformity of race and ethnicity across groups (PPTH and healthy controls) makes it unlikely that these variables influenced the outcome of this analysis. The small numbers of non-White and Hispanic study participants makes sub-analysis infeasible.
Future work
In the future, a relatively objective method for differentiating PPTH from migraine might increase confidence in the diagnosis when doing so is difficult on clinical grounds alone. A classifier would be particularly useful when details about the TBI and timing of headache symptoms are less clear. Currently, accurate differentiation is particularly important when enrolling subjects into clinical trials; it will also be important when recommending treatment as soon as PTH-specific treatments are available.
Conclusions
A classification model based on clinical questionnaire data, structural imaging features and fc features can differentiate those with PPTH from those with migraine with 87.8% accuracy. The inclusion of fc data improved the accuracy of the model from the previously published 78%.
A more conservative method with variable selection and PC creation inside the cross-validation loop showed 72% accuracy when fc data were included, compared to 63.4% when fc data were not included. Fc and fibertract data were important contributors to the classifier. Classification accuracy was approximately equal for classifying PPTH and migraine.
Data availability statement
The original contributions presented in the study are included in the article/Supplementary Materials, further inquiries can be directed to the corresponding author/s.
Ethics statement
The studies involving human participants were reviewed and approved by Phoenix VA Health Care System institutional review board, the Mayo Clinic institutional review board and the United States Department of Defense Human Research Protection Office. The patients/participants provided their written informed consent to participate in this study.
Author contributions
GD development of machine learning models/code, interpretation and contributed significantly to draft of manuscript. CC study conception & design, data acquisition, pre-processed imaging data, interpretation, and contributed significantly to draft of manuscript. KR study conception & design, data acquisition, and interpretation. VB study conception & design, modeling approach and interpretation. TS study conception & design, data acquisition, and interpretation and contributed significantly to draft of manuscript. All authors contributed substantively to the revision and improvement of the manuscript and read and approved the final manuscript. All authors contributed to the article and approved the submitted version.
Funding
This work was supported by the Office of the Assistant Secretary of Defense for Health Affairs, through the Peer Reviewed Medical Research Program under Award No. W81XWH-15–1–0286. Opinions, interpretations, conclusions, and recommendations are those of the authors and are not necessarily endorsed by the Department of Defense. The U.S. Army Medical Research Acquisition Activity, 820 Chandler Street, Fort Detrick MD 21702–5014 is the awarding and administering acquisition office.
Acknowledgments
We are grateful to the study participants, imaging technologists and study coordinators who have dedicated their time to this study.
Conflict of interest
In the past 24 months GD & CC have received research funding from Amgen. KR reports no competing interests. VB is a co-founder of with equity in Aural Analytics.Within the past 24 months, TJS has received personal compensation for consulting/advising from Abbvie, Allergan, Biodelivery Science, Biohaven, Click Therapeutics, Eli Lilly, Equinox, Ipsen, Lundbeck, Novartis, Satsuma, and Tonix Pharma. He has received royalties from Up To Date. He has stock options in Aural Analytics and Nocira. Research funding has been received from Amgen, Henry Jackson Foundation, National Institutes of Health, Patient Centered Outcomes Research Institute, and the United States Department of Defense.
Publisher's note
All claims expressed in this article are solely those of the authors and do not necessarily represent those of their affiliated organizations, or those of the publisher, the editors and the reviewers. Any product that may be evaluated in this article, or claim that may be made by its manufacturer, is not guaranteed or endorsed by the publisher.
Supplementary material
The Supplementary Material for this article can be found online at: https://www.frontiersin.org/articles/10.3389/fpain.2022.1012831/full#supplementary-material.
Abbreviations
ASC-12, allodynia symptom checklist; BDI, beck depression inventory; COMPASS 31, composite autonomic symptom scale 31; dfc, dynamic functional connectivity; DLPFC, dorsolateral prefrontal cortex; DTI, diffusion tensor imaging; fc, functional connectivity; MIDAS, migraine disability assessment scale; MNI, montreal neurological institute; PAQ, photophobia assessment questionnaire; PC, principal component; PCS, pain catastrophizing scale; PPTH, persistent post-traumatic headache; PTH, post-traumatic headache; RAVLT, Rey Audiovisual Learning Test; ROI, region of interest; SCAT, Sport Concussion Assessment Tool; sfc, static functional connectivity; STAI, state-trait anxiety inventory; TBI, traumatic brain injury; TMT, trail making test.
References
1. Erickson JC. Treatment outcomes of chronic post-traumatic headaches after mild head trauma in us soldiers: an observational study. Headache. (2011) 51:932–44. doi: 10.1111/j.1526-4610.2011.01909.x
2. Theeler B, Lucas S, Riechers RG, Ruff RL. Post-traumatic headaches in civilians and military personnel: a comparative, clinical review. Headache. (2013) 53:881–900. doi: 10.1111/head.12123
3. Howard L, Dumkrieger G, Chong CD, Ross K, Berisha V, Schwedt TJ. Symptoms of autonomic dysfunction among those with persistent posttraumatic headache attributed to mild traumatic brain injury: a comparison to migraine and healthy controls. Headache. (2018) 58:1397–407. doi: 10.1111/head.13396
4. Kim SK, Chong CD, Dumkrieger G, Ross K, Berisha V, Schwedt TJ. Clinical correlates of insomnia in patients with persistent post-traumatic headache compared with migraine. J Headache Pain. (2020) 21:1–10. doi: 10.1186/s10194-020-01103-8
5. Schwedt TJ, Peplinski J, Garcia-Filion P, Berisha V. Altered speech with migraine attacks: a prospective, longitudinal study of episodic migraine without aura. Cephalalgia. (2019) 39:722–31. doi: 10.1177/0333102418815505
6. Capi M, Pomes LM, Andolina G, Curto M, Martelletti P, Lionetto L. Persistent post-traumatic headache and migraine: pre-clinical comparisons. Int J Environ Res Public Health. (2020) 17:2585. doi: 10.3390/ijerph17072585
7. Chong CD, Berisha V, Ross K, Kahn M, Dumkrieger G, Schwedt TJ. Distinguishing persistent post-traumatic headache from migraine : classification based on clinical symptoms and brain structural MRI data. Cephalalgia. (2021) 41:943–55. doi: 10.1177/0333102421991819
8. Olesen J, Bes A, Kunkel R, Lance JW, Nappi G, Pfaffenrath V, et al. The international classification of headache disorders, 3rd edition (beta version). Cephalalgia. (2013) 33:629–808. doi: 10.1177/0333102413485658
9. Chong CD, Plasencia JD, Frakes DH, Schwedt TJ. Structural alterations of the brainstem in migraine. NeuroImage Clin. (2017) 13:223–7. doi: 10.1016/j.nicl.2016.10.023
10. Schwedt TJ, Chong CD, Peplinski J, Ross K, Berisha V. Persistent post-traumatic headache vs. Migraine: an MRI study demonstrating differences in brain structure. J Headache Pain. (2017) 18:1–8. doi: 10.1186/s10194-017-0796-0
11. Chong CD, Peplinski J, Berisha V, Ross K, Schwedt TJ. Differences in fibertract profiles between patients with migraine and those with persistent post-traumatic headache. Cephalalgia. (2019) 39:1121–33. doi: 10.1177/0333102418815650
12. Dumkrieger G, Chong CD, Ross K, Berisha V, Schwedt TJ. Static and dynamic functional connectivity differences between migraine and persistent post-traumatic headache: a resting-state magnetic resonance imaging study. Cephalalgia. (2019) 39:1366–81. doi: 10.1177/0333102419847728
13. Davis J, Millis S, Axelrod B. Derivation of an embedded rey auditory verbal learning test performance validity indicator. Clin Neuropsychol. (2012) 26:1397–408. doi: 10.1080/13854046.2012.728627
14. Lezak M, Howieson D, Loring D (2004) Neuropsychological assessment, 4th ed. Oxford University Press, New York
15. Beck A, Steer R, Ball R. Comparison of beck despression inventories -IA and -II in psychiatric outpatients. J Pers Assess. (1996) 67:588–9. doi: 10.1207/s15327752jpa6703_13
16. Spielberger C, Gorsuch RL, Lushene R, Vagg PR, Jacobs GA. Manual for the state-trait anxiety inventory. Palo Alto, CA: Consulting Psychologists Press (1983).
17. Khalfa S, Dubal S, Veuillet E, Perez-Diaz F, Jouvent R, Collet L. Psychometric normalization of a hyperacusis questionnaire. Orl. (2002) 64:436–42. doi: 10.1159/000067570
18. Bossini L, Fagiolini A, Valdagno M, Padula L, Hofkens T, Castrogiovanni P. Photosensitivity in panic disorder. Depress Anxiety. (2009) 26:34–6. doi: 10.1002/da.20477
19. Lipton RB, Bigal ME, Ashina S, Burstein R, Silberstein S, Reed ML, et al. Cutaneous allodynia in the migraine population. Ann Neurol. (2008) 63:148–58. doi: 10.1038/jid.2014.371
20. Treister R, O’Neil K, Downs HM, Oaklander AL. Validation of the composite autonomic symptom scale 31 (COMPASS-31) in patients with and without small fiber polyneuropathy. Eur J Neurol. (2015) 22:1124–30. doi: 10.1111/ene.12717
21. Stewart WF, Lipton RB, Dowson AJ, Sawyer J. Development and testing of the migraine disability assessment (MIDAS) questionnaire to assess headache-related disability. Neurology. (2001) 56:S20–8. doi: 10.1212/wnl.56.suppl_1.s20
22. Blevins CA, Weathers FW, Davis MT, Witte TK, Domino JL. The posttraumatic stress disorder checklist for DSM-5 (PCL-5): development and initial psychometric evaluation. J Trauma Stress. (2015) 28:489–98. doi: 10.1002/jts.22059
23. Osman A, Barrios FX, Kopper BA, Hauptmann W, Jones J, O'Neill E. Factor structure, reliability, and validity of the pain catastrophizing scale. J Behav Med. (1997) 20:589–605. doi: 10.1023/a:1025570508954
25. Corrigan JD, Bogner J. Initial reliability and validity of the Ohio state university TBI identification method. J Head Trauma Rehabil. (2007) 22:318–29. doi: 10.1097/01.HTR.0000300227.67748.77
26. Grinnon ST, Miller K, Marler JR, Lu Y, Stout A, Odenkirchen J, et al. National institute of neurological disorders and stroke common data element project - approach and methods. Clin Trials. (2012) 9:322–9. doi: 10.1177/1740774512438980
27. Echemendia RJ, Meeuwisse W, McCrory P, Davis GA, Putukian M, Leddy J, et al. The sport concussion assessment tool 5th edition (SCAT5). Br J Sports Med. (2017) 0:1–3. doi: 10.1136/bjsports-2017-097506
28. Echemendia RJ. FreeSurfer. https://surfer.nmr.mgh.harvard.edu/
29. Echemendia RJ. trac-all: White-matter pathway reconstruction from diffusion-weighted images (DWIs) using TRACULA. https://surfer.nmr.mgh.harvard.edu/fswiki/trac-all
30. Hindriks R, Adhikari MH, Murayama Y, Ganzetti M, Mantini D, Logothetis NK, et al. Can sliding-window correlations reveal dynamic functional connectivity in resting-state fMRI? Neuroimage. (2016) 127:242–56. doi: 10.1016/j.neuroimage.2015.11.055
31. Peyron R, Laurent B, Garcia-Larrea L. Functional imaging of brain responses to pain. Neurophysiol Clin. (2000) 30:263–88. doi: 10.1016/S0987-7053(00)00227-6
32. Schulte LH, Allers A, May A. Hypothalamus as a mediator of chronic migraine evidence from high-resolution fMRI. Neurology. (2017) 88:2011–6. doi: 10.1212/WNL.0000000000003963
33. Ashina H, Porreca F, Anderson T, Amin FM, Ashina M, Schytz HW, et al. Post-traumatic headache: epidemiology and pathophysiological insights. Nat Rev Neurol. (2019) 15:607–17. doi: 10.1038/s41582-019-0243-8
34. Stankewitz A, Aderjan D, Eippert F, May A. Trigeminal nociceptive transmission in migraineurs predicts migraine attacks. J Neurosci. (2011) 31:1937–43. doi: 10.1523/JNEUROSCI.4496-10.2011
35. Moulton EA, Becerra L, Maleki N, Pendse G, Tully S, Hargreaves R, et al. Painful heat reveals hyperexcitability of the temporal pole in interictal and ictal migraine states. Cereb Cortex. (2011) 21:435–48. doi: 10.1093/cercor/bhq109
36. Schwedt TJ, Chong CD, Chiang CC, Baxter L, Schlaggar BL, Dodick DW. Enhanced pain-induced activity of pain-processing regions in a case-control study of episodic migraine. Cephalalgia. (2014) 34:947–58. doi: 10.1177/0333102414526069
37. Russo A, Tessitore A, Esposito F, Marcuccio L, Giordano A, Conforti R, et al. Pain processing in patients with migraine: an event-related fMRI study during trigeminal nociceptive stimulation. J Neurol. (2012) 259:1903–12. doi: 10.1007/s00415-012-6438-1
38. Tessitore A, Russo A, Esposito F, Giordano A, Taglialatela G, De Micco R, et al. Interictal cortical reorganization in episodic migraine without aura: an event-related fMRI study during parametric trigeminal nociceptive stimulation. Neurol Sci. (2011) 32:165–7. doi: 10.1007/s10072-011-0537-0
39. Duerden EG, Albanese MC. Localization of pain-related brain activation: a meta-analysis of neuroimaging data. Hum Brain Mapp. (2013) 34:109–49. doi: 10.1002/hbm.21416
40. Wager TD, Atlas LY, Lindquist MA, Roy M, Woo CW, Kross E. An fMRI-based neurologic signature of physical pain. N Engl J Med. (2013) 368:1388–97. doi: 10.1056/nejmoa1204471
41. May A. Pearls and pitfalls: neuroimaging in headache. Cephalalgia. (2013) 33:554–65. doi: 10.1177/0333102412467513
42. Denuelle M, Fabre N, Payoux P, Chollet F, Geraud G. Hypothalamic activation in spontaneous migraine attacks. Headache. (2007) 47:1418–26. doi: 10.1111/j.1526-4610.2007.00776.x
43. Schulte LH, May A. The migraine generator revisited: continuous scanning of the migraine cycle over 30 days and three spontaneous attacks. Brain. (2016) 139:1987–93. doi: 10.1093/brain/aww097
44. Schulte LH, Menz MM, Haaker J, May A. The migraineur's Brain networks: continuous resting state fMRI over 30 days. Cephalalgia. (2020) 40:1614–21. doi: 10.1177/0333102420951465
45. Maniyar FH, Sprenger T, Monteith T, Schankin C, Goadsby PJ. Brain activations in the premonitory phase of nitroglycerin-triggered migraine attacks. Brain. (2014) 137:232–41. doi: 10.1093/brain/awt320
46. Lu L, Li F, Wang P, Chen H, Chen YC, Yin X. Altered hypothalamic functional connectivity in post-traumatic headache after mild traumatic brain injury. J Headache Pain. (2020) 21:1–9. doi: 10.1186/s10194-020-01164-9
47. Chen TL, Babiloni C, Ferretti A, Perrucci MG, Romani GL, Rossini PM, et al. Human secondary somatosensory cortex is involved in the processing of somatosensory rare stimuli: an fMRI study. Neuroimage. (2008) 40:1765–71. doi: 10.1016/j.neuroimage.2008.01.020
48. Cortez MM, Millsap L, Rea NA, Sciarretta C, Brennan KC. Photophobia and allodynia in persistent post-traumatic headache are associated with higher disease burden. Cephalalgia. (2021) 41:1089–99. doi: 10.1177/03331024211010304
49. Russo A, Esposito F, Conte F, Fratello M, Caiazzo G, Marcuccio L, et al. Functional interictal changes of pain processing in migraine with ictal cutaneous allodynia. Cephalalgia. (2017) 37:305–14. doi: 10.1177/0333102416644969
50. Flowers M, Leung A, Schiehser DM, Metzger-Smith V, Delano-Wood L, Sorg S, et al. Severities in persistent mild traumatic brain injury related headache is associated with changes in supraspinal pain modulatory functions. Mol Pain. (2021) 17:1–8. doi: 10.1177/17448069211037881
51. Puledda F, Ffytche D, O’Daly O, Goadsby PJ. Imaging the visual network in the migraine Spectrum. Front Neurol. (2019) 10:1–12. doi: 10.3389/fneur.2019.01325
52. Zhang J, Su J, Wang M, Zhao Y, Zhang QT, Yao Q, et al. The posterior Insula shows disrupted brain functional connectivity in female migraineurs without aura based on brainnetome atlas. Sci Rep. (2017) 7:1–12. doi: 10.1038/s41598-017-17069-8
53. Borsook D, Veggeberg R, Erpelding N, Borra R, Linnman C, Burstein R, et al. The Insula: a “hub of activity” in migraine. Neuroscientist. (2016) 22:632–52. doi: 10.1177/1073858415601369
54. Dahlberg L S, Linnman CN, Lee D, Burstein R, Becerra L, Borsook D. Responsivity of periaqueductal gray connectivity is related to headache frequency in episodic migraine. Front Neurol. (2018) 9:61. doi: 10.3389/fneur.2018.00061
55. Li Z, Liu M, Lan L, Zeng F, Makris N, Liang Y, et al. Altered periaqueductal gray resting state functional connectivity in migraine and the modulation effect of treatment. Sci Rep. (2016) 6:1–11. doi: 10.1038/srep20298
56. Yu R, Gollub RL, Spaeth R, Napadow V, Wasan A, Kong J. Disrupted functional connectivity of the periaqueductal gray in chronic low back pain. NeuroImage Clin. (2014) 6:100–8. doi: 10.1016/j.nicl.2014.08.019
57. Henderson LA, Keay KA. Imaging acute and chronic pain in the human brainstem and spinal cord. Neuroscientist. (2018) 24:84–96. doi: 10.1177/1073858417703911
58. Niu X, Bai L, Sun Y, Wang S, Cao J, Sun C, et al. Disruption of periaqueductal grey-default mode network functional connectivity predicts persistent post-traumatic headache in mild traumatic brain injury. J Neurol Neurosurg Psychiatry. (2019) 90:326–32. doi: 10.1136/jnnp-2018-318886
59. Silvestro M, Tessitore A, Di Nardo F, di Clemente F S, Trojsi F, Cirillo M, et al. Functional connectivity changes in complex migraine aura: beyond the visual network. Eur J Neurol. (2022) 29:295–304. doi: 10.1111/ene.15061
Keywords: post-traumatic headache (PTH), migraine, fMRI, classification, machine learning
Citation: Dumkrieger G, Chong Catherine D, Ross K, Berisha V and Schwedt Todd J (2023) The value of brain MRI functional connectivity data in a machine learning classifier for distinguishing migraine from persistent post-traumatic headache. Front. Pain Res. 3:1012831. doi: 10.3389/fpain.2022.1012831
Received: 5 August 2022; Accepted: 21 November 2022;
Published: 9 January 2023.
Edited by:
Danielle D. DeSouza, Stanford University, United StatesReviewed by:
Pascal Tetreault, Université de Sherbrooke, CanadaBasit Ali Chaudhry, Rigshospitalet, Denmark
© 2023 Dumkrieger, Chong, Ross, Berisha and Schwedt. This is an open-access article distributed under the terms of the Creative Commons Attribution License (CC BY). The use, distribution or reproduction in other forums is permitted, provided the original author(s) and the copyright owner(s) are credited and that the original publication in this journal is cited, in accordance with accepted academic practice. No use, distribution or reproduction is permitted which does not comply with these terms.
*Correspondence: Gina Dumkrieger dumkrieger.gina@mayo.edu
Specialty Section: This article was submitted to Headache, a section of the journal Frontiers in Pain Research