Photoacoustic waves of a fluidic elliptic cylinder: Analytic solution and finite element method study
 Ying Zhang
 Huan Wei
 Hui Fang
- Nanophotonics Research Center, Shenzhen Key Laboratory of Micro-Scale Optical Information Technology, Institute of Microscale Optoelectronics, Shenzhen University, Shenzhen, China
In this study, we focused on the photoacoustic wave production of a fluidic elliptic cylinder for modelling blood vessels, where the consideration of the elliptic cross section can be important for some diagnosis of vascular diseases. First, under the condition of optically-thin absorption, the analytic solution based on the photoacoustic Helmholtz equation in elliptic cylinder coordinates by using Mathieu functions was derived. Then, the finite element method (FEM) model was established to verify the analytic solution. In addition to photoacoustic waves and corresponding photoacoustic power spectra, both near- and far-field photoacoustic amplitude angular distributions were compared. The results revealed that the angular dependent photoacoustic power spectra are critical indicators of the ellipse shape variation. This finding can provide a considerable insight into the photoacoustic diagnosis of the blood vessel changes not only in terms of sizes but also shapes.
Introduction
The geometry shape of blood vessels is highly correlated to vascular diseases such as vascular blockage, thrombosis, tumour, and myocardial infarction [1, 2]. Although the circular cross section is generally applied to model the blood vessels, in several situations, such as variations in tension and blood pressure and the compression resulting from the surrounding tissue, the noncircular cross section of the blood vessel should be considered [3–7].
As a slightly complex model, elliptic cross section has been justified in various blood vascular studies. For example, in magnetic resonance imaging, the elliptic cross section of the aorta in healthy volunteers exhibited an ellipticity (ξ) of 0.8 [8]. Because of the thin walls of the tube, the cross section of vein deforms anisotropically on being subjected to forces. Therefore, the elliptic cross section can be an important parameter for modelling blood vessels [9, 10]. When the elliptic microvessels bend considerably, numerous reactants adhere to the inner wall of the microvessels resulted in thrombosis [11].
Because of rapid advances in biomedical imaging, considerable progress has been achieved in photoacoustic imaging through three-dimensional (3D) visualisation of blood vascular systems in disease diagnosis [12, 13]. Currently, photoacoustic imaging can reveal information of blood vascular deep morphology in biological tissues ranging from brain to breast [14, 15]. Furthermore, noninvasive analysis of arterial tortuousness of blood vessels in eyes and hands has been realised [16, 17]. In term of function, photoacoustic imaging can be used to determine whether a vessel is an artery or a vein based on haemoglobin oxygen saturation [18] and to detect changes in the vessel diameter and density related to the cardiovascular and metabolic diseases [17, 19]. However, photoacoustic imaging is yet to be realised for detailing cross-section changes of blood microvessels.
To accurately detail variations in the cross section of the blood vessels in terms of both size and shape, analyzing the photoacoustic power spectra can be an effective approach. Previous studies have revealed that in spherical [20], oblate spherical [21, 22] and various nonspherical axisymmetric particle models [23–26], the photoacoustic power spectra can be used to investigate the differences in the cell structure during early development and disease. The cylindrical model [27] has been developed and applied in blood vessel photoacoustic imaging [28, 29]. However, to the best of our knowledge, the photoacoustic power spectra of elliptic cylinder blood vessels are yet to be examined. By considering the elliptic cross section as an idealisation of the geometry of a compressed blood vessel, we derived an analytical solution for investigating photoacoustic waves generated from a fluidic elliptic cylinder and calculated various results based on this analytical solution.
For comparison and confirmation, we also developed the FEM model to perform simulation. The proposed FEM model is based on previously reported models [30–32]. In FEM simulation, the photoacoustic wave is caused by the expansion of light-absorbing fluidic elliptical cylinders and the displacement of a thin adjacent layer of water treated as expandable solid. We used multiphysics simulation software (COMSOL) to develop our FEM programme to investigate various physics processes.
The rest of the paper is organised as follows: in Section 2, the analytical solution based on the Mathieu function was discussed and the proposed FEM simulation model was described. In Section 3, results of spectral response and radiation distribution are provided. Finally, in Section 4, discussion and conclusion are presented. The proposed FEM simulations are consistent with results of the analytic solution, and the angular dependent photoacoustic power spectra can be used as an indicator of the shape changes of the elliptic blood vessels.
Methods
Analytic solution
An infinite long elliptical cylinder filled with light-absorbing fluid was considered to represent the blood vessel (Figure 1). Therefore, the analytic solution expressed with two-dimensional Mathieu wave functions was derived in elliptical coordinates [33–35].
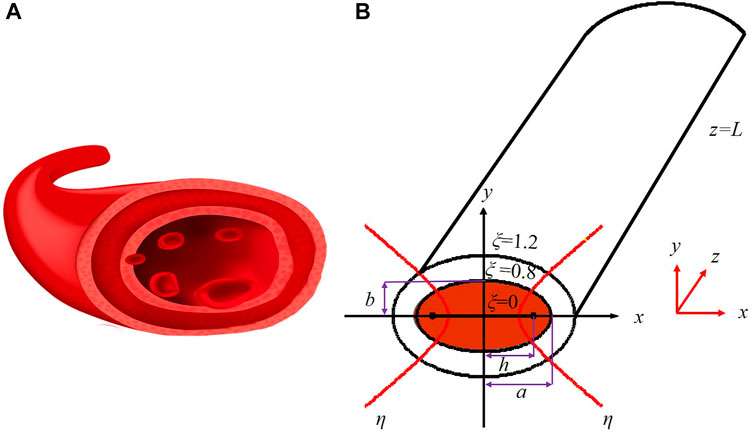
FIGURE 1. Illustration of the model for deriving the analytic solution. (A) Illustration of a blood vessel. (B) The corresponding model of the infinite long fluidic elliptic cylinder in the elliptical coordinates. The semi-major and semi-minor axis of the elliptic cylinder is a and b, respectively. In the z-direction, L is infinite. The half focal distance (the focal radius) is denoted by h.
Assuming the optically thin absorption condition, the photoacoustic pressure wave generation equation with the omission of the heat conduction and the fluidic viscosity [36] can be expressed as follows:
where β is the thermal expansion coefficient, Cp is the heat capacity of the irradiated fluid, c is the speed of sound, and H is a function that describes the optical heating of the elliptical cylinder per unit time and volume.
For a short laser pulse with the intensity profile of I(t), the following equation can express H:
where α represents the optical absorption coefficient of the fluidic elliptic cylinder. However, the spectral decomposition method based on the Fourier transform can be applied to first solve the problem of single frequency intensity modulated laser illumination as follows:
where the frequency originates from the following expression:
Next, the final solution can be obtained through Fourier integration.
By incorporating Eq. 3 into Eq. 1 (which is essentially considering that the intensity modulated laser illuminates the fluidic elliptical cylinder uniformly), according to [27], the solution can be separated into two parts. In one part, the solution of inhomogeneous wave equation is expressed as follows (only for the region inside the elliptical cylinder):
in the next part, the solution related to the homogeneous photoacoustic wave Helmholtz equation is expressed as follows:
The Helmholtz equation can be solved in the elliptical coordinates and expressed by the radial and angular Mathieu functions. This approach is similar to the acoustic scattering problem of an elliptical cylinder [37, 38]. Because of the constrains of finite values both at the origin point located inside the elliptical cylinder and at the infinite point outside the elliptical cylinder, the solution inside and the solution outside are respectively expressed by Mathieu–Bessel functions
where subscript or superscript “c” denotes quantities of the fluidic elliptic cylinder, and “
with 2h the inter-focal distance, and cc and cf the velocity of sound in the fluidic elliptic cylinder and the surrounding fluid, respectively.
To solve the coefficients in Eqs 7, 8, we applied the boundary conditions, which require continuity of the pressure and the acceleration (related to the first derivative of the pressure respective to the radial coordinate
and apply the orthogonal condition of cos2kη. Therefore, we obtain that for every k, we have the following equation:
where
Eqs 11 and 12 contain a series of such linear equations with the total number determined by the number of k. Therefore, these linear equations can be transformed into a square-matrix form by setting the dimension in k equal to that in m, thereby arriving at the following equations:
where
Furthermore,
With the matrix algebra, the coefficient vectors
Finally, the time-dependent solution according to the laser pulse expressed in Eq. 4 can be achieved as follows:
Calculation method based on the analytic solution
To calculate the photoacoustic wave generated by the fluidic elliptical cylinder, the integral of Eq. 19 is premised on the coefficient
Another critical feature is the calculation of Eq. 17. The dimension of the matrix should be limited to a small value, otherwise, the converging solution can not be reached. A similar situation has been extensively studied previously [38, 41]. In our calculation, we investigated the trial-and-look approach, and revealed that the truncation dimension should be enlarged with the frequency by using the following optimum setting: if sf ≤ 0.1, the truncation number N should set to one; if sf is between 0.3 and 0.5, the truncation number N should set to is four; the truncation number N is set to seven for all of the other sf values studied here.
FEM modelling
Considering the infinite long cylinder geometry, we established a two-dimensional FEM simulation model in the COMSOL Multiphysics platform as displayed in Figure 2. Spatially, this model is composed by four distinction functional regions. The innermost region is as the red area that represents the fluidic elliptic cylinder. The next adjacent region represents a thin layer of water, which is specifically treated as an elastic solid layer [30–32]. Next, the region is followed by a region representing the surrounding liquid. The outmost region functions as the perfect match layer (PML).
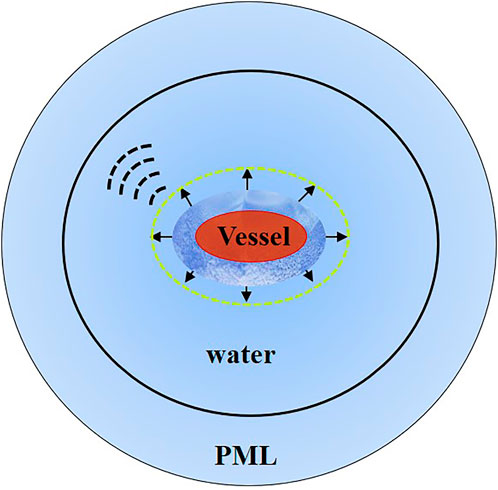
FIGURE 2. Schematic of the two-dimensional cross section model of the fluidic elliptic cylinder for finite element modelling (FEM) simulation of photoacoustic waves. The small arrows denote the thermal expansion due to both fluidic elliptic cylinder and adjacent thin layer of water treated as the elastic solid. The photoacoustic pressure is simulated in the surrounding liquid.
The maximum size of mesh elements is set to 1/6 of the photoacoustic wavelength according to the general guideline for FEM simulation of acoustic wave. Because the water elastic solid layer typically has a thickness of approximately 100nm, its mesh size is the smallest. Based on the general guideline, the PML that was applied to optimum the acoustic wave simulation was divided into eight layers by using the mesh sweeping method.
Based on previous studies [30–32], the simulation is based on multiphysics coupling and proceeds in the following four sequential steps. 1) electromagnetic wave heating: the uniform heating of the fluidic elliptic cylinder because of the linear polarisation plane wave, which is limited to the innermost region. 2) transient heat transfer: the temperature rise resulting from the initial heat source and the subsequential of the heat diffusion. 3) thermal expansion: the displacement due to thermal expansion, which is limited to the region of the fluidic elliptic cylinder, and also the adjacent water layer treated as the elastic solid. 4) acoustic wave propagation: the photoacoustic wave is generated and propagated in the surrounding liquid region, which also includes PML.
Notably, FEM simulation takes the approach of the transition model deployed in the time domain. The frequency response is obtained from the Fourier transformation. This procedure is opposite to the calculation based on the analytical solution. In the FEM model, the direct simulation results can be obtained only in the near region. However, the COMSOL Multiphysics platform can be used to obtain the far-field results based on the boundary integral method to extend the near-field results onto the far field. This type of far-field calculation is performed in the frequency domain.
Table 1 lists all the parameters used in the FEM simulations, where shear modulus and bulk modulus of water represent the parameters for the thin water layer treated as solid.
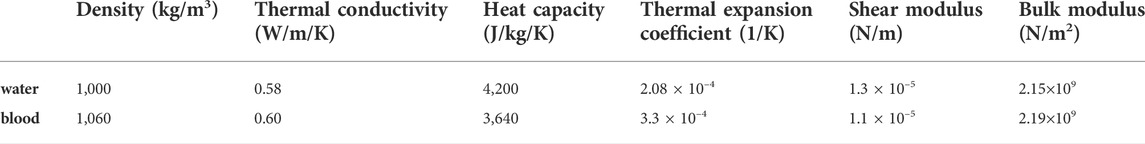
TABLE 1. Parameters have been used for PA FEM model.
Results
Spectral response and the corresponding temporal profile
First, we simulated the photoacoustic wave generated using the small fluidic elliptic cylinder with the size setting of
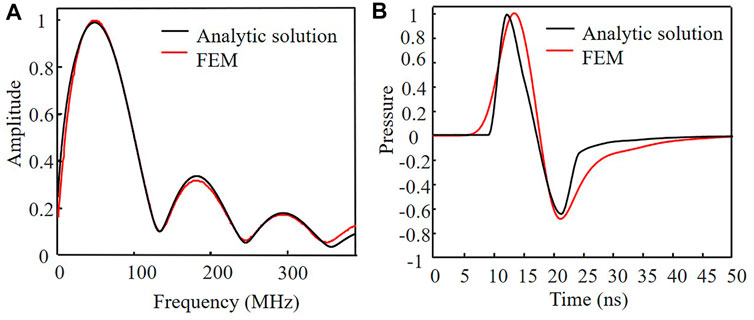
FIGURE 3. Calculation results of the photoacoustic wave based on the analytical solution and compared with the FEM simulation results. (A) Amplitude with respect to the frequency. (B) Corresponding temporal profiles.
Both the spectral response and the temporal profile were consistent, especially the period structure in Figure 3A and pulse location in Figure 3B. The major difference in Figure 3B can be attributed to the following factors: in analytical solutions, stronger approximations were made, that is, the heat conduction and the fluidic viscosity were both omitted; the photoacoustic pulse is calculated from the power spectra, and the effective number of data points for describing the pulse is limited by the maximum frequency. In FEM calculation, the pulse is first calculated and the resulting frequency range is wider than that presented in Figure 3A. The results revealed consistency between MATLAB calculation programme and FEM simulation programme.
Spectral response at various parameter settings
We focused on the calculation based on the analytical solution and considered various parameters setting, as displayed in Figure 4. The varying parameters included various focal radii [Figure 4A], various mass densities and sound velocities [Figure 4B], various acoustic transport distances [Figure 4C] and different acoustic transport angle [Figure 4D]. These parameters are critical in the study of photoacoustic effect of blood vessels.
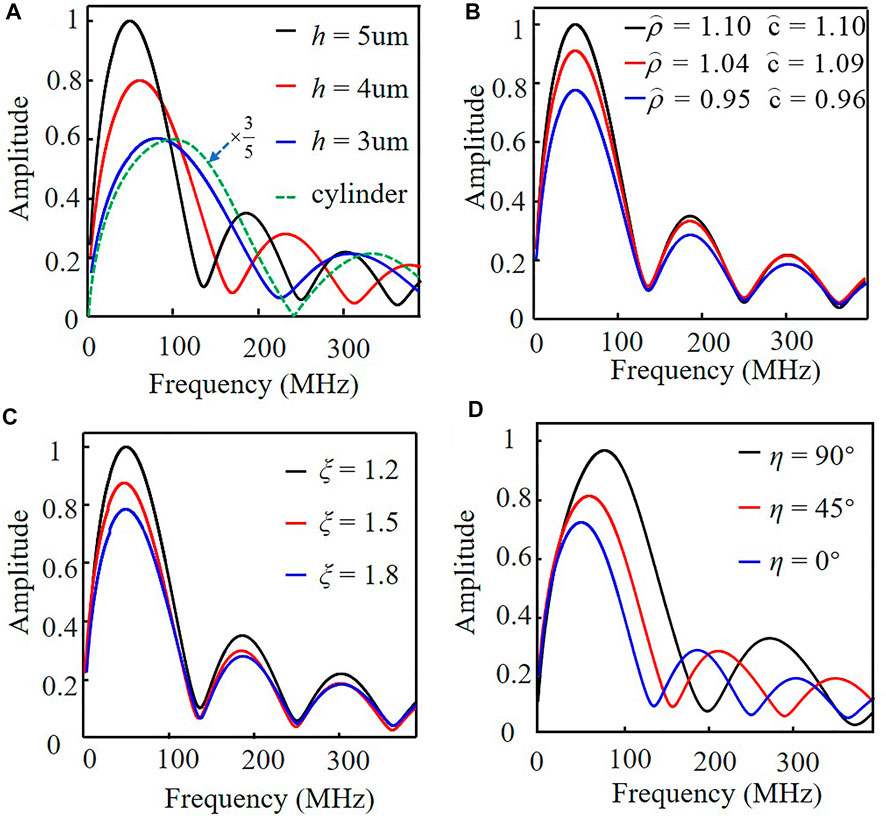
FIGURE 4. Calculated photoacoustic spectral amplitude of the fluidic elliptic cylinder with respect to (A) focal radius h, (B) density ρc and acoustic speed c, (C) detecting distance ξ, and (D) polar angles η.
Figure 4A displays the effect of the shape and size of blood vessels. The radial parameter was fixed at
For calculations in Figures 4B–D, the elliptical cylinder size is fixed to the case of
In the calculation in Figure 4C, only the spatial distance of the calculated point changes, and the other parameters remain the same in case of Figure 3. The results also clearly revealed that the distance only changes the magnitude of the spectral response.
Finally, we investigated the effect of changes in the angular coordinates presented in Figure 4D (all the other parameters are the same as those used in Figure 3). At different acoustic transport angles (η), both the position of maximal PA spectral amplitude and the amplitude value of the photoacoustic spectrum changed drastically with the decrease in the angle. These results indicated that the major characteristic in the spectral response should be angular dependence because the elliptical cylinder became anisotropic compared with the cylinder.
We have performed the FEM simulation for the same parameter settings of Figure 4A, Figure 4C and Figure 4D and the corresponding results are almost the same as those shown in Figure 4. The results of Figure 4B can not be directly simulated since the FEM model does not consider the sound wave (thus the sound velocity) inside the elliptical cylinder.
Near- and far-field angular dependence
Figure 4D reveals that at angles η = 0°, 45°, 90°, the spectral response curves differ considerably. The change at all other angles was also noted. We further calculate the polar distribution pattern of the photoacoustic wave amplitude. In this case, we displayed the results for four frequencies f = 40, 100, 200, and 300 MHz (which correspond to sf = 0.16, 1.01, 4.39, and 9.85) as the representative. Their results calculated for the near field at ξ = 1.2 are displayed from Figures 5A–D.
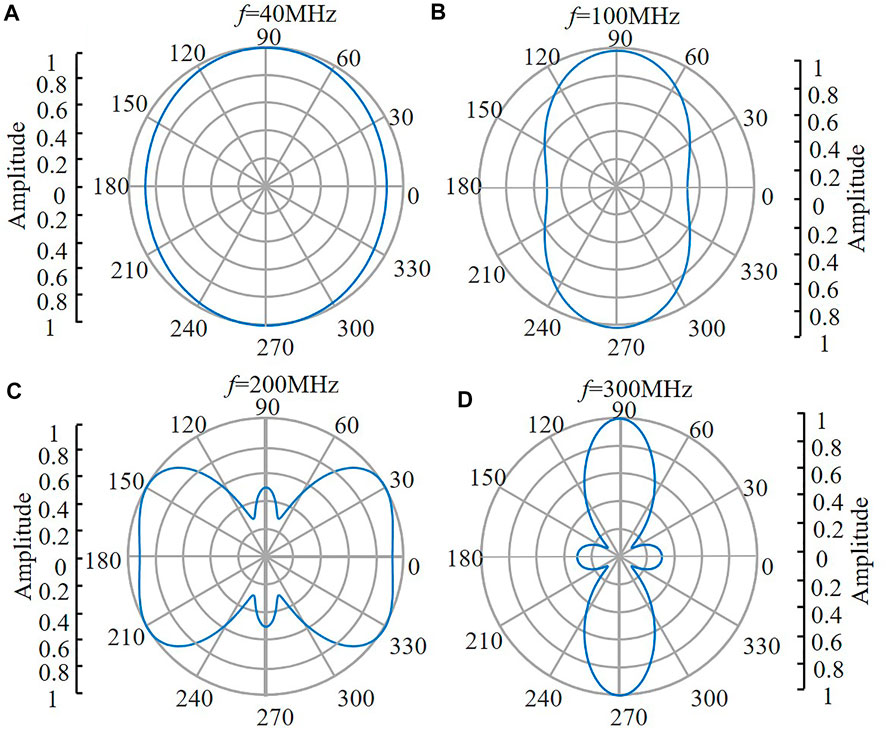
FIGURE 5. Polar distribution patterns of the photoacoustic amplitude at the near-field ξ = 1.2 for various frequencies (A–D) Respectively for the frequency of 40, 100, 200, and 300 MHz. The amplitude distribution of each frequency is normalised to its maximum value, which are 0.08, 0.1, 0.03, and 0.05, respectively.
As displayed in Figure 5, the polar distribution is approximately isotropic at the low frequency of 40 MHz. When the frequency increases, the anisotropy of the distribution pattern becomes pronounced. To understand these results, we analysed the separated orders of modes calculated by Eq. 8 (see Appendix A). The combination coefficient of
In Figure 6, the results revealed when the distance moves to ξ = 6 (which corresponds to the distance of 1000um) when keeping other parameters unchanged as applied in Figure 5. Notably, the polar distributions appear similar to those in Figure 5. We trace back to Eq. 8, which reveals that these results indicate radial Mathieu functions
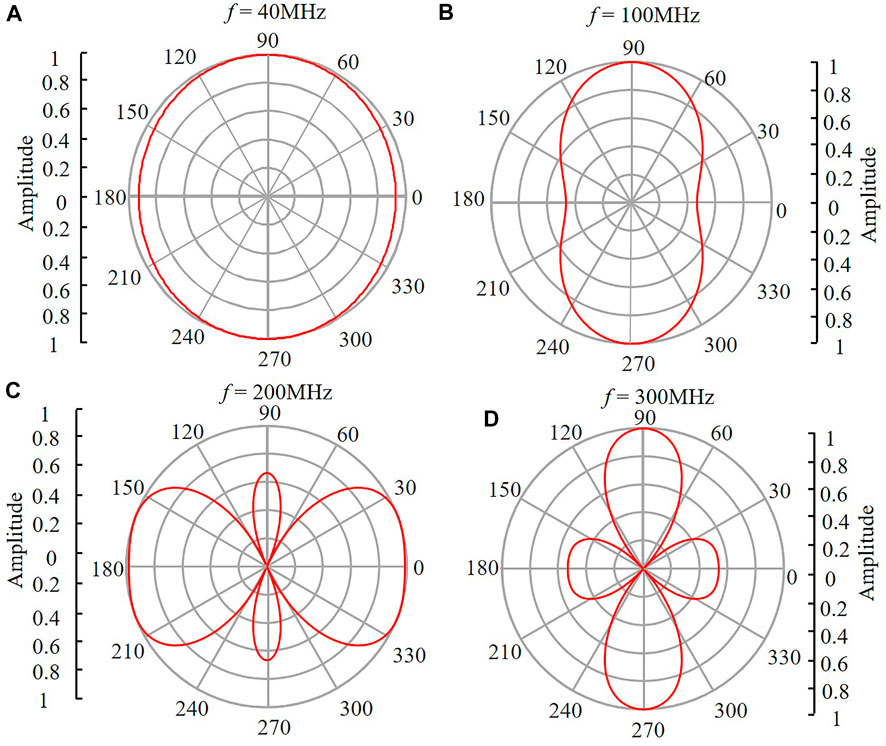
FIGURE 6. Polar distribution patterns of the photoacoustic amplitude at the far-field ξ = 6 for various frequencies. (A–D) Respectively for the frequency of 40, 100, 200 and 300 MHz. The amplitude distribution of each frequency is normalised to its maximum value, which were 0.0073, 0.0085, 0.0024, and 0.0027.
Finally, we performed FEM simulation for the near-field and far-field polar distributions. The results are displayed in Figure 7. These results are consistent with those in Figures 5, 6.
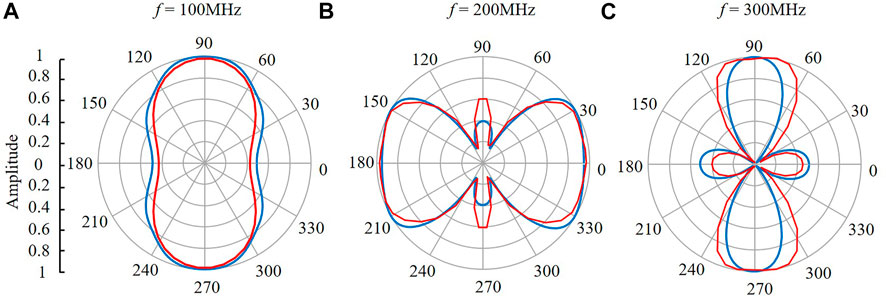
FIGURE 7. FEM simulation of the photoacoustic amplitude polar distribution patterns at the near-field ξ = 1.2 (blue line) and far-field ξ = 6 ((red line) for various frequencies. (A–C) respectively for the frequency of 100, 200 and 300 MHz.
Discussions and conclusion
For the light-absorbing fluidic elliptical cylinder, we performed calculation based on the analytic solution derived and FEM modelling in this study. The comparison results presented in Figure 3 and in Figures 5–7 reveal consistency of these two approaches. In practice, the FEM simulation should provide more accurate results and also are more flexible. For example, the light attenuation inside the fluidic elliptical cylinder due to the light absorption can be easily incorporated into the FEM simulation which is difficult in deriving the analytical solution. However, the calculation based on the analytical solution is considerably faster and can conventionally provide physical insight regarding the impact of different parameters: the results in Figure 4 revealed the size and the shape changes considerably affect the shape of the power spectra, whereas the density and acoustic speed primarily affect the overall magnitude. Moreover, the analytical solution can be potentially very useful for the eigen mode analysis of the elliptical cylinder, as referring to the previous study of the circular cylinder [42].
In the current study, we have omitted the possible acoustic attenuation of the surrounding fluid medium. This should not be a problem for the near field solution but will affect the far field solution, especially the far field photoacoustic amplitude spectra. The impact is worth for further study both in the FEM modeling [43–45] and the analytical solution derivation. However, since the acoustic attenuation should not affect the polar profile at a specified frequency, the major conclusions deduced from Figures 5–7 should still be valid.
In summary, the major finding of our current study is that the polar angular radiation patterns of the photoacoustic wave of a fluidic elliptic cylinder exhibit anisotropic characteristics, which is true even for the far-field case. It strongly suggests that the method of measuring the photoacoustic pulses in various angles and analyzing the angular dependent amplitude spectra can be used to differentiate the small blood vessels with elliptical cross section. We expect that the experimental study regarding this method will be performed in the near future.
Data availability statement
The raw data supporting the conclusion of this article will be made available by the authors, without undue reservation.
Author contributions
YZ and HF contributed to write and edit the manuscript. HF contributed to the conception of study. YZ, HW and HF have discussed this research.
Funding
This study is supported by the National Natural Science Foundation of China (12074268); Nature Science Foundation of Guangdong Province (2018B030311048); Natural Science Foundation of Shenzhen City (the Stable Support Plan Program) (20200814164819001).
Conflict of interest
The authors declare that the research was conducted in the absence of any commercial or financial relationships that could be construed as a potential conflict of interest.
Publisher’s note
All claims expressed in this article are solely those of the authors and do not necessarily represent those of their affiliated organizations, or those of the publisher, the editors and the reviewers. Any product that may be evaluated in this article, or claim that may be made by its manufacturer, is not guaranteed or endorsed by the publisher.
References
1. Nagy JA, Chang SH, Shih SC, Dvorak AM, Dvorak HF. Heterogeneity of the tumor vasculature. Semin Thromb Hemost (2010) 36:321–31. doi:10.1055/s-0030-1253454
2. Wootton DM, Ku DN. Fluid mechanics of vascular systems, diseases, and thrombosis. Annu Rev Biomed Eng (1999) 1:299–329. doi:10.1146/annurev.bioeng.1.1.299
3. Zhang XM, Weng CC, Wu SL, Cai JY, Wu HQ, Li ZF, et al. Photoacoustic identification of blood vessel deformation under pressure. AIP Adv (2019) 9(7):075019. doi:10.1063/1.5108852
4. Carmeliet P, Jain RK. Principles and mechanisms of vessel normalization for cancer and other angiogenic diseases. Nat Rev Drug Discov (2011) 10(6):417–27. doi:10.1038/nrd3455
5. Robertson MB, Köhler U, Hoskins PR, Marshall I. Flow in elliptical vessels calculated for a physiological waveform. J Vasc Res (2001) 38(1):73–82. doi:10.1159/000051032
6. Haslam M, Zamir M. Pulsatile flow in tubes of elliptic cross sections. Ann Biomed Eng (1998) 26:780–7. doi:10.1114/1.106
7. O'Flynn PM, O'Sullivan G, Pandit AS. Geometric variability of the abdominal aorta and its major peripheral branches. Ann Biomed Eng (2010) 38(3):824–40. doi:10.1007/s10439-010-9925-5
8. Moreno MR, Moore JE, Meuli R. Cross-sectional deformation of the aorta as measured with magnetic resonance imaging. J Biomech Eng (1998) 120(1):18–21. doi:10.1115/1.2834298
9. Nichols WW, O’Rourke MF. McDonald’s blood flow in arteries, theoretical, experimental and clinical principles. London: Arnold (1998).
10. Delfino A, Moore JE, Meister JJ. Lateral deformation and movement effects on flow through distensible tube models of blood vessels. Biorheology (1994) 31(5):533–47. doi:10.3233/bir-1994-31503
11. Qin L, Mirc D, Fu BM. Mechanical mechanisms of thrombosis in intact bent microvessels of rat mesentery. J Biomech (2008) 41(12):2726–34. doi:10.1016/j.jbiomech.2008.06.013
12. Li L, Wang LV. Recent advances in photoacoustic tomography. BME Front (2021) 9823268:1. doi:10.34133/2021/9823268/
13. Tang YQ, Wu HY, Klippel P, Zhang BH, Huang HYS, Jing Y, et al. Deep thrombosis characterization using photoacoustic imaging with intravascular light delivery. Biomed Eng Lett (2022) 12(2):135–45. doi:10.1007/s13534-022-00216-0
14. Hu S, Wang LV. Photoacoustic imaging and characterization of the microvasculature. J Biomed Opt (2010) 15(1):011101. doi:10.1117/1.3281673
15. Lin L, Hu P, Tong X, Na1 S, Cao R, Yuan XY, et al. High-speed three-dimensional photoacoustic computed tomography for preclinical research and clinical translation. Nat Commun (2021) 12(1):882–10. doi:10.1038/s41467-021-21232-1
16. Matsumoto Y, Asao Y, Yoshikawa A, Sekiguchi H, Takada M, Furu M, et al. Label-free photoacoustic imaging of human palmar vessels: A structural morphological analysis. Sci Rep (2018) 8(1):786–8. doi:10.1038/s41598-018-19161-z
17. Zhao H, Wang G, Lin R, Gong X, Song L, Li T, et al. Three-dimensional Hessian matrix-based quantitative vascular imaging of rat iris with optical-resolution photoacoustic microscopy in vivo. J Biomed Opt (2018) 23(4):1–11. doi:10.1117/1.JBO.23.4.046006
18. Matsumoto Y, Asao Y, Sekiguchi H, Yoshikawa A, Ishii T, Nagae K, et al. Visualising peripheral arterioles and venules through high-resolution and large-area photoacoustic imaging. Sci Rep (2018) 8(1):14930–11. doi:10.1038/s41598-018-33255-8
19. Shan T, Zhao Y, Jian S, Jiang H. In-vivo hemodynamic imaging of acute prenatal ethanol exposure in fetal brain by photoacoustic tomography. J Biophotonics (2020) 13(5):e201960161. doi:10.1002/jbio.201960161
20. Khan MI, Diebold GJ. The photoacoustic effect generated by an isotropic solid sphere. Ultrasonics (1995) 33(4):265–9. doi:10.1016/0041-624X(95)00034-Z
21. Li Y, Fang H, Min CJ, Yuan XC. Simulating photoacoustic waves produced by individual biological particles with spheroidal wave functions. Sci Rep (2015) 5:14801–11. doi:10.1038/srep14801
22. Li Y, Fang H, Min CJ, Yuan XC. Analytic theory of photoacoustic wave generation from a spheroidal droplet. Opt Express (2014) 22:19953–69. doi:10.1364/OE.22.019953
23. Strohm EM, Hysi E, Kolios MC. Photoacoustic measurements of single red blood cells. IEEE Int Ultrason Symp (Ius) (2012) 2012 1406–9. doi:10.1109/ULTSYM.2012.0351
24. Strohm EM, Berndl ESL, Kolios MC. Probing red blood cell morphology using high-frequency photoacoustics. Biophys J (2013) 105(1):59–67. doi:10.1016/j.bpj.2013.05.037
25. Saha RK, Karmakar S, Adhikari A, Kolios MC. Photoacoustic field calculation for nonspherical axisymmetric fluid particles. Biomed Phys Eng Exp (2017) 3:015017. doi:10.1088/2057-1976/aa555f
26. Saha RK. A simulation study on the quantitative assessment of tissue microstructure with photoacoustics. IEEE T Ultrason Ferr (2015) 62:881–95. doi:10.1109/TUFFC.2015.006993
27. Khan MI, Sun T, Diebold GJ. Photoacoustic waves generated by absorption of laser radiation in optically thin cylinders. J Acoust Soc Am (1993) 94(2):931–40. doi:10.1121/1.408195
28. Hoelen CGA, De Mul FFM, Pongers R, Dekker A. Three-dimensional photoacoustic imaging of blood vessels in tissue. Opt Lett (1998) 23:648–50. doi:10.1364/OL.23.000648
29. Siphanto RI, Kolkman RGM, Huisjes A, Pilatou MC, De Mul FFM, Steenbergen W, et al. Imaging of small vessels using photoacoustics: An in vivo study. Lasers Surg Med (2004) 35:354–62. doi:10.1002/lsm.20100
30. Hatef A, Darvish B, Dagallier A, Davletshin YR. Analysis of photoacoustic response from gold-silver alloy nanoparticles irradiated by short pulsed laser in water. J Phys Chem (2015) 119:24075. doi:10.1021/acs.jpcc.5b08359
31. Yu HQ, Yao J, Wu XW, Wu DJ, Liu XJ. Tunable photoacoustic properties of gold nanoshells with near-infrared optical responses. J Appl Phys (2017) 122:134901. doi:10.1063/1.4985860
32. Kumar D, Ghai DP, Soni RK. Simulation studies of photoacoustic response from gold-silica core-shell nanoparticles. Plasmonics (2018) 13:1833. doi:10.1007/s11468-018-0697-3
33. Alhargan FA. Algorithms for the computation of all Mathieu functions of integer orders. ACM Trans Math Softw (2000) 26(3):390–407. doi:10.1145/358407.358420
34. Shen J, Wang LL. On spectral approximations in elliptical geometries using Mathieu functions. Math Comput (2009) 78(266):815–44. doi:10.1090/S0025-5718-08-02197-2
35. Gutierrez-Vega JC, Rodriguea-Dagnino RM, Meneses-Nave MA. Chavez-cerda S. Mathieu functions, a visual approach. Am J Phys (2003) 71(3):233–42. doi:10.1119/1.1522698
36. Diebold GJ. Photoacoustic monopole radiation: Waves from objects with symmetry in one, two, and three dimensions. In: LV Wang, editor. Photoacoustic imaging and spectroscopy. Oxfordshire United Kingdom: Taylor & Francis (2009).
37. Sohei N, Yuya N, Nguyen T. Acoustic performance of an elliptical cavity on the application for soundproof ventilation units installed in dwelling walls. Appl Acoust (2020) 168:107418–0. doi:10.1016/j.apacoust.2020.107418
38. Ancey S, Bazzali E, Gabrielli P, Mercier M. Acoustic scattering by elastic cylinders of elliptical cross-section and splitting up of resonances. J Appl Phys (2014) 15(19):194904. doi:10.1063/1.4876678
40. Lee WM. Acoustic scattering by multiple elliptical cylinders using collocation multipole method. J Comput Phys (2012) 231(14):4597–612. doi:10.1016/j.jcp.2012.02.032
41. Hussein MI, Hamid AK. Electromagnetic scattering by a lossy dielectric elliptic cylinder. J Electromagn Waves Appl (2001) 15:1469–82. doi:10.1163/156939301X00021
42. Gao XX, Tao C, Zhu R, Liu XJ. Noninvasive low-cycle fatigue characterization at high depth with photoacoustic eigen-spectrum analysis. Sci Rep (2018) 8(1):7751. doi:10.1038/s41598-018-26140-x
43. Cao YN, Diebold GJ. Effects of heat conduction and viscosity on photoacoustic waves from droplets. Opt Eng (1997) 36(2):417–22. doi:10.1117/1.601213
44. El-Busaidy S, Baumann B, Wolff M, Duggen L. Modelling of open photoacoustic resonators. Photoacoustics (2020) 18:100161. doi:10.1016/j.pacs.2020.100161
Appendix A: Analysis of the mode contribution in the polar radiation pattern
To understand the near-field polar distribution patterns displayed in Figure 5, we refer to Eq. 8 and analyse the contribution from various orders. As indicated in Eq. 8, the polar distribution pattern is primarily determined by the angular Mathieu function
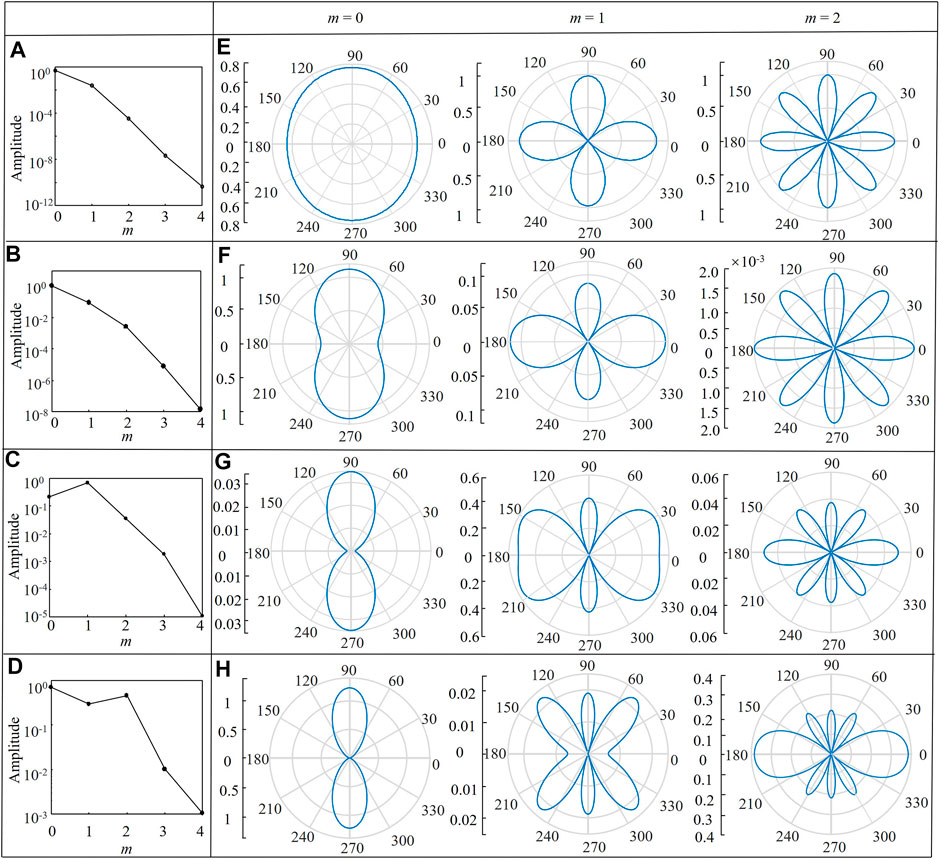
FIGURE 8. Near-field contribution of various modes for photoacoustic wave with various frequencies. (A–D) Mode contribution coefficients for 40, 100, 200, and 300 MHz. (E–H) The mode polar distribution patterns of the three lowest modes for each frequency.
Appendix B: Distance dependent curves of various orders of the radial mathieu function
To investigate the similarity of the far-field polar distribution patterns of Figure 6 comparing to the near-field patterns shown in Figure 5, we traced back to Eq. 8. The combination coefficient of
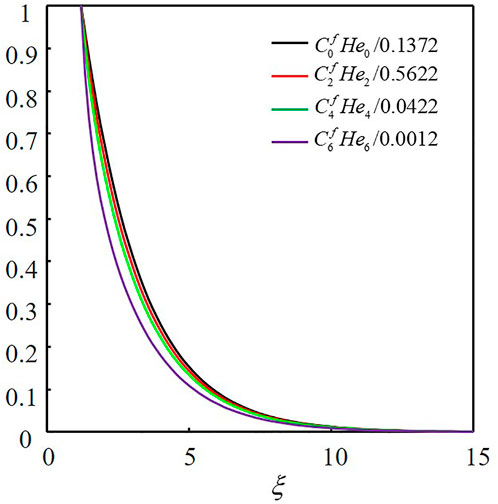
FIGURE 9. Curves of the combination coefficient of various order with the distance. The curves are normalised relative to their maximum value at ξ = 1.2.
Keywords: photoacoustic waves, elliptic cylinder, analytic solution, mathieu functions, FEM
Citation: Zhang Y, Wei H and Fang H (2022) Photoacoustic waves of a fluidic elliptic cylinder: Analytic solution and finite element method study. Front. Phys. 10:960165. doi: 10.3389/fphy.2022.960165
Received: 02 June 2022; Accepted: 12 August 2022;
Published: 26 September 2022.
Edited by:
Chen Shen, Rowan University, United StatesReviewed by:
Defei Liao, Sonix Inc., United StatesDingjie Suo, Beijing Institute of Technology, China
Copyright © 2022 Zhang, Wei and Fang. This is an open-access article distributed under the terms of the Creative Commons Attribution License (CC BY). The use, distribution or reproduction in other forums is permitted, provided the original author(s) and the copyright owner(s) are credited and that the original publication in this journal is cited, in accordance with accepted academic practice. No use, distribution or reproduction is permitted which does not comply with these terms.
*Correspondence: Hui Fang, fhui79@szu.edu.cn