Automatic wide area land cover mapping using Sentinel-1 multitemporal data
 David Marzi
 Antonietta Sorriso
 - Department of Electrical, Computer, Biomedical Engineering, University of Pavia, Pavia, Italy
This study introduces a methodology for land cover mapping across extensive areas, utilizing multitemporal Sentinel-1 Synthetic Aperture Radar (SAR) data. The objective is to effectively process SAR data to extract spatio-temporal features that encapsulate temporal patterns within various land cover classes. The paper outlines the approach for processing multitemporal SAR data and presents an innovative technique for the selection of training points from an existing Medium Resolution Land Cover (MRLC) map. The methodology was tested across four distinct regions of interest, each spanning 100 × 100 km2, located in Siberia, Italy, Brazil, and Africa. These regions were chosen to evaluate the methodology’s applicability in diverse climate environments. The study reports both qualitative and quantitative results, showcasing the validity of the proposed procedure and the potential of SAR data for land cover mapping. The experimental outcomes demonstrate an average increase of 16% in overall accuracy compared to existing global products. The results suggest that the presented approach holds promise for enhancing land cover mapping accuracy, particularly when applied to extensive areas with varying land cover classes and environmental conditions. The ability to leverage multitemporal SAR data for this purpose opens new possibilities for improving global land cover maps and their applications.
1 Introduction
Land cover mapping on wide areas is becoming an increasingly feasible tasks thanks to the availability of free multispectral and SAR data sets, such as the Sentinel constellation1, and of cloud processing services, such as Google Earth Engine (Gorelick et al., 2017) and the Copernicus DIAS (Data and Information Access Services). Still, the challenges that the procedures designed using these new data sets and tools are facing are far from being completely tackled. For instance, no general solution is available for the extraction of the spatio-temporal statistical features that could be most useful to map sequences of data sets by heterogeneous sensors (He and Wang, 2020). Similarly, the issue of the limited size of available training sets and the possibility/suitability of using existing land cover maps as starting point has been explored (Radoux et al., 2014; Paris et al., 2019), but with no final decision. Another issue is how to extract the same land cover classes when using different sensors, with different sensitivity and different spatial/spectral resolutions (Arora, 2002). To this aim, unsupervised approaches or transfer learning and deep learning techniques have been considered (Hamrouni et al., 2021; Chabalala et al., 2022; Wenger et al., 2022).
The focus of this paper is on the use of Sentinel-1 SAR time series for land cover classification at the regional level using training points extracted from pre-existing coarser resolution maps. As a matter of fact, global approaches to land cover mapping using satellite data are currently mostly limited to medium-resolution multispectral data sets. Typical examples are the 300 m GlobCover project2, which exploits multispectral data recorded by the MERIS (MEdium Resolution Imaging Spectrometer) sensor and the 100 m Copernicus Global Land Service (CGLS) (Buchhorn et al., 2020) through the combination of Sentinel-1 and 2 (radar and multispectral) data.
SAR is an active microwave instrument that presents a number of favourable characteristics, including high quality of data that does not depend on the clouds presence. In fact, it has become clear in recent ears that the multispectral data are more efficient compare to the field survey (Fernando and Shariff, 2015). However, the quality of results given by the optical images is strongly influenced by the weather conditions, as well as the cloud coverage. Although the optical remote sensing can be considered a relatively powerful mapping tool, there are some constraints in its usage for discriminating the vegetation. In addition, contrary to the optical system, SAR allows to continually collect data despite of light and weather conditions (Balzter et al., 2015), and its characteristics make it an indispensable instrument for the earth observation from the space. In particular, the increasing number of satellites equipped with SAR system is enabling a better understanding of the dynamics of different scenarios characterizing the earth’s environment, such as the vegetation analysis, forest inventories, permafrost thawing, land subsidence, and urban analysis (Sorriso et al., 2021). The sensitivity of SAR to the structural features of terrain leads to classification of land cover into simple and easily interpreted structural classes (Abdikan et al., 2016).
SAR measurements are widely used in various earth observation applications, and the mapping is a discipline that benefits from SAR data. SAR images helped generating different products, such as high-fidelity maps and sensitive detection maps. The land cover is a problem receiving a lot of attention in decades given the need of developing land use policies, as well as mapping (Orlíková and Horák, 2019; Prudente et al., 2020). It consists in establishing the land cover in the areas of interest, such as vegetation, water, or urban area and in detecting changes in land cover or usage over time. Mapping land cover is a source of practical information for purposes such as forest monitoring, agriculture, urbanization and flood monitoring. Estimates of land cover are necessary to develop land use policies. Only a few global land covers were extracted using SAR, and no complete land cover maps. Examples are water surfaces using ENVISAT (Santoro and Wegmüller, 2012) and Sentinel-1 data (Huang et al., 2018; Jeon et al., 2021), the Global Urban Footprint (Esch et al., 2018) from TerraSAR-X data, the Forest/Non-Forest global map from ALOS/PALSAR data (Shimada et al., 2014), and the crop parcel at the European level (d’Andrimont et al., 2021). An interesting and extended overview concerns the application of the SAR data in different scenarios is provided by (Tsokas et al., 2022).
In order to fill this research gap, in this work Sentinel-1 annual data sequences are exploited for the production of a global land cover map.
To uniformly cover geographically wide areas, and potentially the whole Earth surface, the methodology is based on a sequential mapping of the tiles of the Sentinel-2 grid3, used here for Sentinel-1 data partition as well. As target legend, a subset of the CGLS legend is considered. Indeed, because of its rather coarse spatial resolution, the CGLS legend includes many mixed classes. Its legend was thus reduced to a subset of the classes, by removing those with “mixed” in the legend. Indeed, this is an improvement from the point of view of the mapping product. A randomly selected subset of points belonging to these classes in the Medium Resolution Land Cover (MRLC) map is used as training set. This sampling approach is similar to the one presented in (Paris et al., 2019); however, in that study the training set is built leveraging spectral clustering techniques applied to Sentinel-2 multispectral data, starting from a 30 m spatial resolution land cover map based on Landsat imagery. Considering the challenges of a global scale, Sentinel-1 data contributes in classifying a major number of classes that are not detected by using dataset with a coarsest spatial resolution (Sorriso et al., 2021). The approach proposed with this manuscript was chosen for the land cover due to its high generalization ability and superior performance over deep learning-based classifiers (Yokoya et al., 2018).
Section 2 is devoted to a detailed description of the proposed methodology, while Section 3 introduces and discusses the experimental results in very different test sites all around the world. Eventually, Section 4 concludes the paper.
2 Materials and methods
The starting scientific question that this work addresses is how to use a year-long multitemporal SAR sequence from the Sentinel-1 constellation to effectively map land cover classes using as reference only an existing medium resolution map. This question translates into the two main points discussed here in the following: 1) how to select a reliable set of training points from a medium resolution map, and 2) how to use a multitemporal SAR sequence to discriminate among classes that are typically mapped using multispectral data.
The Sentinel-1 SAR sensor operates in C-band, with a central frequency of 5.405 GHz. Thanks to the two platforms (Sentinel-1A and -1B), the mission is able to provide data with 5 days of revisit time (at the equator on a polar orbit). The antennas mounted on the satellites are right-looking and their incidence angle can vary between 29.1° and 46°. Sentinel-1 is a dual-polarized system that can provide images acquired with VV (Vertically transmitted and Vertically received) and VH (Vertically transmitted and Horizontally received) polarizations. The data set used in this work has been acquired using the Interferometric Wide (IW) swath default operation mode, which has a 250 km swath and a 5 × 20 m spatial resolution (for single look). In this work we use level L1C multi-looked intensity images in the Ground Range Detected (GRD) format with a 10 × 10 m pixel size.
Figure 1 summarizes the scheme of the proposed methodology. Starting from an annual sequence of preprocessed high-resolution SAR images, first a “seasonal” SAR time series (only VH polarization) is extracted, as better explained later on, and a set of spatial features are computed from this reduced time series. Then, a second time series is added to the pool of features. This time series is composed by fifteen “24-day” composites (both VV and VH polarizations). The latter time series, as explained below, is obtained by arithmetic average of the SAR acquisitions available within separated intervals of 24 days.
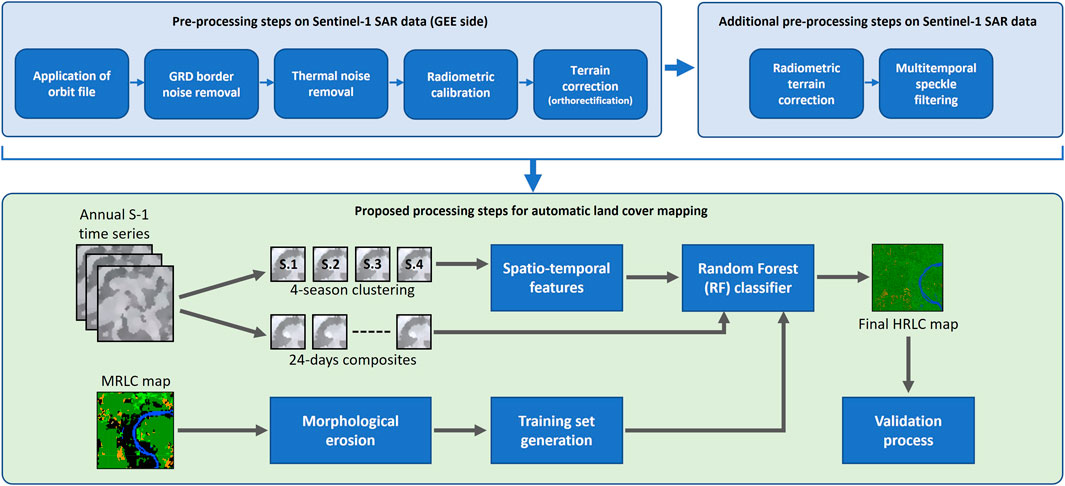
FIGURE 1. A simplified block diagram of the proposed land cover mapping procedure. Part of the preprocessing chain is preimplemented in Google Earth Engine; whereas, the radiometric terrain correction and speckle noise reduction steps were added to the chain. Reproduced from Buchhorn et al.(2020), licensed under CC-BY 4.0.
2.1 SAR data preprocessing
Most of the processing steps involved in the presented methodology, and described in the next sections, rely on pre-processed Sentinel-1 SAR images available in Google Earth Engine. As a matter of fact, Sentinel-1 SAR GRD scenes undergo a standard pre-processing chain by means of a workflow in this platform adapted from the SNAP Toolbox. These steps are the application of orbit file, border noise removal, thermal noise removal, radiometric calibration and orthorectification4. In these pre-calibrated Sentinel-1 images each pixel reports the backscatter coefficient (σ0) in dB.
Since the standard Sentinel-1 preprocessing chain does not include radiometric terrain correction, we added an angular-based radiometric slope correction routine for Sentinel-1 SAR images, developed in (Vollrath et al., 2020). This model leverages a well-established physical reference model which is also extended to simultaneously generate masks of invalid data represented by active layover and shadow affected regions. The radiometrically corrected SAR products significantly improve land cover mapping on a large scale, especially over morphologically complex regions (e.g., mountains).
In the procedure implemented in this work, once the Region of Interest (a Sentinel-2 tile) and the year of interest are selected, all the SAR images in that year are considered as long as they cover at least 70% of the selected tile footprint. According to the study presented in (Marzi and Gamba, 2020), the use of the whole annual temporal series is not necessary for land cover mapping, and temporally aggregated versions of it are more suitable. Leveraging on those results, the selected set of SAR images is grouped into quarterly clusters that resemble, although roughly, the seasonal cycle of the different land cover types.
The four “seasonal” clusters are then subject to speckle noise reduction exploiting a multitemporal denoising filter based on the one presented in (Zhao et al., 2019), which appears to provide better results than a spatial filter applied independently to each SAR image. The procedure basically consists in the estimation of a “super-image,” obtained as arithmetic mean of the SAR acquisitions within the year of interest. Then, the ratio between the original, noisy image at time t and the “super-image” is computed and spatially denoised exploiting a simple Low-pass filter; finally, each denoised ratio composite at time t is re-multiplied by the “super-image”. Due to the improved stationarity of the ratio images, multitemporal speckle-reduction techniques are more effective than denoising each image in the original multitemporal data set. As mentioned above, after the multitemporal denoising filtering is applied, an artificial SAR composite time series of four images is built by the arithmetic mean of all the acquisitions along each seasonal cluster.
2.2 Feature extraction
The second step in the proposed procedure is the selection of the most useful input features for the classifier. As mentioned above, it is expected that the despeckled SAR sequence is able to provide a better discrimination among different land cover types. For instance, multitemporal SAR data for vegetation mapping have been already considered in (Marzi et al., 2022; Paul et al., 2022; Jacob et al., 2020; Khabbazan et al., 2019; Ngo et al., 2020; Gašparović and Dobrinić, 2020).
Exploiting the “seasonal” time series described in Section 2.1, a set of features are computed from each of the four composites of the series: the spatial median, maximum, minimum and range (maximum minus minimum). Each of these spatial statistical descriptors is derived using a kernel of 5 × 5 pixels.
The second time series used in this work is derived from the complete sequence of SAR images. In this case, first the complete collection is clustered into 24-day collections; then, each collection is denoised with the multitemporal denoising filter described above; finally, both the VV and VH polarizations are used to generate a sequence per channel, where the sequence elements are obtained by the arithmetic mean of the images in each 24-day denoised cluster.
The above mentioned seasonal and spatial features, plus the 24-day sequence, are stacked and classified by means of a Random Forest (RF) classifier. The RF approach is superior to unsupervised methods and more robust (Inglada et al., 2017), to the level that erroneous reference data (e.g., slightly outdated points) are acceptable in the training group (Folleco et al., 2008). The RF classifier is trained using a training set extracted, as mentioned in the following subsection, from an MRLC map, while its final classification result is a High-Resolution Land Cover (HRLC) map with 10 m posting. This approach does not reduce the resolution of the final land cover map, which is obtained considering the original resolution of Sentinel-1 data. Moreover, by selecting only classes that are not mixed, it allows to obtain reasonably good training samples at a very limited cost. Of course, these samples are as accurate as (on average) the maps from which they are taken, and this is the reason why robust classifiers, such as RF, are required. Also, several studies, as (Adugna et al., 2022), have shown that for large area land cover mapping RF is effective in classifying mixed classes such as built-up, forest, herbaceous vegetation, and shrub, resulting in a LC map with less mixing among classes.
2.3 Medium resolution (MR) training set
As in any supervised classification algorithms, the selection of the training set plays a crucial role in our procedure. As mentioned, since there are already global land cover maps available at medium spatial resolution, the idea is to exploit the information they contain. Specifically, in this work the training samples are collected from the Copernicus Global Land Service MRLC map at 100 m resolution. As mentioned, the land use class set of this map is not suitable for a map at finer spatial resolution. In fact, it includes many mixed land cover types. Therefore, a different yet related class set must be used for the new map, which includes only “pure” classes, i.e., classes with only one land cover type. The new class set, reported in Table 1, is thus composed only by pure classes. Additionally, classes in the original MR set that cannot be reliably discriminated using SAR data are merged. As an example, the MR class set contains two classes named evergreen broadleaf tree and deciduous broadleaf tree, which are merged into a single class named broadleaf tree.
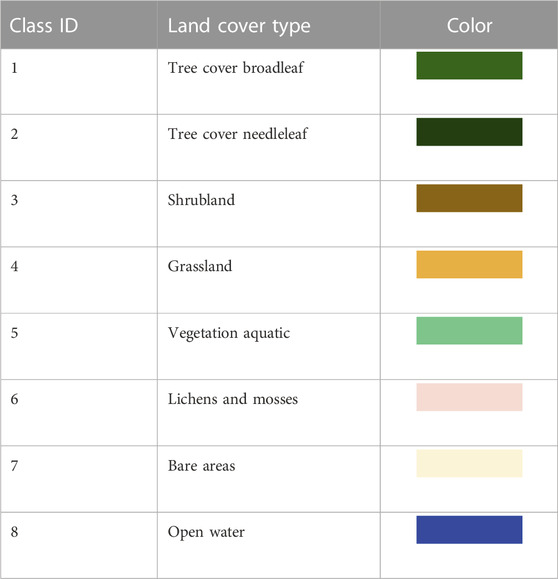
TABLE 1. The class legend used in this work.
Starting from the MRLC map including only the classes to be recognized in the new map, a morphological erosion processing step is applied separately to each class layer. This step, performed using a 3 × 3 pixels kernel, aims at avoiding the selection of training points on the border of the classified area, which might be mixed pixels at medium spatial resolution. To avoid undersampling of classes that have only few pixels in the scene, if the abundance of a class after the erosion appears to be less than the number of samples to be extracted, the original class extent is entirely recovered and used for sampling.
The eroded version of the MRLC map is then used to derive more reliable training points, by means of an innovative algorithm here described. Figure 2 summarizes the processing steps aimed at obtaining points whose reliability is much higher than a simple stratified random sampling. The first step consists of extracting a class from the MRLC map and then generate a set of training points (seeds) to be used as input for a k-Means clustering applied to the stack of SAR-based features described in the previous subsection. Note that the k-Means clustering is implemented according to the “Weka” open source machine learning software (H Witten, 2016) and starts from a representative subset of the data to generate a model aimed at making predictions on the whole data set. The trained clustering model is then used to extract k = 2 classes which are not know in advance. The choice of k = 2 in the k-Means algorithm stems from experiments carried out to achieve a balanced and reliable training set. To this aim, the k-Means approach was applied to the set of SAR features of Section 2.2 within the areas delimited by the Copernicus medium resolution classes, using k = 2. Then, only the pixels associated to most abundant cluster were considered, and a large number of pixels (4,000 in this implementation) are randomly selected to sample the stack of SAR features (ending up with up to 4,000 feature vectors). It was also noted that, by empirically varying k, we noticed that for k ≥ 3 classification performances were lower, as the points that can be potentially sampled after the k-Means clustering were not enough to characterize each land cover type, thus generating an unbalanced training set.
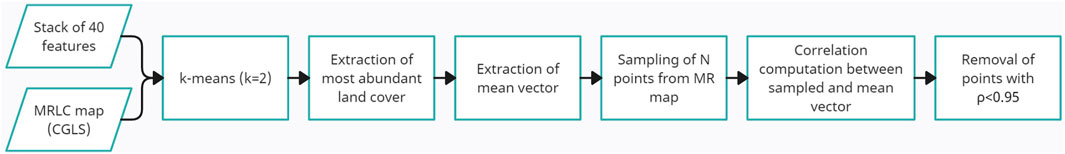
FIGURE 2. Block diagram of the training set generation procedure.
All these vectors are then reduced to a single vector by an element-wise mean. This mean vector is considered as the “representative” vector for that particular class. Finally, each of the extracted 4,000 feature vectors is compared with the representative vector by computing the Pearson correlation coefficient (ρ). Eventually, only the points with correlation ρ ≥ 0.95 are kept to be part of the final Random Forest training set for that class. This procedure is iterated for all the classes in the selected legend that are present in the region of interest according to the MRLC map.
3 Results and discussion
The entire workflow described in the previous Section was implemented leveraging the great computational power offered by Google Earth Engine, a powerful cloud computing platform aimed at processing and analysing huge amounts of remotely sensed data and GIS data in general.
To test it, as shown in Figure 3, four tiles were selected Siberia, Italy, Brazil and Africa (tiles 42WXS, 32TPP, 21KUQ and 37PCP respectively). Such selection was driven first of all by the need to evaluate the proposed approach in areas with very different land covers and climate typologies. Moreoever, these regions are those selected by the European Space Agency (ESA) “Climate Change Initiative Extension (CCI+) Phase 1: New Essential Climate Variables (NEW ECVS)” project.
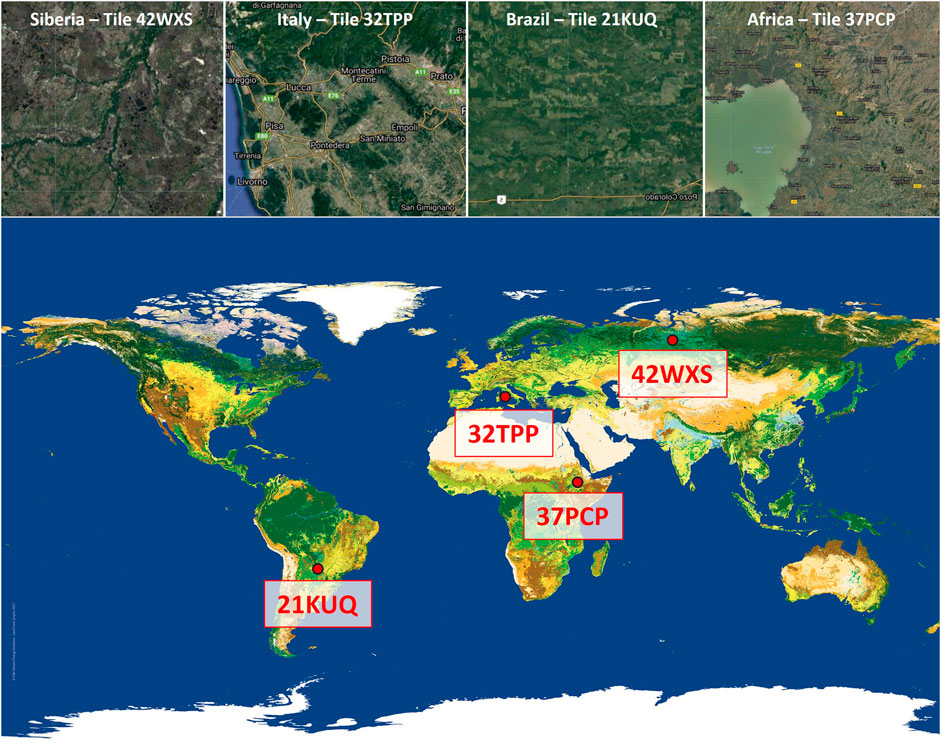
FIGURE 3. Thumbnails of the test sites used in this work. From left to right, Siberia (tile 42WXS), Italy (32TPP), Amazonia (21KUQ) and Africa (37PCP). Reproduced from Buchhorn et al.(2020), licensed under CC-BY 4.0. Maps Data: Google, ©2023 TerraMetrics
The Siberian region is dominated by very cold weather during the whole year, and this makes it a potential hot spot of future climate change studies. From a geomorphological point of view, the region is characterized by many rivers and water bodies, covered with ice and snow for around 75% of the year. In this area the advantage of using multitemporal SAR data is clear: SAR signals can penetrate clouds and rain, ensuring periodic data acquisitions.
The Brazilian tile is characterized by a dense vegetation layer, and has for several decades focused the attention of the climate change community due to large deforestation rates and potential associated large-scale climate impacts. This region is dominated by vegetation and hot tropical weather, and again represents a perfect example of SAR data usefulness: in fact, due to such harsh climate, it is very difficult to obtain cloud-free optical images over this area. Temperatures range from 22°C to 40°C, and the rainfall is persistent during most of the year, ranging from 200 to 320 mm every single month with an average of 89% of humidity.
Fog and haze are often present in the Italian region, and its morphology offers a wide variety of landscapes, such as mountainous and plain areas. This tile lies exactly in the middle of the Lombardy region, and is characterized by the so-called Mediterranean climate, with temperatures ranging from 20°C to 35°C during Summer (with the exception of the extreme hot temperatures reaching 45°C and severe drought registered during Summer 2022), and from −1–10°C in Winter.
Finally, the African tile is a very complex climatic region which experiences severe events often attributed to climate warming and for which the future predictions (amplitude of the regional warming and rainfall changes) are very uncertain. In the eastern part of the Sahelian band, the role of El Niño in the initiation of dramatic drought events in the horn of Africa is also not really understood and deserves more work to better predict and help mitigation studies. From a morphological point of view, this region is characterized by bare soil, lakes and croplands.
As mentioned above, these four different test sites were selected to assess the robustness of the proposed methodology in situations with very diverse environmental and climatic features.
For each case study, all the Sentinel-1 acquisitions covering at least 70% of the tile in 2019 are considered. This high overlap ratio is selected to avoid the use of images acquired from different orbits, therefore avoiding incidence angle issues affecting backscatter intensity and, consequently, the classification results (Tsyganskaya et al., 2018). This selection results into a collection of 29 SAR images for Siberia, 38 for Italy, 32 for Brazil and 25 for Africa. All the images are Interferometric Wide (IW), VV and VH descending orbit data sets.
Once all the features are computed as described in Section 2.2 and Section 2.3, the feature vectors were classified using the Random Forest (RF) classifier trained as mentioned above. The RF is a commonly used classifier for land cover classification due to its capability of being robust to the label noise, yielding high classification accuracy with a low sensitivity to the features selection (Tatsumi et al., 2015), an easy parametrization (Rodriguez-Galiano et al., 2012), and a low computational complexity (Pal, 2005). In addition, the choice of the user parameters selected for the RF classification is not very sensitive for the land cover classification of large areas (Mellor et al., 2015). The RF classifier consisted of 60 decision trees, a number of variables per split equal to the square root of the total number of input features, and the fraction of input for bagging (per tree) was set to 1/2 and each tree had a minimum leaf population equal to 1 (so that every new node has at least 1 point in its training set).
To validate the mapping results and provide a quantitative analysis, a total of 1350, 712, 1432 and 1709 High resolution (HR) validation points for Siberia, Italy, Brazil and Africa, respectively, were manually collected by experts in different institutions following a stratified random sampling procedure. This HR set was extracted by visual interpretation from multispectral and multitemporal 10 m spatial resolution Sentinel-2 data sets and/or Very High Resolution single date SPOT-6/7 images; when available, ground panoramic images were inspected as well. The spatial and class-wise distribution of the validation points for each test site is reported in Figure 4.
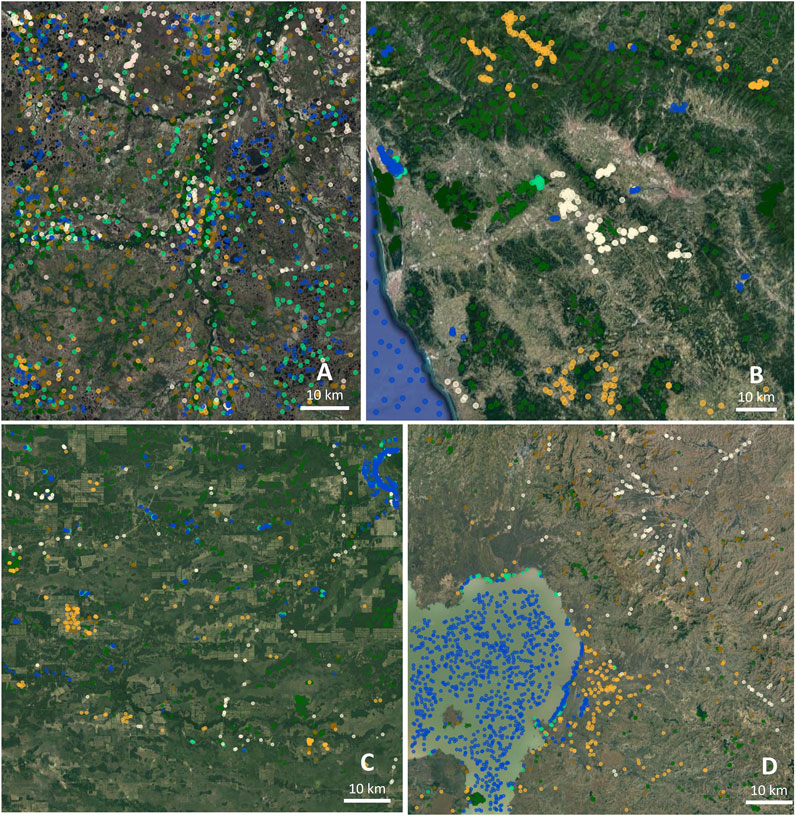
FIGURE 4. Spatial distribution of validation points in (A) Siberia, (B) Italy, (C) Brazil and (D) Africa (please refer to Table 1 for the class color legend). Reproduced from Buchhorn et al.(2020), licensed under CC-BY 4.0. Maps Data: Google, ©2023 TerraMetrics
Qualitative classification results are shown for the selected tiles in Figure 5. It is possible to note that the new land cover product (in the last column) offers a significantly increased spatial detail of the classes with respect to the MRLC map. In other words, the new product is coherent with the coarser CGLS map at 100 m, used to select training and sets, but improves its details. Please note that the black regions in the MRLC maps indicate areas labeled with mixed classes in the MR map, hence removed from this comparison.
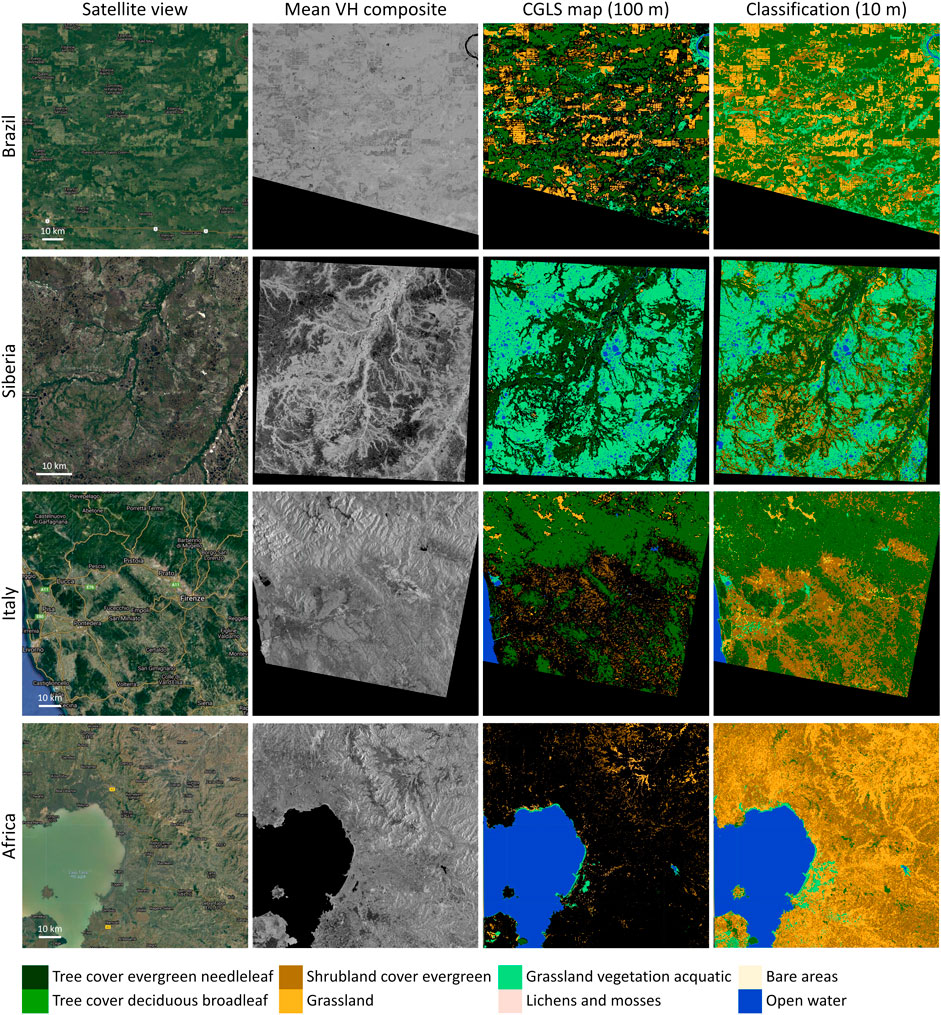
FIGURE 5. Qualitative results for the four test areas. Columns refer to 1) the Google Satellite basemap view, 2) the annual mean composite derived by all the VH-channel images, 3) the CGLS map at 100 m resolution and 4) our classification result at 10 m resolution. Reproduced from Buchhorn et al.(2020), licensed under CC-BY 4.0. Maps Data: Google, ©2023 TerraMetrics
To further appreciate the increased spatial resolution of the final product of the proposed procedure, in Figure 6 it is possible to observe the classification of a very small portion of each test site. The aim of this figure is to provide a qualitative comparison between the MRLC map used to train the RF classifier and the obtained result in areas which are significant. In particular, in the African HR map it is possible to observe the much more outlined area of aquatic vegetation surrounding the lake; also, small broad-leaved trees are now visible to the East of the scene. Regarding the Brazilian tile, lots of important spatial details are visible: small river branches, as well as the regular square-shaped regions, due to deforestation. In these areas, current grassland cover (yellow) replaced previous dense vegetation (green) zones. Whereas, in the Italian tile, the enhanced spatial resolution of the HR map highlights very small water bodies, surrounded by thin layers of grassland. Also, many agricultural fields boundaries are clearly distinguishable. Finally, looking at the Siberian tile, small water bodies and grassland areas are well visible and separated. Moreover, a large variety of land cover types emerge where the two river branches split, types that are invisible in the MR map.
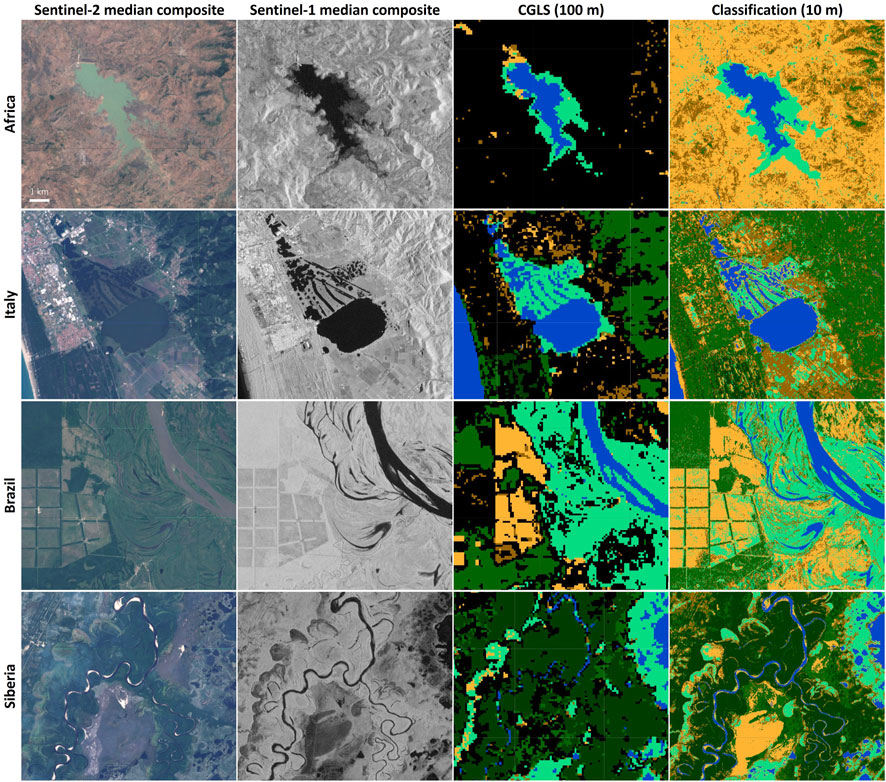
FIGURE 6. Small sample areas inside each test site. From left to right: the multispectral Sentinel-2 median image of each area, the Sentinel-1 SAR median image, the CGLS map at 100 m scale and the result of the proposed procedure at 10 m posting. The color legend is the same as in Figure 5. Reproduced from Buchhorn et al.(2020), licensed under CC-BY 4.0. Maps Data: Google, ©2023 TerraMetrics
Table 2 reports, finally, the quantitative analysis of the maps extracted in the four test areas, using the above mentioned manually extracted validation sets. For each tile and test site, this table shows the achieved overall accuracy (OA) and F1 score (F1) values together with the number of samples used to validate each class (px), as well as the corresponding precision (prec) and recall (recall) values for each class. These values were computed for both the original MRLC map used in this work (CGLS at 100 m resolution) and for the results of the proposed procedure (labeled “this paper” in the table).
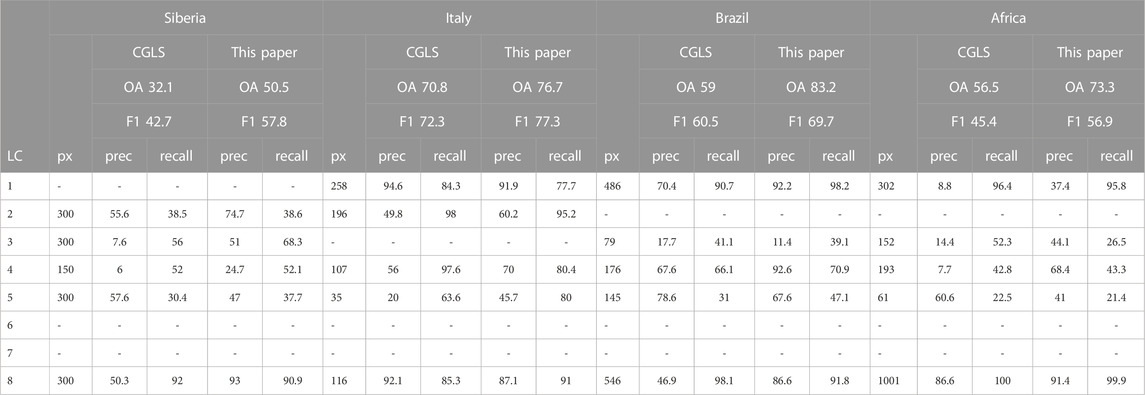
TABLE 2. Accuracy results for each selected test site using independently extracted high resolution validation points. The table reports the overall accuracy (OA) and F1 score (F1) values for the CGLS map and for the maps produced by the proposed procedure, the number of validation pixels per class (px), the class precision (prec) and recall (recall). Note: the symbol “-” means there are no MR points in that tile for a specific class.
A very clear take away message from these numbers is that the proposed methodology allows to achieve significantly higher accuracy values on the independent HR validation set than the CGLS map. This increment is equal to 18.4% for Siberia, 5.9% for Italy, 24.2% for Brazil and 16.8% for Africa. The improvement can be also appreciated by the F1 score, with the increment of 15.1% for Siberia, 5% for Italy, 9.2% for Brazil and 11.5% for Africa. Despite the MR map was obtained using multispectral data and the new result is based only on SAR data, the SAR-base methodology achieves better results thanks to the exploitation of spatio-temporal features and to the intelligent training point selection procedure.
Please note that the numbers in Table 2 refer to one specific result of the procedure, because the first step for training point selection is a random extraction of points from the MRLC map. To understand the impact of this random seed, the procedure was repeated a number of times, and it was found that the overall accuracy values are stable, with very small standard deviations within the range [0.5–1]%.
Finally, to understand the source of the classification errors, Figure 7 depicts the mean feature value vectors for the training set of each class in each considered region. Although only the average behaviour per class is shown, it is clear that, apart from water, all the vegetated land covers have a similar pattern. Still, the small differences are enough to enable a decent discrimination of the different land cover classes. Based on the HR validation points - independently extracted by experts - the produced land cover maps appear to be very promising, except than for Siberia. As a matter of fact, discriminating classes in Siberia is complicated by the long cold season during which the soil is covered with snow and ice. These harsh conditions effectively reduce the amount of multitemporal SAR images useful to discriminate among different land cover types. Still, the proposed methodology achieves good results for specific land covers (for instance, the producer accuracy for shrublands increases by 43% with respect to the MRLC map).
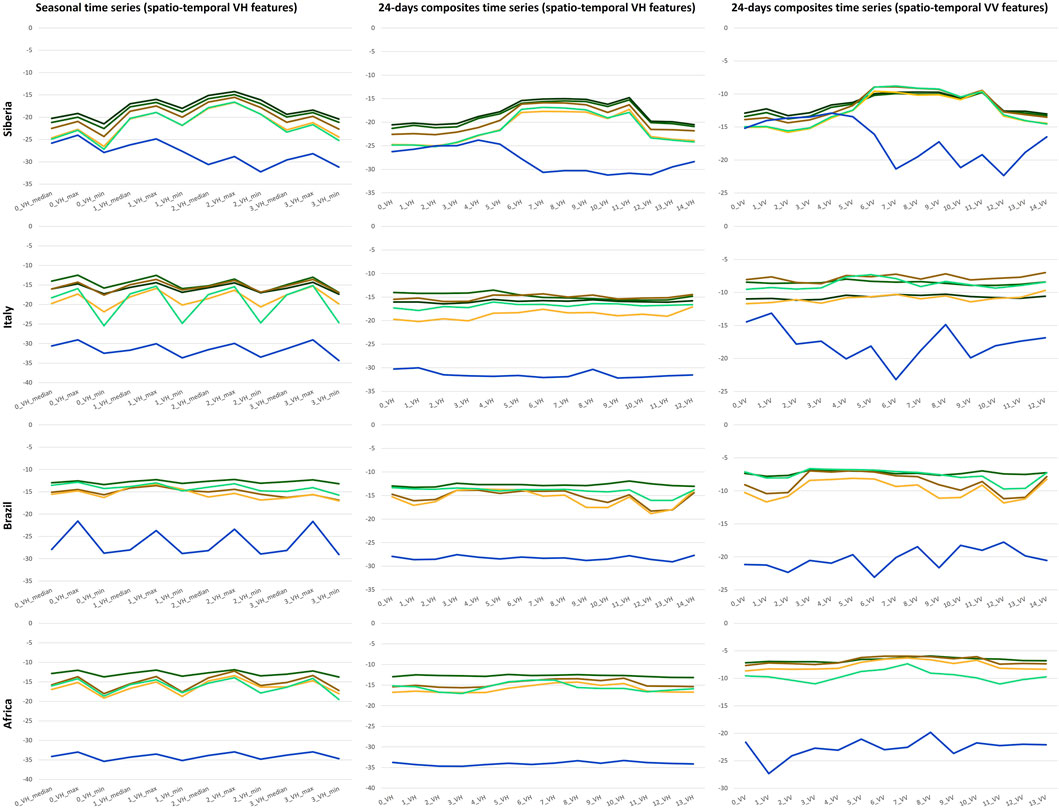
FIGURE 7. Mean feature vector values for each class in each test site (class color legend as in Table 1).
The presented research on land cover mapping using multitemporal Sentinel-1 SAR data has several notable strengths. These strong points highlight the novelty and significance of the proposed methodology and its potential implications for global land use mapping, especially with respect to vegetation classes. First and foremost, the developed methodology effectively processes multitemporal SAR data to derive spatio-temporal features that capture the temporal patterns of various land cover classes. This innovative approach has not been tried before for SAR data and provides a comprehensive understanding of vegetation dynamics over time, enabling eventually a more accurate and detailed land cover mapping. Another key strength lies in the efficient selection of training points from an existing Medium Resolution Land Cover (MRLC) map. By strategically choosing representative training points, the methodology ensures the quality and reliability of the training data, thereby enhancing the classification results. This intelligent selection process stands as a notable improvement over previous studies that rely on alternative methods for training point selection. Furthermore, this research addresses the challenges associated with mapping land cover sequences using radar data only; by focusing on the utilization of Sentinel-1 SAR time series and considering the compatibility with other sensors, this study presents a valuable contribution to the field. The possibility to exchange the multispectral features of optical sensors with the multitemporal ones of SAR sequences have not been considered so far. The extensive experimentation carried out on four distinct regions (Siberia, Italy, Brazil, and Africa) demonstrates the robustness and generalizability of the proposed methodology across diverse climate environments. The qualitative and quantitative results validate the effectiveness and potential of multitemporal SAR sequences for land cover mapping, showcasing an improvement in overall accuracy and F1 score compared to existing global products.To summarize, by addressing critical research gaps in global land cover mapping using SAR data only, this research makes a significant contribution to the existing scientific literature. It offers a novel methodology that combines multitemporal SAR data processing and smart training point selection. The outcomes of this study open new avenues for vegetation mapping on a global scale, leveraging the capabilities of Sentinel-1 SAR data and paving the way for further advancements in the field. The strong points of this research lie in its innovative methodology, the intelligent selection of training points, the tackling of challenges related to complex land cover class recognition mapping using only multitemporal SAR data, and the extensive validation in diverse climatic regions. All these strengths together highlight the novelty, significance, and potential impact of this study on land cover mapping using existing SAR systems in other bands (e.g., COSMO-SkyMed and SAOCOM).
3.1 Limitations and future developments
However, there are some limitations to consider about the proposed metodology. The first point is the use of a more recent land cover map free available for the extraction of the training points, such as the European Space Agency (ESA) WorldCover 10 m 2021 product, which provides a global land cover map for 2021 at 10 m resolution based on Sentinel-1 and Sentinel-2 data (Zanaga et al., 2022). The WorldCover product comes with 11 land cover classes, aligned with UN-FAO’s Land Cover Classification System, and has been generated in the framework of the ESA WorldCover project, part of the 5th Earth Observation Envelope Programme (EOEP-5) of the European Space Agency. The ESA WorldCover 10 m 2021 v200 product updates the existing ESA WorldCover 10 m 2020 v100 product to 2021 but is produced using an improved algorithm version (v200) compared to the 2020 map. Consequently, since the WorldCover maps for 2020 and 2021 were generated with different algorithm versions (v100 and v200, respectively), changes between the maps should be treated with caution, as they include both real changes in land cover and changes due to the algorithms used.
The ESA WorldCover product has been independently validated by Wageningen University (statistical accuracy) and the International Institute for Applied Systems Analysis (IIASA) (spatial accuracy). The WorldCover 2021 v200 reaches an overall accuracy of 76.7% (Zanaga et al., 2022).
Another limitation could be reached in the availability of the SAR data over critical areas of interest. In Siberia, for example, the Sentinel-1 data do not present a good spatial and temporal coverage for all the year. The major issue is related to the coverage over a far more extended area, since is not uniform, and may generate misclassification effects. For this reason, an adapted strategy for the features extraction in this region could foresee to consider just the features computed over a single “season” (not four) to achieve results for a larger set of tiles and considering a much more homogeneous data set.
Operational land cover map production over large areas cannot rely on field campaigns because huge amounts of costly data have to be collected, most importantly jeopardising the timeliness of the land cover map. The existing land cover products represent a valid source of information, but an improved could be to generate ground reference data to model more complex classes which require reliable samples that cannot be extracted from outdated coarse thematic products.In order to generate the training set to be used for the supervised classification of the considered study areas, the photo-interpretation could be a way to follow. Although extremely complex and time consuming the photo-interpreted reference data could be allow the production of high quality training points which matches the definition of the legend and corresponds to the exact same time frame. To properly generate a representative training set for each specific area the label of each sample could be defined by visual interpretation of high-resolution satellites images. It is a method very effective for achieving a powerful land cover recognition, which however requires an unbearable cost because of the manual extraction.
In the future we intend to perform classification methods able to identify different classes (as water, urban areas, cropland) with a proper combination of features sets, alongside multitemporal approach and RF classification. The aim is improving classification performance using features that are highly beneficial to diversify classes with different surface roughness, in order to achieve better classification accuracy.
4 Conclusion
This work has shown that it is possible to obtain a significant land cover map in different parts of the world using a year-long sequence of Sentinel-1 data. Although SAR data has been very seldom considered for land cover classification in wide areas, in this work the exploitation of temporal patterns increases the possibility to discriminate among different land covers, because it allows distinguishing their periodic growth and development phenomena over the course of a year. Accordingly, very encouraging results has been obtained in four very different geographical locations, with very different environments and land covers. These results are a first step towards the possibility to obtain a global land cover map using SAR only. More studies are required to consider the role of polarimetric measurements and phase (in addition to intensity) information. There are studies showing that both are important, and temporal sequences have been used already, but only for a very limited set of crops, and without the idea to obtain a methodology working everywhere. This research aims to fully exploit the potential of year-long multitemporal SAR sequences.
Additionally, it is important to note that the proposed methodology has also introduced an approach to automatically select training sets for high resolution mapping starting from existing medium resolution land cover maps. The novel approach aims at reducing possible outliers and at training a better classification model than just considering a random selection of the points in existing maps. On average, the new methodology obtained good results, increasing the overall accuracy by 16% with respect to medium resolution existing land cover map. This is particularly encouraging because these maps were obtained considering multispectral data. The substitution of multispectral measurements at a few dates with radar backscattering in a dense temporal sequence is the key for this improved result.
Data availability statement
The raw data supporting the conclusion of this article will be made available by the authors, without undue reservation.
Author contributions
DM and PG developed the proposed methodology, DM implemented the algorithm and realized the software. DM, AS, and PG analyzed the results, DM and AS wrote the present paper and PG supervised and optimized the whole workflow to improve the clarity of the document. All authors contributed to the article and approved the submitted version.
Acknowledgments
The authors would like to thank Prof. Bruzzone and his team at the University of Trento for providing the HR validation set for the Brazilian test area, as well as Prof. Serpico and his team at the University of Genoa for providing the HR validation site for the African test set. The work has been carried out in the framework of the ESA project “Climate Change Initiative Extension (CCI+) Phase 1: New Essential Climate Variables (NEW ECVS)”.
Conflict of interest
The authors declare that the research was conducted in the absence of any commercial or financial relationships that could be construed as a potential conflict of interest.
Publisher’s note
All claims expressed in this article are solely those of the authors and do not necessarily represent those of their affiliated organizations, or those of the publisher, the editors and the reviewers. Any product that may be evaluated in this article, or claim that may be made by its manufacturer, is not guaranteed or endorsed by the publisher.
Footnotes
1https://scihub.copernicus.eu/
2http://due.esrin.esa.int/page_globcover.php
3https://sentinel.esa.int/web/sentinel/missions/sentinel-2/data-products
4https://developers.google.com/earth-engine/guides/sentinel1#metadata-and-filtering
References
Abdikan, S., Sanli, F. B., Ustuner, M., and Calò, F. (2016). Land cover mapping using sentinel-1 sar data. Int. Archives Photogrammetry, Remote Sens. Spatial Inf. Sci. 41, 757–761. doi:10.5194/isprsarchives-xli-b7-757-2016
Adugna, T., Xu, W., and Fan, J. (2022). Comparison of random forest and support vector machine classifiers for regional land cover mapping using coarse resolution fy-3c images. Remote Sens. 14, 574. doi:10.3390/rs14030574
Balzter, H., Cole, B., Thiel, C., and Schmullius, C. (2015). Mapping corine land cover from sentinel-1a sar and srtm digital elevation model data using random forests. Remote Sens. 7, 14876–14898. doi:10.3390/rs71114876
Buchhorn, M., Lesiv, M., Tsendbazar, N. E., Herold, M., Bertels, L., and Smets, B. (2020). Copernicus global land cover layers—collection 2. Remote Sens. 12, 1044. doi:10.3390/rs12061044
Chabalala, Y., Adam, E., and Ali, K. A. (2022). Machine learning classification of fused sentinel-1 and sentinel-2 image data towards mapping fruit plantations in highly heterogenous landscapes. Remote Sens. 14, 2621. doi:10.3390/rs14112621
d’Andrimont, R., Verhegghen, A., Lemoine, G., Kempeneers, P., Meroni, M., and Van der Velde, M. (2021). From parcel to continental scale–a first european crop type map based on sentinel-1 and lucas copernicus in-situ observations. Remote Sens. Environ. 266, 112708. doi:10.1016/j.rse.2021.112708
Esch, T., Bachofer, F., Heldens, W., Hirner, A., Marconcini, M., Palacios-Lopez, D., et al. (2018). Where we live—a summary of the achievements and planned evolution of the global urban footprint. Remote Sens. 10, 895. doi:10.3390/rs10060895
Fernando, S., and Shariff, N. M. (2015). The relationship between land use/land cover change and factors for ecotourism development in the partial nature based wetland using remote sensing and gis techniques. Int. J. Sci. Res. Innovative Technol. 2, 82–93.
Folleco, A., Khoshgoftaar, T. M., Van Hulse, J., and Bullard, L. (2008). “Software quality modeling: the impact of class noise on the random forest classifier,” in 2008 IEEE congress on evolutionary computation (IEEE world congress on computational intelligence), Hong Kong, China, 01-06 June 2008 (IEEE), 3853–3859.
Gašparović, M., and Dobrinić, D. (2020). Comparative assessment of machine learning methods for urban vegetation mapping using multitemporal sentinel-1 imagery. Remote Sens. 12, 1952. doi:10.3390/rs12121952
Gorelick, N., Hancher, M., Dixon, M., Ilyushchenko, S., Thau, D., and Moore, R. (2017). Google earth engine: planetary-scale geospatial analysis for everyone. Remote Sens. Environ. 202, 18–27. doi:10.1016/j.rse.2017.06.031
Hamrouni, Y., Paillassa, E., Chéret, V., Monteil, C., and Sheeren, D. (2021). From local to global: a transfer learning-based approach for mapping poplar plantations at national scale using Sentinel-2. ISPRS J. Photogrammetry Remote Sens. 171, 76–100. doi:10.1016/j.isprsjprs.2020.10.018
He, T., and Wang, S. (2020). Multi-spectral remote sensing land-cover classification based on deep learning methods. J. Supercomput. 77, 2829–2843. doi:10.1007/s11227-020-03377-w
Huang, W., DeVries, B., Huang, C., Lang, M. W., Jones, J. W., Creed, I. F., et al. (2018). Automated extraction of surface water extent from sentinel-1 data. Remote Sens. 10, 797. doi:10.3390/rs10050797
Inglada, J., Vincent, A., Arias, M., Tardy, B., Morin, D., and Rodes, I. (2017). Operational high resolution land cover map production at the country scale using satellite image time series. Remote Sens. 9, 95. doi:10.3390/rs9010095
Jacob, A. W., Vicente-Guijalba, F., Lopez-Martinez, C., Lopez-Sanchez, J. M., Litzinger, M., Kristen, H., et al. (2020). Sentinel-1 InSAR coherence for land cover mapping: a comparison of multiple feature-based classifiers. IEEE J. Sel. Top. Appl. Earth Observations Remote Sens. 13, 535–552. doi:10.1109/jstars.2019.2958847
Jeon, H., Kim, D. J., and Kim, J. (2021). “Water body detection using deep learning with sentinel-1 sar satellite data and land cover maps,” in 2021 IEEE International Geoscience and Remote Sensing Symposium IGARSS, Brussels, Belgium, 11-16 July 2021 (IEEE), 8495–8498. doi:10.1109/IGARSS47720.2021.9553555
Khabbazan, S., Vermunt, P., Steele-Dunne, S., Ratering Arntz, L., Marinetti, C., van der Valk, D., et al. (2019). Crop monitoring using Sentinel-1 data: a case study from The Netherlands. Remote Sens. 11, 1887. doi:10.3390/rs11161887
Marzi, D., and Gamba, P. (2020). “Global vegetation mapping for ESA climate change initiative project leveraging multitemporal high resolution sentinel-1 SAR data,” in IGARSS 2020-2020 IEEE International Geoscience and Remote Sensing Symposium, Waikoloa, HI, USA, 17 February 2021 (IEEE), 4791–4794.
Marzi, D., Sorriso, A., Dell’Acqua, F., and Gamba, P. (2022). “Heterogeneous sar sequence processing for land cover mapping,” in IGARSS 2022-2022 IEEE International Geoscience and Remote Sensing Symposium, Kuala Lumpur, Malaysia, 17-22 July 2022 (IEEE), 5172–5175.
Mellor, A., Boukir, S., Haywood, A., and Jones, S. (2015). Exploring issues of training data imbalance and mislabelling on random forest performance for large area land cover classification using the ensemble margin. ISPRS J. Photogrammetry Remote Sens. 105, 155–168. doi:10.1016/j.isprsjprs.2015.03.014
Ngo, K. D., Lechner, A. M., and Vu, T. T. (2020). Land cover mapping of the Mekong Delta to support natural resource management with multi-temporal Sentinel-1A synthetic aperture radar imagery. Remote Sens. Appl. Soc. Environ. 17, 100272. doi:10.1016/j.rsase.2019.100272
Orlíková, L., and Horák, J. (2019). “Land cover classification using sentinel-1 sar data,” in 2019 international conference on military technologies (ICMT), Brno, Czech Republic, 30-31 May 2019 (IEEE), 1–5.
Pal, M. (2005). Random forest classifier for remote sensing classification. Int. J. remote Sens. 26, 217–222. doi:10.1080/01431160412331269698
Paris, C., Bruzzone, L., and Fernández-Prieto, D. (2019). A novel approach to the unsupervised update of land-cover maps by classification of time series of multispectral images. IEEE Trans. Geoscience Remote Sens. 57, 4259–4277. doi:10.1109/tgrs.2018.2890404
Paul, S., Kumari, M., Murthy, C., and Nagesh Kumar, D. (2022). Generating pre-harvest crop maps by applying convolutional neural network on multi-temporal sentinel-1 data. Int. J. Remote Sens. 43, 6078–6101. doi:10.1080/01431161.2022.2030072
Prudente, V. H., Sanches, I., Adami, M., Skakun, S., Oldoni, L. V., Xaud, H. A. M., et al. (2020). “Sar data for land use land cover classification in a tropical region with frequent cloud cover,” in IGARSS 2020-2020 IEEE International Geoscience and Remote Sensing Symposium, Waikoloa, HI, USA, 26 September 2020 - 02 October 2020 (IEEE), 4100–4103.
Radoux, J., Lamarche, C., Van Bogaert, E., Bontemps, S., Brockmann, C., and Defourny, P. (2014). Automated training sample extraction for global land cover mapping. Remote Sens. 6, 3965–3987. doi:10.3390/rs6053965
Rodriguez-Galiano, V. F., Ghimire, B., Rogan, J., Chica-Olmo, M., and Rigol-Sanchez, J. P. (2012). An assessment of the effectiveness of a random forest classifier for land-cover classification. ISPRS J. photogrammetry remote Sens. 67, 93–104. doi:10.1016/j.isprsjprs.2011.11.002
Santoro, M., and Wegmüller, U. (2012). “Multi-temporal SAR metrics applied to map water bodies,” in 2012 IEEE International Geoscience and Remote Sensing Symposium, Munich, Germany, 22-27 July 2012 (IEEE), 5230–5233.
Shimada, M., Itoh, T., Motooka, T., Watanabe, M., Shiraishi, T., Thapa, R., et al. (2014). New global forest/non-forest maps from ALOS PALSAR data (2007–2010). Remote Sens. Environ. 155, 13–31. doi:10.1016/j.rse.2014.04.014
Sorriso, A., Marzi, D., and Gamba, P. (2021). “A general land cover classification framework for sentinel-1 sar data,” in 2021 IEEE 6th International Forum on Research and Technology for Society and Industry (RTSI), Naples, Italy, 06-09 September 2021 (IEEE), 211–216.
Tatsumi, K., Yamashiki, Y., Torres, M. A. C., and Taipe, C. L. R. (2015). Crop classification of upland fields using random forest of time-series landsat 7 etm+ data. Comput. Electron. Agric. 115, 171–179. doi:10.1016/j.compag.2015.05.001
Tsokas, A., Rysz, M., Pardalos, P. M., and Dipple, K. (2022). Sar data applications in earth observation: an overview. Expert Syst. Appl. 205, 117342. doi:10.1016/j.eswa.2022.117342
Tsyganskaya, V., Martinis, S., Marzahn, P., and Ludwig, R. (2018). SAR-based detection of flooded vegetation–a review of characteristics and approaches. Int. J. remote Sens. 39, 2255–2293. doi:10.1080/01431161.2017.1420938
Vollrath, A., Mullissa, A., and Reiche, J. (2020). Angular-based radiometric slope correction for Sentinel-1 on google earth engine. Remote Sens. 12, 1867. doi:10.3390/rs12111867
Wenger, R., Puissant, A., Weber, J., Idoumghar, L., and Forestier, G. (2022). Multisenge: a multimodal and multitemporal benchmark dataset for land use/land cover remote sensing applications. ISPRS Ann. Photogrammetry, Remote Sens. Spatial Inf. Sci. 2022, 635–640. doi:10.5194/isprs-annals-v-3-2022-635-2022
Witten, Ian H., Frank, Eibe., Hall, Mark A., and Pal, Christopher J. (2017). Practical machine learning tools and techniques. Data mining. 4th EdnElsevier.
Yokoya, N., Ghamisi, P., Xia, J., Sukhanov, S., Heremans, R., Tankoyeu, I., et al. (2018). Open data for global multimodal land use classification: outcome of the 2017 ieee grss data fusion contest. IEEE J. Sel. Top. Appl. Earth Observations Remote Sens. 11, 1363–1377. doi:10.1109/jstars.2018.2799698
Zanaga, D., Van De Kerchove, R., Daems, D., De Keersmaecker, W., Brockmann, C., Kirches, G., et al. (2022). Esa worldcover 10 m 2021 v200. Zenodo. doi:10.5281/zenodo.7254221
Keywords: multitemporal SAR sequences, Sentinel-1, wide area land cover mapping, climate change, random forest
Citation: Marzi D, Sorriso A and Gamba P (2023) Automatic wide area land cover mapping using Sentinel-1 multitemporal data. Front. Remote Sens. 4:1148328. doi: 10.3389/frsen.2023.1148328
Received: 19 January 2023; Accepted: 31 October 2023;
Published: 05 December 2023.
Edited by:
Mustafa Ustuner, Artvin Coruh University, TürkiyeCopyright © 2023 Marzi, Sorriso and Gamba. This is an open-access article distributed under the terms of the Creative Commons Attribution License (CC BY). The use, distribution or reproduction in other forums is permitted, provided the original author(s) and the copyright owner(s) are credited and that the original publication in this journal is cited, in accordance with accepted academic practice. No use, distribution or reproduction is permitted which does not comply with these terms.
*Correspondence: David Marzi, david.marzi01@universitadipavia.it