Solar-Terrestrial Data Science: Prior Experience and Future Prospects
 Daniel N. Baker
- Laboratory for Atmospheric and Space Physics, University of Colorado Boulder, Boulder, CO, United States
Acquisition of relatively large data sets based on measurements in the interplanetary medium, throughout Earth's magnetosphere, and from ground-based platforms has been a hallmark of the heliophysics discipline for several decades. Early methods of time series analysis with such datasets revealed key causal physical relationships and led to successful forecast models of magnetospheric substorms and geomagnetic storms. Applying neural network methods and linear prediction filtering approaches provided tremendous insights into how solar wind-magnetosphere-ionosphere coupling worked under various forcing conditions. Some applications of neural net and related methods were viewed askance in earlier times because it was not obvious how to extract or infer the underlying physics of input-output relationships. Today, there are powerful new methods being developed in the data sciences that harken back to earlier successful specification and forecasting methods. This paper reviews briefly earlier work and looks at new prospects for heliophysics prediction methods.
Introduction
Modern information and communication technologies have created an interoperable era in which access to data can be essentially universal. Open access to these data and related services enables the research and applications community to meet new challenges of understanding Earth and its space environment (Baker, 2008). Given the complex system, understanding the Earth and near-Earth space requires managing and accessing large data sets. It also requires acquisition of progressively higher spatial and temporal resolution measurements. In the modern era, there is particular need for very rapid (near real-time) response modalities. In many instances, acquired data must be assimilated into empirical or physics-based models. Such work often requires crossing of disciplinary boundaries in order to achieve the ultimate research and applications goals.
Traditionally, science has been viewed as being based on two fundamental pillars: Experimentation (i.e., observations) and theory. In the past century or so, computational methods and related modeling have been added as an essential pillar of basic science. In fact, most domains of science today could simply not be viable without the availability of computational modeling. In recent times, it has been further recognized that “informatics” —the science of processing data for storage and retrieval—is an indispensable fourth pillar of modern science (Baker et al., 2008). Thus, for the present-day purposes of understanding and predicting the behavior of the coupled Sun-Earth system, information science is as much a key foundation as are the more traditional elements of science (see Figure 1).
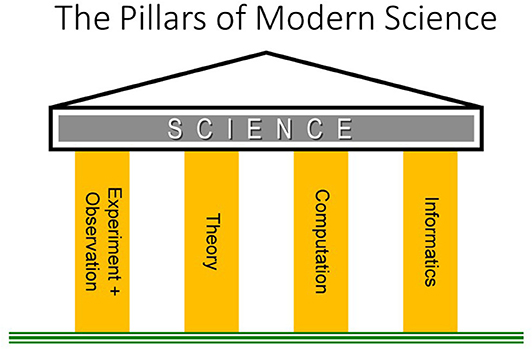
Figure 1. The pillars supporting basic science have long been considered to be experimental observations and theory. In more recent times, computation has also been an integral part of most scientific disciplines. Today, informatics (that bridges between information and communication technology on the one hand and the use of digital data on the other) must also be considered as a fundamental pillar of the science enterprise (From Baker et al., 2008).
In this brief review, the goal is to use the coupled solar wind-magnetosphere-ionosphere system to illustrate the application and utilization of various data analysis methods. Many topics to be discussed were based on time series analysis and prediction filter methods. This work led naturally to the understanding that the magnetosphere-ionosphere system often evolves toward highly non-linear states that must be examined carefully. Methods employed decades ago have now become quite relevant again in the present era of machine learning. Appreciation of the roots of solar-terrestrial data science are important looking toward the future.
The Driven Magnetosphere-Ionosphere System
Figure 2 is a schematic diagram of the Earth's magnetosphere and some of its key plasma physical regions. The diagram also illustrates the external solar wind flow and many of the large-scale current systems that shape the overall magnetospheric cavity. From this picture, we see that the Earth's magnetosphere-ionosphere system is a large, highly-coupled plasma domain. In its ground state, the magnetosphere is characterized by a relatively stable configuration standing off the solar wind at ~12 RE (Earth radii) at its sub-solar point. It extends into an elongated magnetotail on the nightside. The basic steady-state relationship with the interplanetary magnetic field (denoted BIMF) during quiet times gives rise to a coherent global structure with persistent boundary features.
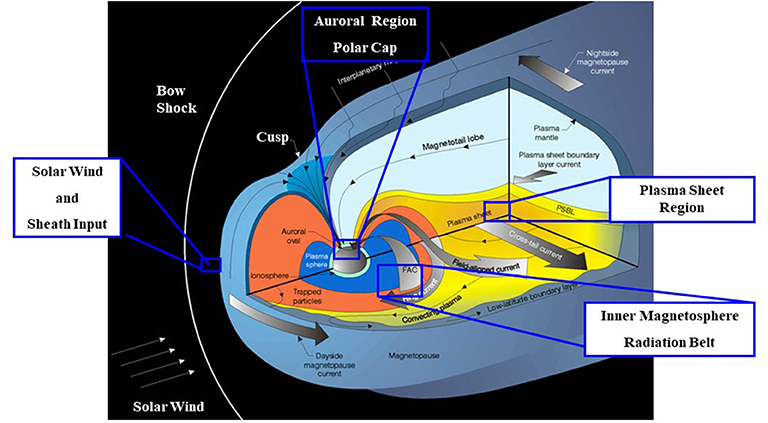
Figure 2. A schematic design showing the overall structure of Earth's magnetosphere and some of the key plasma regions and current systems comprising the geospace domain.
As the solar wind impinging on the magnetosphere changes velocity or density and, notably, when the IMF changes magnitude or direction, the magnetosphere undergoes substantial evolution. The size of the magnetospheric cavity changes, strong ionospheric currents are set up, and large configurational changes can be seen throughout the magnetotail. The elemental and repeatable sequence of events that occurs starts with a southward turning of the interplanetary magnetic field. This causes enhanced coupling from the solar wind into the magnetosphere.
Figure 3 shows the commonly accepted picture of the resulting magnetospheric substorm sequence (Baker et al., 1993, 1996). Figure 3A shows a cross-sectional view of the magnetotail and illustrates its relaxed or quiescent state. The plasma sheet is rather thick and there is little excess “free energy” in the system. Figure 3B shows the magnetotail as the interplanetary field has turned southward and a large amount of magnetic energy has been added to the tail. This growth phase is characterized by considerable excess stored energy in the magnetotail lobes and a thin, stressed plasma sheet. Finally, in Figure 3C we show the explosive onset of near-Earth magnetic reconnection (x-line formation) which gives rise to a plasmoid that pinches off and leaves the system. This entire sequence constitutes a magnetic “loading-unloading” system. As such, it can be modeled using non-linear dynamic methods (Sharma et al., 2005) in analogy with concepts developed in statistical physics and in branches of applied mathematics.
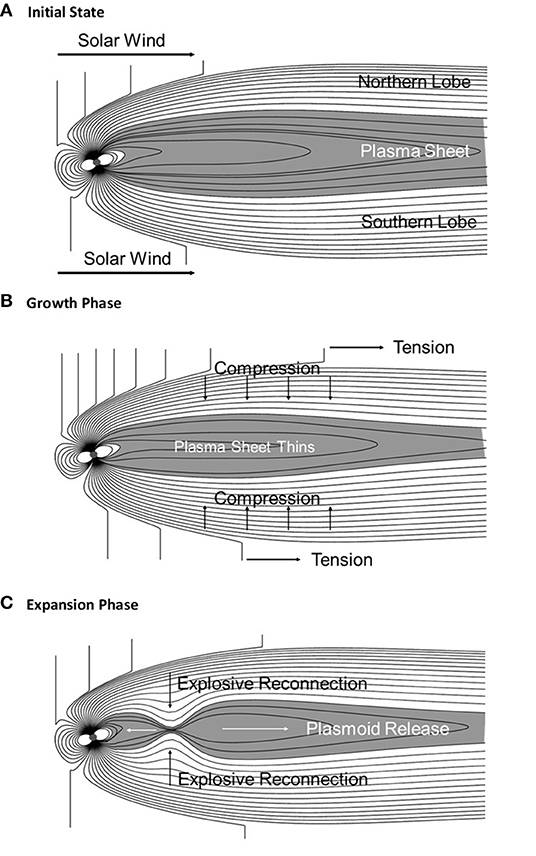
Figure 3. Cross-sectional views of the Earth's magnetosphere showing the solar wind interaction and dynamical evolution. (A) The quiet time or “ground state” configuration showing weak solar wind energy coupling to the magnetosphere. (B) The growth phase of the magnetospheric substorm showing increased solar wind energy coupling (due to dayside magnetic reconnection) and a plasma sheet thinning on the nightside. (C) Explosive reconnection at a near-Earth magnetic neutral line in the plasma sheet and plasmoid formation at substorm onset.
The magnetospheric energy unloading process early on was considered to be analogous to a dripping faucet (Hones, 1979) (see Figure 4): The plasma sheet in the magnetotail distends as part of the substorm growth phase. Then a portion of the plasma sheet pinches off to form the separated plasmoid at substorm onset. The plasmoid moves tailward and leaves the magnetotail and the Earthward part of the plasma sheet snaps back toward the Earth, in analogy with a dripping faucet.

Figure 4. An illustration of the analogy between a dripping faucet and the formation of large-scale plasmoid in Earth's magnetotail during a magnetospheric substorm (from Hones, 1979). This concept has been extended to develop non-linear analog models of substorms.
Figure 5 illustrates conceptually the steps of the solar wind-magnetosphere coupling process. Basically, the coupling effects are controlled by the dawn-to-dusk component of the interplanetary electric field ESW (=-VSW × BIMF) with VSW the solar wind speed. Therefore, taking into account this “rectifier” effect, many studies have shown that the main parameter driving substorms is the solar wind speed (VSW) multiplied by the southward IMF component (Bs) (Bs = –BIMF for BIMF < 0, and Bs = 0 for BIMF > 0). Changing of VBS (=VswBs) causes variations in the dayside magnetic merging rate. As shown by Figure 5, this change in dayside reconnection directly drives ionospheric currents which show up in the auroral electrojet (AE) indices. The westward electrojet (AL) index is particularly indicative of the coupling process (Baker et al., 1996).
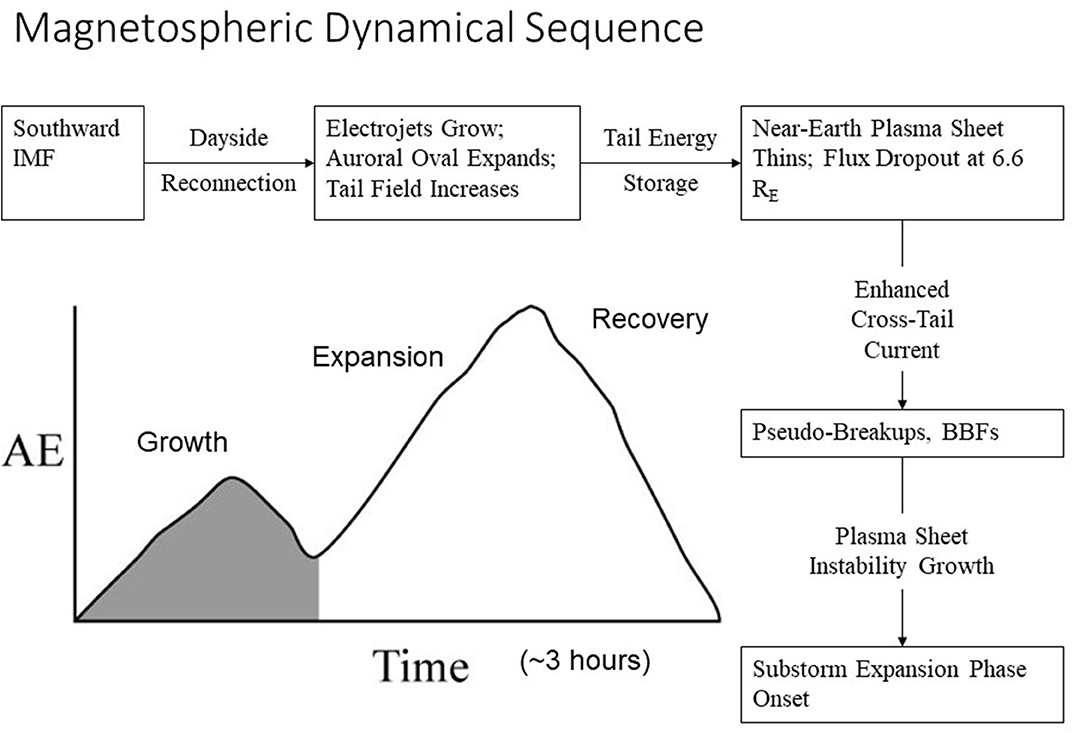
Figure 5. A notational sketch of an isolated substorm as seen in a time series of auroral electrojet (AE) values vs. time. The boxes in the flow chart around this schematic describe the key, repeatable physical phenomena occurring during substorms. BBFs are bursty bulk flows of plasma. These are localized, high-speed particle transport regions.
As energy is transferred to the magnetosphere, merged flux is transported from the dayside to the nightside. This leads to enhanced magnetotail flux and enhanced convection from the distant x-line toward the Earth. The addition of tail flux is indicative of an intensification of the cross-tail electrical currents flowing in the plasma sheet. After about 1 h of tail flux loading, (i.e., a 1-h substorm growth phase) there normally is a substorm expansion phase onset. In the near-Earth neutral line (NENL) model of substorms (Baker et al., 1996), the expansion phase onset is produced by the sudden appearance of a new x-line which causes strong magnetic reconnection in the relatively near-Earth portion of the plasma sheet. The reconnection process and the accompanying cross-tail current disruption drives further flow of currents through the nightside ionosphere to form the “unloading” currents. These energy-dissipation processes show up prominently in the AE index.
It is worth noting that there can be many variants of substorm-like activity in the magnetosphere. There can be so-called steady convection events and other energy dissipation events that may not clearly exhibit all the “phases” noted above (see Shukhtina et al., 2014). Nonetheless, the basic pattern of energy loading, rapid energy dissipation, and relaxation back toward a ground state seems clearly established in many cases. Obviously, there is great value in examining events that depart from the classic pattern.
The energy flow from the solar wind through the magnetosphere into the ionosphere has been addressed in terms of a global-scale convection process. This has been modeled in terms of linear filter relationship between VBS as an input time series and AL as a magnetospheric output time series (Blanchard and McPherron, 1992). As shown here in Figure 6, the transfer (or filter) function g(t) can be viewed as a general linear relationship between the solar wind driver and the magnetospheric response (Bargatze et al., 1985). When many different intervals of geomagnetic disturbance were considered, Bargatze et al. (1985) found that periods of weak or moderate disturbances showed linear response filters with two peaks (Figure 7). These were interpreted as the directly-driven response (at 20-min lag time) and the unloading response (at 60-min lag). During high geomagnetic activity periods, the 60-min response peak was seen to disappear or even to merge into the 20-min peak. This was interpreted by Baker et al. (1990a) as evidence of a non-linear evolution of geomagnetic activity as the system moved from weak to strong disturbance levels.
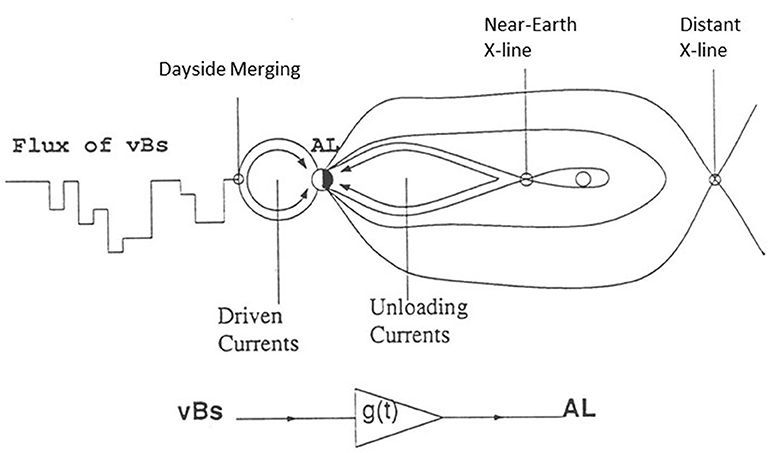
Figure 6. The response of the magnetosphere to the solar wind IMF. In this diagram, the global configuration and magnetic topology are shown and currents are illustrated. The magnetosphere is treated as a linear filter relating VBS to AL (adapted from Blanchard and McPherron, 1992).
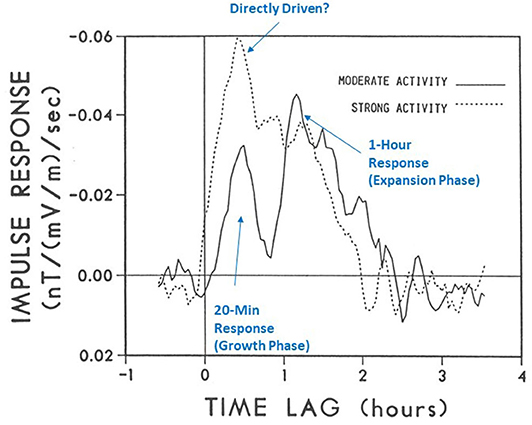
Figure 7. A pair of linear prediction filters (or impulse response curves) showing the time-lagged response between the interplanetary electric field (VBS) and the AL geomagnetic activity index. The linear prediction filters are chosen for a weak average activity interval and a strong activity period. An evolution from double-peaked (bimodal) filter to single-peaked filter suggests a non-linear dynamical behavior of magnetospheric activity (adapted from Bargatze et al., 1985).
Low-Dimensional Analog Models
Taking into account observed evolution of linear prediction filters with increasing geomagnetic activity (Bargatze et al., 1985), Baker et al. (1990a) developed a mechanical analog model of substorm dynamics. As shown in Figure 8A, the model considered a mass on a spring. The mass increases at a fixed loading rate, dmL/dt, until a critical distention D = DC is reached. Then a portion of the mass is released from the spring at a rate (dmu/dt) that is governed by the velocity of the mass (dD/dt = p/m) at the critical displacement point. In this formulation, p represents the momentum of the weight on the spring. The movement of this mass on the spring is described by dp/dt = Gm – κD – ηp/m. The spring constant, κ and the frictional coefficient, η, are assumed fixed. The set of equations for dD/dt and dp/dt, as closed by the conditions on the dm/dt, give rise to a set of non-linear equations. When dmL/dt increases toward large volumes, the system moves from weak periodic unloading to highly chaotic, non-linear behavior. In essence, the addition of mass and its subsequent unloading gives rise to complex interactions as the loading rate changes.
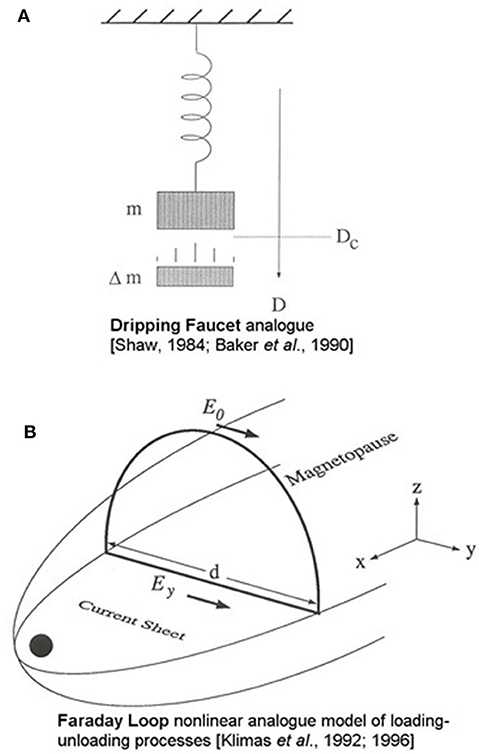
Figure 8. (A) The mechanical analog model for the substorm process: Mass on a spring is increased until a critical distance is reached. At that point, part of the mass is unloaded which causes the mass to move upward, after which the mass loading continues. (B) A Faraday loop model for the magnetospheric activity (Klimas et al., 1992). The dynamical substorm cycle is represented by a system of changing electric fields and magnetic flux content of the tail lobes. The magnetic flux changes in terms of the electric field imbalance and the magnetic flux content as produced by the tail currents.
The mechanical analog model of Baker et al. (1990a) was inspired by a similar model of drippy faucets developed by Shaw (1984). Baker et al. took rather literally the analogy between substorm unloading processes and a dripping faucet (Hones, 1979). As noted, the plasma sheet distends considerably and in the substorm growth phase. During the near-Earth reconnection onset, a part of the plasma sheet pinches off to form the substorm plasmoid. The remaining plasma sheet snaps back sunward. The upper part of Figure 4 illustrates that the dripping faucet behaves analogously to the Earth's plasma sheet during substorms.
The mass-on-spring analog model of Baker et al. (1990a) was capable of reproducing aspects of magnetospheric substorms; the sequence shown above in Figure 3 were reproduced rather well. Moreover, when a loading rate increased, the analog system exhibited non-linear behavior: period doubling and “bifurcation” resulted such that fully developed chaotic behavior ensued. Given the elementary, 2½ dimensional nature of the model, this was a quite successful simulation. Nonetheless, the mechanical analogy was limited. As a follow-on approach, Klimas et al. (1992) developed the Faraday loop model (Figure 8B) which was based more on a plasma analog.
The Faraday loop approach was a dynamical convection model with three degrees of freedom: (1) The average cross-tail electric field in the near-Earth current sheet, Ey; (2) The variation of Ey due to solar wind input, noted E0 on Figure 8B, and Esw earlier in the text, to the tail near the X-line position; and (3) variable magnetic flux content of magnetotail. The Faraday loop model was very much like the drippy faucet model. Flux was loaded into the tail at a rate determined by the (solar wind) input, E0. In the model, the tail unloads by forming a plasmoid, thereby dumping much of the tail flux in the tail (as in Figure 3 above).
One of the most important findings of the early linear prediction filter analysis was the “bimodal” response behavior (see Figure 7). The 20-min driven response time scale and the 60-min unloading time scale emerged as clear features during moderate activity periods. Using the Faraday loop model, we were able to use the observed VBs values measured upstream of the Earth to drive the Faraday loop model with realistic inputs. This allowed examination of analog model outputs as was done by Bargatze et al. (1985) using linear filter analysis. Of course, it was also possible to compute the linear filter elements in the Faraday Loop model as for the real magnetospheric response (as measured by the AL index).
Important studies in this early period went further to examine underlying dynamics as revealed within indicial time series data. Consolini et al. (1996) used the auroral electrojet indices to infer multifractal aspects of the dynamical system behavior. These authors examined the infrerred turbulent character involved with the magnetosphere-ionosphere dynamics. Subsequently in important studies of the nature of the Earth's plasma sheet behavior during active times, Angelopoulos et al. (1999) found evidence of intermittency in the plasma flows. This work was extended by Vörös et al. (2003) who confirmed such intermittent multiscale behavior of the magnetic field in the near-Earth plasma sheet (see section Multi-Scale Aspects).
Follow-on work (e.g., Freeman and Morley, 2004, 2009) has sought to assemble “minimal” substorm models that contain the key aspects of substorm dynamical processes and timing properties. While substorms in the real world can have many complex variations, there is a basic, repeatable underlying pattern of substorms that is usually present. While early studies tended to focus on the auroral electrojet index time series, subsequent studies also examined other available indices. Wanliss (2005) found fractal behavior in the stormtime (SYM-H) index time series and this fractal nature of the dynamics was amplified upon in a broad study of magnetic storm development (Balasis et al., 2006).
Multi-Scale Aspects
The traditional methods of studying the solar wind interaction with Earth's magnetosphere have been to take a magnetohydrodynamic (MHD) approach. This framework was described in the foregoing sections of this review. The MHD method has had many successes and has helped, for example, to illuminate much about the fundamental substorm dynamical cycle. However, MHD models use different computational techniques and approaches which can lead to different predicted dynamical (substorm) behavior (see Gordeev et al., 2016). Moreover, as we have also detailed in this paper, there are complex and non-linear aspects of solar wind-magnetosphere coupling that are not always adequately captured by the straightforward MHD models and simulations (Baker et al., 1999 and references therein). This has led various authors to take different tacks and these alternatives have provided valuable and novel understanding of the coupling issues. For example, Chapman et al. (1998) and Chang (1999) employed analog models to characterize the most general dynamical properties of the terrestrial plasma sheet and its coupling in the ionosphere. These ideas are based on the slow buildup of a system until it reaches an unstable state at which point an “avalanche” occurs and the system collapses. Chapman et al. (1998) gained valuable insight into the energy buildup and release in the Earth's magnetotail using such a “sand pile” approach. The basic advances from this kind of work have been the realization that the growth phase of substorms is an essential element of the substorm cycle. Either a spontaneous relaxation of the system must eventually occur after sufficient loading or else even the slightest perturbation of the system can trigger a massive energy release.
Another approach considered for the magnetospheric system was predicated on a variant of “catastrophe theory.” This was based on the idea of a system that has evolved to a highly stressed state. Then, after further forcing, the system undergoes a catastrophic transition to a much more relaxed state. As shown here in Figure 9 from Baker et al. (1999), the magnetosphere can be thought of late in the substorm growth phase as being primed for catastrophic collapse. Then by means of one or more plasma physical processes, the magnetotail can collapse into a relaxed configuration. This kind of reasoning was also explored by Lewis (1991) in an attempt to help resolve some of the longstanding debates about the exact mechanisms and physical instabilities that lead to substorm onsets. Baker et al. (1999) noted that it might be a variety of different instabilities that could play important triggering roles in the state transition, depending on the circumstances.
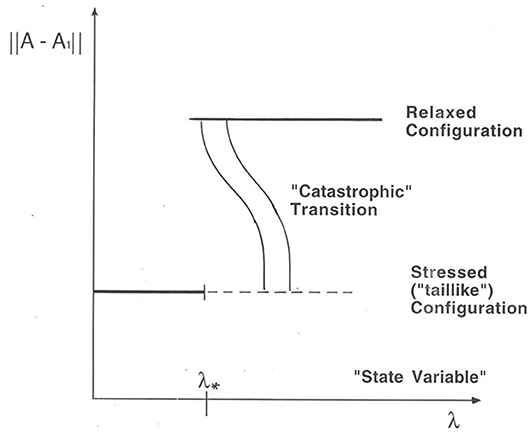
Figure 9. A diagram illustrating the abrupt (“catastrophic”) transition of the magnetosphere from a highly stressed, or taillike, magnetic connection to a much more relaxed configuration. Several different physical pathways for such relaxation may be possible once the magnetosphere exceeds a critical value of a magnetospheric state variable λ* (adapted from Baker et al., 1999).
Based upon decades of in situ and remote sensing observations of the global magnetospheric system and based upon the revealed complexity of the underlying magnetospheric dynamics, one can say that many different approaches have been necessary to disentangle the various facets of geomagnetic activity. But quite clearly, all the evidence suggests that the solar wind-magnetosphere-ionosphere interactions have strongly non-linear aspects to them. In light of this recognition, space plasma physics, as applied to magnetospheric dynamics, must move away from traditional plasma stability analyses and must utilize techniques that incorporate global, non-linear interactions. In trying to embrace such approaches, ideas from other branches of physics, engineering, applied mathematics, etc., can provide valid and extremely useful insights.
Adopting a more generalized point of view has certainly driven home the point that multiscale phenomena play a crucial role in magnetospheric dynamics. For example, global auroral images have been examined on a wide range of temporal and spatial scales (Lui, 2002; Uritsky et al., 2002). The results of such analysis point clearly toward essentially scale-free distributions over a wide spectrum of system conditions. This may further imply that the magnetotail can undergo strong dissipation events in part due to local plasma instabilities and in part due to control elements remote from the central plasma sheet. These elements may largely lie in the incident solar wind driver or they may reside in the distant ionosphere. Under such circumstances, it may appear that regional plasma instabilities are spontaneous or are even occurring in an essentially random fashion (Lewis, 1991). Thus, a lesson from many prior, diverse types of studies is that non-traditional analysis and modeling can reveal important aspects of our terrestrial space environment.
State Space Analysis And Phase Space Reconstruction
Phase space reconstruction and analog model development—as discussed here—give considerable insight into all aspects of magnetospheric dynamics. The evidence has suggested that substorms are the manifestation of a fundamental dynamical cycle. But this work also has shown that the magnetosphere is never really linear in its interaction with the solar wind since the nature of the substorm response varies as the general level of the activity increases.
In light of such analysis, one can speak in terms of a certain “state” of the magnetospheric system (see Vassiliadis et al., 1995). This state can be characterized by the level of geomagnetic activity (as might be measured by AE, AL, Kp, or other global indices). One can identify a state variable, X(t), which characterizes the global magnetospheric condition, but which also takes cognizance of the recent past history of the solar wind input [U(t)] and the resultant magnetospheric response. Figure 10a illustrates a simple non-linear (i.e., quadratic) relationship between U(t) and X(t). At a particular point (X0, U0) one approximates the relationship by a “local linear” filter (LLP). In general, the LLF varies depending on the input level.
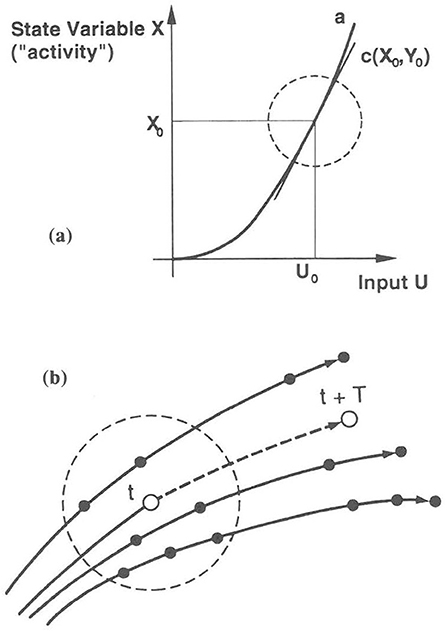
Figure 10. (a) Illustration of a simple nonlinear relationship between the state of the magnetosphere (X) and solar wind input (U); (b) Neighboring trajectories through magnetospheric state space.
Pursuing the notion of a magnetospheric state, Vassiliadis et al. (1995) asserted that the system evolved according to dX/dt = F(X; U). It assumed that an index such as AL contains sufficient information to characterize the whole magnetospheric system. The basis for this assumption has been examined in earlier studies and analogous questions have been addressed for many complex systems (Gleick, 1987). It seems clear that global geomagnetic indices embed within them the “shadow” of all the key dynamical processes. Proceeding on this presumption, the recent history of input [U(t)] and output [X(t)] specifies a clear trajectory in state space. This concept is illustrated in Figure 10b where the open dot at time, t, is followed by another point in state space at time = t + T. Because of the repeatable cycle in substorm dynamics, there is a reasonable possibility of extrapolating the dynamical evolution of the magnetosphere into the future. By examining the “nearest neighbors” of a given point (X0, U0) in state space, and using the average state space trajectories represented by the nearest neighbor points, one can predict the future evolution of the solar wind-magnetosphere system (Vassiliadis et al., 1995).
The method of state space construction proved to be a powerful way of predicting future geomagnetic activity. As described above, one can use a large data base of previous input-output (e.g., VBs-AL) relationships to construct a multidimensional state space. One can then consider the recent values of VBs and AL leading up to this point. For example, consider the previous 15 min of AL behavior. Then looking back in the historical data base, find all previous examples of VBs-AL behavior that closely parallel the one in question. By averaging together these “nearest neighbor” trajectories in state space one can predict with some assurance the future evolution of the ongoing geomagnetic activity pattern. In many ways this is similar to predicting terrestrial weather based upon previous similar patterns of season, temperature, pressure, humidity, etc.
All of this work may be termed “data-mining” and it has shown significant successes over many years. There have been crucially important models of the terrestrial magnetic field built on such data mining efforts (Tsyganenko and Sitnov, 2007; Sitnov et al., 2008). More recently, using this kind of global magnetic field information has allowed extraction of magnetospheric substorm growth phase and expansion phase patterns (Stephens et al., 2019). Going beyond simple index data to global in situ data exploitation may hold even greater modeling promise.
Non-Linear Dynamics And Complexity
As discussed above, linear prediction filters can be convolved with input time-series in order to approximate the output of a specified system process. This was the approach taken for substorm onset forecasting (Bargatze et al., 1985; Blanchard and McPherron, 1992) and the method met with considerable empirical success. However, the approach was also criticized because it did not reveal in great detail the underlying physical processes producing substorm onsets.
Many other magnetospheric properties have been modeled using linear filter methods. For example, Nagai (1988) applied this approach to the problem of specifying and forecast energetic electron fluxes at the geostationary orbit using Kp geomagnetic indices as the driving input. Baker et al. (1990b) applied linear prediction filter methods to the same problem but using solar wind speed data as the driver input. This latter approach proved to be very useful and powerful. Even today—three decades later—the Space Weather Prediction Center of the National Oceanic and Atmospheric Administration (NOAA) uses the Baker et al. (1990b) method as the basis of its Relativistic Electron Forecast Model (REFM). This model provides 1–8 day predictions of omni-directional electron fluxes at geostationary orbit using real-time solar wind data from NASA spacecraft at L1.
While linear analyses can work well in such system applications, there is ample evidence that non-linear behavior is exhibited in several ways by the Earth's magnetosphere. This was well-documented by the Bargatze et al. (1985) work concerning magnetospheric substorms described above. Much work over the past several decades has further demonstrated that geomagnetic activity can exhibit output that is not proportional to input. There are clear examples in the ionosphere and the magnetospheric proper where there are feedbacks (that is, output influences input to some greater or lesser degree). The near-Earth system thus can exhibit what seems to be random behavior and there can be immense sensitivity to initial conditions. These are all properties of non-linear dynamics (Gleick, 1987). This has also been termed low-dimensional behavior or “deterministic chaos.” Such non-linearity can lead to self-organization in which global patterns emerge from local interactions among many subunits (see Pepper and Hoelzer, 2001) In these cases—as in the magnetosphere-ionosphere system—the interactions are often shaped by multiple feedback loops.
As described by Klimas et al. (2000), the magnetotail and its embedded plasma sheet (see Figure 2) exhibit many of the properties just discussed. Klimas et al. noted that the magnetotail is a spatially distributed loading-unloading system. The hypothesis—well-supported by observations—is that magnetic flux is the relevant conserved quantity. Klimas et al. also demonstrated that the magnetotail is often near a threshold instability that can produce localized magnetic reconnection. Thus, the system exhibits self-organized criticality (SOC) with a level of global coherence in a broadly distributed spatial region that is near instability (see, also, Sitnov et al., 2001). Often in the magnetotail system, localized reconnection, “pseudo-breakups,” and full-fledged magnetospheric substorms produce a rather “scale-free” cascade (avalanche) of geomagnetic disturbances (Klimas et al., 2000).
A persistent question in system analysis is how much information content may be inherently contained in a given parameter sequence or activity time series. Measures of ‘entropy” are often used to assess such information content and many studies have suggested that the magnetosphere exhibits clear evolution from more complex to a more orderly state as the near-Earth space moves from pre-storm to full geomagnetic storm conditions (Balasis et al., 2008, 2009). More recent work building on such entropy assessments have examined the information transfer via solar wind forcing leading to radiation belt flux enhancements (Wing et al., 2016). Entropy analyses have also helped understand more deeply the substorm-storm relationship that lies at the heart of the magnetospheric dynamical pattern (Runge et al., 2018).
As shown schematically in Figure 11 (from Baker, 2011), there has been quite a progression of thought about non-linear magnetospheric dynamics over the past several decades. From the rudimentary analogy of the dripping faucet by Hones (1979) through the several models and approaches of the 1990s and early 2000s, many methods of data analysis have shown that the magnetosphere-ionosphere system is a complex, non-linear domain. With new large data sets from observing platforms such as the Magnetospheric Multiscale (MMS) mission (Burch et al., 2015), new opportunities now exist to examine questions that were not accessible in earlier times.
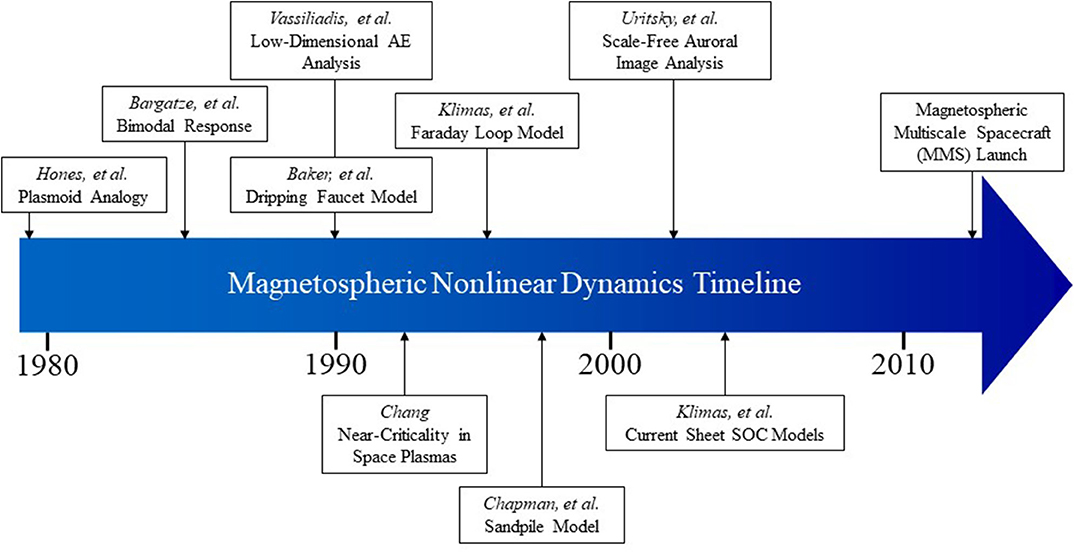
Figure 11. A timeline of ideas and papers dealing with various aspects non-linear dynamics in magnetospheric physics (from Baker, 2011).
Neural Networks, Machine Learning, And Future Prospects
In the 1990s and into the 2000s, several authors and research groups began to employ artificial neural network (ANN) methods to study such things as solar wind driving of radiation belt particle fluxes (e.g., Stringer and McPherron, 1993) and geomagnetic activity (e.g., Gleisner and Lundstedt, 1997; Takalo and Timonen, 1997). These multi-layer feed-forward neural nets were able to provide—in many cases—impressive specification and forecasts of important space weather indicators such as the AE/AL indices or geostationary-orbit electron fluxes. Somewhat later, related ANN methods were able to specify and predict up to 1-h ahead the ionosphere total electron content (TEC) (see, e.g., Tulunay et al., 2006). While these approaches often gave remarkably good forecasts of geophysical conditions, there were also criticisms that the methods did not reveal deep insight into the underlying physics that produced specific responses.
In today's era of machine learning (ML), there seems to be less concern about always needing to understand precisely why a given method works. Rather there is more concern about how well a ML tool might be able to do. Recent studies have used vast new spacecraft data sets for a wide range of purposes such as assessing magnetospheric field models (Yu et al., 2014) and identifying radiation belt pitch angle distribution patterns (Souza et al., 2016). In these instances, and many more that could be cited, neural network tools permit data examination and classification in rather automatic ways.
Machine learning has reached even more full flower in just the last few years. Combining physical models with machine learning techniques has provided the capability to analyze and understand relationships between cold plasma properties, local wave characteristics, and relativistic electron flux distributions throughout the inner magnetosphere (Chu et al., 2017; Bortnik et al., 2018). Particularly notable successes have been achieved using non-linear autoregressive moving average with exogenous inputs (NARMAX) methods to predict energetic particle events (e.g., Boynton et al., 2011, 2013). Both acceleration and loss processes for relativistic electrons, including the amount of “memory” in the system, have been more deeply understood through the use of ML techniques.
Looking to the future, it is obvious that both space missions and ground-based systems will continue to increase in their capabilities. This means even higher volumes of solar, interplanetary, and geospace data. “Non-linear” approaches (spectral methods, filter techniques, ANNs, etc.) will also probably keep increasing in complexity and in their “data-mining” capabilities. Many useful applications of these capabilities will probably result. They likely will include:
- Data conditioning (gap filling, noise reduction, data smoothing, etc.);
- Empirical model development and coupling to other models (either first-principles or other empirical models);
- Data assimilation (related to non-linear dynamics, control theory, radiation belt behavior, thermospheric properties, GPS performance, etc.); and
- Prediction algorithms.
Summary And Conclusions
Advances in computer technology in the 1980s allowed scientists and mathematicians to solve numerically many vexing problems posed decades earlier. This meant that fields of fractal geometry, non-linear dynamics, chaos theory, wavelet (and other) transform methods, neural networks, etc., could be formulated as extensions (or juxtapositions) to traditional linear and spectral approaches. Hence, concepts such as the “state” of a plasma, fractals, chaos (as opposed to turbulence), cellular automata, and several other ideas trace back to that time. From these ideas, especially in the 1990s, sprang a plethora of methods for data analysis. In this brief review, we have touched on some examples in geomagnetic field studies, radiation belt behavior, ionospheric and thermospheric changes, and solar wind-magnetosphere coupling, among others. These approaches often gave rise to improved methods of numerical simulations of the magnetospheric domain.
While some of the methods explored in earlier decades found only limited use and therefore did not develop further into the 2000s, others revealed great utility. This often sprang from data analysis methods developed in earlier times that now have found applications in processing large volumes of data returned by spacecraft missions and ground-based observation platforms. In this machine learning era, this is an extremely important outcome. These earlier methods now are aiding in producing new (and effective) empirical and physical models. These results hold great promise for predicting the state of geoplasma systems going forward. Thus, space situational awareness and space weather applications seem to be on the threshold for a new and highly productive phase.
It is perhaps worth noting that much of the early work described in this brief review was built upon analysis and modeling of geomagnetic index information. With years of in situ measurements throughout the magnetosphere-ionosphere system, we now have plasma, energetic particle, and magnetic field data sets that could be organized and used to examine dynamical properties of the solar-terrestrial system that were not accessible readily based only on ground indices such as AE or Dst. It would be quite valuable (in the author's opinion) to use different long-term descriptors of the magnetospheric system and repeat some of the kinds of studies that have been reviewed here.
Author Contributions
The author confirms being the sole contributor of this work and has approved it for publication.
Funding
This work was supported by Director's Discretionary funding from the University of Colorado Laboratory for Atmospheric and Space Physics.
Conflict of Interest
The author declares that the research was conducted in the absence of any commercial or financial relationships that could be construed as a potential conflict of interest.
Acknowledgments
The author thanks D. Vassiliadis for extremely useful conversations. The author acknowledges the invited talk, Heliophysics Data Science: Past Experience and Future Prospects, given at the Machine Learning in Heliophysics Conference in Amsterdam, The Netherlands. The conference was held September 16–20, 2019.
References
Angelopoulos, V., Mukai, T., and Kokubun, S. (1999). Evidence for intermittency in earth's plasma sheet and implications for self-organized criticality. Phys. Plasmas 6, 4161–4168. doi: 10.1063/1.873681
Baker, D. N. (2008). A 21st century vision for geophysical data management. Phys. Today 61, 54–55. doi: 10.1063/1.2982123
Baker, D. N. (2011). “Perspectives on geospace plasma coupling,” in Modern Challenges in Nonlinear Plasma Physics: A Festschrift Honoring the Career of Dennis Papadopoulos. AIP conference proceedings/plasma physics, eds D. Vassiliadis, S. F. Fung, X. Shao, I. A. Daglis, and J. D. Huba (College Park, MD: American Institute of Physics). doi: 10.1063/1.3544314
Baker, D. N., Barton, C., Peterson, W., and Fox, P. (2008). Informatics and the 2007-2008 electronic geophysical year. EOS 89, 485–486. doi: 10.1029/2008EO480001
Baker, D. N., Klimas, A. J., McPherron, R. L., and Buchner, J. (1990a). The evolution from weak to strong geomagnetic activity: an interpretation in terms of deterministic chaos. Geophys. Res. Lett. 17, 41–44. doi: 10.1029/GL017i001p00041
Baker, D. N., Klimas, A. J., Pulkkinen, T. I., and McPherron, R. L. (1993). Re-examination of driven and unloading aspects of magnetospheric substorms. Adv. Space Res. 13, 75–83. doi: 10.1016/0273-1177(93)90316-4
Baker, D. N., McPherron, R. L., Cayton, T. E., and Klebesadel, R. W. (1990b). Linear prediction filter analysis of relativistic electron properties at 6.6 RE. J. Geophys. Res. 95, 15133–15140. doi: 10.1029/JA095iA09p15133
Baker, D. N., Pulkkinen, T. I., Angelopoulos, V., Baumjohann, W., and McPherron, R.L. (1996). The neutral line model of substorms: past results and present view. J. Geophys. Res. Space Phys. 101, 12975–13010. doi: 10.1029/95JA03753
Baker, D. N., Pulkkinen, T. I., Büchner, J., and Klimas, A. J. (1999). Substorms: a global instability of the magnetosphere-ionosphere system. J. Geophys. Res. Space Phys. 104, 14601–14611. doi: 10.1029/1999JA900162
Balasis, G., Daglis, I. A., Kapiris, P., Mandea, M., Vassiliadis, D., and Eftaxias, K. (2006). From pre-storm activity to magnetic storms: a transition described in terms of fractal dynamics. Ann. Geophys. 24, 3557–3567. doi: 10.5194/angeo-24-3557-2006
Balasis, G., Daglis, I. A., Papadimitriou, C., Kalimeri, M., Anastasiadis, A., and Eftaxias, K. (2008). Dynamical complexity in Dst time series using non-extensive Tsallis entropy. Geophys. Res. Lett. 35:L14102. doi: 10.1029/2008GL034743
Balasis, G., Daglis, I. A., Papadimitriou, C., Kalimeri, M., Anastasiadis, A., and Eftaxias, K. (2009). Investigating dynamical complexity in the magnetosphere using various entropy measures. J. Geophys. Res. 114:A00D06. doi: 10.1029/2008JA014035
Bargatze, L. F., Baker, D. N., McPherron, R. L., and Hones, E. W. Jr. (1985). Magnetospheric impulse response for many levels of geomagnetic activity. J. Geophys. Res. Space Phys. 90, 6387–6394. doi: 10.1029/JA090iA07p06387
Blanchard, G. T., and McPherron, R. L. (1992). “A bi-modal linear prediction filter relating the solar wind electric field to the westward electrojet,” in Solar Terrestrial Prediction Proceedings (Ottawa, ON).
Bortnik, J., Claudepierre, S., Chu, X., Tobiska, K., and Camporeale, E. (2018). A Machine Learning Based Specification and Forecast Model of the Inner Magnetospheric Radiation Environment. Space Weather Week presentation. Available online at: https://www.swpc.noaa.gov/sites/default/files/images/u59/04%20Jacob%20Bortnik%20Official.pdf
Boynton, R. J., Balikhin, M. A., Billings, S. A., and Amariutei, O. A. (2013). Application of nonlinear autoregressive moving average exogenous input models to geospace: advances in understanding and space weather forecasts. Ann. Geophys. 31, 1579–1589. doi: 10.5194/angeo-31-1579-2013
Boynton, R. J., Balikhin, M. A., Billings, S. A., Wei, H. L., and Ganushkina, N. (2011). Using the NARMAX OLS-ERR algorithm to obtain the most influential coupling functions that affect the evolution of the magnetosphere. J. Geophys. Res. 116, 1–8. doi: 10.1029/2010JA015505
Burch, J. L., Moore, T. E., Torbert, R. B., and Giles, B. L. (2015). Magnetospheric multiscale overview and science objectives. Space Sci. Rev. 199, 5–21. doi: 10.1007/s11214-015-0164-9
Chang, T. (1999). Self-organized criticality, multi-fractal spectra, sporadic localized reconnections and intermittent turbulence in the magnetotail. Phys. Plasmas 6, 4137–4145. doi: 10.1063/1.873678
Chapman, S. C., Watkins, N. W., Dendy, R. O., Helander, P., and Rowlands, G. (1998). A simple avalanche model as an analogue for magnetospheric activity. Geophys. Res. Lett. 25, 2397–2400. doi: 10.1029/98GL51700
Chu, X. N., Bortnik, J., Li, W., Ma, Q., Angelopoulos, V., and Thorne, R. M. (2017). Erosion and refilling of the plasmasphere during a geomagnetic storm modeled by a neural network. J. Geophys. Res. Space Phys. 122, 7118–7129. doi: 10.1002/2017JA023948
Consolini, G., Marcucci, M. F., and Candidi, M. (1996). Multifractal structure of auroral electrojet index data. Phys. Rev. Lett. 76, 4082–4085. doi: 10.1103/PhysRevLett.76.4082
Freeman, M. P., and Morley, S. K. (2004). A minimal substorm model that explains the observed statistical distribution of times between substorms. Geophys. Res. Lett. 31:L12807. doi: 10.1029/2004GL019989
Freeman, M. P., and Morley, S. K. (2009). No evidence for externally triggered substorms based on superposed epoch analysis of IMF Bz. Geophys. Res. Lett. 36:L21101. doi: 10.1029/2009GL040621
Gleisner, H., and Lundstedt, H. (1997). Response of the auroral electrojets to the solar wind modeled with neural networks. J. Geophys. Res. Space Phys. 102, 14269–14278. doi: 10.1029/96JA03068
Gordeev, E., Sergeev, V., Tsyganenko, N., Kuznetsova, M., Rastäetter, L., Raeder, J., et al. (2016). The substorm cycle as reproduced by global MHD models. Space Weather 15, 131–149. doi: 10.1002/2016SW001495
Hones, E. W. Jr. (1979). Transient phenomena in the magnetotail and their relation to substorms. Space Sci. Rev. 23, 393–410. doi: 10.1007/BF00172247
Klimas, A. J., Baker, D. N., Roberts, D. A., Fairfield, D. H., and Buchner, J. (1992). A nonlinear dynamical analogue model of geomagnetic activity. J. Geophys. Res. 97, 12253–12266. doi: 10.1029/92JA00794
Klimas, A. J., Valdivia, J. A., Vassiliadis, D., Baker, D. N., Hesse, M., and Takalo, J. (2000). Self-organized criticality in the substorm phenomenon and its relation to localized reconnection in the magnetospheric plasma sheet. J. Geophys. Res. 105, 18765–18780. doi: 10.1029/1999JA000319
Klimas, A. J., Vassiliadis, D., Baker, D. N., and Robert, D. A. (1996). The organized nonlinear dynamics of the magnetosphere. J. Geophys. Res. 101, 13089–13113. doi: 10.1029/96JA00563
Lewis, Z. V. (1991). On the apparent randomness of substorm onset. Geophys. Res. Lett. 18, 1627–1630. doi: 10.1029/91GL01781
Lui, A. T. Y. (2002). Multiscale phenomena in the near-earth magnetosphere. J. Atmos. Solar-Terrestrial Phys. 64, 125–143. doi: 10.1016/S1364-6826(01)00079-7
Nagai, T. (1988). “Space weather forecast”: prediction of relativistic intensity at synchronous orbit. Geophys. Res. Lett. 15, 425–428. doi: 10.1029/GL015i005p00425
Pepper, J. W., and Hoelzer, G. (2001). Unveiling mechanisms of collective behavior. Science 294, 1466–1467. doi: 10.1126/science.1066235
Runge, J., Balasis, G., Daglis, I. A., Papadimitriou, C., and Donner, R. V. (2018). Common solar wind drivers behind magnetic storm–magnetospheric substorm dependency. Sci. Rep. 8:16987. doi: 10.1038/s41598-018-35250-5
Sharma, A. S., Baker, D. N., and Borovsky, J. E. (2005). “Nonequilibrium phenomena in the magnetosphere,” in Nonequilibrium Phenomena in Plasmas. Astrophysics and space science library, Vol. 321, eds W. B. Burton, J. M. E. Kuijpers, E. P. J. Van Den Heuvel, H. Van Der Laan, I. Appenzeller, and J. N. Bahcall (Dordrecht: Springer), 3–22. doi: 10.1007/1-4020-3109-2_1
Shaw, R. (1984). The Dripping Faucet as a Model Chaotic System. The science frontier express series. Santa Cruz, CA: Aerial Press.
Shukhtina, M. A., Dmitrieva, N. P., and Sergeev, V. A. (2014). On the conditions preceding sudden magnetotail magnetic flux unloading. Geophys. Res. Lett. 41, 1093–1099. doi: 10.1002/2014GL059290
Sitnov, M. I., Sharma, A. S., Papadopoulos, K., and Vassiliadis, D. (2001). Modeling substorm dynamics of the magnetosphere: from self-organization and self-organized criticality to nonequilibrium phase transitions. Phys. Rev. E 65:016116. doi: 10.1103/PhysRevE.65.016116
Sitnov, M. I., Tsyganenko, N. A., Ukhorskiy, A. Y., and Brandt, P. C. (2008). Dynamical data-based modeling of the storm-time geomagnetic field with enhanced spatial resolution. J. Geophys. Res. 113. doi: 10.1029/2007JA013003
Souza, V. M., Vieira, L. E. A., Medeiros, C., Da Silva, L. A., Alves, L. R., Kog, D., et al. (2016). A neural network approach for identifying particle pitch angle distributions in Van Allen probes data. Space Weather 14, 275–284. doi: 10.1002/2015SW001349
Stephens, G. K., Sitnov, M. I., Korth, H., Tsyganenko, N. A., Ohtani, S., Gkioulidou, M., et al. (2019). Global empirical picture of magnetospheric substorms inferred from multimission magnetometer data. J. Geophys. Res. 124, 1085–1110. doi: 10.1029/2018JA025843
Stringer, G. A., and McPherron, R. L. (1993). “Neural networks and predictions of day-ahead relativistic electrons at geosynchronous orbit,” in Proceedings of the International Workshop on Artificial Intelligence Applications in Solar-Terrestrial Physics, Lund, Sweden, eds J. A. Joselyn, H. Lundstedt, and J. Trolinger (Boulder CO: NOAA Space Environment Center), 139–143.
Takalo, J., and Timonen, J. (1997). Neural network prediction of AE data. Geophys. Res. Lett. 24, 2403–2406. doi: 10.1029/97GL02457
Tsyganenko, N. A., and Sitnov, M. I. (2007). Magnetospheric configurations from a high-resolution data-based magnetic field model. J. Geophys. Res. 112:A06225. doi: 10.1029/2007JA012260
Tulunay, E., Senalp, E. L., Radicella, S. M., and Tulunay, Y. (2006). Forecasting total electron content, maps by neural technique. Radio Sci. 41:RS4016. doi: 10.1029/2005RS003285
Uritsky, V. M., Klimas, A. J., Vassiliadis, D., Chua, D., and Parks, G. (2002). Scale-free statistics of spatiotemporal auroral emissions as depicted by POLAR UVI images: the dynamic magnetosphere is an avalanching system. J. Geophys. Res. Space Phys. 107, SMP 7-1–SMP 7-11. doi: 10.1029/2001JA000281
Vassiliadis, D., Klimas, A. J., Baker, D. N., and Roberts, D. A. (1995). A description of the solar wind-magnetosphere coupling based on nonlinear prediction filters. J. Geophys. Res. Space Phys. 100, 3495–3512. doi: 10.1029/94JA02725
Vörös, Z., Baumjohann, W., Nakamura, R., Runov, A., Zhang, T. L., Volwerk, M., et al. (2003). Multi-scale magnetic field intermittence in the plasma sheet. Ann. Geophys. 21, 1955–1964. doi: 10.5194/angeo-21-1955-2003
Wanliss, J. A. (2005). Fractal properties of SYM-H during quiet and active times. J. Geophys. Res. 110:A03202. doi: 10.1029/2004JA010544
Wing, S., Johnson, J. R., Camporeale, E., and Reeves, G. D. (2016). Information theoretical approach to discovering solar wind drivers of the outer radiation belt. J. Geophys. Res. Space Phys. 121, 9378–9399. doi: 10.1002/2016JA022711
Keywords: non-linearity, dynamics, informatics, multiscale, analytics
Citation: Baker DN (2020) Solar-Terrestrial Data Science: Prior Experience and Future Prospects. Front. Astron. Space Sci. 7:540133. doi: 10.3389/fspas.2020.540133
Received: 03 March 2020; Accepted: 17 August 2020;
Published: 02 October 2020.
Edited by:
Veronique A. Delouille, Royal Observatory of Belgium, BelgiumReviewed by:
Nickolay Ivchenko, Royal Institute of Technology, SwedenVictor Sergeev, Saint Petersburg State University, Russia
Georgios Balasis, National Observatory of Athens, Greece
Copyright © 2020 Baker. This is an open-access article distributed under the terms of the Creative Commons Attribution License (CC BY). The use, distribution or reproduction in other forums is permitted, provided the original author(s) and the copyright owner(s) are credited and that the original publication in this journal is cited, in accordance with accepted academic practice. No use, distribution or reproduction is permitted which does not comply with these terms.
*Correspondence: Daniel N. Baker, daniel.baker@lasp.colorado.edu