
- Department of Oceanography, Center for Microbial Oceanography: Research and Education, School of Ocean and Earth Science and Technology, University of Hawaii, Honolulu, HI, USA
We investigated the concentration dependent uptake of inorganic phosphate (Pi) and adenosine-5′-triphosphate (ATP) in microbial populations in the North Pacific Subtropical Gyre (NPSG). We used radiotracers to measure substrate uptake into whole water communities, differentiated microbial size classes, and two flow sorted groups; Prochlorococcus (PRO) and non-pigmented bacteria (NPB). The Pi concentrations, uptake rates, and Pi pool turnover times (Tt) were (mean, ±SD); 54.9 ± 35.0 nmol L−1 (n = 22), 4.8 ± 1.9 nmol L−1 day−1 (n = 19), and 14.7 ± 10.2 days (n = 19), respectively. Pi uptake into >2 μm cells was on average 12 ± 7% (n = 15) of the total uptake. The kinetic response to Pi (10–500 nmol L−1) was small, indicating that the microorganisms were close to their maximum uptake velocity (Vmax). Vmax averaged 8.0 ± 3.6 nmol L−1 day−1 (n = 19) in the >0.2 μm group, with half saturation constants (Km) of 40 ± 28 nmol L−1 (n = 19). PRO had three times the cell specific Pi uptake rate of NPB, at ambient concentrations, but when adjusted to cells L−1 the rates were similar, and these two groups were equally competitive for Pi. The Tt of γ-P-ATP in the >0.2 μm group were shorter than for the Pi pool (4.4 ± 1.0 days; n = 6), but this difference diminished in the larger size classes. The kinetic response to ATP was large in the >0.2 μm class with Vmax exceeding the rates at ambient concentrations (mean 62 ± 27 times; n = 6) with a mean Vmax for γ-P-ATP of 2.8 ± 1.0 nmol L−1 day−1, and Km at 11.5 ± 5.4 nmol L−1 (n = 6). The NPB contribution to γ-P-ATP uptake was high (95 ± 3%, n = 4) at ambient concentrations but decreased to ∼50% at the highest ATP amendment. PRO had Km values 5–10 times greater than NPB. The above indicates that PRO and NPB were in close competition in terms of Pi acquisition, whereas P uptake from ATP could be attributed to NPB. This apparent resource partitioning may be a niche separating strategy and an important factor in the successful co-existence within the oligotrophic upper ocean of the NPSG.
Introduction
Phosphorus (P) is a major bioelement required for all life, and is frequently in low, or limiting supply relative to biological demand in aquatic ecosystems (Krom et al., 1991; Cotner et al., 1997; Wu et al., 2000; Moutin et al., 2005; Thingstad et al., 2005). In the North Pacific Subtropical Gyre (NPSG), however, primary production has long been viewed as being controlled by the availability of nitrogen (N: Eppley et al., 1973; Codispoti, 1989). Nevertheless, it has been hypothesized that natural, climate induced changes have exerted selective pressure on the microorganisms in the NPSG, favoring small, non-eukaryotic phototrophs, such as Prochlorococcus (PRO) and Synechococcus (SYN), as well as dissolved nitrogen gas (N2)-fixing organisms (Karl et al., 1992, 1997; Karl, 1999), the latter which potentially may relieve the system of N-limitation. The presence and activity of N2-fixing organisms, such as Trichodesmium sp., Crocosphaera sp., or symbiotic relationships between diatoms and N2-fixing symbionts such as Richelia sp., have been well documented over the past decade at Station ALOHA, and elsewhere in the NPSG, as have their important role in providing new N to the upper euphotic zone, and contribution to export production (Villareal, 1991; Karl et al., 1992, 2002, 2012; Letelier and Karl, 1996; Zehr et al., 2001; Church et al., 2005a,b). A supply mechanism for “new” P, analogous to that of N2-fixation for N, does not exist, and resupply of P into the euphotic zone is predominantly restricted to influx of nutrient enriched deeper waters. Although atmospheric deposition does occur, it contributes only minimally to new P as the N to P ratio is much higher than the canonical Redfield stoichiometry of 16:1 (Redfield et al., 1963; Graham and Duce, 1979; Paerl, 1993; Chadwick et al., 1999). Hence, over long time scales, these constraints on new P delivery into the productive layers of the upper ocean, together with increased N2-fixation, are expected to drive these marine ecosystems toward P limitation (Falkowski, 1997). Indeed, concomitant to the rise in N2-fixation and presumable increased inventories of bioavailable N, the decadal trends in the dissolved inorganic P (Pi) and particulate P (PP) inventories (0–100 m) at Station ALOHA show large drawdown in both, with ∼70% lower Pi and ∼50% lower PP than at the beginning of the Hawaii Ocean Times-series (HOT) program in 1988 (Karl, 2007). Based on these N and P trends, it has been hypothesized that intensification in the cycling of P will occur in this region, as well as increased utilization of the much larger dissolved organic P (DOP) pool (Karl et al., 1997; Karl and Björkman, 2002).
Marine microorganisms, such as PRO and non-chlorophyll fluorescent picoplankton cells (hereafter called non-pigmented bacteria; NPB), are osmotrophic and rely on a mixture of dissolved inorganic and organic P compounds to support their nutritional needs (Thingstad et al., 1993). These two groups may be in direct competition, as well as with larger pico- and nano-phytoplankton, when essential resources are in short supply. In addition, the relative success of the specific groups of microorganisms may be related to their kinetic response characteristics, and small cells are typically believed to be at a competitive advantage over larger cells due to their greater surface to volume ratios. Nutrient uptake kinetic theory has often been used to assess potential nutrient stress or limitation in a given environment, but can also be applied to investigate the relative competitiveness among microbial groups (Perry, 1976; Donald et al., 1997). For example, the success of PRO in the NPSG may well be related to the perennially oligotrophic conditions of this environment, where larger cells rarely experience high enough nutrient fields to reach their maximum uptake velocity, Vmax, and therefore may be at a competitive disadvantage. Hence the kinetic response by microorganisms to nutrient pulses, their ability to cope at perennially low concentrations, or their potential for utilizing organically bound nutrients, may determine the relative competitiveness and ultimate success of various microbial taxa, and thus the composition of the microbial community. The partitioning of P among the main groups of microorganisms is yet poorly characterized, therefore, identification of the competitive ability in P utilization among different osmotrophs is necessary for the prediction of changes in species composition in microbial communities, in the functioning of the microbial system and in the microbially mediated degradation of organic matter (Thingstad et al., 1993; Tanaka and Rassoulzadegan, 2003).
Recently, flow cytometric cell sorting of targeted groups of microorganisms, such as PRO, SYN, and NBP, combined with radiotracer techniques has been used to investigate the specific utilization and uptake rates of both Pi (Larsen et al., 2008; Casey et al., 2009; Duhamel et al., in revision), and in a few studies, select DOP compounds, in the form of adenosine-5′-triphosphate (ATP; Løvdal et al., 2007; Casey et al., 2009; Michelou et al., 2011). These studies have revealed differences in P partitioning between the selected microbial groups, and sampling sites with respect to both Pi and ATP acquisition rates, although the reasons for the differences between similar groups remain unclear.
In addition, cell sorting to elucidate P dynamics on the group specific level has yet to be applied in the NPSG and, to our knowledge, no information exists on the kinetic response to increased substrate concentrations.
It is therefore of interest to gain a better understanding of the utilization of both inorganic and organic forms of P by microorganisms in oligotrophic marine environments, such as the NPSG. In addition, the competition for potentially limiting resources between phototrophic and heterotrophic plankton groups is poorly resolved (Thingstad et al., 1998; Tanaka et al., 2004), and in the NPSG, these interactions are predominantly occurring within the domain Bacteria with PRO being the dominant phototrophic organism (Campbell and Vaulot, 1993). Here we present P uptake kinetics in whole water samples collected over several years in the NPSG near Hawaii, containing the mixed microbial biota. The primary objective in the initial set of experiments (2002–2009) was to investigate the P dynamics and kinetic response to the addition of increasing Pi concentrations, in both whole water and different size classes of the microbial community. In 2010, the added capability of flow sorting radiolabeled cells at sea was used to assess the relative response of two microbial groups as characterized by their size and pigmentation (PRO and NPB), to both Pi and organic phosphorus, here ATP.
We discuss the implications of the observed P uptake dynamics and kinetic response to P loading, with respect to P acquisition of different microbial size classes, or flow sorted groups. We also assess the case for resource partitioning between PRO and the NPB as revealed by group specific utilization of Pi versus ATP.
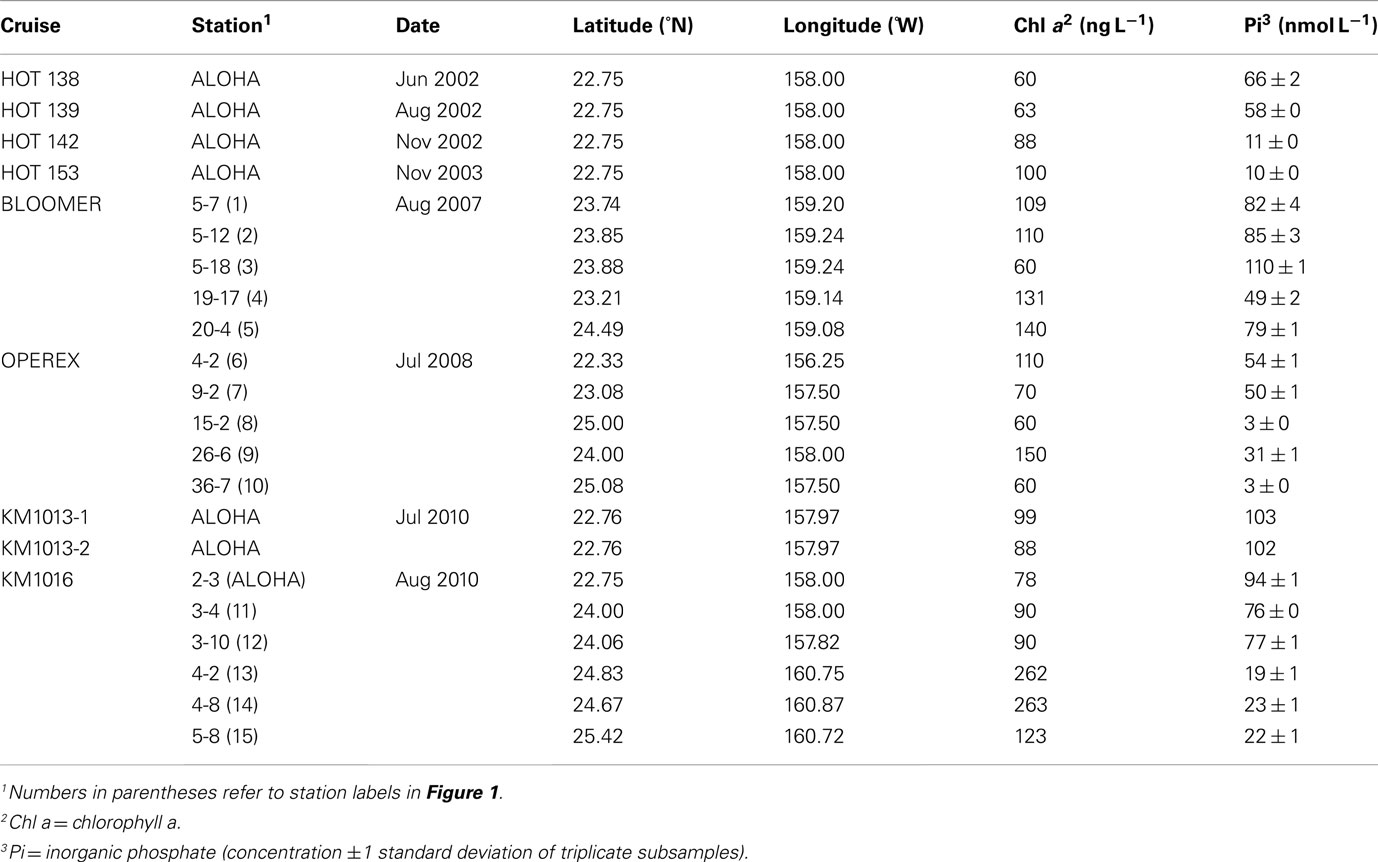
Table 1. Cruise identifier, station location and habitat characteristics during the time the experiments were conducted.
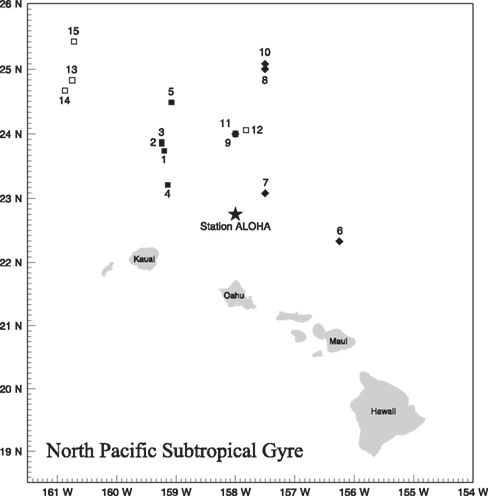
Figure 1. Station locations for phosphorus uptake experiments. Cruises and station labels are as follows: Hawaii Ocean Time-series, Station ALOHA (all HOT cruises, and KM1013-1, KM1013-2 and KM1016-2-3; star), BLOOM Ecological Reconnaissance (BLOOMER; filled squares; #1–5), Ocean PERturbation EXperiment (OPEREX; filled diamonds; #6–10), and KM1016 (open squares; #11–15). For cruise and station ID see Table 1.
Materials and Methods
Station Locations and Sample Collection
The stations sampled were all located in the NPSG (Figure 1; Table 1). Water samples were collected using polyvinyl chloride (PVC) Niskin-type bottles mounted on a 24-place rosette frame, equipped with conductivity, temperature, density (CTD), as well as an oxygen sensor and flash fluorometer. Sampling took place on eight research cruises from years 2002 through 2010 (Table 1). Twenty sampling occasions were in summertime (June-August) and two were in November during Hawaii Ocean Time-series cruises (HOT 142, 153).
Hydrography Data
In addition to the parameters measured with the environmental sensors, discrete seawater samples were also collected. These included samples for Pi and chlorophyll a (chl a). The sample collections and analyses were all according to the HOT standard protocols (hahana.soest.hawaii.edu/hot/methods/). In brief, for chl a determination, 150 mL of seawater was typically filtered through a glass fiber filter (GF/F; Whatman), and the filter placed into test tubes containing 5 mL of 100% acetone. The samples were extracted for 5–7 days at −20°C in the dark prior to fluorometric analysis (Turner Designs; model 10-AU). Samples for ambient nutrient concentrations were collected into high-density polyethylene bottles, stored upright and frozen (−20°C) until analyzed in the shore-based laboratory (Dore et al., 1996). In addition, samples for Pi analyses were collected from each experimental Pi amendment. The Pi concentrations were measured using the MAGnesium Induced Co-precipitation technique (MAGIC: Karl and Tien, 1992), followed by standard colorimetric analysis (Murphy and Riley, 1962). The color intensity was analyzed spectrophotometrically (Beckman Coulter DU-640) using a 10 cm cuvette cell. All samples were also treated to reduce arsenate to arsenite to eliminate cross reactivity with the molybdenum blue complex (Johnson, 1971). The analytical precision of this method is <±1 nmol Pi L−1 and the detection limit (DL) determined to be 2 nmol Pi L−1 using the definition of DL = 3 × SD, or precision.
Incubation Conditions and P Amendment
Seawater for investigating the P uptake kinetics was collected from water depths between 25 and 45 m and always sampled within the mixed layer. After P amendment, the samples were incubated in on-deck incubators, cooled with running, surface seawater and shielded with blue plexiglass (Rohm-Haas #2069) to achieve the approximate light level and spectral quality of the sample depth. The incubations were carried out in acid-washed, distilled water and sample-rinsed, clear polycarbonate (PC) bottles (Nalgene: 250 mL 2002–2009, 75 mL 2010) and amended with Pi at 4–6 concentrations, ranging from 10 to 500 nmol L−1 Pi, but routine additions were 0, 10, 25, 50, 75, and 150 nmol L−1 Pi. In experiments using ATP as the substrate, the additions were 0, 2, 5, 10, 25, and 50 nmol L−1 ATP, equivalent to three times that concentration in terms of P additions, to achieve the same P loading as in the Pi amended experiments. ATP was chosen as the test DOP compound primarily because of ATP’s biochemical importance in all life, and secondly, because ATP can be uniquely measured in seawater and there is prior knowledge about its pool size in the NPSG (Björkman and Karl, 2001). For Pi uptake experiments, the samples were spiked with radiolabeled P in the form of 32P-orthophosphate (MP Biomedicals #064014L, carrier free). In experiments investigating ATP uptake rates and pool turnover, either ATP labeled in the gamma (γ) position with 32P, or with tritium on the purine base was used (MP Biomedicals #0124009; [2,8] 3H-ATP, specific activity 2.2 TBq mmol−1, #013502; γ-32P-ATP, specific activity ∼260 TBq mmol−1). We used both forms of labeled ATP to investigate differential uptake of the terminal P group of ATP versus the purine base. The incubations were typically labeled to a final activity of 80–185 kBq L−1 for 32Pi. However, in experiments designed for cell sorting by flow cytometry, samples were labeled to 1.8–3.7 MBq L−1 to achieve sufficient radioactivity in the sorted samples. Note that the relatively low specific activity of the 3H-ATP resulted in substantial amounts of ATP (0.5–1.7 nmol L−1) being added with the tracer, and could exceed the ambient concentrations of dissolved ATP by an order of magnitude in the upper water column (observed range at Station ALOHA: 0.06–0.21 nmol ATP L−1; Björkman and Karl, 2001).
For experiments conducted during the years 2002–2009 the incubation bottles were subsampled three to four times during a 6–8 h incubation period. In 2010 the sampling was conducted using end point filtrations only. To assess the incorporation of radioactivity into the particulate fraction 10–50 mL aliquots were routinely filtered onto polycarbonate (PC) membrane filters. The filters were rinsed 3 times with 5 mL each of filtered seawater and placed into scintillation vials. Scintillation cocktail (Ultima Gold LLT, Perkin Elmer) was added to each vial and the radioactivity counted on a Packard liquid scintillation counter (TriCarb 2770TR/LT), and quench corrected by using the internal SIE protocol.
Size Fractionation and Cell Sorting
Size fractionation of the microbial community was performed by filtering the whole water samples through PC membrane filters of different pore sizes. Typically these included the >2 and >0.2 μm size classes. In the later cruises in 2010, a third size category (>0.6 μm) was included to attempt to separate the NPB and PRO cells from the slightly larger sized SYN component. The size classes 0.2–0.6 and 0.6–2 μm were derived by the difference in particulate activity between the 0.2 and 0.6 μm, and the 0.6 and 2 μm filters respectively.
On the two cruises in 2010 (KM1013, KM1016) we used a Cytopeia Influx Mariner flow cytometer to sort radiolabeled cells into flow cytometrically defined microbial groups. The Influx was equipped with two lasers (448 and 457 nm) that were both focused through the same pinhole. This configuration improved the resolution of PRO populations from background noise in the upper water column, an important improvement. PRO cells frequently have very low chl fluorescence at the near-surface depths sampled and may otherwise have been undetectable in unstained samples, and may hence be mistaken for NPB in stained samples. Sheath fluid solution (BioSure cat. #1020) was diluted 16× with de-ionized water and filtered through a 0.2 μm PC membrane filter prior to use. Samples were analyzed live as soon after collection as possible, but typically within 8 h. To minimize continued uptake of Pi the samples were chased with non-radiolabeled Pi to a final concentration of ∼100 μmol L−1 P. In incubations where ATP had been the substrate, ATP was used as the cold chase to a final concentration of ∼100 μmol L−1 P. The reason not to use a preservative was that large, rapid initial losses of the radiolabeled material from the cells have been observed for 32Pi (∼15% h−1 over 3 h, stabilizing after 6 h at ∼70% loss; data not shown). This loss is possibly due to increased permeability of the cell membranes upon preservation with paraformaldehyde and subsequent loss of low molecular weight compounds. Our observations of these losses are much larger than previously recorded (Larsen et al., 2008; Michelou et al., 2011) and is expected to vary with growth rates, biosynthesis and other properties. The cold chased samples may also lose activity over time, as the result of recycling and isotope dilution effects, however, our limited dataset indicated no significant loss over 3 h, which is consistent with results from Talarmin et al. (2011). Two populations were flow sorted; PRO and NPB. The PRO population was defined by its forward scatter and chl-based red (692/40 nm) fluorescence characteristics, and further distinguished from SYN by its relative lack of a phycoerythrin signal (orange fluorescence). The NPB population was visualized by staining with SYBR Green I (Invitrogen; 1X final concentration, 5 μL mL−1 of sample). These samples were allowed to stain for a minimum of 30 min. This longer staining time has been found to give good results with unpreserved samples (Talarmin et al., 2011). All samples were amended with fluorescent, spherical reference beads (1 μm, Fluoresbrite), to maintain proper alignment and focus of the instrument. Because the PRO population cannot be uniquely distinguished in the SYBR stained samples in the upper water column, the NPB cell numbers were determined as the difference between PRO in unstained samples and the total cell numbers of the stained sample. The Influx data acquisition used the Spigot software (Cytopeia), and cell numbers for each PRO and NPB were determined using the FlowJo software (Tree Star Inc.). Microbial biomass estimates were based on the measured cell abundances multiplied by 10 fg C cell−1, or 30 fg C cell−1 for NPB and PRO respectively (Christian and Karl, 1994; Zubkov et al., 1998). Approximately 25,000–100,000 cells were sorted per sample depending on experiment and cell type, to achieve sufficient signal. Two sort streams were simultaneously collected directly into separate 7 mL plastic scintillation vials (Simport). The primary stream contained the microbial cells selected and the second the reference beads. The second vial containing the beads was used to account for radioactivity in the small volume of seawater associated with the sorted cells and was subtracted from the radioactivity obtained from the cells themselves. The radioactivity per cell was calculated and multiplied by the number of cells L−1 to obtain the Pi or ATP turnover or uptake rate. This assumes that the cells sorted constitute a representative subsample of the whole target population, even though a range of activities are likely to occur within a given group of microorganisms.
Calculations of P Uptake Rates and Kinetic Parameters
The Pi or ATP uptake rates and turnover times (Tt, d) were calculated as follows:
where t is the total 32P activity added (Bq L−1) and r is the rate of radiolabel uptake into the particulate fraction (Bq L−1 day−1). In time course experiments this rate was determined from linear regression of the incubation time and radioactivity of the filters. This calculation assumes that the specific activity of the substrate pool is constant during the incubation period. In our experiments <10% of the radiolabel was taken up during the incubation time, with the exception of the unamended control samples from OPEREX stations 15 and 36, where 31 and 70% was incorporated, respectively. At such high proportions of the radiolabel taken up, the calculated uptake rate will be biased as recycling of the pool is likely to have occurred, and may lead to underestimates of the actual rate of uptake. The rate of Pi or ATP uptake, expressed as nmol L−1 day−1, was calculated from the Tt of the radioactive tracer and the measured concentration of Pi, or an estimated concentration of ATP, of the samples. An ambient ATP concentration of 0.2 nmol L−1 was selected for the unamended seawater, based on previous, direct measurements of dissolved ATP within the same region of the NPSG by Björkman and Karl (2001). They reported mean summer time concentrations of dissolved ATP at 25 m at Station ALOHA of 0.17 ± 0.02 nmol L−1 (n = 3), and 0.14 ± 0.01 nmol L−1 (n = 15), within the top 100 m of the water column.
The Pi and ATP uptake kinetic parameters were calculated using the Hanes–Woolf linear transformation of the uptake rate versus substrate concentration relationship, as:
where S = substrate concentration, V = substrate uptake velocity and S/V = Tt of the P-pool. Note that the Tt was determined independently of S (see above). By plotting S against S/V the kinetic parameters Km and Vmax can be derived from the linear regression where the slope = 1/Vmax and the intercept = Vmax/Km. The 95% confidence interval of slope and intercept values of the linear regression was used to calculate the uncertainty in the Vmax and Km parameters. Chl a concentrations were used to normalize for biomass differences among experiments in the Vmax parameter to allow for the comparison of our results to published data. It is acknowledged that chl a is not the ideal biomass indicator as non-photosynthetic microorganisms also utilize P and clearly will not be included.
Statistical analyses were performed using StatPlus, by AnalyzeSoft Inc.
Results
Phosphate Concentrations, Chlorophyll A, Cell Numbers and Biomass
The ambient Pi concentrations ranged from near the detection limit of 3 nmol L−1 up to 110 nmol L−1, with a mean concentration of 54.9 ± 35.0 nmol L−1 (n = 22; Table 1). The lowest concentrations observed were located centrally within a cyclonic eddy field in 2009 (OPEREX stations 15 and 36), a feature that exhibited relatively low chl a biomass. Low Pi concentrations (∼10–30 nmol L−1) were also associated with enhanced chl a biomass such as at bloom stations (KM1016-4 and 5) or in late fall (HOT 142, 153) prior to the winter mixing of the upper water column (Table 1).
The population structure in terms of cell numbers for PRO, SYN, picoeukaryotes (PEUK), and NPB varied little over the 2007–2010 period (Table 2). PRO cell numbers ranged from 1.70 × 10⁸ to 2.84 × 10⁸ cells L−1, with an average abundance of 2.01 ± 0.42 × 10⁸ cells L−1 (n = 16) and PRO was the dominant group of chl a containing cells (>98% by numbers; the contribution of PRO to phototrophic biomass has been found to be >70% within the mixed layer; Campbell et al., 1994). SYN and PEUK population numbers were within the climatology for Station ALOHA at 1.1 ± 0.4 × 10⁶ and 0.7 ± 0.2 × 10⁶ cells L−1 respectively, with a combined contribution of <0.5% of the total cell numbers (n = 11, data not shown). The NPB cell abundance ranged from 4.03 × 10⁸ to 5.93 × 10⁸ cells L−1, with an average of 5.17 ± 0.71 × 10⁸ cells L−1. The relative contribution of PRO ranged from 23.2 to 36.5%, and NPB 63.5 to 76.6% (mean 27.8 ± 3.5%; 72.0 ± 3.4%; n = 16, respectively) of the total flow cytometry cell counts. The biomass contribution, derived from the cell abundances, ranged from 4.0 to 8.5 μg C L−1 for PRO and 4.0–6.3 μg C L−1 for NPB (mean 6.0 ± 1.2 μg C L−1; 5.2 ± 0.7; n = 16, respectively) with an average relative contribution by PRO of 51.7 ± 4.1% and NPB 44.6 ± 4.0% (Table 2), the remaining 3–4% of the biomass being SYN and PEUK. The cell numbers and biomass observed during this study were all within the climatology of Station ALOHA for these microbial groups (Table 2).
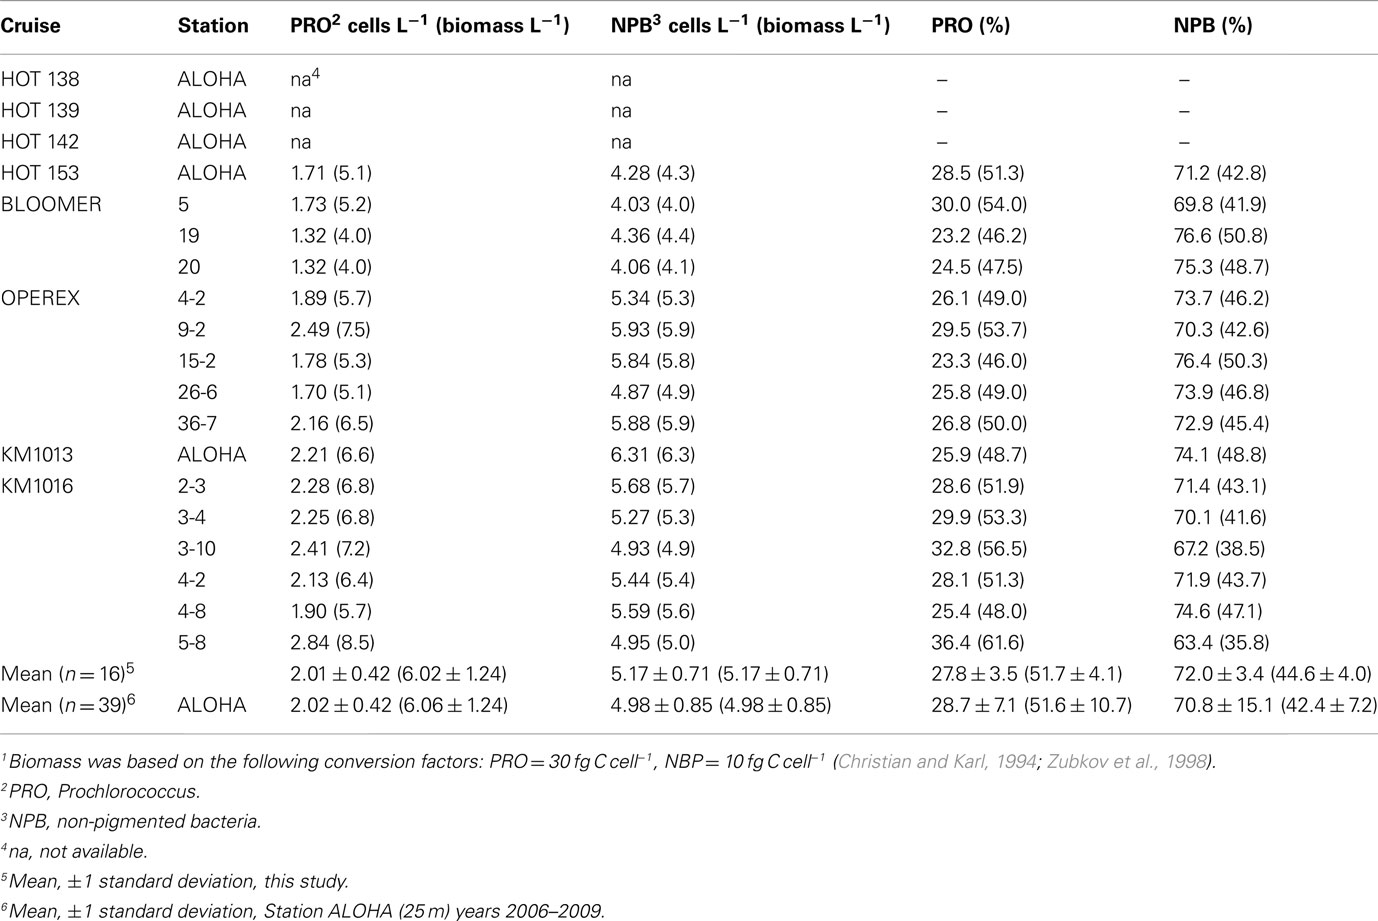
Table 2. Cell number (×108 L− 1) and, in parentheses, biomass1 (μg C L− 1) determined by flow cytometry of two different picoplankton groups, and their relative contribution (%) to the total cell numbers, or biomass.
Phosphorus Turnover Time and Uptake Rate at Ambient Concentrations
The Tt of the Pi pool ranged from 0.4 to 34 days, with a median of 12.5 days and mean of 14 ± 10 days (n = 19; Table 3). The shortest turnover times were associated with the cyclonic eddy during the OPEREX cruise. The measured Pi pool concentrations versus the calculated Pi uptake rates showed no correlation (r2 < 0.000; p > 0.05; n = 19; Figure 2A), whereas Tt and the ambient concentration of Pi showed a significant, positive relationship (r2 = 0.675; p < 0.001; n = 19; Figure 2B). The Tt in the >2 μm fraction was always much longer than for the smaller fractions (0.2–2 μm, or 0.6–2 μm; Table 3) reflecting their smaller contribution to the microbial biomass, and ranged from ∼16 to 300 days. The uptake into the >2 μm size fraction as a proportion of the total, was also typically small (mean 13.1 ± 7.3%, n = 15), but contributed more in areas where blooms were observed (e.g., BLOOMER station 20: 29.7%, KM1016, station 5: 23.7%: Figure 3). Within the cyclonic eddy feature the >2 μm fraction represented <3% of the total community Pi uptake (Figure 3). During cruises conducted in 2010, when a smaller pore size filter (0.6 μm, PC) was also included, Pi taken up into the smallest (0.2–0.6 μm) fraction still dominated the Pi assimilation and averaged 62.8 ± 3.4% (n = 5; Figure 4A). Pi uptake rates by the whole water microbial community ranged from 0.8 to 7.9 nmol L−1 day−1, with an average rate of 4.8 ± 1.9 nmol L−1 day−1 (n = 19; Table 4).
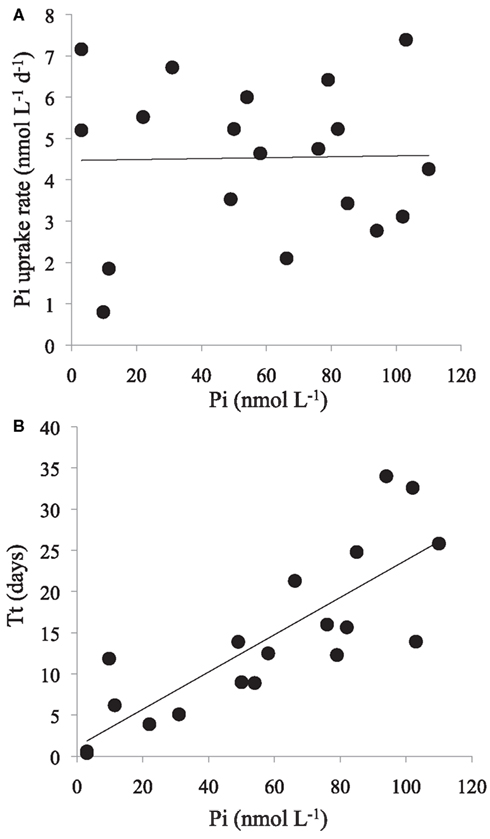
Figure 2. Phosphate (Pi) uptake by the whole water microbial community, and Pi pool turnover time (Tt), at ambient Pi concentrations. (A) Pi concentrations (nmol L−1; x-axis) versus Pi uptake rate (nmol L−1 day−1; y-axis); linear regression y = 0.001× + 4.47, r2 < 0.000; p > 0.05; n = 19. (B) Pi concentrations (nmol L−1; x-axis) versus Tt (days; y-axis); linear regression y = 0.226× + 1.19; r2 = 0.675; p < 0.001; n = 19.
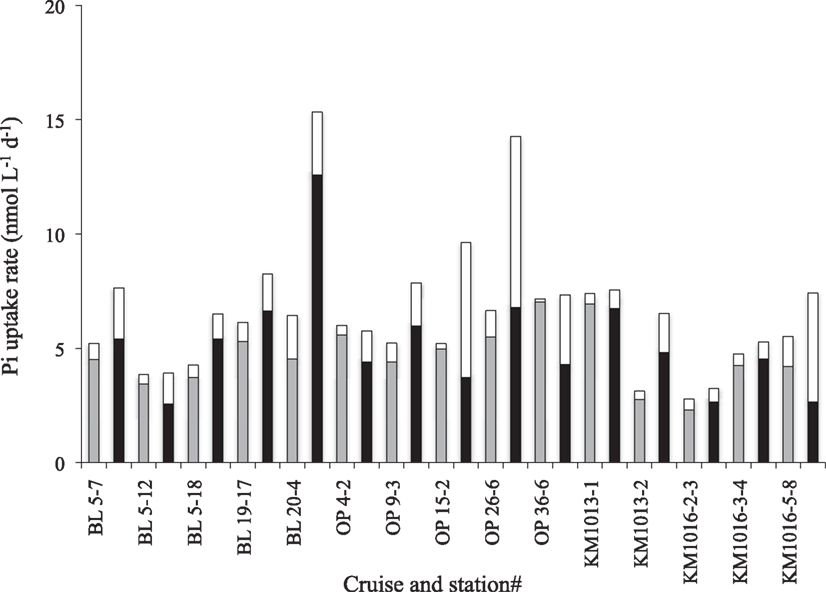
Figure 3. Distribution of Pi uptake rate (nmol L−1 day−1) into two different microbial size classes at ambient Pi concentrations [>2 μm (white), 0.2–2 μm (gray)] and amended with 150 nmol L−1 Pi [>2 μm (white), 0.2–2 μm (black)], during different cruises and experiments, BL, BLOOMER; OP, OPEREX (see Table 1).
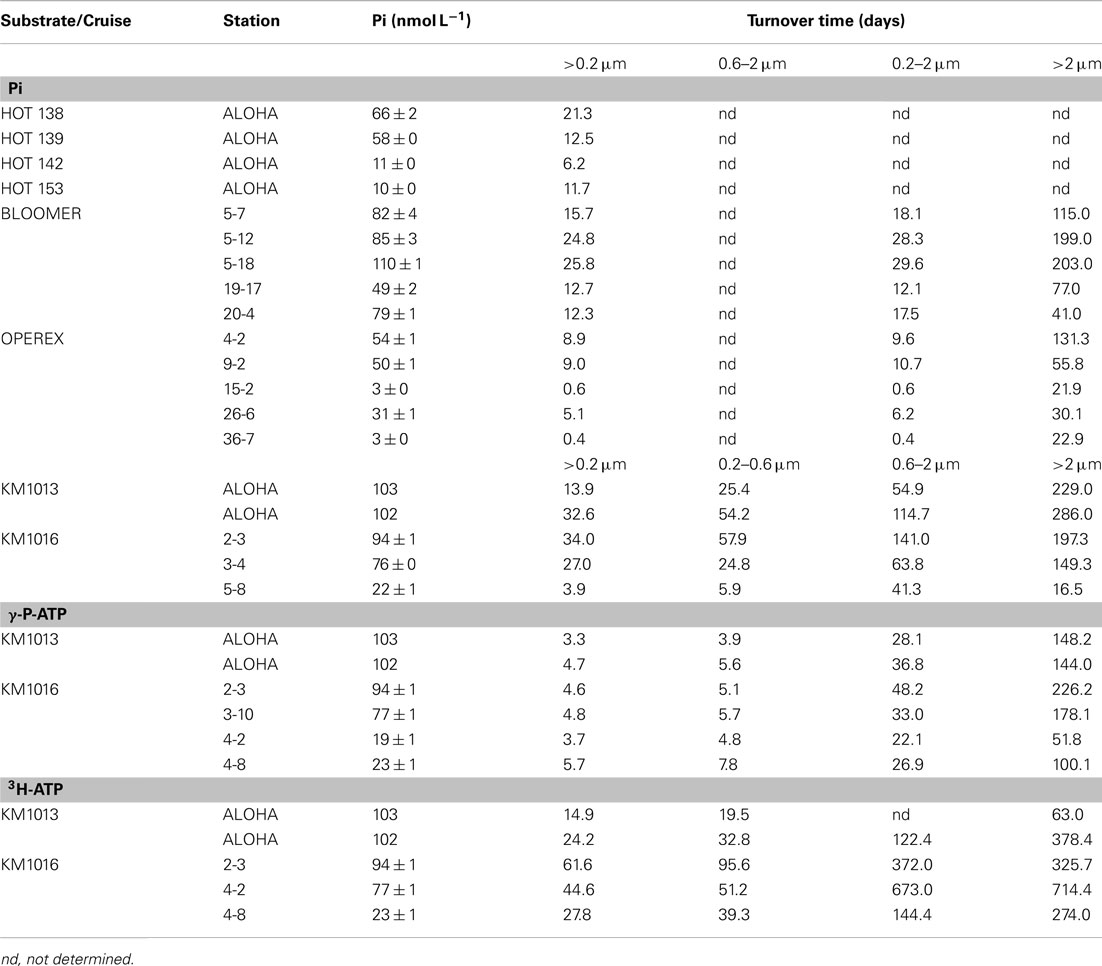
Table 3. Turnover time (days) in different picoplankton size classes determined from radiotracer uptake of inorganic phosphate (Pi) and of the γ-P, or the purine base of ATP.
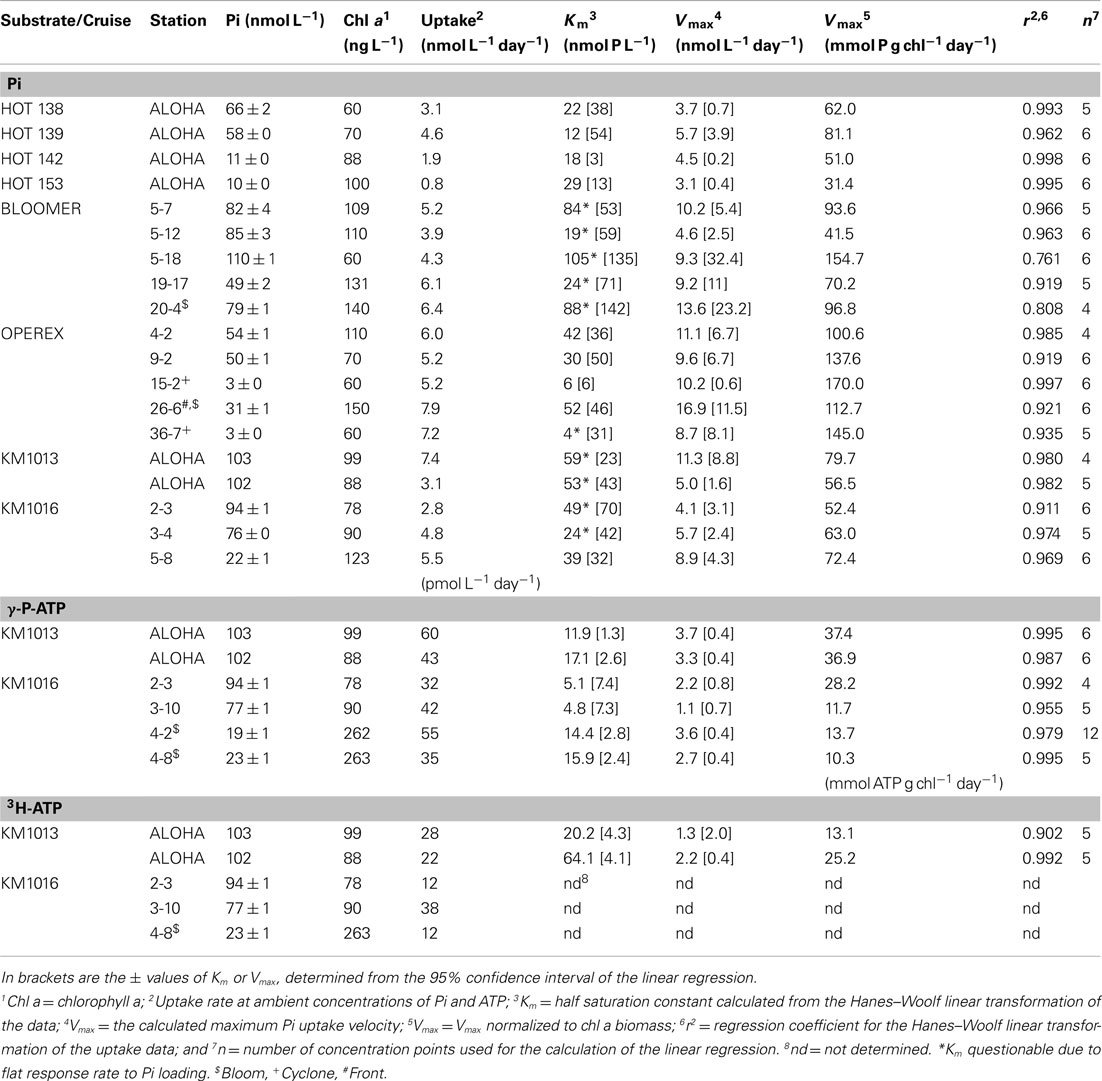
Table 4. Phosphate uptake rates at ambient concentrations of inorganic phosphate (Pi), γ-P-ATP, and 3H-ATP, and the calculated kinetic parameters; Vmax and Km, for incubations containing additional substrate, calculated from Hanes–Woolf linear transformation of the data.
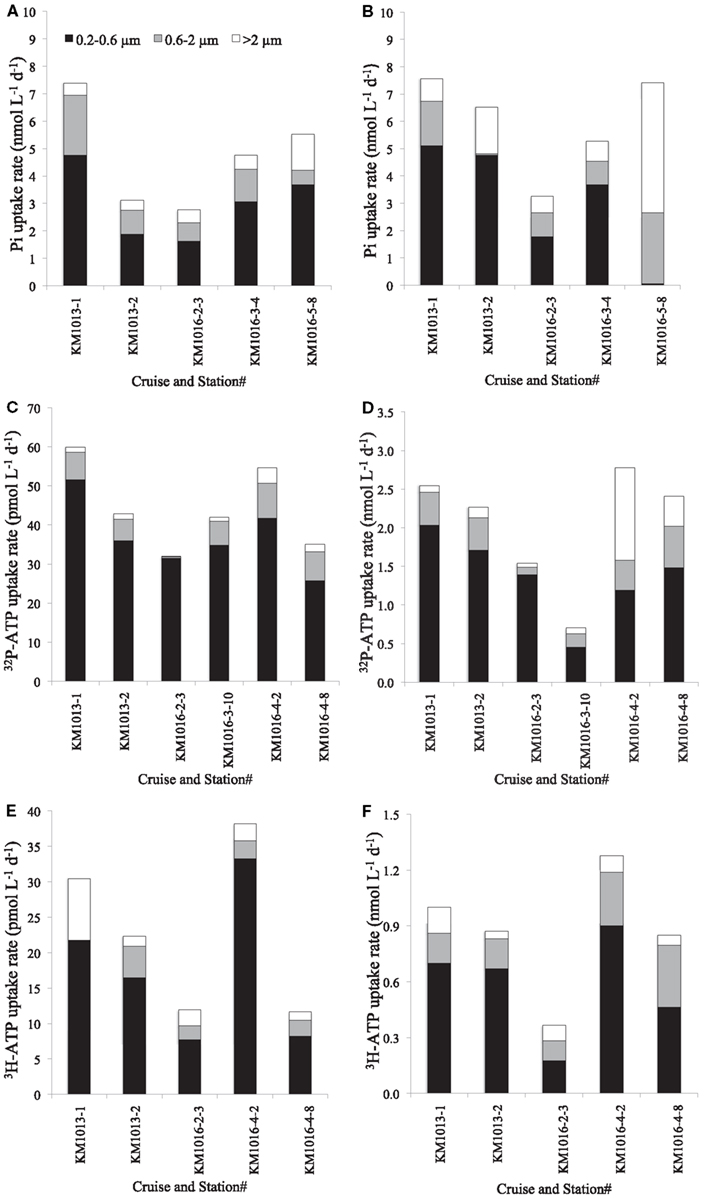
Figure 4. Distribution of Pi (A,B) and ATP [(C,D); γ-32P-ATP and (E,F); 3H-ATP] uptake rates into three different microbial size classes [>2 μm (white), 0.6–2 μm (gray) and 0.2–0.6 μm (black)] at ambient Pi concentrations (A) and at Pi amended with 150 nmol L−1 Pi (B) or ATP at ambient (C,E) or amended with 50 nmol L−1 ATP (D,F). Note that the rates of ATP uptake at ambient concentrations are in pmol L−1 day−1, whereas the amended rates are in nmol L−1 day−1.
The Tt of the γ-32P-ATP pool ranged from 3.3 to 5.7 days (mean 4.5 ± 0.8 days; n = 6) and was approximately three to seven times faster than the corresponding Tt for the Pi pool (Table 3). However, the Tt for 3H-ATP ranged from 15 to 62 days and was as long or longer than that of the Pi pool and 5–10 times longer than the Tt of the γ-P of ATP (Table 3). Note, however, that the relatively low specific activity of the 3H-ATP tracer, resulting in nmolar additions of ATP in these experiments, could well have affected the Tt, and most likely did affect the rates in the “zero” addition incubation. This potential biasing effect would diminish with increasing concentrations. Hence, the rates calculated for ambient concentrations are in all likelihood overestimates of the unamended rate. The calculated rates of ATP uptake were still low, reflecting the low concentrations of the ambient pool and measured in the pmolar range with γ-P-ATP uptake in the whole water community of 44.4 ± 10.9 pmol L−1 day−1 (n = 6; range 32–60 pmol L−1 day−1; Table 4). The uptake of 3H-ATP was approximately half of the rate observed for γ-P-ATP with a range in uptake rate from 12 to 38 pmol L−1 day−1 (mean 23 ± 11 pmol L−1 day−1; n = 5; Table 4). Size fractionated uptake into the >2 μm fraction was low for γ-P-ATP at 3.5 ± 2.5% of the total community uptake, whereas 83.5 ± 8.8% could be attributed to microorganisms in the 0.2–0.6 μm size class (Table 3; Figure 4C). In comparison, 14.5 ± 10.4% of the 3H-ATP uptake was by the >2 μm microorganisms and 73.1 ± 8.5% was by the smallest size class (Table 3; Figure 4E).
Kinetic Response to Increasing Concentrations of Pi or ATP
The often relatively high, and potentially saturating, ambient Pi concentrations at our study sites, resulted in low and variable kinetic responses to increased Pi loading on many occasions, making the determination of the Km parameter unreliable, as seen in the frequently high calculated uncertainty in the Km values (Table 4). Nevertheless, the mean Km in Pi uptake experiments for the whole data set was 40 ± 28 nmol L−1 (n = 19). The Vmax parameter for Pi uptake typically had a smaller associated uncertainty than Km, and Vmax ranged from 3.1 ± 0.4 to 16.9 ± 11.5 nmol L−1 day−1, or 31 to 170 mmol P g chl−1 day−1 (mean 8.2 ± 3.7 and 90 ± 40 respectively, n = 19; Table 4). The lowest Km values measured were in the cyclonic eddy sampled during OPEREX (stations 15 and 36), and were most likely due to the very low ambient Pi concentrations, which made it possible to resolve changes in uptake rates to relatively small increases in Pi concentration. Likewise the ambient Pi concentrations during HOT 142 and 153 were below the upper ocean long-term mean for Pi at Station ALOHA, and the addition of Pi resulted in increased uptake rates (Figures 5, and 6A). Yet, in other experiments (e.g., HOT 138, 139 and KM1016-2 and KM1016-3) the ambient Pi concentrations were above the long-term mean, and the rate responses were small and variable (Figure 5). Nevertheless, the Vmax data, although widely variable among experiments, were significantly higher (paired t-test, n = 19) than the measured rates at ambient concentrations, and Pi uptake rates in the unamended incubations were on average 61 ± 17% (n = 19) of Vmax. In addition, the Pi uptake rates in whole water, almost always showed increases at the highest Pi amendment (+150 nmol Pi L−1), and were significantly greater than the rates at ambient concentrations (one-way ANOVA, p = 0.02; df 27). The increase was predominantly the result of higher uptake rates in the largest (>2 μm) size class (Figures 3 and 4B) which increased approximately threefold, to an average contribution of 30 ± 17% (n = 15; Figure 3) of the total uptake. There were two notable exceptions; OPEREX stations 15 and 36 within the cyclonic eddy, where the Pi uptake rate in the >2 μm size class was ∼25 times higher at the 150 nmol L−1 Pi addition, than at ambient concentrations, and contributed to 61 and 42% of the total Pi uptake respectively (Figure 3). The uptake rate of the 0.2–2 μm size class was not statistically different from rates at ambient Pi concentrations, whereas the Pi uptake rate in the >2 μm class was (one-way ANOVA, p = 0.004, df 27). The response to increased concentrations of ATP on uptake of either the γ-P of ATP or the 3H-labeled purine, significantly increased the rate of uptake at all concentrations added, and could reach >70 times (mean 44 ± 17; n = 11) of the initial rate at the highest concentrations tested (Figures 4D,F and 6C,E). The relative rate increase was not different between the two differently labeled ATP. The greatest relative increase was observed in the largest size class, however, the contribution from the >2 μm cells was highly variable and ranged from 3 to 43% of the total rate (mean 12.5 ± 11.9; n = 11). In the three experiments where Pi and the two ATP sources were tested simultaneously (KM1013-1, -2, and KM1016-2-3) the contribution by the >2 μm size class increased by the same relative factor from ambient to the highest concentration tested. Furthermore, whereas the γ-P uptake appeared to be saturating at the higher end of the tested amendments (Figure 6C), the 3H-ATP did not show the same type of kinetics, and typically did not appear to saturate even at the highest tested ATP amendment (Figure 6E). Hence, kinetic parameters were calculated for only two 3H-ATP experiments (KM1013-1, -2), but for all six γ-P-ATP experiments (Table 4; Figure 6C). In contrast to Pi kinetics, the γ-P uptake at ambient concentrations was only a small fraction (2–6%) of the calculated Vmax for γ-P uptake, the latter ranging from 1.1 to 3.7 nmol L−1 day−1 (mean 2.8 ± 1.0 nmol L−1 day−1, n = 6). The same was true for 3H-ATP with uptake rates at ambient concentrations at 1–2% of the maximum rates (Vmax 1.3 and 2.2 nmol L−1 day−1; Table 4). The Km for γ-P-ATP ranged between 4.8 and 17.1 nmol L−1 (mean 11.5 ± 5.4 nmol L−1; n = 6) and was 20.2 and 64.1 nmol L−1 in the two 3H-ATP experiments respectively. Similar to the Pi incubations, the calculated Vmax for γ-P-ATP uptake exceeded the maximum measured rate at the +50 nmol L−1 ATP addition by 37 ± 14%. The relative distribution of γ-P uptake into the different size classes at the highest amendment (+50 nmol L−1 ATP) showed less of a change than the Pi amended samples, except for KM1016-4 where the contribution from the >2 μm fraction was 43%, or a sixfold change. In the other experiments, the contribution from the >2 μm size class ranged from 3.2 to 16.4% of the total uptake and was not significantly different from those at ambient concentrations (one-way ANOVA).
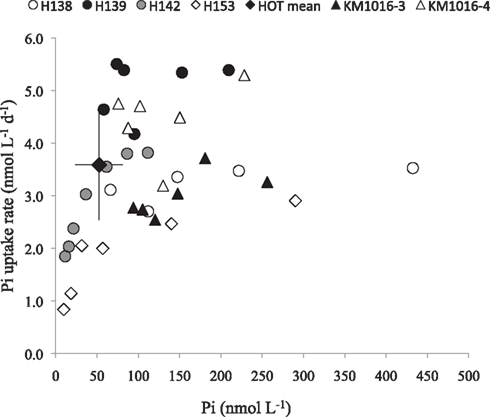
Figure 5. Examples of response in Pi uptake rates to Pi additions in six separate experiments. The mean Pi concentration and Pi uptake rate at Station ALOHA (filled diamond; n = 16; Björkman and Karl, 2003). Error bars are ±1 standard deviation.
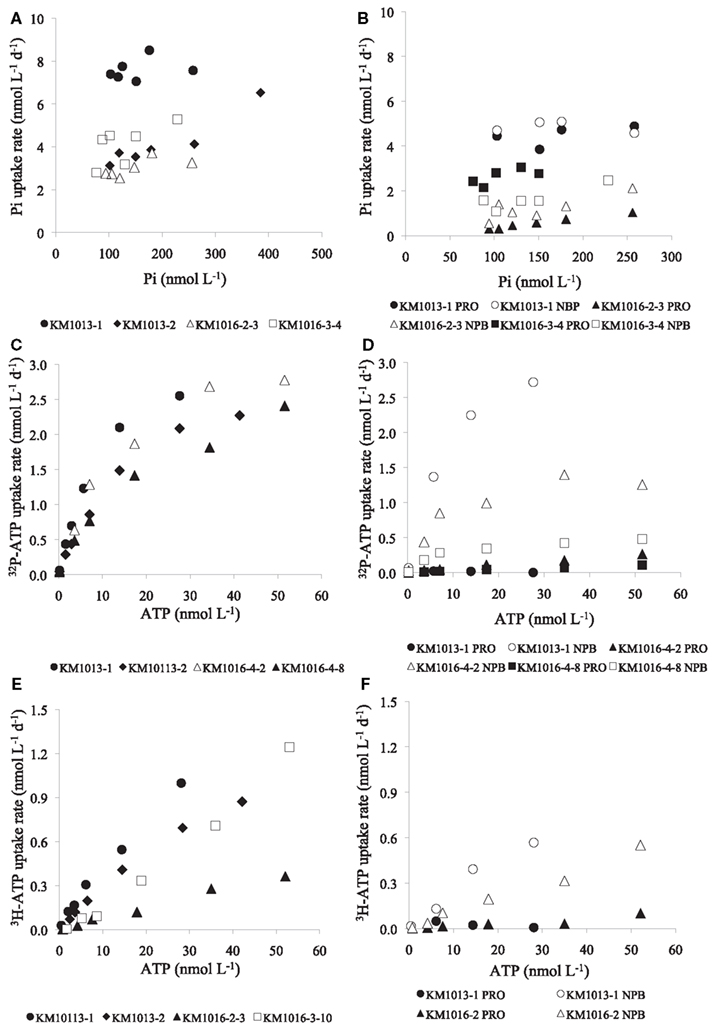
Figure 6. Examples of response in Pi and ATP uptake rates (nmol L−1 day−1) to increasing concentrations of Pi or ATP in whole water samples (>0.2 μm), and uptake into Prochlorococcus (PRO) or non-pigmented bacteria (NPB) as determined by flow cytometric cell sorting. (A) Pi uptake in whole water and (B) Pi uptake in PRO and NPB, (C) ATP uptake in whole water and (D) uptake rate in PRO and NPB (by γ-P-ATP), (E) ATP uptake in whole water and, (F) uptake rate in PRO and NPB (by 3H-ATP).
Group and Cell Specific Uptake and Kinetic of Pi and ATP
Uptake of Pi and ATP into group specific compartments, using flow cytometric cell sorting, was investigated on selected samples from experiments conducted in the summer of 2010 (KM1013 and KM1016). The Pi uptake by PRO, at ambient concentrations, ranged from 1.6 to 4.4 nmol L−1 day−1 and by NPB from 0.8 to 4.7 nmol L−1 day−1 (Table 5, Figure 6B) with a ratio of PRO:NPB uptake of 1.4 ± 0.5 (n = 3). The mean cell specific uptake (in amol cell−1 day−1; where amol = attomol = 10−18 mol) was three times higher for PRO relative to the NPB (ratio 3.0 ± 0.4; n = 3) and the Pi uptake rate ranged from 5.4 to 20.1 amol cell−1 day−1 and 1.6 to 7.4 amol cell−1 day−1 for PRO and NPB populations respectively. The Km parameter showed no clear pattern between PRO or NPB, and the data are insufficient for any conclusive statement (Table 5). In contrast to Pi, the uptake of the γ-P of ATP was almost exclusively by the NPB with an average contribution to the total uptake of 95 ± 3% (n = 4) and PRO showed higher Km values than did NPB (Table 5, Figure 6D). The mean per cell uptake of γ-P of ATP ranged from 0.024 to 0.109 amol L−1 day−1 and 0.002 to 0.015 amol L−1 day−1 for the NPB and PRO populations respectively. The very limited data on the group specific uptake of 3H-ATP also showed dominance by the NPB population, although the rates were lower than those observed for γ-P by ∼75% (Table 5, Figure 6F).
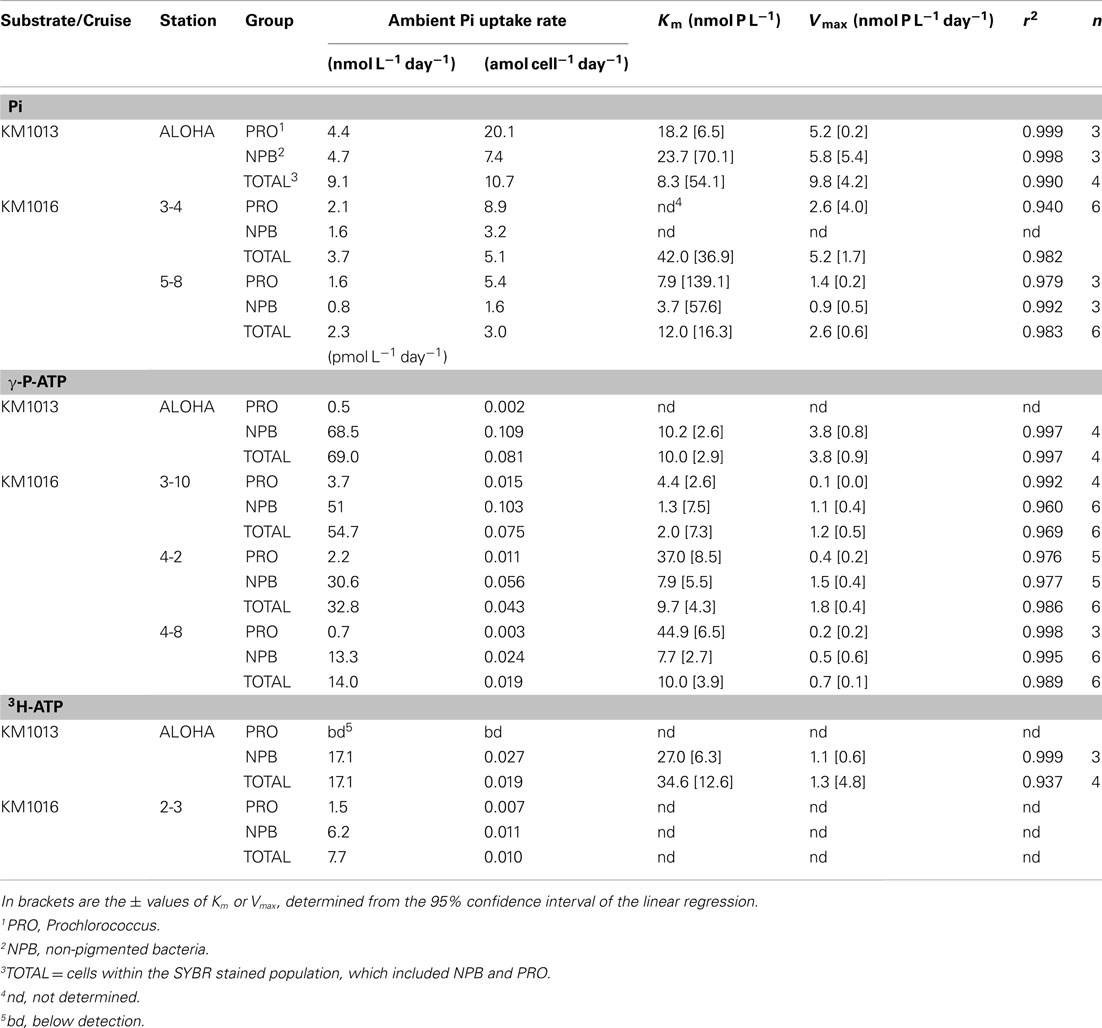
Table 5. Microbial group, and cell specific phosphate uptake rates of inorganic phosphate (Pi), γ-P-ATP and 3H-ATP at ambient concentrations; and the calculated kinetic parameters Vmax and Km, for incubations containing additional substrate.
Discussion
The NPSG is characterized by its perennially stratified conditions and prevailing low nutrient concentrations within the euphotic zone (Mann and Lazier, 1991). Within this ecosystem nutrients, and particularly P, are intensely recycled, although the flux rates among biogeochemical compartments are still poorly constrained. The dynamics of P uptake and turnover of the Pi pool have been studied for some time within oligotrophic gyre environments (Perry and Eppley, 1981; Sorokin, 1985; Björkman et al., 2000; Duhamel et al., 2011). However, these studies have revealed great variability in rates, e.g., the Tt appear to be shorter today (∼days to weeks), than reported in the 1980s (weeks to months), possibly reflecting changes in P inventories, or diminishing supplies of bioavailable P. Indeed, the presence of alkaline phosphatase activity (Perry, 1976; Duhamel et al., 2010, 2011), C:P and N:P ratios of the particulate pools (Hebel and Karl, 2001; Karl et al., 2001) indicate an ecosystem where P is in relatively short supply. The high variability in the upper ocean Pi concentrations observed in this study (3–110 nmol L−1) illustrates the great temporal and spatial heterogeneity in the near-surface Pi inventories. This is not atypical for this region, and the NPSG has been shown to be a much more dynamic system in biogeochemical parameters than previously assumed (Karl and Lukas, 1996; Karl, 1999; Corno et al., 2007; Calil and Richards, 2010), but emphasizes the variable nutrient fields the microbial community experiences over relatively short time scales. The potential bioavailability of dissolved organic P (DOP), which pool size typically is much larger than that of Pi in the NPSG (Karl et al., 1997; Karl and Björkman, 2002), should constitute a nutritional buffer to the microbial community. However, the bioavailability of DOP is less well documented, but there is evidence that select compounds groups, such as nucleotides, are available on short time scales (Azam and Hodson, 1977; Ammerman and Azam, 1985, 1991; Björkman and Karl, 1994; Björkman et al., 2000; Løvdal et al., 2007) although Pi appears to be the most readily bioavailable form of P (Cembella et al., 1984; Cotner and Wetzel, 1992). Nevertheless, it has been shown that DOP can supply up to half of the P taken up by microorganisms in the NPSG, but on time scales of hours to days, this P utilization may constitute only a minor (1–5%) fraction of the potentially available DOP pool (Björkman and Karl, 2003).
Pi and ATP Uptake in Whole Water, and Size Fractionated Microbial Communities
In this study, the Tt of the P-pool for the whole water microbial community appeared to correlate with Pi concentrations, whereas the Pi uptake rates were not correlated to the size of the ambient Pi pool. This may indicate that overall Pi requirements of the extant community often were met at the prevailing Pi inventories in the upper water column in the NPSG. In addition, turnover times of the P-pool were typically in the order of a week to weeks in all but a few experiments (Tt of ∼0.5 days) that coincided with unusually low concentrations of ambient Pi. Hence, it follows that in the majority of our experiments the kinetic response to increased Pi amendments of the extant whole water community was muted, and the microorganisms were most likely not proximately controlled by Pi availability. The conclusion that the NPSG is not currently under P limitation has been drawn from other investigations on P dynamics in the NPSG (Björkman et al., 2000; Van Mooy and Devol, 2008; Duhamel et al., 2011). However, the calculated Vmax parameter was always higher than the observed uptake rates at ambient Pi concentrations, and the response was predominantly driven by increased uptake by the largest size class (>2 μm) tested. This may indicate that although the whole water microbial community does not appear to be limited by Pi availability, the larger celled members may be at a competitive disadvantage at the prevailingly low Pi concentrations. Additionally, we observed suppressed rates at ambient Pi concentration, and increased uptake rate with Pi additions (e.g., HOT 142, 153, KM1016-5), when the ambient concentrations of Pi were well below the long-term mean for Station ALOHA (0–25 m; 58 ± 3 and 38 ± 8 nmol L−1, ±SE; n = 29 and 10; June-August and November respectively; 1999–2009). In contrast, we did not observe suppressed rates within the cyclonic eddy during the OPEREX cruise. This feature had exceedingly low Pi concentrations and turnover times of less than a day, but rates were as high as at stations with much higher Pi concentrations. These stations also had elevated AP activities relative to other stations outside of the eddy (Duhamel, personal communication). The latter has also been observed in the NPSG correlating with low Pi concentration (Duhamel et al., 2010). Another difference shared among these stations was that the Pi uptake by >2 μm plankton contributed a smaller fraction than in other experiments, and this group may have been unable to compete for Pi under the extant conditions. Nevertheless, the response in this size class to Pi additions were among the highest observed here, together with OPEREX station 26, and KM1016-5-8 (Figure 3). The OPEREX station 26 was located in the frontal zone between the cyclonic feature and an anti-cyclonic eddy, and was associated with elevated particulate material and concentrations of chl a. This observed increase in biomass has been attributed to physical forcing within this area, resulting primarily in particle accumulation, and possibly higher production rates. At KM1016-4 and -5 there were phytoplankton blooms in progress manifested in high chl a, and also in increased rates of primary and bacterial production (data not shown). These dynamics point to situations where Pi inventories could be drawn down to concentrations where only the smallest components of the community are at a competitive advantage, as observed in other P-limited systems such as the Mediterranean Sea (Van Wambeke et al., 2002; Moutin et al., 2005; Thingstad et al., 2005).
However, in these oligotrophic systems the effective competition for P is most likely within the domain Bacteria, and in the NPSG the <2 μm size class will contain the dominant photosynthesizers, both in terms of numerical abundance and biomass, Prochlorococcus sp., as well as the second most abundant Synechococcus sp. (Campbell and Vaulot, 1993; Campbell et al., 1994, 1997). Synechococcus abundance and biomass in the NPSG is however very low (<0.1% of total bacterial cell numbers, <1% of the microbial biomass). We did find that the 0.2–2 μm size class always dominated Pi uptake, both at ambient and amended concentrations, but the response in Pi uptake rate was not significantly different between the ambient and the highest tested addition. However, the >2 μm size class increased their uptake rates significantly more in response to high Pi, and their relative contribution to the total Pi uptake also increased. This response may be interpreted as a form of luxury uptake, and possibly the potential of these larger cells to rapidly capitalize on high concentration nutrient pulses, an ability the smaller microbial cells may lack. In addition, larger cells have been shown to take up more P, and have higher primary production, than their contribution to the chlorophyll inventory would imply (Li et al., 2011; Mahaffey et al., 2012) and, as shown here, contributes progressively more the higher the P concentration. This could well be related to the larger cells’ higher capacity for rapid uptake of Pi at high concentrations (Rhee, 1972), but also, their relatively higher Km will make them less competitive with both phototrophic and heterotrophic bacteria under the typically oligotrophic conditions in the NPSG. Perry (1976) conducted pioneering work in the NPSG with regard to P dynamics and kinetic response to P amendments. She found Vmax values of ∼80 mmol P L−1 day−1 g chl a−1, which is very similar to the chl a normalized Vmax for Pi uptake that we found. However, our calculated Km was typically substantially lower (mean of ∼40 versus 180 nmol L−1), possibly due to the lower P additions (+10 to 150 nmol P L−1 versus 0.1 to 5 μmol P L−1) used in our field experiments, but could also reflect differences in the microbial community composition.
Uptake of ATP is most likely mediated by the bacterial ectoenzyme 5′-nucleotidase (5′Nase) that recognizes the purine or pyrimidine bases of nucleotides. This enzyme sequentially hydrolyzes all the three phosphate groups of ATP, a mechanism that appears to be requisite for the subsequent uptake of either the Pi or nucleoside components (Bengis-Garber and Kushner, 1982). Several studies have attributed the hydrolysis of ATP in marine environments to 5′Nase (Ammerman and Azam, 1985; Björkman and Karl, 1994) and it has been proposed that this activity alone can sustain bacterial P-requirements (Tamminen, 1989; Ammerman, 1991). In addition, 5′Nase activity often results in substantial regeneration of Pi released into the surrounding waters (Tamminen, 1989; Björkman and Karl, 1994; Siuda and Güde, 1994) possibly indicating a preference for the nucleoside over the Pi by these bacteria. AP can also hydrolyze ATP, and the measurement of AP activity is often used to assess P stress or limitation in marine microorganisms (Dyhrman and Ruttenberg, 2006; Van Wambeke et al., 2008; Duhamel et al., 2010). AP activity has been observed in the NPSG but rates are typically low relative to what would be expected in P-limited environments (Perry, 1972; Duhamel et al., 2011). Duhamel et al. (2011), estimated that AP activity would only regenerate a couple of percent of Pi to the extant pool. Nevertheless, if the Pi derived from AP activity was all taken up, this source could provide up to ∼40% of the net P uptake at Station ALOHA. Here we observed a more rapid turnover of the ATP pool relative to the Pi pool by approximately a factor of five. This reconfirms that ATP, although only a small fraction of the total DOP, is preferentially utilized by the microbial community. Björkman and Karl (2005), using 3H-ATP, estimated that the flux through this P-pool could be five times faster than that of the bulk DOP pool. They showed Km values ranging from 1 to 26 nmol L−1 and Vmax of 0.3–1.4 nmol L−1 day−1 at their lowest concentrations (0.2–57 nmol L−1). Finally, they reported what appeared to be multiphasic uptake of ATP, with potentially much higher Vmax rates and Km values at high ATP concentrations (Björkman and Karl, 2005), a phenomenon also observed for the microbial utilization of glucose (Azam and Hodson, 1981). Multiphasic kinetics are to be expected with mixed microbial assemblages, which most likely possess different metabolic traits and nutrient uptake potentials. The ATP uptake rates, as well as the kinetic parameters found here, are similar to those presented by Björkman and Karl (2005).
In a study conducted in the Sargasso Sea, ATP uptake rates ranging from 120 to 960 pmol L−1 day−1 were reported (Casey et al., 2009). However, they based their calculation on an assumed ATP pool size of 1 nmol L−1, i.e., a factor of five higher than the concentration adopted in this study, based on previous, direct measurement within the NPSG. If taking this difference into account, our rates are comparable to those observed from the North Atlantic subtropical gyre. Casey et al. (2009) also reported Pi uptake rates that were similar to those measured in this study, as well as rates three to four times higher. This could be a result of the dominance of PRO in the NPSG versus the much greater proportion of SYN found in the Sargasso Sea, with the higher rates possibly driven by SYN.
In addition, we observed a difference in Tt at ambient concentrations between Pi and ATP in the smallest size class (0.2–0.6 μm) compared to the largest (>2 μm). The relative difference in P turnover time [Tt(>2 μm)/Tt(0.2–0.6 μm)] was approximately fourfold greater for γ-P-ATP than Pi (e.g., KM1013; Tables 3 and 4). This could indicate that uptake into the larger size class was not by the direct hydrolysis of ATP, but uptake of Pi regenerated from ATP and mixed into the ambient Pi pool. Furthermore, we observed that the turnover time of 3H-ATP was substantially longer than that of γ-P-ATP in all size classes, and that the calculated uptake rates at ambient concentrations were about twice as high for γ-P-ATP. This may also indicate that ATP must be hydrolyzed before becoming generally available and could also be related to differential uptake of the P versus the purine moiety. Nevertheless, it should be noted that the 3H in 2,8-position of ATP may exchange during metabolic processes and be partially lost as 3H2O. We did not take this into account in our calculations.
Group and Cell Specific Uptake and Utilization of Pi and ATP
In recent years the application of sorting radiolabeled microbial cells by flow cytometry has lead to new insights into group specific uptake and utilization of compounds such as different amino acids (Zubkov et al., 2004; Michelou et al., 2007; Mary et al., 2008), as well as Pi and ATP (Larsen et al., 2008; Casey et al., 2009; Michelou et al., 2011).
In the oligotrophic Sargasso Sea, Casey et al. (2009) showed that SYN and PRO were superior to larger chl pigmented cells in acquiring P from both Pi and ATP. They concluded that SYN and PRO were about equally competitive for Pi, whereas P derived from ATP was always less than Pi for PRO (approximately by a factor of 2–10). Michelou et al. (2011), in a study conducted at the same time and place as Casey et al. (2009), focused on the relative uptake of Pi and ATP by PRO and heterotrophic bacteria (equivalent to our NPB population). They found that heterotrophic bacteria dominated the Pi uptake on a community basis, but had an approximately equal per cell rate of uptake as PRO. Our data differ from this in that PRO per cell rates exceeded those of the NPB population by approximately threefold. These divergent results may reside in the relative biomass difference between PRO and NPB (here a factor 3:1 PRO:NPB), and therefore a higher requirement of P for balanced growth in PRO, or in the ability of PRO to substitute sulfur for P in its membrane lipids, a phenomenon that seems to be more pronounced during P stress (Van Mooy et al., 2009) and hence may be more prevalent under ultra-low P conditions found in the North Atlantic. Additionally, the observed differences between experiments conducted in the NPSG and the Sargasso Sea could also have originated from the experimental designs employed. We incubated our samples at the light level from which the samples had been collected, whereas both studies in the Sargasso Sea (Casey et al., 2009; Michelou et al., 2011) incubated their samples in the dark. It has been shown that light enhances the uptake of amino acids in PRO (Michelou et al., 2007) and more recently, Duhamel et al. (in review) report that Pi uptake in PRO also is enhanced by light.
Our results with respect to group specific utilization of ATP suggest that PRO is not competitive relative to NPB at any concentration tested, and ATP hydrolysis and subsequent P acquisition by NPB appeared tightly coupled. Although, in culture experiments, various strains of PRO have been shown to be able to fulfill their P-requirements using ATP as the sole source of P (Moore et al., 2005), and may still have the requisite enzymes for nucleotide hydrolysis. Furthermore, the substantially shorter Tt for γ-P than for Pi in experiments where a direct cross comparison could be made (e.g., KM1016-2-3), imply that ATP utilization and uptake of γ-P appear to occur independently from the uptake of Pi. This is consistent with the activities of 5′Nase, an enzyme known not to be inhibited by Pi (Bengis-Garber and Kushner, 1981, 1982; Ammerman and Azam, 1985). These results indicate that utilization of ATP appears to be mediated primarily by the NPB and again suggest that the uptake of the γ-P by the larger size classes may be the result of the γ-P released and mixed with the ambient Pi pool prior to uptake. Whereas the uptake of ATP could almost exclusively be attributed to the NPB population in the NPSG, no statistical difference in uptake was found between PRO and NPB in the Sargasso Sea (Michelou et al., 2011). Hodson et al. (1981) reported rates of ATP uptake on a per cell basis ranging from ∼0.0024 to 0.72 amol ATP cell−1 day−1 (median rate of ∼0.033 amol cell−1 day−1) in bacterial populations from the outer continental shelf along the east coast of the USA. These rates are of similar magnitude as we observed in this study (whole population: ∼0.02–0.08 amol cell−1 day−1). In contrast, the average per cell uptake of ATP in the Sargasso Sea, at ambient concentrations, were substantially higher than what we observed in the NPSG [∼0.8 and 2.2 amol cell−1 day−1, versus ∼0.008 ± 0.004 and 0.07 ± 0.04 amol cell−1 day−1 (n = 4), for PRO and NPB respectively], again possibly indicative of the more P-stressed environment of the Sargasso Sea. Indeed, a recent comparative, population genomics study of PRO and Pelagibacter, from both HOT and Bermuda Atlantic Time-series Study (BATS) sites, found a significantly higher abundance of genes related to P acquisition and metabolism at BATS for both PRO and Pelagibacter (Coleman and Chisholm, 2010). Such divergences among microbial genotypes may also explain the apparent differences between our results, particularly in terms of ATP utilization, within the NPSG versus the studies conducted in the periodically severely P-starved Sargasso Sea.
In closing, the implementation of flow cytometric cell sorting, in combination with more traditional filtration techniques, in the investigation of Pi or DOP utilization by specific microorganism groups, has provided a novel tool to begin the unraveling of the intricate P dynamics in the vast subtropical ecosystems. Our results imply that the utilization of different phosphorus resources by the smallest phototrophic cyanobacterium PRO and by NPB may constitute a niche separating strategy. Although apparently equally competitive for Pi, NPB was nearly exclusively responsible for the utilization of ATP. This could be an important mechanism by which groups of microorganisms co-exist and compete for limited resources in the sunlit oligotrophic environments of the subtropical and tropical oceans. Further studies of Pi and DOP dynamics should yield exciting new insights into the microbial mediation of the P flux through the particulate and dissolved pools.
Conflict of Interest Statement
The authors declare that the research was conducted in the absence of any commercial or financial relationships that could be construed as a potential conflict of interest.
Acknowledgments
We thank the Captains and crews of the R/V Kilo Moana and R/V Kaimikai-O-Kanaloa for support at sea. We thank Benjamin van Mooy (KM1013) and Matthew Church (KM1016) for allowing us to participate in KM1013 and KM1016. We thank Ken Doggett for invaluable assistance with the flow cytometer, Scott Grant and Donn Viviani for assistance with MatLab programming. This work was supported by grants from the Gordon and Betty Moore Foundation’s Marine Microbiology Initiative and The National Science Foundation OCE 0326616 and EF 04-24599, awarded to D. M. Karl.
References
Ammerman, J. W. (1991). “Role of ecto-phosphohydrolases in phosphorus regeneration in estuarine and coastal ecosystems,” in Microbial Enzymes in Aquatic Environments, ed. R. J. Chrôst (New York: Springer Verlag), 165–186.
Ammerman, J. W., and Azam, F. (1985). Bacterial 5’-nucleotidase in aquatic ecosystems: a novel mechanism of phosphorus regeneration. Science 227, 1338–1340.
Ammerman, J. W., and Azam, F. (1991). Bacterial 5’-nucleotidase activity in estuarine and coastal waters. Characterization of enzyme activity. Limnol. Oceanogr. 36, 1427–1436.
Azam, F., and Hodson, R. E. (1977). Dissolved ATP in the sea and its utilisation by marine bacteria. Nature 276, 696–698.
Azam, F., and Hodson, R. E. (1981). Multiphasic kinetics for D-glucose uptake by assemblages of natural marine bacteria. Mar. Ecol. Prog. Ser. 6, 213–222.
Bengis-Garber, C., and Kushner, D. J. (1981). Purification and properties of 5’-nucleotidase from membrane of Vibrio costicola. J. Bacteriol. 146, 24–32.
Bengis-Garber, C., and Kushner, D. J. (1982). Role of membrane bound 5’-nucleotidase in nucleotide uptake by a moderate halophile Vibrio costicola. J. Bacteriol. 149, 808–815.
Björkman, K. M., and Karl, D. M. (1994). Bioavailability of inorganic and organic phosphorus compounds to natural assemblages of microorganisms in Hawaiian coastal waters. Mar. Ecol. Prog. Ser. 111, 265–273.
Björkman, K. M., and Karl, D. M. (2001). A novel method for the measurement of dissolved adenosine and guanosine triphosphate in aquatic habitats: applications to marine microbial ecology. J. Microbiol. Methods 47, 159–167.
Björkman, K. M., and Karl, D. M. (2003). Bioavailability of dissolved organic phosphorus in the euphotic zone at Station ALOHA, North Pacific Subtropical Gyre. Limnol. Oceanogr. 48, 1049–1057.
Björkman, K. M., and Karl, D. M. (2005). Presence of dissolved nucleotides in the North Pacific Subtropical Gyre and their role in cycling of dissolved organic phosphorus. Aquat. Microb. Ecol. 39, 193–203.
Björkman, K. M., Thomson-Bulldis, A. L., and Karl, D. M. (2000). Phosphorus dynamics in the North Pacific subtropical gyre. Aquat. Microb. Ecol. 22, 185–198.
Calil, P. H. R., and Richards, K. J. (2010). Transient upwelling hot spots in the oligotrophic North Pacific. J. Geophys. Res. 115, C02003.
Campbell, L., Liu, H., Nolla, H. A., and Vaulot, D. (1997). Annual variability of phytoplankton and bacteria in the subtropical North Pacific Ocean at Station ALOHA during the 1991-1994 ENSO event. Deep Sea Res. 44, 167–192.
Campbell, L., Nolla, H. A., and Vaulot, D. (1994). The importance of Prochlorococcus to the community structure in the central North Pacific. Limnol. Oceanogr. 39, 954–961.
Campbell, L., and Vaulot, D. (1993). Photosynthetic picoplankton community structure in the subtropical North Pacific Ocean near Hawaii. Deep Sea Res. 40, 2043–2060.
Casey, J. R., Lomas, M. W., Michelou, V. K., Dyhrman, S. T., Orchards, M. W., Ammerman, J. W., and Sylvan, J. B. (2009). Phytoplankton taxon-specific orthophosphate (Pi) and ATP utilization in the western subtropical North Atlantic. Aquat. Microb. Ecol. 58, 31–44.
Cembella, A. D., Antia, N. J., and Harrison, P. J. (1984). The utilization of inorganic and organic phosphorous compounds as nutrients by eukaryotic microalgae: a multidisciplinary perspective: part 1. Crit. Rev. Microbiol. 10, 317–391.
Chadwick, O. A., Derry, L. A., Vitousek, P. M., Huebert, B. J., and Hedin, L. O. (1999). Changing sources of nutrients during four million years of ecosystem development. Nature 397, 491–497.
Christian, J. R., and Karl, D. M. (1994). Microbial community structure at the US-Joint Global Ocean Flux Study Station ALOHA: inverse methods for estimating biochemical indicator ratios. J. Geophys. Res. 99, 14269–14276.
Church, M. J., Jenkins, B. D., Karl, D. M., and Zehr, J. P. (2005a). Vertical distribution of nitrogen-fixing phylotypes at Stn ALOHA in the oligotrophic North Pacific Ocean. Aquat. Microb. Ecol. 38, 3–14.
Church, M. J., Short, C. M., Jenkins, B. D., Karl, D. M., and Zehr, J. P. (2005b). Temporal patterns of nitrogenase gene (nifH) expression in the oligotrophic North Pacific Ocean. Appl. Environ. Microbiol. 71, 5362–5370.
Codispoti, L. A. (1989). “Phosphorus vs. nitrogen limitation in new and export production,” in Productivity of the Ocean: Present and Past, eds W. H. Berger, V. S. Smetacek, and G. Wefer (Chichester: John Wiley & Sons), 372–394.
Coleman, M. L., and Chisholm, S. W. (2010). Ecosystem-specific selective pressures revealed through comparative population genomics. Proc. Natl. Acad. Sci. U.S.A. 107, 18634–18639.
Corno, G., Karl, D. M., Church, M. J., Letelier, R. M., Lukas, R., Bidigare, R. R., and Abbott, M. R. (2007). Impact of climate forcing on ecosystem processes in the North Pacific Subtropical Gyre. J. Geophys. Res. 112, C04021.
Cotner, J. B., Ammerman, J. W., Peele, E. R., and Bentzen, E. (1997). Phosphorus-limited bacterioplankton growth in the Sargasso Sea. Aquat. Microb. Ecol. 13, 141–149.
Cotner, J. B., and Wetzel, R. G. (1992). Uptake of dissolved inorganic and organic phosphorus compounds by phytoplankton and bacterioplankton. Limnol. Oceanogr. 37, 232–243.
Donald, K. M., Scanlan, D. J., Carr, N. G., Mann, N. H., and Joint, I. (1997). Comparative phosphorus nutrition of the marine cyanobacterium Synechococcus WH7803 and the marine diatom Thalassiosira weissflogii. J. Plankton Res. 19, 1793–1813.
Dore, J. E., Houlihan, T., Hebel, D. V., Tien, G., Tupas, L., and Karl, D. M. (1996). Freezing as a method of sample preservation for the analysis of dissolved nutrients in seawater. Mar. Chem. 53, 173–185.
Duhamel, S., Björkman, K. M., Van Wambeke, F., Moutin, T., and Karl, D. M. (2011). Characterization of alkaline phosphatase activity in the North and South Pacific Subtropical Gyres: implications for phosphorus cycling. Limnol. Oceanogr. 56, 1244–1254.
Duhamel, S., Dyhrman, S. T., and Karl, D. M. (2010). Alkaline phosphatase activity and regulation in the North Pacific Subtropical Gyre. Limnol. Oceanogr. 55, 1414–1425.
Dyhrman, S., and Ruttenberg, K. C. (2006). Presence and regulation of alkaline phosphatase activity in eukaryotic phytoplankton from the coastal ocean: implications for dissolved organic phosphorus remineralization. Limnol. Oceanogr. 51, 1381–1390.
Eppley, R. W., Renger, E. H., Venrick, E. L., and Mullin, M. M. (1973). A study of plankton dynamics and nutrient cycling in the central North Pacific Ocean. Limnol. Oceanogr. 18, 534–551.
Falkowski, P. G. (1997). Evolution of the nitrogen cycle and its influence on the biological sequestration of CO2 in the ocean. Nature 387, 272–275.
Graham, W. F., and Duce, R. A. (1979). Atmospheric pathways of the phosphorus cycle. Geochim. Cosmoschim. Acta 43, 1195–1208.
Hebel, D. V., and Karl, D. M. (2001). Seasonal, interannual and decadal variations in particulate matter concentrations and composition in the subtropical North Pacific Ocean. Deep Sea Res. 48, 1669–1696.
Hodson, R. E., Maccubbin, A. E., and Pomeroy, L. R. (1981). Dissolved adenosine triphosphate utilization by free-living and attached bacteria. Mar. Biol. 64, 43–51.
Johnson, D. L. (1971). Simultaneous determination of arsenate and phosphate in natural waters. Environ. Sci. Technol. 5, 411–414.
Karl, D., Letelier, R., Tupas, L., Dore, J., Christian, J., and Hebel, D. (1997). The role of nitrogen fixation in biogeochemical cycling in the subtropical North Pacific Ocean. Nature 388, 533–538.
Karl, D. M. (1999). A sea of change: biogeochemical variability in the North Pacific Subtropical Gyre. Ecosystems 2, 181–214.
Karl, D. M. (2007). Microbial oceanography: paradigms, processes and promise. Nat. Rev. Microbiol. 5, 659–769.
Karl, D. M., and Björkman, K. M. (2002). “Dynamics of DOP,” in Biogeochemistry of Marine Dissolved Organic Matter, eds D. A. Hansell and C. A. Carlson (San Diego: Elsevier Science), 249–366.
Karl, D. M., Björkman, K. M., Dore, J. E., Fujieki, L., Hebel, D. V., Houlihan, T., Letelier, R. M., and Tupas, L. M. (2001). Ecological nitrogen-to-phosphorus stoichiometry at Station ALOHA. Deep Sea Res. 48, 1529–1566.
Karl, D. M., Church, M. J., Dore, J. E., Letelier, R. M., and Mahaffey, C. (2012). Predictable and efficient carbon sequestration in the North Pacific Ocean supported by symbiotic nitrogen fixation. Proc. Natl. Acad. Sci. U.S.A. 109, 1842–1849.
Karl, D. M., Letelier, R., Hebel, D. V., Bird, D. F., and Winn, C. D. (1992). “Trichodesmium blooms and new nitrogen in the North Pacific Gyre,” in Marine Pelagic Cyanobacteria: Trichodesmium and Other Diazotrophs, eds E. J. Carpenter and D. G. Capone (Leiden: Kluwer Academic Publisher), 219–237.
Karl, D. M., and Lukas, R. (1996). The Hawaii Ocean Time-series (HOT) program: background, rationale and field implementation. Deep Sea Res. 43, 129–156.
Karl, D. M., Michaels, A., Bergman, B., Capone, D., Carpenter, E., Letelier, R. M., Lipschultz, F., Paerl, H., Sigman, D., and Stal, L. (2002). Dinitrogen fixation in the world’s oceans. Biogeochemistry 57, 47–98.
Karl, D. M., and Tien, G. (1992). MAGIC: a sensitive and precise method for measuring dissolved phosphorus in aquatic environments. Limnol. Oceanogr. 37, 105–116.
Krom, M. D., Kress, N., Brenner, S., and Gordon, L. I. (1991). Phosphorus limitation of primary productivity in the eastern Mediterranean Sea. Limnol. Oceanogr. 36, 424–432.
Larsen, A., Tanaka, T., Zubkov, M. V., and Thingstad, T. F. (2008). P-affinity measurements of specific osmotroph populations using cell-sorting flow cytometry. Limnol. Oceanogr. Methods 6, 355–363.
Letelier, R. M., and Karl, D. M. (1996). The importance of Trichodesmium spp. in the productivity of the subtropical North Pacific Ocean. Mar. Ecol. Prog. Ser. 133, 263–273.
Li, B., Karl, D. M., Letelier, R. M., and Church, M. J. (2011). Size dependent photosynthetic variability in the North Pacific Subtropical Gyre. Mar. Ecol. Prog. Ser. 440, 27–40.
Løvdal, T., Tanaka, T., and Thingstad, T. F. (2007). Algal-bacterial competition for phosphorus from dissolved DNA, ATP and orthophosphate in a mesocosm experiment. Limnol. Oceanogr. 52, 1407–1419.
Mahaffey, C., Björkman, K. M., and Karl, D. M. (2012). Phytoplankton response to deep seawater nutrient additions in the North Pacific Subtropical Gyre. Mar. Ecol. Prog. Ser. doi:10.3354/meps09699
Mann, K. H., and Lazier, J. R. N. (1991). Dynamics of Marine Ecosystems. Biological-Physical Interactions in the Oceans. London: Blackwell Scientific Publications.
Mary, I., Garczarek, L., Tarran, G. A., Kolowrat, C., Terry, M. J., Scanlan, D. J., Burkill, P. H., and Zubkov, M. V. (2008). Diel rhythmicity in amino acid uptake by Prochlorococcus. Environ. Microbiol. 10, 2124–2131.
Michelou, V. K., Cottrell, M. T., and Kirchman, D. L. (2007). Light-stimulated bacterial production and amino-acid assimilation by cyanobacteria and other microbes in the North Atlantic Ocean. Appl. Environ. Microbiol. 73, 5539–5546.
Michelou, V. K., Lomas, M. W., and Kirchman, D. L. (2011). Phosphate and adenosine-5’-triphosphate uptake by cyanobacteria and heterotrophic bacteria in the Sargasso Sea. Limnol. Oceanogr. 56, 323–332.
Moore, L. R., Ostrowski, M., Scanlan, D. J., Feren, K., and Sweetsire, T. (2005). Ecotypic variation in phosphorus-acquisition mechanism within marine cyanobacteria. Aquat. Microb. Ecol. 39, 257–269.
Moutin, T., Van Den Broeck, N., Beker, B., Dupouy, C., Rimmelin, P., and Le Bouteiller, A. (2005). Phosphate availability controls Trichodesmium spp. biomass in the SW Pacific Ocean. Mar. Ecol. Prog. Ser. 297, 15–21.
Murphy, J., and Riley, J. P. (1962). A modified single solution method for determination of phosphate in natural waters. Anal. Chim. Acta 27, 31–36.
Paerl, H. W. (1993). Emerging role of atmospheric nitrogen deposition in coastal eutrophication: biogeochemical and trophic perspectives. Can. J. Fish. Aquat. Sci. 50, 2254–2269.
Perry, M. J. (1972). Alkaline phosphatase activity in subtropical Central North Pacific waters using a sensitive fluorometric method. Mar. Biol. 15, 113–119.
Perry, M. J. (1976). Phosphate utilization by an oceanic diatom in phosphate-limited chemostat culture and in the oligotrophic waters of the central North Pacific. Limnol. Oceanogr. 21, 88–107.
Perry, M. J., and Eppley, R. W. (1981). Phosphate uptake by phytoplankton in the central North Pacific Ocean. Deep Sea Res. 28A, 39–49.
Redfield, A. C., Ketchum, B. H., and Richards, F. A. (1963). “The influence of organisms on the composition of seawater,” in The Sea, ed. M. N. Hill (New York: Interscience), 26–77.
Rhee, G. Y. (1972). Competition between an alga and an aquatic bacterium for phosphate. Limnol. Oceanogr. 17, 505–517.
Siuda, W., and Güde, H. (1994). A comparative study on 5’-nucleotidase (5’-nase) and alkaline phosphatase (APA) activities in two lakes. Arch. Hydrobiol. 131, 211–229.
Sorokin, Y. I. (1985). Phosphorus metabolism in planktonic communities of the eastern tropical Pacific Ocean. Mar. Ecol. Prog. Ser. 27, 87–97.
Talarmin, A., Van Wambeke, F., Duhamel, S., Catala, P., Moutin, T., and Lebaron, P. (2011). Improved methodology to measure taxon-specific phosphate uptake in live and unfiltered samples. Limnol. Oceanogr. Methods 9, 443–453.
Tamminen, T. (1989). Dissolved organic phosphorus regener ation by bacterioplankton: 5’-nucleotidase activity and subsequent phopshate uptake in a mesocosm experiment. Mar. Ecol. Prog. Ser. 58, 89–100.
Tanaka, T., and Rassoulzadegan, F. (2003). Measurements of phosphate affinity constants and phosphorus release rates from the microbial food web in Villefranche Bay, northwestern Mediterranean. Limnol. Oceanogr. 48, 1150–1160.
Tanaka, T., Rassoulzadegan, F., and Thingstad, T. F. (2004). Orthophosphate uptake by heterotrophic bacteria, cyanobacteria, and autotrophic nanoflagellates in Villefranche Bay, northwestern Mediterranean: vertical, seasonal, and short-term variations of the competitive relationship for phosphorus. Limnol. Oceanogr. 49, 1063–1072.
Thingstad, T. F., Krom, M. D., Mantoura, R. F. C., Flaten, G. A. F., Groom, S., Herut, B., Kress, N., Law, C. S., Pasternak, A., Pitta, P., Psarra, S., Rassoulzadegan, F., Tanaka, T., Tselepides, A., Wassmann, P., Woodward, E. M. S., Wexels Riser, C., Zodiatis, G., and Zohary, T. (2005). Nature of phosphorus limitation in the ultraoligotrophic eastern Mediterranean. Science 309, 1068–1070.
Thingstad, T. F., Skjoldal, E. F., and Bohne, R. A. (1993). Phosphorus cycling and algal-bacterial competition in Sandfjord, western Norway. Mar. Ecol. Prog. Ser. 99, 239–259.
Thingstad, T. F., Zweifel, U. L., and Rassoulzadegan, F. (1998). P limitation of heterotrophic bacteria and phytoplankton in the northwest Mediterranean. Limnol. Oceanogr. 43, 88–94.
Van Mooy, B. A. S., and Devol, A. H. (2008). Assessing nutrient limitation of Prochlorococcus in the North Pacific subtropical gyre by using an RNA capture method. Limnol. Oceanogr. 53, 78–88.
Van Mooy, B. A. S., Fredricks, H. F., Pedler, B. E., Dyhrman, S. T., Karl, D. M., Koblízek, M., Lomas, M. W., Mincer, T. J., Moore, L. R., Moutin, T., Rappé, M., and Webb, E. A. (2009). Phytoplankton in the ocean use non-phosphorus lipids in response to phosphorus scarcity. Nature 458, 69–72.
Van Wambeke, F., Christaki, U., Giannakourou, A., Moutin, T., and Souvemerzoglou, K. (2002). Longitudinal and vertical trends of bacterial limitation by phosphorus and carbon in the Mediterranean Sea. Microb. Ecol. 43, 119–133.
Van Wambeke, F., Nedoma, J., Duhamel, S., and Lebaron, P. (2008). Alkaline phosphatase activity studied with ELF97 phosphate: success and limits in P-limited Mediterranean Sea. Aquat. Microb. Ecol. 52, 245–251.
Villareal, T. A. (1991). Nitrogen-fixation by cyanobacterial symbionts of the diatom Hemiaulus. Mar. Ecol. Prog. Ser. 76, 201–204.
Wu, J., Sunda, W., Boyle, E. A., and Karl, D. M. (2000). Phosphate depletion in the Western North Atlantic Ocean. Science 289, 759–762.
Zehr, J. P., Waterbury, J. B., Turner, P. J., Montoya, J. P., Omoregie, E., Steward, G. F., Hansen, A., and Karl, D. M. (2001). Unicellular cyanobacteria fix N2 in the subtropical North Pacific Ocean. Nature 412, 635–638.
Zubkov, M. V., Sleigh, M. A., Tarran, G. A., Burkhill, P. H., and Leakey, R. J. G. (1998). Picoplankton community structure on an Atlantic transect from 50 N to 50 S. Deep Sea Res. 45, 1339–1355.
Keywords: phosphate, ATP, kinetics, uptake, oligotrophic, flow cytometry, North Pacific gyre
Citation: Björkman K, Duhamel S and Karl DM (2012) Microbial group specific uptake kinetics of inorganic phosphate and adenosine-5′-triphosphate (ATP) in the North Pacific Subtropical Gyre. Front. Microbio. 3:189. doi: 10.3389/fmicb.2012.00189
Received: 04 January 2012; Paper pending published: 06 March 2012;
Accepted: 09 May 2012; Published online: 11 June 2012.
Edited by:
Angelicque White, Oregon State University, USAReviewed by:
Bethany Jenkins, University of Rhode Island, USAMatthew McGinness Mills, Stanford University, USA
Copyright: © 2012 Björkman, Duhamel and Karl. This is an open-access article distributed under the terms of the Creative Commons Attribution Non Commercial License, which permits non-commercial use, distribution, and reproduction in other forums, provided the original authors and source are credited.
*Correspondence: Karin Björkman, Department of Oceanography, Center for Microbial Oceanography: Research and Education, School of Ocean and Earth Science and Technology, University of Hawaii, 1950 East-West Road, Honolulu, HI 96822, USA. e-mail: bjorkman@hawaii.edu
†Present address: Solange Duhamel, Biology Department, Woods Hole Oceanographic Institution, Woods Hole, MA 02543, USA.