 Sreetha Sidharthan1†
 Cheol-Woo Kim2†Alison A. Murphy3
 Xiaozhen Zhang3Jun Yang4Richard A. Lempicki4Michael C. Sneller3
 Shyam Kottilil3*
- 1Critical Care Medicine Department, Clinical Center, National Institutes of Health, Department of Health and Human Services, Bethesda, MD, USA
- 2Department of Internal Medicine, Inha University, Incheon, South Korea
- 3Laboratory of Immunoregulation, National Institute of Allergy and Infectious Diseases, National Institutes of Health, Department of Health and Human Services, Bethesda, MD, USA
- 4Clinical Research Directorate/Clinical Monitoring Research Program, Leidos Biomedical Research Inc., Frederick National Laboratory for Cancer Research, Frederick, MD, USA
This study examines the distinct gene expression profile of peripheral blood mononuclear cells from patients with chronic hepatitis C infection and mixed cryoglobulinemic (MC) vasculitis. Our DNA microarray analysis indicates that hepatitis C virus (HCV)-associated MC vasculitis is characterized by compromised neutrophil function, impaired chemotaxis, and increased interferon-stimulated gene (ISG) expression, contributing to overall MC pathogenesis and end-organ damage. Increased ISG expression is suggestive of an enhanced endogenous interferon gene signature. PBMC depletion assays demonstrate that this increased expression is likely due to an activation of monocytes and not a direct result of B cell expansion. Notably, this monocyte activation of ISG expression in HCV-associated MC vasculitis suggests a poor predictor status of interferon-based treatment. Further analysis of PBMC gene expression profiles before and after in vivo B cell depletion therapy is critical to completely understanding the mechanisms of MC vasculitis pathogenesis.
Introduction
Chronic hepatitis C (CHC) infection affects 180 million people worldwide (1). Hepatitis C virus (HCV) is a single-stranded RNA virus that preferentially infects hepatocytes of the liver (2). CHC can lead to progressive liver fibrosis, cirrhosis, hepatocellular carcinoma, and death (3). CHC has also been associated with several extrahepatic manifestations, among which include mixed cryoglobulinemic (MC) vasculitis, lymphoproliferative disorders, and insulin resistance (4, 5). Of these, Type II MC vasculitis is the most common and directly attributed to CHC (6), with CHC identified in more than 80% of patients with persistent MC vasculitis (7, 8).
Hepatitis C virus-associated MC vasculitis is characterized by an expansion of monoclonal B cells probably triggered by HCV antigens (6, 9). These clonal B cells produce IgM with rheumatoid factor activity, which can lead to the formation and deposition of immune complexes and eventual small vessel vasculitis (6, 9). The end result is tissue and organ damage, particularly of the kidneys and skin, the common clinical manifestations being membranoproliferative glomerulonephritis and cutaneous vasculitis (4, 10).
Recent studies have demonstrated that patients diagnosed with MC vasculitis can be effectively treated with B cell depletion therapy (11–13). However, the role of B cells in a variety of immunological abnormalities associated with MC and the exact nature of how CHC infection affects the pathogenesis of MC vasculitis are not completely understood. In particular, whether monoclonal B cell expansion can lead to activation of other immune cells to further contribute to the pathogenesis is not clear. In this study, we performed gene expression profile analysis of PBMCs from four different patient cohorts to determine the change in gene expression among HCV-associated MC vasculitis patients compared to other subjects with and without HCV and vasculitis.
Materials and Methods
Study Design and Patient Population
PBMCs were isolated by venipuncture from normal volunteers (N = 12), HCV monoinfected subjects (N = 7), human immunodeficiency virus (HIV) and HCV coinfected subjects on antiretroviral therapy (N = 5), and HCV MC vasculitis subjects (N = 7) (Table 1). HIV was diagnosed by ELISA and Western blot using the Cambridge Biotech HIV-1 Serum Western Blot Kit (Maxim Biomedical, Rockville, MD, USA). HIV RNA was quantified by Versant HIV RNA 3.0 Assay (Bayer Diagnostics, Puteaux Cedex, France). HCV genotype was determined by the INNO-LiPA HCV II (Innogenetics) assay and HCV RNA was quantified by the Versant HCV RNA 3.0 Assay (Bayer Diagnostics, Tarrytown, NY, USA).
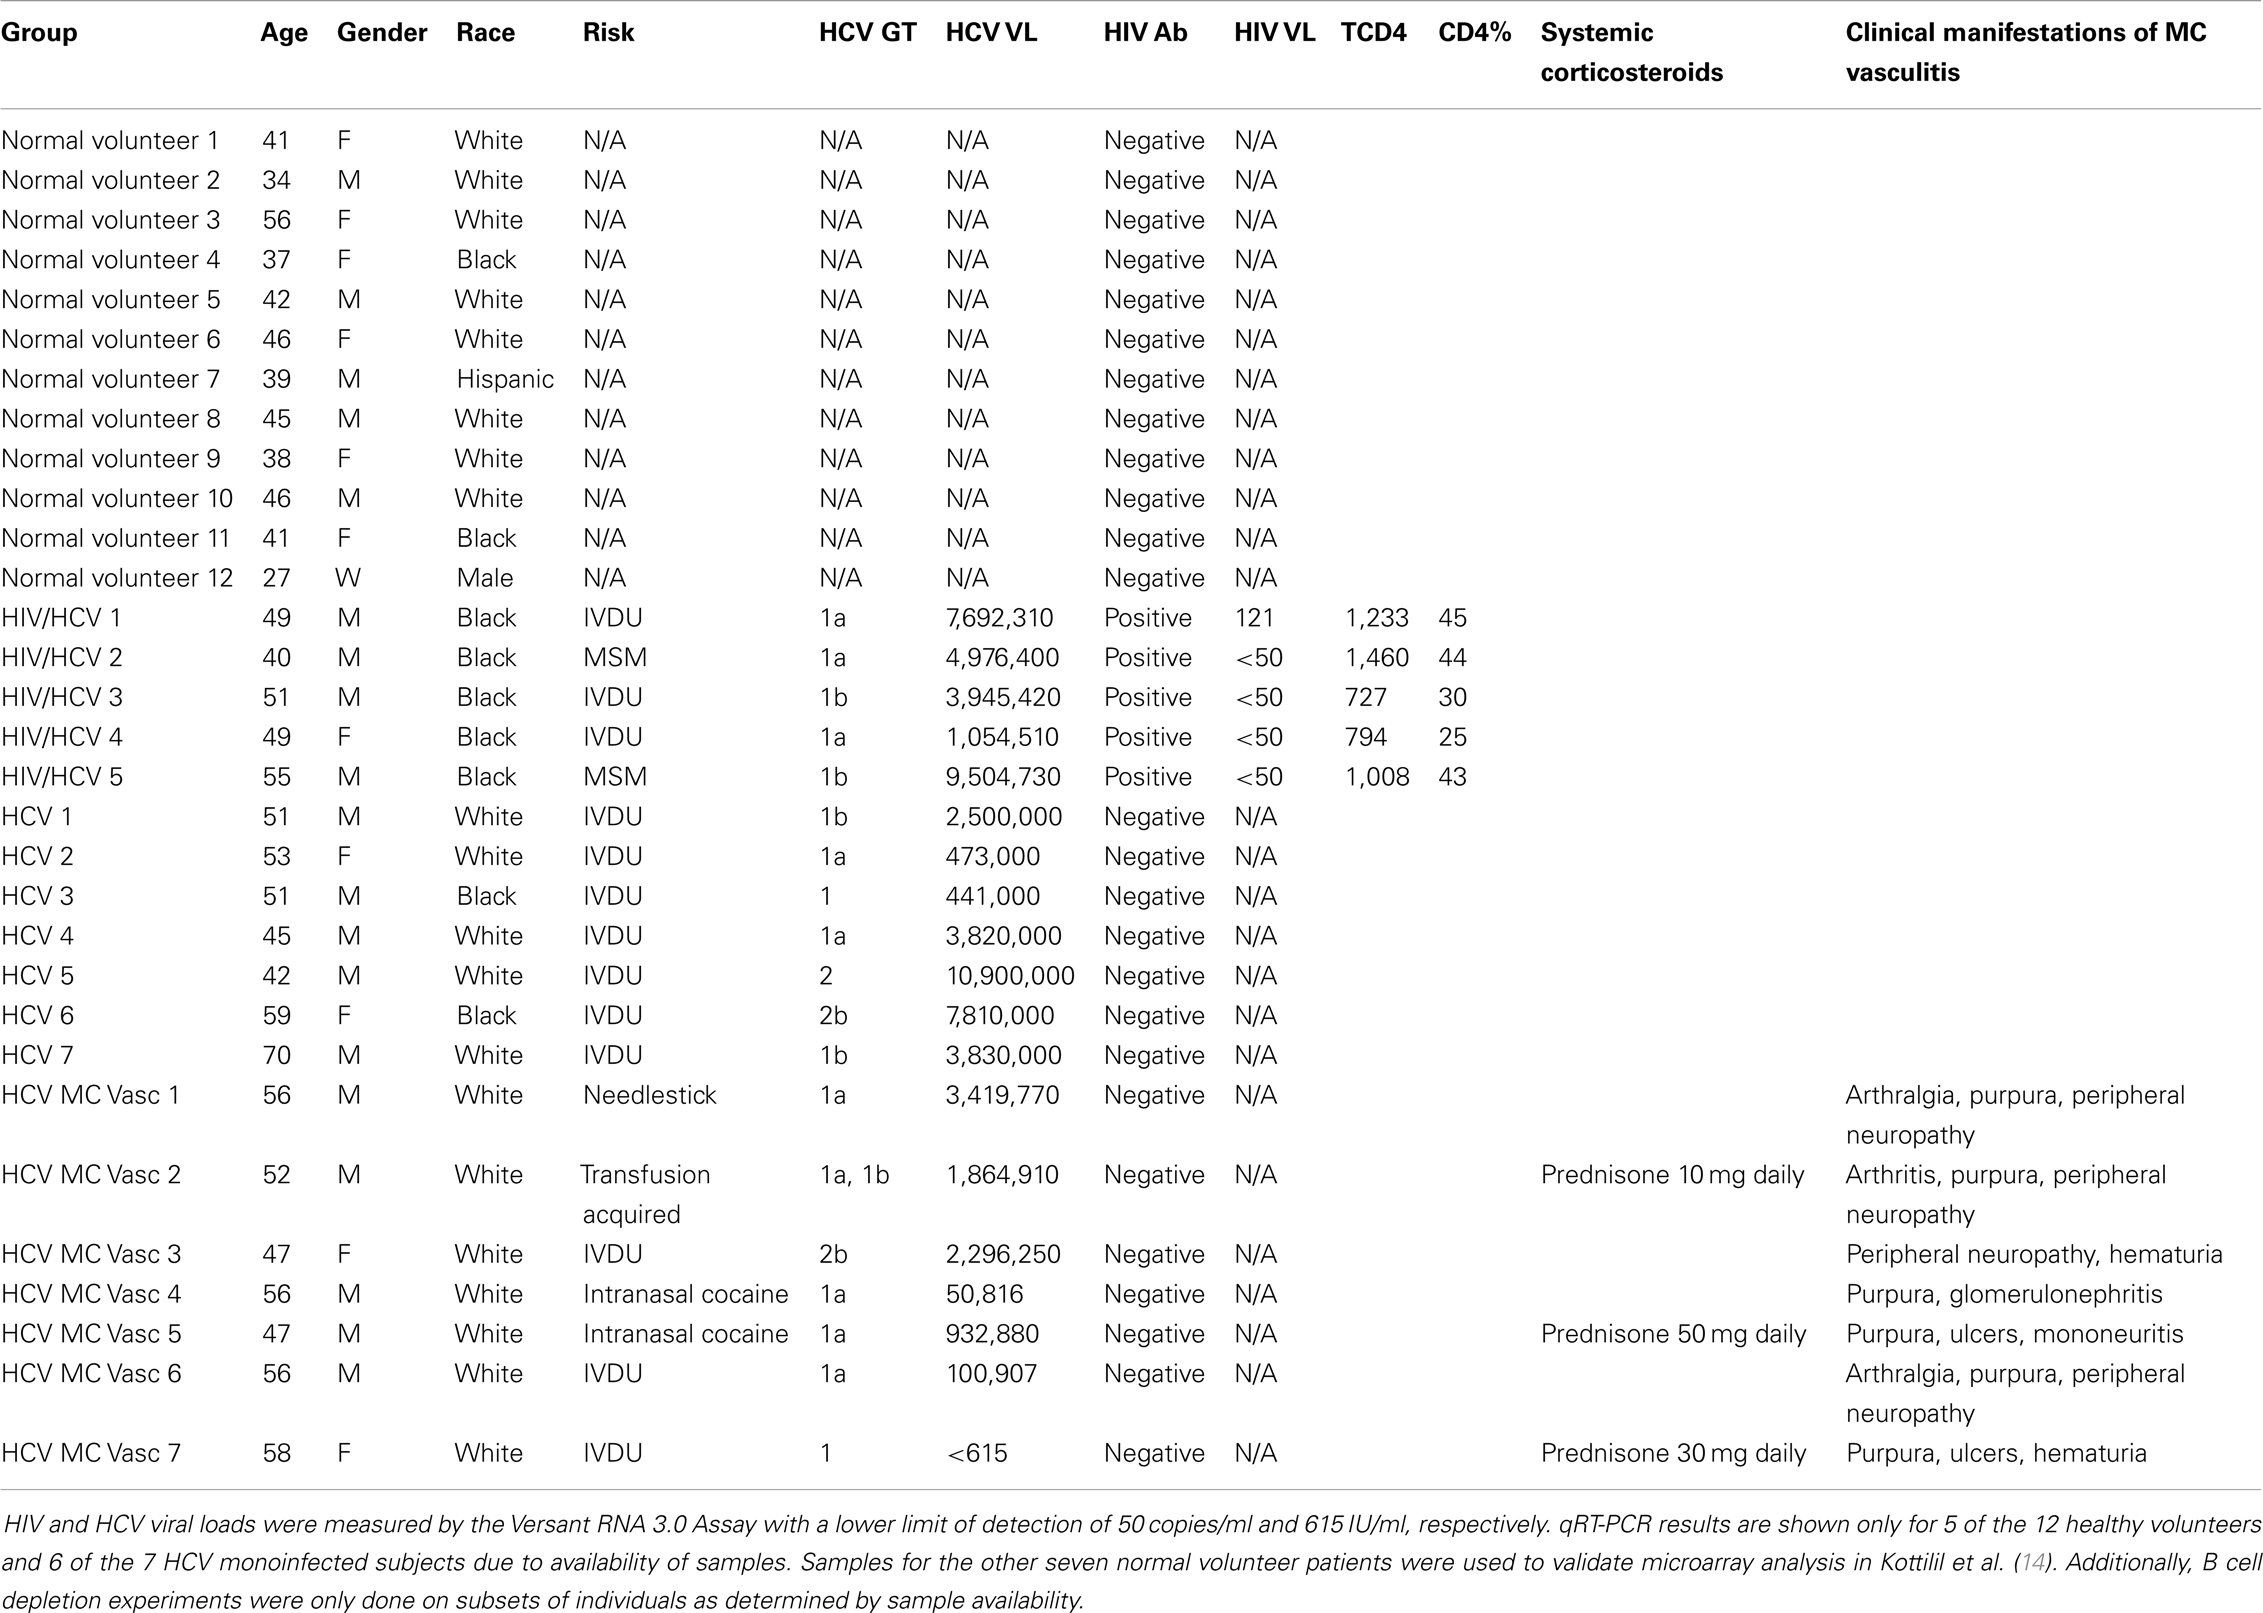
Table 1. Demographics and clinical characteristics of study participants.
Normal volunteers were selected through the blood bank and were HIV and HCV negative. HIV/HCV coinfected patients and the HCV monoinfected patients were selected from an ongoing longitudinal study at the National Institutes of Health (NIH). The HCV MC vasculitis subjects were selected from an ongoing open-label, randomized controlled trial conducted at the NIH (13). Inclusion in this trail required the presence of active manifestations of MC vasculitis as described in Sneller et al. (13). Only patients who did not respond to or tolerate interferon-alpha and ribavirin over a year before start of this study were enrolled. Patients were allowed to continue taking corticosteroids, but samples were collected before the day’s dose, at steroid trough level, to minimize the immunomodulatory effects of these drugs. All donors signed informed consents approved by the National Institute of Allergy and Infectious Diseases Institutional Review Board. Clinical protocols NCT00029107, NCT00001281, and NCT00076427 were used to enroll study subjects.
Isolation of PBMCs and RNA
PBMCs were isolated from white blood cells by the standard Ficoll-Hypaque Plus (Amersham Biosciences, Uppsala, Sweden) density gradient separation technique and then frozen for storage. RNA was isolated using the Qiagen mRNA isolation kit (Qiagen, Germantown, MD, USA) following the manufacturer’s protocol and to be used for DNA microarray and quantitative reverse transcription polymerase chain reaction (qRT-PCR) analysis.
DNA Microarray Analysis
Complementary RNA was prepared from total RNA and hybridized to Affymetrix U133A 2.0 oligonucleotide arrays according to the manufacturer’s protocols (Affymetrix, Santa Clara, CA, USA) as previously described (14). A significant analysis of microarray (SAM) algorithm was used to determine the genes that were differentially expressed after an extensive filtering process. Genes with low variability or undetectable expression levels (for the majority of samples) were eliminated from analysis if the Guanosine–Cytosine Robust Multi Array values for these genes were within the interquartile range of <0.263 or a 75th percentile of <5. The corresponding genes and samples from the individuals were then subjected to hierarchical clustering.
Real-Time Quantitative Reverse Transcription Polymerase Chain Reaction
Total RNA isolated from PBMCs was reverse-transcribed using random primers with the High Capacity cDNA Reverse Transcriptase Kit (Life Technologies). Between 1 and 25 ng of RNA was used for each quantitative qRT-PCR reaction. Taqman expression assays were run with technical duplicates except where indicated (Life Technologies). Primer/probe sets were pre-designed for respective genes and purchased from Life Technologies. Gene expression was determined as a cycle at threshold (Ct) based on 40 PCR cycles. For statistical analysis, undetectable expression was assigned a minimal detectable level with a Ct value of 40. Expression of GAPDH was used as an endogenous control, with GAPDH Ct values for all samples being distributed between 20 and 25. Relative expression of targets was calculated as dCt values (normalized by GAPDH Ct values) or ddCt values (to calculate fold change compared to other samples). Expression reactions were run in 96-well plates on a 7500 Real-Time PCR System (Applied Biosystems).
Statistical Analysis
ANOVA with Tukey’s multiple comparison test was used to compare means of the relative gene expression in independent groups. The paired T-test with the Bonferroni adjustment for multiple testing was used to compare paired responses.
PBMC Depletion and Enrichment Assay
Total PBMCs were isolated using Ficoll-Hypaque density gradient centrifugation. B cells (CD19 pan B dynabeads) and monocytes (CD14 dynabeads) were either depleted or enriched using an antibody-coated magnetic bead column separation technique (Life Technologies, Grand Island, NY, USA). Dynabeads CD19 pan B and CD14 are both uniform (4.5 μm diameter) superparamagnetic beads coated with a primary monoclonal antibody specific for the CD19 or CD14 membrane antigen mainly expressed on human B cells and monocytes, respectively. Cell purity for B cells was performed as follows using flow cytometry and was determined to be >90%. Cells were stained for CD3 APC (Clone UCHT1) and CD20 FITC (Clone: L27) (source for both antibodies: BD Biosciences, San Jose, CA, USA) and analyzed using a FACSCanto Cell Analyzer (BD Biosciences, San Jose, CA, USA). Cells were analyzed using a lymphocyte gate and purity was assessed as CD3−CD20+ lymphocytes. For monocytes, purity was assessed by staining cells for CD3 APC (Clone UCHT1) and intracellular CD68 FITC (Clone Y1/82A) (source: BD Biosciences, San Jose, CA, USA) after permeabilization and fixing. The cells were analyzed using a monocyte gate and purity assessed as CD3−CD68+ cells.
Results
Study Subjects
Five patient cohorts were analyzed: normal volunteers, HCV monoinfected subjects, HIV/HCV coinfected subjects, and HCV MC vasculitis subjects (Table 1).
Human immunodeficiency virus/hepatitis C virus coinfected patients were of interest to us because coinfection with HCV is present in one-third of all HIV-infected individuals and the gene expression profiles of coinfected patients has already been characterized (14). Additionally, HIV infection drives T cell activation and MC vasculitis drives B cell activation. This patient group thus serves as an additional comparison to better understand how the pathogenesis of HCV-associated MC vasculitis pathogenesis induces a gene expression profile distinct from the other common HCV-infected patient cohorts.
Hepatitis C virus MC vasculitis subjects were selected based on the presence of active manifestations of CHC-associated MC vasculitis and required the presence of peripheral neuropathy, cutaneous vasculitis, and/or glomerulonephritis. Common clinical manifestations included purpura, arthralgia, hematuria, and ulcers. Patients with the presence of potentially life-threatening vasculitis involving the heart, central nervous system, or gastrointestinal tract were excluded. It should also be noted that three out of the seven HCV MC vasculitis patients were on prednisone and did not have a change in immunosuppressive therapy within 4 weeks of study entry. For these study subjects, samples were drawn as trough (23 h post morning dose of prednisone) to minimize the effect of corticosteroids on the immune system. Additionally, HCV MC vasculitis patients with prior use of rituximab, severe renal insufficiency, severe hepatic insufficiency, lymphoma, coinfection with HIV or hepatitis B virus, liver transplantation, or active systemic infections were excluded (13).
Differential Gene Expression Profiles in PBMCs of HCV MC Vasculitis Subjects
To compare the host gene expression profile induced by HCV infection with MC vasculitis to that induced by HCV monoinfection and HCV/HIV coinfection without MC, we performed DNA microarray analysis using RNA isolated from PBMCs from the aforementioned patient groups (Table 1).
Using Affymetrix human genome U133A oligonucleotide arrays and a SAM algorithm, we identified a total of 529 differentially expressed genes between the four groups (Figure 1). The corresponding genes and samples from the individuals were subjected to hierarchical clustering, which revealed four distinct clusters of differential gene expression (Figure 1). Cluster 1 consists of 192 genes that are down-regulated in both HCV monoinfected patients and HCV MC vasculitis patients. Functional annotation analysis revealed that these genes share roles in cellular defense. Cluster 2 includes 41 genes that are up-regulated in HCV monoinfected patients when compared to HCV MC vasculitis subjects and are mostly genes implicated in chemotaxis and response to external stimulus. Cluster 3 consists of 284 genes including several interferon-stimulated genes (ISGs) that are up-regulated only in HCV MC vasculitis patients. Cluster 4 includes 12 heat shock proteins that are down-regulated in HCV MC vasculitis patients.
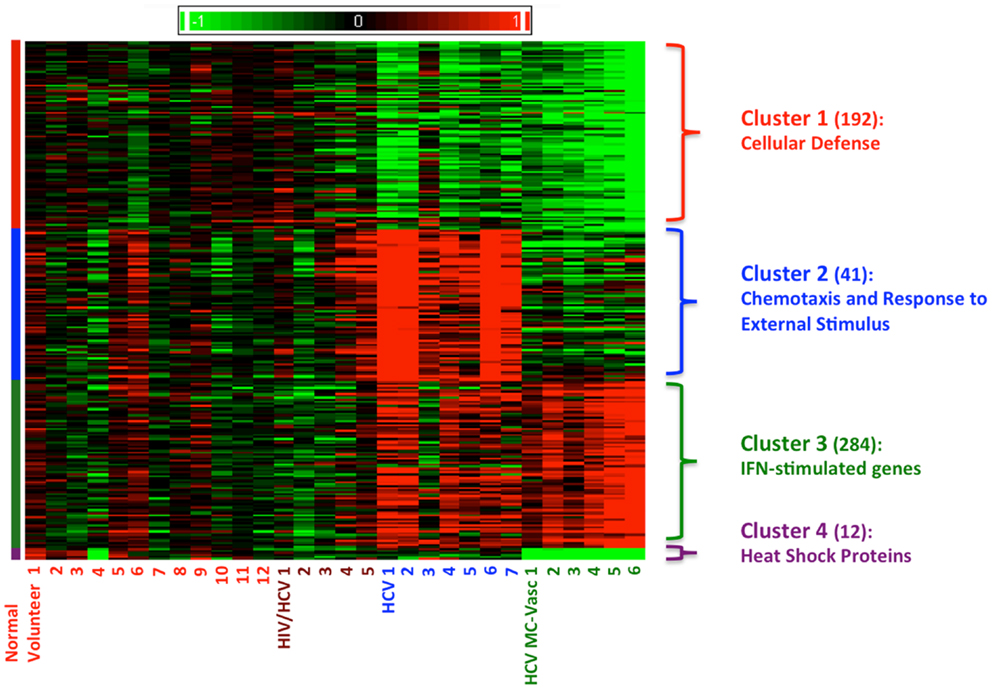
Figure 1. Clustering of differentially expression genes in PBMCs from four patient cohorts. Levels of gene expression were assayed using Affymetrix Human Genome U133A chips as described in the methods section. A total of 529 differentially expressed genes were identified. Genes were grouped using K-means clustering, and samples were grouped by hierarchical clustering. Differences in relative levels of gene expression (Z-score) are represented by color, where red indicates up-regulation and green indicates down-regulation relative to that of corresponding gene expression in controls. The numbers in parentheses specify the number of genes in each cluster. Cluster 1 consists of genes down-regulated in HCV monoinfected patients and HCV MC vasculitis patients. Cluster 2 consists of genes up-regulated in HCV monoinfected patients without vasculitis. Cluster 3 consists of genes up-regulated in HCV MC vasculitis patients and Cluster 4 consists of genes down-regulated in HCV MC vasculitis patients.
Representative genes that belong to each cluster were identified by rigorous literature-mining algorithms, significance of microarray analysis, and biology of the disease processes of both HCV viremia and MC vasculitis (Tables A1–A3 in Appendix) and validated by qRT-PCR. This process of gene selection is consistent with our previous studies (14).
Down-Regulation of Cellular Defense Genes in HCV Monoinfected Patients with or without MC Vasculitis
To validate our DNA microarray analysis, we performed qRT-PCR analysis on the most biologically relevant genes from each cluster selected as described above. Total RNA was extracted from the PBMCs and subjected to qRT-PCR using primers specific for the validated genes.
Cluster 1 was comprised of genes involved in cellular defense, which were down-regulated in patients monoinfected with HCV, with or without vasculitis. We chose to measure transcript levels of defensin alpha-1 and defensin alpha-4 (Figure 2). The mean gene expression of defensin alpha-1 was significantly lower in HCV monoinfected and HCV MC vasculitis patients compared to the other two groups [3.80 ± 0.80 (NV), 1.20 ± 0.40 (HCV MC-Vasc), 2.10 ± 0.60 (HCV), 3.7 ± 0.70 (HIV/HCV); p = 0.01 between HCV MC-Vasc and normal and p = 0.03 between HCV viremic and normal], thereby confirming the DNA microarray analysis. This was similarly true for defensin alpha-4 [4.30 ± 0.40 (NV), 2.00 ± 0.90 (HCV MC-Vasc), 2.50 ± 0.60 (HCV), 3.90 ± 0.80 (HIV/HCV); p = 0.03 between HCV MC-Vasc and normal and p = 0.04 between HCV viremic and normal]. Defensins are proteins expressed in neutrophils that have broad anti-microbial properties (15). Our results suggest a selective depletion of the inflammatory capacity of neutrophils seen in patients with HCV infection. Although this down-regulation of alpha-defensin expression levels are not seen in the HIV/HCV coinfected cohort, alpha-defensins have been shown to be elevated in HIV-infected patients (16).
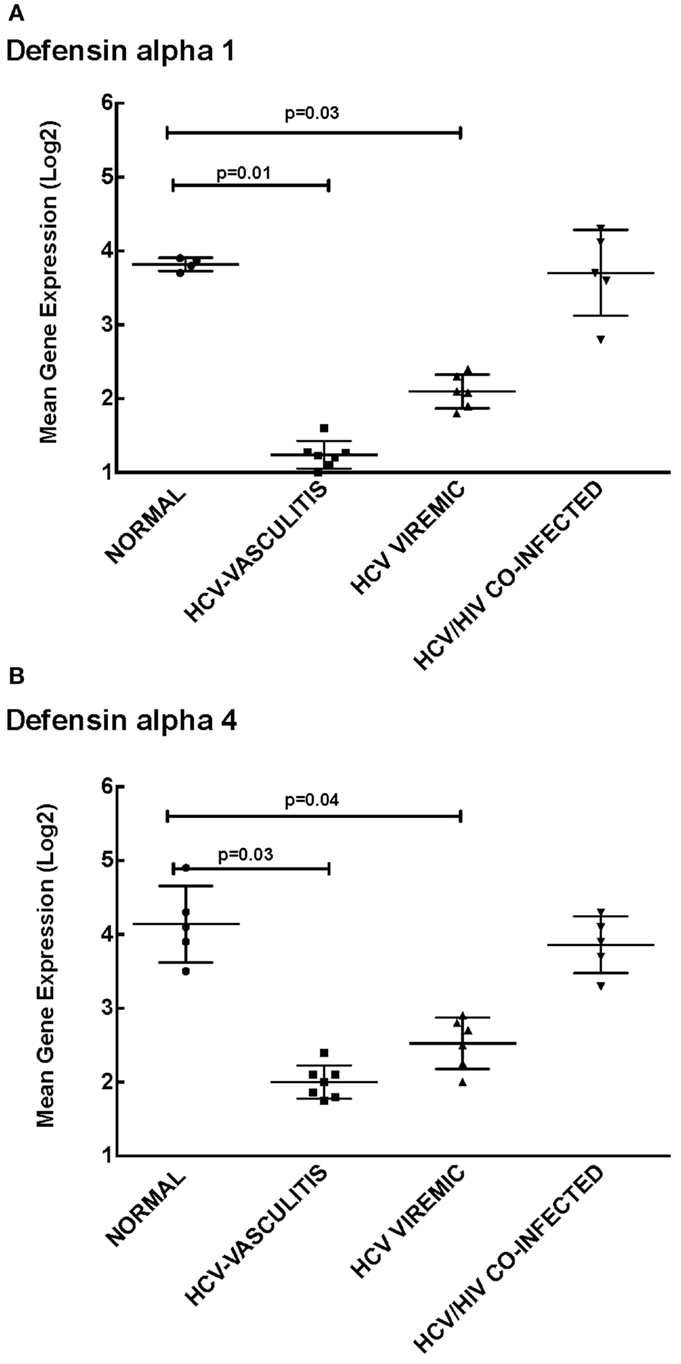
Figure 2. Validation of Cluster 1 microarray data by qPCR analysis. DNA microarray expression of biologically relevant genes selected from Cluster 1 was validated using qRT-PCR as described in the Section “Materials and Methods.” Levels of mean gene expression were calculated in comparison to the expression of GAPDH. The expression of defensin alpha-1 (A) and defensin alpha-4 (B) were lower in the HCV monoinfected (p = 0.03 and 0.04 with normal, respectively) and HCV MC vasculitis cohorts (p = 0.01 and 0.03 with normal, respectively).
HCV Monoinfection Up-Regulates Expression of Genes Involved in Chemotaxis and Response to External Stimuli
Cluster 2 is comprised of genes that are up-regulated in HCV monoinfected patients without vasculitis and play a role in chemotaxis and response to external stimuli. We validated the microarray analysis by comparing the expression levels of four genes in this cluster, chemokine (C-C motif) ligand 4 (CCL4), chemokine (C-X-C motif) ligand 1 (CXCL1), cluster of differentiation 69 (CD69), and chemokine (C-C motif) ligand 20 (CCL20) by qRT-PCR (Figure 3).
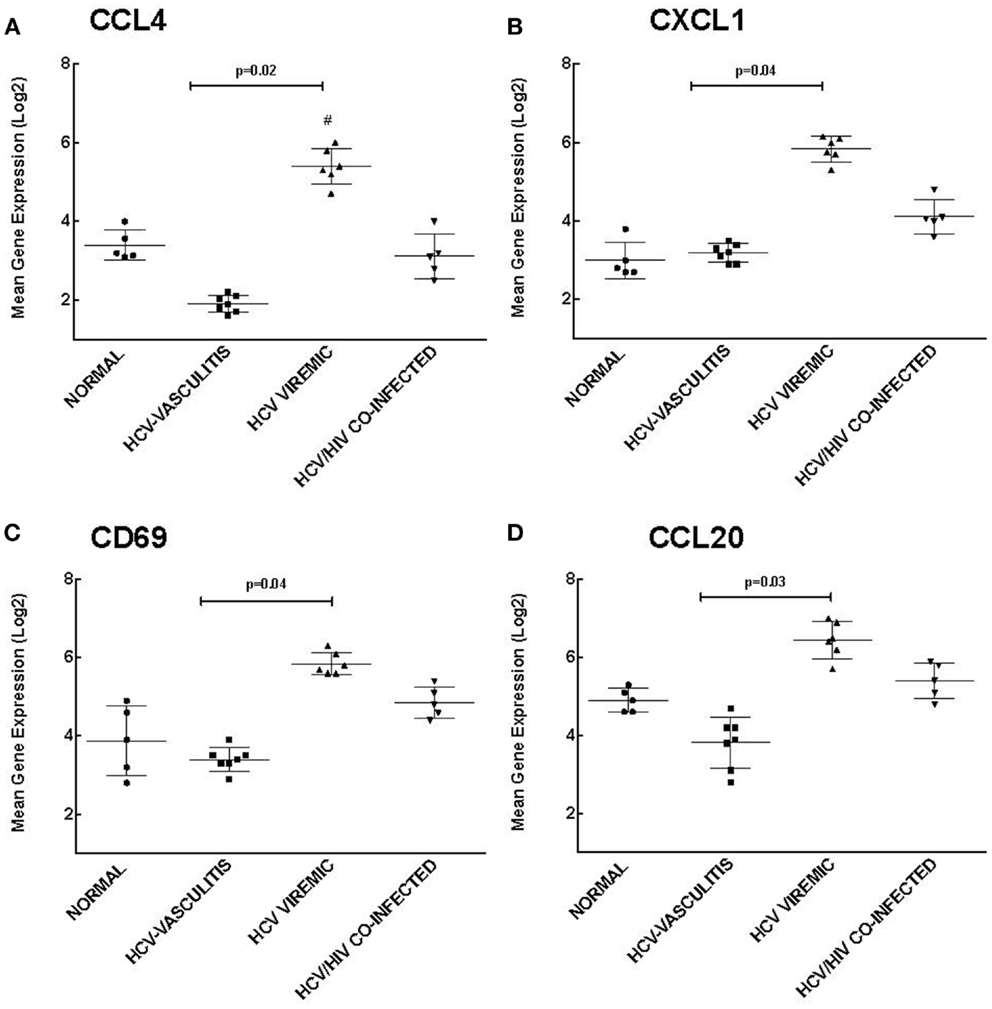
Figure 3. Validation of Cluster 2 microarray data by qPCR analysis. DNA microarray expression of biologically relevant genes selected from Cluster 2 was validated using qRT-PCR as described in the Section “Materials and Methods.” Levels of mean gene expression were calculated in comparison to that of GAPDH. The expression of CCL4 (A), CXCL1 (B), CD69 (C), and CCL20 (D) were higher in the HCV monoinfected cohort compared to the other groups (p = 0.02, 0.04, 0.04, and 0.03, respectively compared to HCV MC-Vasc).
Chemokines are a family of cytokines responsible for mediating leukocyte chemotaxis (17). Transcript levels of CCL4, a lymphocyte attractant (18), were significantly higher in HCV viremic patients when compared to the three other subject cohorts [3.20 ± 0.80 (NV), 1.90 ± 0.70 (HCV MC-Vasc), 5.40 ± 0.90 (HCV), 2.80 ± 1.00 (HIV/HCV); p = 0.02 between HCV viremic and HCV MC-Vasc]. Similarly, CXCL1, a chemokine with neutrophil chemotactic activity (19), was up-regulated in HCV monoinfected patients [2.80 ± 0.90 (NV), 3.20 ± 0.60 (HCV MC-Vasc), 5.70 ± 0.50 (HCV), 4.10 ± 0.70 (HIV/HCV); p = 0.04 between HCV viremic and HCV MC-Vasc]. CD69 is a receptor that is induced upon antigen-associated activation of T cells and transmits signals to other lymphocytes (20). PBMC expression of CD69 was greater in the HCV monoinfected cohort [3.90 ± 0.80 (NV), 3.40 ± 0.90 (HCV MC-Vasc), 5.80 ± 0.80 (HCV), 4.80 ± 0.70 (HIV/HCV); p = 0.04 between HCV viremic and HCVMC-Vasc]. Finally, CCL20 showed similar gene expression patterns among the patient cohorts [4.90 ± 0.80 (NV), 3.80 ± 0.70 (HCV MC-Vasc), 6.50 ± 0.70 (HCV), 5.40 ± 0.80 (HIV/HCV); p = 0.03 between HCV viremic and HCV MC-Vasc]. These data further validate the microarray analysis and demonstrate that genes involved in chemotaxis and response to external stimuli are up-regulated in HCV monoinfected individuals relative to HCV MC vasculitis patients. In extension, these data suggest that the HCV MC vasculitis patient cohort has an impaired chemotactic response to stimuli.
PBMCs of HCV-Associated MC Vasculitis Patients Show Increased Expression of ISGs
Our analysis of Cluster 3 demonstrates an enrichment of ISGs in the HCV MC vasculitis cohort. We chose to validate the gene expression of 2′-5′-oligoadenylate synthetase-like protein (OASL), TIMP metallopeptidase inhibitor 1 (TIMP1), interferon regulatory factor 2 binding protein 2 (IRF2B2), and chemokine (C-X-C motif) ligand 16 (CXCL16) (Figure 4). OASL is an IFN-induced cellular protein that inhibits viral replication of HCV (21). Gene expression of OASL was higher in HCV MC vasculitis patients compared to the other subject cohorts [2.20 ± 0.50 (NV), 4.30 ± 0.90 (HCV MC-Vasc), 2.20 ± 0.80 (HCV), 2.70 ± 0.40 (HIV/HCV); p = 0.02 between HCV MC-Vasc and HCV viremic]. TIMP1 regulates extracellular matrix (ECM) turnover and remodeling by inhibiting the degradation of ECM (22). Transcript levels of TIMP1 were significantly higher in the HCV MC vasculitis cohort [1.80 ± 0.70 (NV), 4.8 ± 1.10 (HCV MC-Vasc), 2.80 ± 0.70 (HCV), 2.90 ± 1.00 (HIV/HCV); p = 0.03 between HCV MC-Vasc and HCV viremic]. Interferon regulatory factor 2 binding protein (IRF2BP2) is a co-repressor of type I IFN genes and many ISGs (23). The HCV MC vasculitis cohort had greater gene expression of IRF2BP2 when compared to the other study groups [2.10 ± 0.90 (NV), 5.10 ± 0.80 (HCV MC-Vasc), 3.10 ± 0.90 (HCV), 3.40 ± 0.80 (HIV/HCV); p = 0.03 between HCV MC-Vasc and HCV viremic]. Finally, CXCL16 is an interferon-gamma-regulated cytokine that promotes cell growth and migration and is also involved in lymphocyte chemotaxis (24). qRT-PCR validated the microarray analysis indicating that CXCL16 gene expression is up-regulated in HCV MC vasculitis patients [1.90 ± 0.60 (NV), 4.60 ± 0.80 (HCV MC-Vasc), 2.50 ± 0.60 (HCV), 3.10 ± 0.50 (HIV/HCV); p = 0.02 between HCV MC-Vasc and HCV viremic]. Thus, our data suggest that the MC vasculitis patient cohort express higher levels of ISGs at the transcript level than the other groups with or without HCV infection.
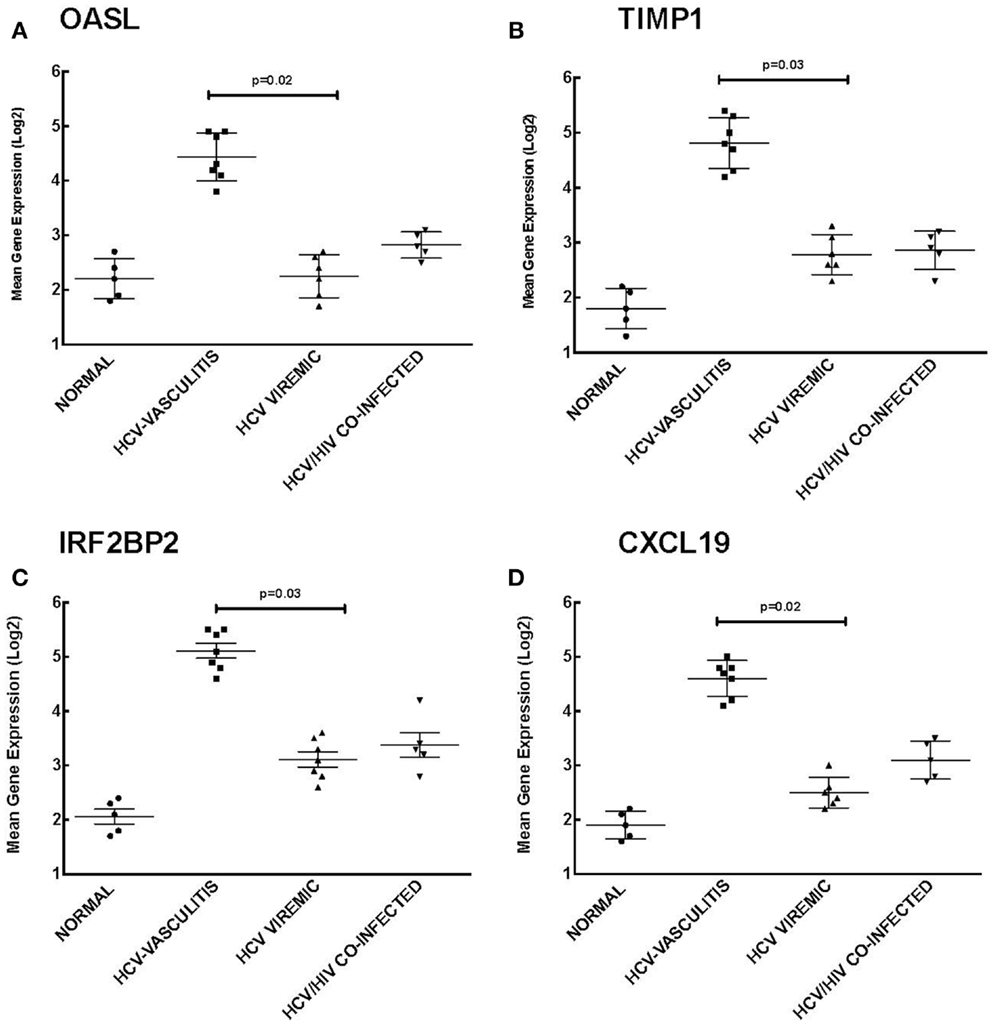
Figure 4. Validation of Cluster 3 microarray data by qPCR analysis. DNA microarray expression of four relevant ISGs selected from Cluster 3 was validated by qRT-PCR as described in the Section “Materials and Methods.” Levels of mean gene expression were calculated in comparison to that of GAPDH. The expression of OASL (A), TIMP1 (B), IRF2BP2 (C), and CXCL16 (D) was up-regulated in the HCV MC vasculitis cohort compared to the other groups (p = 0.02, 0.03, 0.03, and 0.02, respectively between HCV MC-Vasc and HCV viremic).
Evidence for Activation of Monocytes in HCV-Associated MC Vasculitis
In order to determine which cells contribute to this increased ISG expression observed in the MC vasculitis patients, we performed enrichment and depletion studies in PBMCs for B cells and monocytes. The expression of ISGs in each cell subset was then quantified.
Our data indicate that B cell enrichment and depletion of PBMCs have no effect on ISG expression levels (Figure 5). As shown in Figure 5, the mean gene expression of ISGs MAX interactor 1 (MX1), 2′-5′-oligoadenylate synthetase (OAS1), interferon-induced protein with tetratricopeptide repeats 1 (IFIT1), and interferon-induced protein 44 (IFI44) was not statistically significant between PBMCs, B cell enriched PBMCs, and B cell depleted PBMCs. These results suggest a novel observation that the increase in ISG expression seen among the HCV MC vasculitis patient cohort is not directly due to the monoclonal expansion of B cells in MC vasculitis pathogenesis.
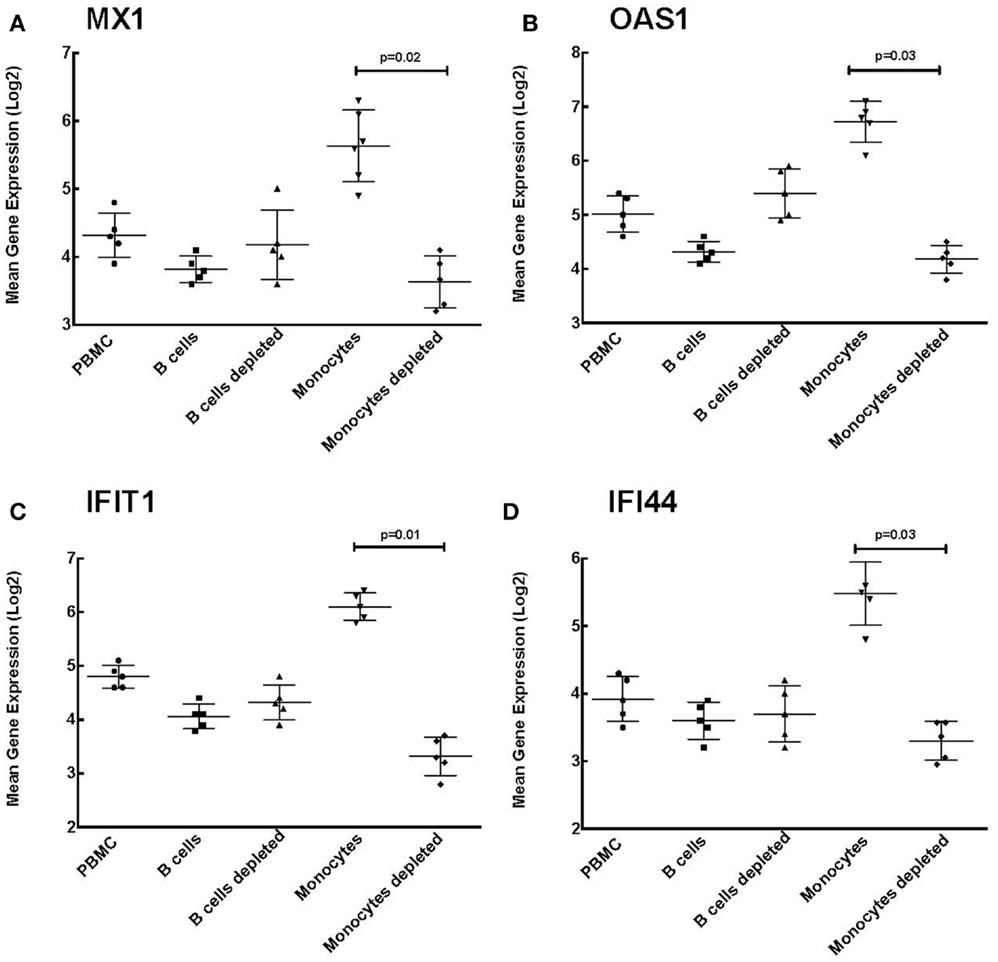
Figure 5. Monocyte enrichment of PBMCs leads to increased ISG expression. Expression of ISGs was quantified in total PBMCs, B cell enriched PBMCs, B cell depleted PBMCs, monocyte enriched PBMCs, and monocyte depleted PBMCs. Levels of mean gene expression of four selected ISGs, MX1 (A), OAS1 (B), IFIT1 (C), and IFI44 (D), were calculated in comparison to that of GAPDH. The expression of all four ISGs, MX1 (p = 0.02 between monocyte depleted and enriched), OAS1 (p = 0.03 between monocyte depleted and enriched), IFIT1 (p = 0.01 between monocyte depleted and enriched), and IFI44 (p = 0.03 between monocyte depleted and enriched), was significantly higher in monocyte enriched PBMCs compared to total PBMCs and monocyte depleted PBMCs, while no such differences were observed when B cells were depleted.
However, levels of MX1 expression were significantly higher in monocyte enriched PBMCs compared to the other cell subsets [4.30 ± 0.80 (PBMC), 3.80 ± 0.70 (B cells), 4.20 ± 1.00 (B cells depleted), 5.60 ± 0.80 (monocytes), and 3.67 ± 0.70 (monocytes depleted); p = 0.02 between monocyte enriched and depleted]. This was also true of OAS1 [5.00 ± 0.90 (PBMC), 4.30 ± 0.80 (B cells), 5.40 ± 0.90 (B cells depleted), 6.80 ± 0.60 (monocytes), and 4.20 ± 0.70 (monocytes depleted); p = 0.03 between monocyte enriched and depleted], IFIT1 [4.80 ± 0.60 (PBMC), 4.10 ± 0.60 (B cells), 4.30 ± 0.60 (B cells depleted), 6.10 ± 0.80 (monocytes), and 3.30 ± 0.60 (monocytes depleted); p = 0.01 between monocyte enriched and depleted], and IFI44 [3.90 ± 0.60 (PBMC), 3.60 ± 0.70 (B cells), 3.70 ± 0.50 (B cells depleted), 5.50 ± 0.40 (monocytes), and 3.30 ± 0.50 (monocytes depleted); p = 0.03 between monocyte enriched and depleted].
The higher expression levels of ISGs in monocyte enriched PBMCs compared to that seen in total PBMCs suggest that monocytes are likely responsible for the increased ISG expression among the HCV MC vasculitis cohort. Therefore, the probable mechanism underlying increased ISG expression is the indirect activation of monocytes by the monoclonal expansion of B cells in MC vasculitis.
Discussion
Mixed cryoglobulinemic vasculitis is a common extrahepatic manifestation of CHC and can cause fulminant complications such as glomerulonephritis. CHC-associated MC vasculitis is characterized by HCV-driven monoclonal expansion of B cells producing IgM with rheumatoid factor activity (6, 9). These autoantibodies form complexes with circulating IgG and HCV particles, which are deposited in blood vessel and glomerular capillaries. The deposited cryoglobulins can stimulate the complement system and activate tissue damage and eventual end-organ damage, particularly of skin and kidneys (6, 9). However, not much is known about the mechanisms that trigger HCV induction of MC in some patients with CHC. Investigating the gene expression profile of HCV MC vasculitis patients is necessary to better elucidate the pathophysiology of CHC-induced MC vasculitis. In this study, we demonstrate that PBMCs from patients with HCV-associated MC vasculitis have a distinct gene expression profile when compared to PBMCs from patients with HCV and no vasculitis.
Overall, the gene expression profile of HCV-associated MC vasculitis reflects compromised neutrophil function, impaired chemotaxis, and an enhanced endogenous interferon gene signature. Notably, the peripheral ISG signature appears to be predominantly a result of the activation of monocytes, a novel observation that helps to elucidate the pathogenesis in HCV MC vasculitis patients. HCV MC vasculitis is thought to be primarily mediated by monoclonal expansion of B cells. In this study, we were able to demonstrate that other immune cells are also affected and contribute significantly to the disease pathogenesis. We have shown that elevated ISG expression, considered to be a bad prognostic factor for clearing HCV, is mediated by monocytes in HCV MC patients.
First, our microarray analysis suggests decreased cellular defense gene expression in HCV monoinfected subjects, with or without MC vasculitis. HCV has been shown to evade host immune mechanisms (25, 26), consistent with the down-regulation of defensins in the two HCV monoinfected patient groups. The enhanced antibody-dependent cell cytotoxicity associated with HCV MC vasculitis and leading to end-organ damage is mediated in part by neutrophils (27). These results suggest a depletion of alpha-defensin production in neutrophils either as a result of exhaustion or due to the influence of systemic corticosteroid administration, which some subjects were receiving at the time of the study. Due to the rare occurrence of HCV MC vasculitis and the lack of access to these patients, it was difficult to find a subject cohort who was not taking systemic corticosteroids, a limitation of our study. However, to ensure that the effects of systemic corticosteroids were minimal, we drew trough research samples 1 h before the daily dose of prednisone. Additionally, the clinical manifestations of HCV MC vasculitis were similar among all the patients whether or not they were taking corticosteroids.
Second, the presence of MC vasculitis appears to impair chemotaxis and response to external stimuli. The expression of several chemokines was down-regulated in HCV MC vasculitis patients when compared to HCV monoinfected patients. In particular, CCL20, involved in migration of lymphocytes to the liver (28), had a greater than twofold down-regulation at the transcript level in HCV MC vasculitis patients. These results suggest the presence of aberrant chemotactic pathways that exist in HCV-associated MC vasculitis as a result of an ongoing extrahepatic inflammatory response. In HCV-infected subjects, the liver is the primary organ of inflammatory response and the site of migration for immune cells. However, in patients with MC vasculitis and HCV infection, immune cells may in fact migrate to peripheral extrahepatic sites such as the kidneys and/or skin. Markers such as CD69 that represent early activation of lymphocytes are not up-regulated in the HCV MC vasculitis group, suggesting a distinct pattern of immune activation in HCV MC patients than that observed with HIV/HCV coinfected subjects.
Third, HCV MC vasculitis subjects also had increased expression of ISGs, an indicator of poor response to interferon-alpha-based therapy. B cell enrichment had no effect on ISG expression while monocyte enrichment of PBMCs led to significantly higher levels of ISG expression. This is a novel observation demonstrating that activation of monocytes may contribute to the pathogenic mechanisms in HCV MC vasculitis. Since most HCV MC vasculitis patients have undergone HCV treatment with interferon and ribavirin, it is probable that the enhanced ISG induction is an indicator of non-response and not specific to underlying vasculitis (29, 30). Hence, further analysis of PBMC gene expression profiles before and after in vivo B cell depletion is necessary to completely elucidate this pathway of monocyte activation and the role played by monoclonal B cells.
In summary, our study offers a preliminary analysis of the differential regulation of host gene expression in subjects with HCV-related MC vasculitis. Future studies will be focused on identifying the specific mechanisms behind the viral induction of B cell proliferation and the role of B cells in increased ISG expression in the context of B cell depletion therapy.
Conflict of Interest Statement
The authors declare that the research was conducted in the absence of any commercial or financial relationships that could be construed as a potential conflict of interest.
Acknowledgments
This study has been funded in whole with the federal funds from the intramural program of the National Institute of Allergy and Infectious Diseases at the National Institutes of Health, Bethesda, MD, USA. Disclaimer: the views or policies of the Department of Health and Human Services are not necessarily reflected in this content. The U.S. Government does not endorse any trade names, commercial products, or organizations mentioned.
References
1. Hadigan C, Kottilil S. Hepatitis C virus infection and coinfection with human immunodeficiency virus: challenges and advancements in management. JAMA (2011) 306:294–301. doi:10.1001/jama.2011.975
2. Ashfaq UA, Javed T, Rehman S, Nawaz Z, Riazuddin S. An overview of HCV molecular biology, replication and immune responses. Virol J (2011) 8:161. doi:10.1186/1743-422X-8-161
3. National institutes of health consensus development conference statement: management of hepatitis C 2002 (June 10-12, 2002). Gastroenterology (2002) 123:2082–99. doi:10.1053/gast.2002.1232082
4. Jacobson IM, Cacoub P, Dal Maso L, Harrison SA, Younossi ZM. Manifestations of chronic hepatitis C virus infection beyond the liver. Clin Gastroenterol Hepatol (2010) 8:1017–29. doi:10.1016/j.cgh.2010.08.026
5. Galossi A, Guarisco R, Bellis L, Puoti C. Extrahepatic manifestations of chronic HCV infection. J Gastrointestin Liver Dis (2007) 16:65–73.
6. Dore MP, Fattovich G, Sepulveda AR, Realdi G. Cryoglobulinemia related to hepatitis C virus infection. Dig Dis Sci (2007) 52:897–907. doi:10.1007/s10620-006-9510-9
7. Ferri C, La Civita L, Longombardo G, Greco F, Bombardieri S. Hepatitis C virus and mixed cryoglobulinaemia. Eur J Clin Invest (1993) 23:399–405. doi:10.1111/j.1365-2362.1993.tb00782.x
8. Saadoun D, Bieche I, Maisonobe T, Asselah T, Laurendeau I, Piette JC, et al. Involvement of chemokines and type 1 cytokines in the pathogenesis of hepatitis C virus-associated mixed cryoglobulinemia vasculitis neuropathy. Arthritis Rheum (2005) 52:2917–25. doi:10.1002/art.21270
10. Lamprecht P, Gause A, Gross WL. Cryoglobulinemic vasculitis. Arthritis Rheum (1999) 42:2507–16. doi:10.1002/1529-0131(199912)42:12<2507::AID-ANR2>3.0.CO;2-#
11. Antonelli A, Ferri C, Galeazzi M, Giannitti C, Manno D, Mieli-Vergani G, et al. HCV infection: pathogenesis, clinical manifestations and therapy. Clin Exp Rheumatol (2008) 26:S39–47.
12. Saadoun D, Delluc A, Piette JC, Cacoub P. Treatment of hepatitis C-associated mixed cryoglobulinemia vasculitis. Curr Opin Rheumatol (2008) 20:23–8. doi:10.1097/BOR.0b013e3282f1330c
13. Sneller MC, Hu Z, Langford CA. A randomized controlled trial of rituximab following failure of antiviral therapy for hepatitis C virus-associated cryoglobulinemic vasculitis. Arthritis Rheum (2012) 64:835–42. doi:10.1002/art.34322
14. Kottilil S, Yan MY, Reitano KN, Zhang X, Lempicki R, Roby G, et al. Human immunodeficiency virus and hepatitis C infections induce distinct immunologic imprints in peripheral mononuclear cells. Hepatology (2009) 50:34–45. doi:10.1002/hep.23055
15. Ganz T. Defensins: antimicrobial peptides of innate immunity. Nat Rev Immunol (2003) 3:710–20. doi:10.1038/nri1180
16. Rodriguez-Garcia M, Climent N, Oliva H, Casanova V, Franco R, Leon A, et al. Increased alpha-defensins 1-3 production by dendritic cells in HIV-infected individuals is associated with slower disease progression. PLoS One (2010) 5:e9436. doi:10.1371/journal.pone.0009436
17. Zlotnik A, Yoshie O, Nomiyama H. The chemokine and chemokine receptor superfamilies and their molecular evolution. Genome Biol (2006) 7:243. doi:10.1186/gb-2006-7-12-243
18. Lee SC, Brummet ME, Shahabuddin S, Woodworth TG, Georas SN, Leiferman KM, et al. Cutaneous injection of human subjects with macrophage inflammatory protein-1 alpha induces significant recruitment of neutrophils and monocytes. J Immunol (2000) 164:3392–401. doi:10.4049/jimmunol.164.6.3392
19. De Filippo K, Dudeck A, Hasenberg M, Nye E, van Rooijen N, Hartmann K, et al. Mast cell and macrophage chemokines CXCL1/CXCL2 control the early stage of neutrophil recruitment during tissue inflammation. Blood (2013) 121:4930–7. doi:10.1182/blood-2013-02-486217
20. Shinoda K, Tokoyoda K, Hanazawa A, Hayashizaki K, Zehentmeier S, Hosokawa H, et al. Type II membrane protein CD69 regulates the formation of resting T-helper memory. Proc Natl Acad Sci U S A (2012) 109:7409–14. doi:10.1073/pnas.1118539109
21. Ishibashi M, Wakita T, Esumi M. 2’,5’-Oligoadenylate synthetase-like gene highly induced by hepatitis C virus infection in human liver is inhibitory to viral replication in vitro. Biochem Biophys Res Commun (2010) 392:397–402. doi:10.1016/j.bbrc.2010.01.034
22. Neuman MG, Schmilovitz-Weiss H, Hilzenrat N, Bourliere M, Marcellin P, Trepo C, et al. Markers of inflammation and fibrosis in alcoholic hepatitis and viral hepatitis C. Int J Hepatol (2012) 2012:231210. doi:10.1155/2012/231210
23. Childs KS, Goodbourn S. Identification of novel co-repressor molecules for interferon regulatory factor-2. Nucleic Acids Res (2003) 31:3016–26. doi:10.1093/nar/gkg431
24. Matloubian M, David A, Engel S, Ryan JE, Cyster JG. A transmembrane CXC chemokine is a ligand for HIV-coreceptor Bonzo. Nat Immunol (2000) 1:298–304. doi:10.1038/79738
25. Chen Y, Chen J, Wang H, Shi J, Wu K, Liu S, et al. HCV-induced miR-21 contributes to evasion of host immune system by targeting MyD88 and IRAK1. PLoS Pathog (2013) 9:e1003248. doi:10.1371/journal.ppat.1003248
26. Larrea E, Riezu-Boj JI, Aldabe R, Guembe L, Echeverria I, Balasiddaiah A, et al. Dysregulation of interferon regulatory factors impairs the expression of immunostimulatory molecules in hepatitis C virus genotype 1-infected hepatocytes. Gut (2013) 63(4):665–73. doi:10.1136/gutjnl-2012-304377
27. Cacoub P, Renou C, Rosenthal E, Cohen P, Loury I, Loustaud-Ratti V, et al. Extrahepatic manifestations associated with hepatitis C virus infection. A prospective multicenter study of 321 patients. The GERMIVIC. Groupe d’Etude et de Recherche en Medecine Interne et Maladies Infectieuses sur le Virus de l’Hepatite C. Medicine (Baltimore) (2000) 79:47–56. doi:10.1097/00005792-200001000-00005
28. Oo YH, Banz V, Kavanagh D, Liaskou E, Withers DR, Humphreys E, et al. CXCR3-dependent recruitment and CCR6-mediated positioning of Th-17 cells in the inflamed liver. J Hepatol (2012) 57:1044–51. doi:10.1016/j.jhep.2012.07.008
29. Chen L, Borozan I, Feld J, Sun J, Tannis LL, Coltescu C, et al. Hepatic gene expression discriminates responders and nonresponders in treatment of chronic hepatitis C viral infection. Gastroenterology (2005) 128:1437–44. doi:10.1053/j.gastro.2005.01.059
30. Lempicki RA, Polis MA, Yang J, McLaughlin M, Koratich C, Huang DW, et al. Gene expression profiles in hepatitis C virus (HCV) and HIV coinfection: class prediction analyses before treatment predict the outcome of anti-HCV therapy among HIV-coinfected persons. J Infect Dis (2006) 193:1172–7. doi:10.1086/501365
Appendix
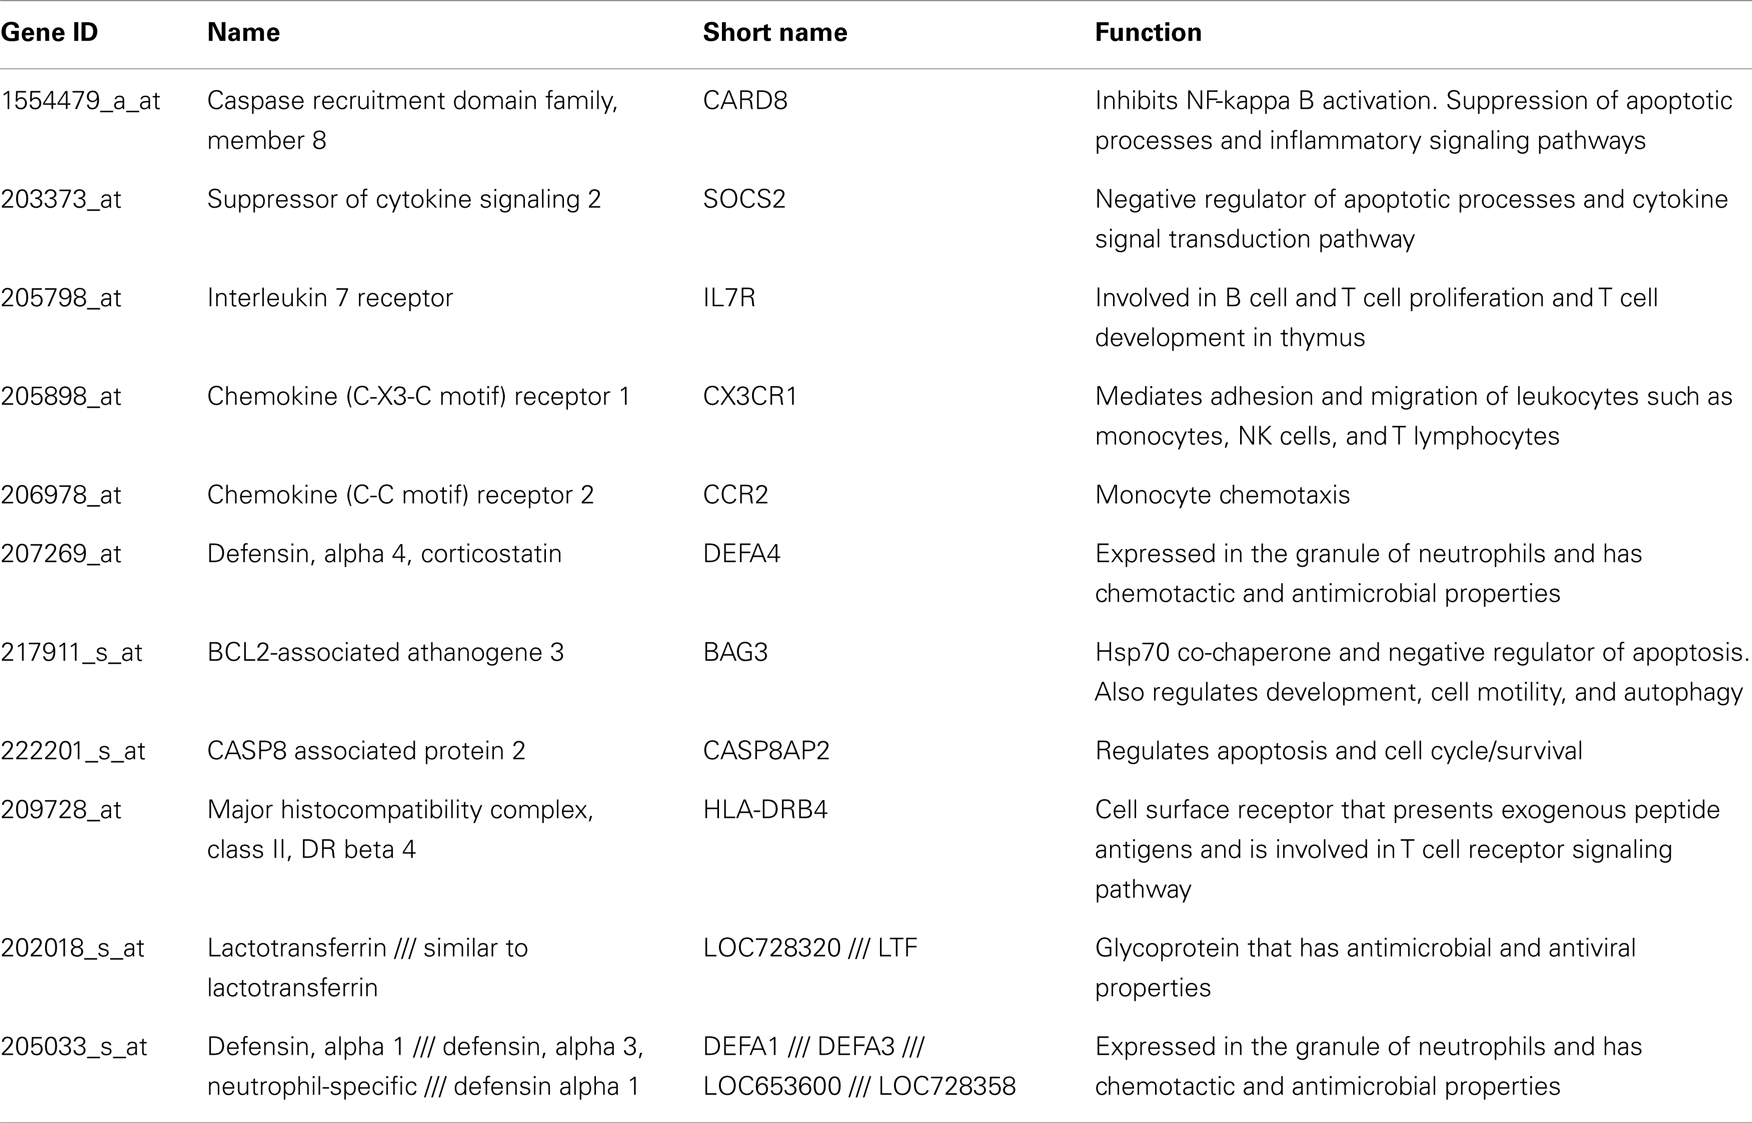
Table A1. Genes down regulated in all HCV subjects compared to normal.
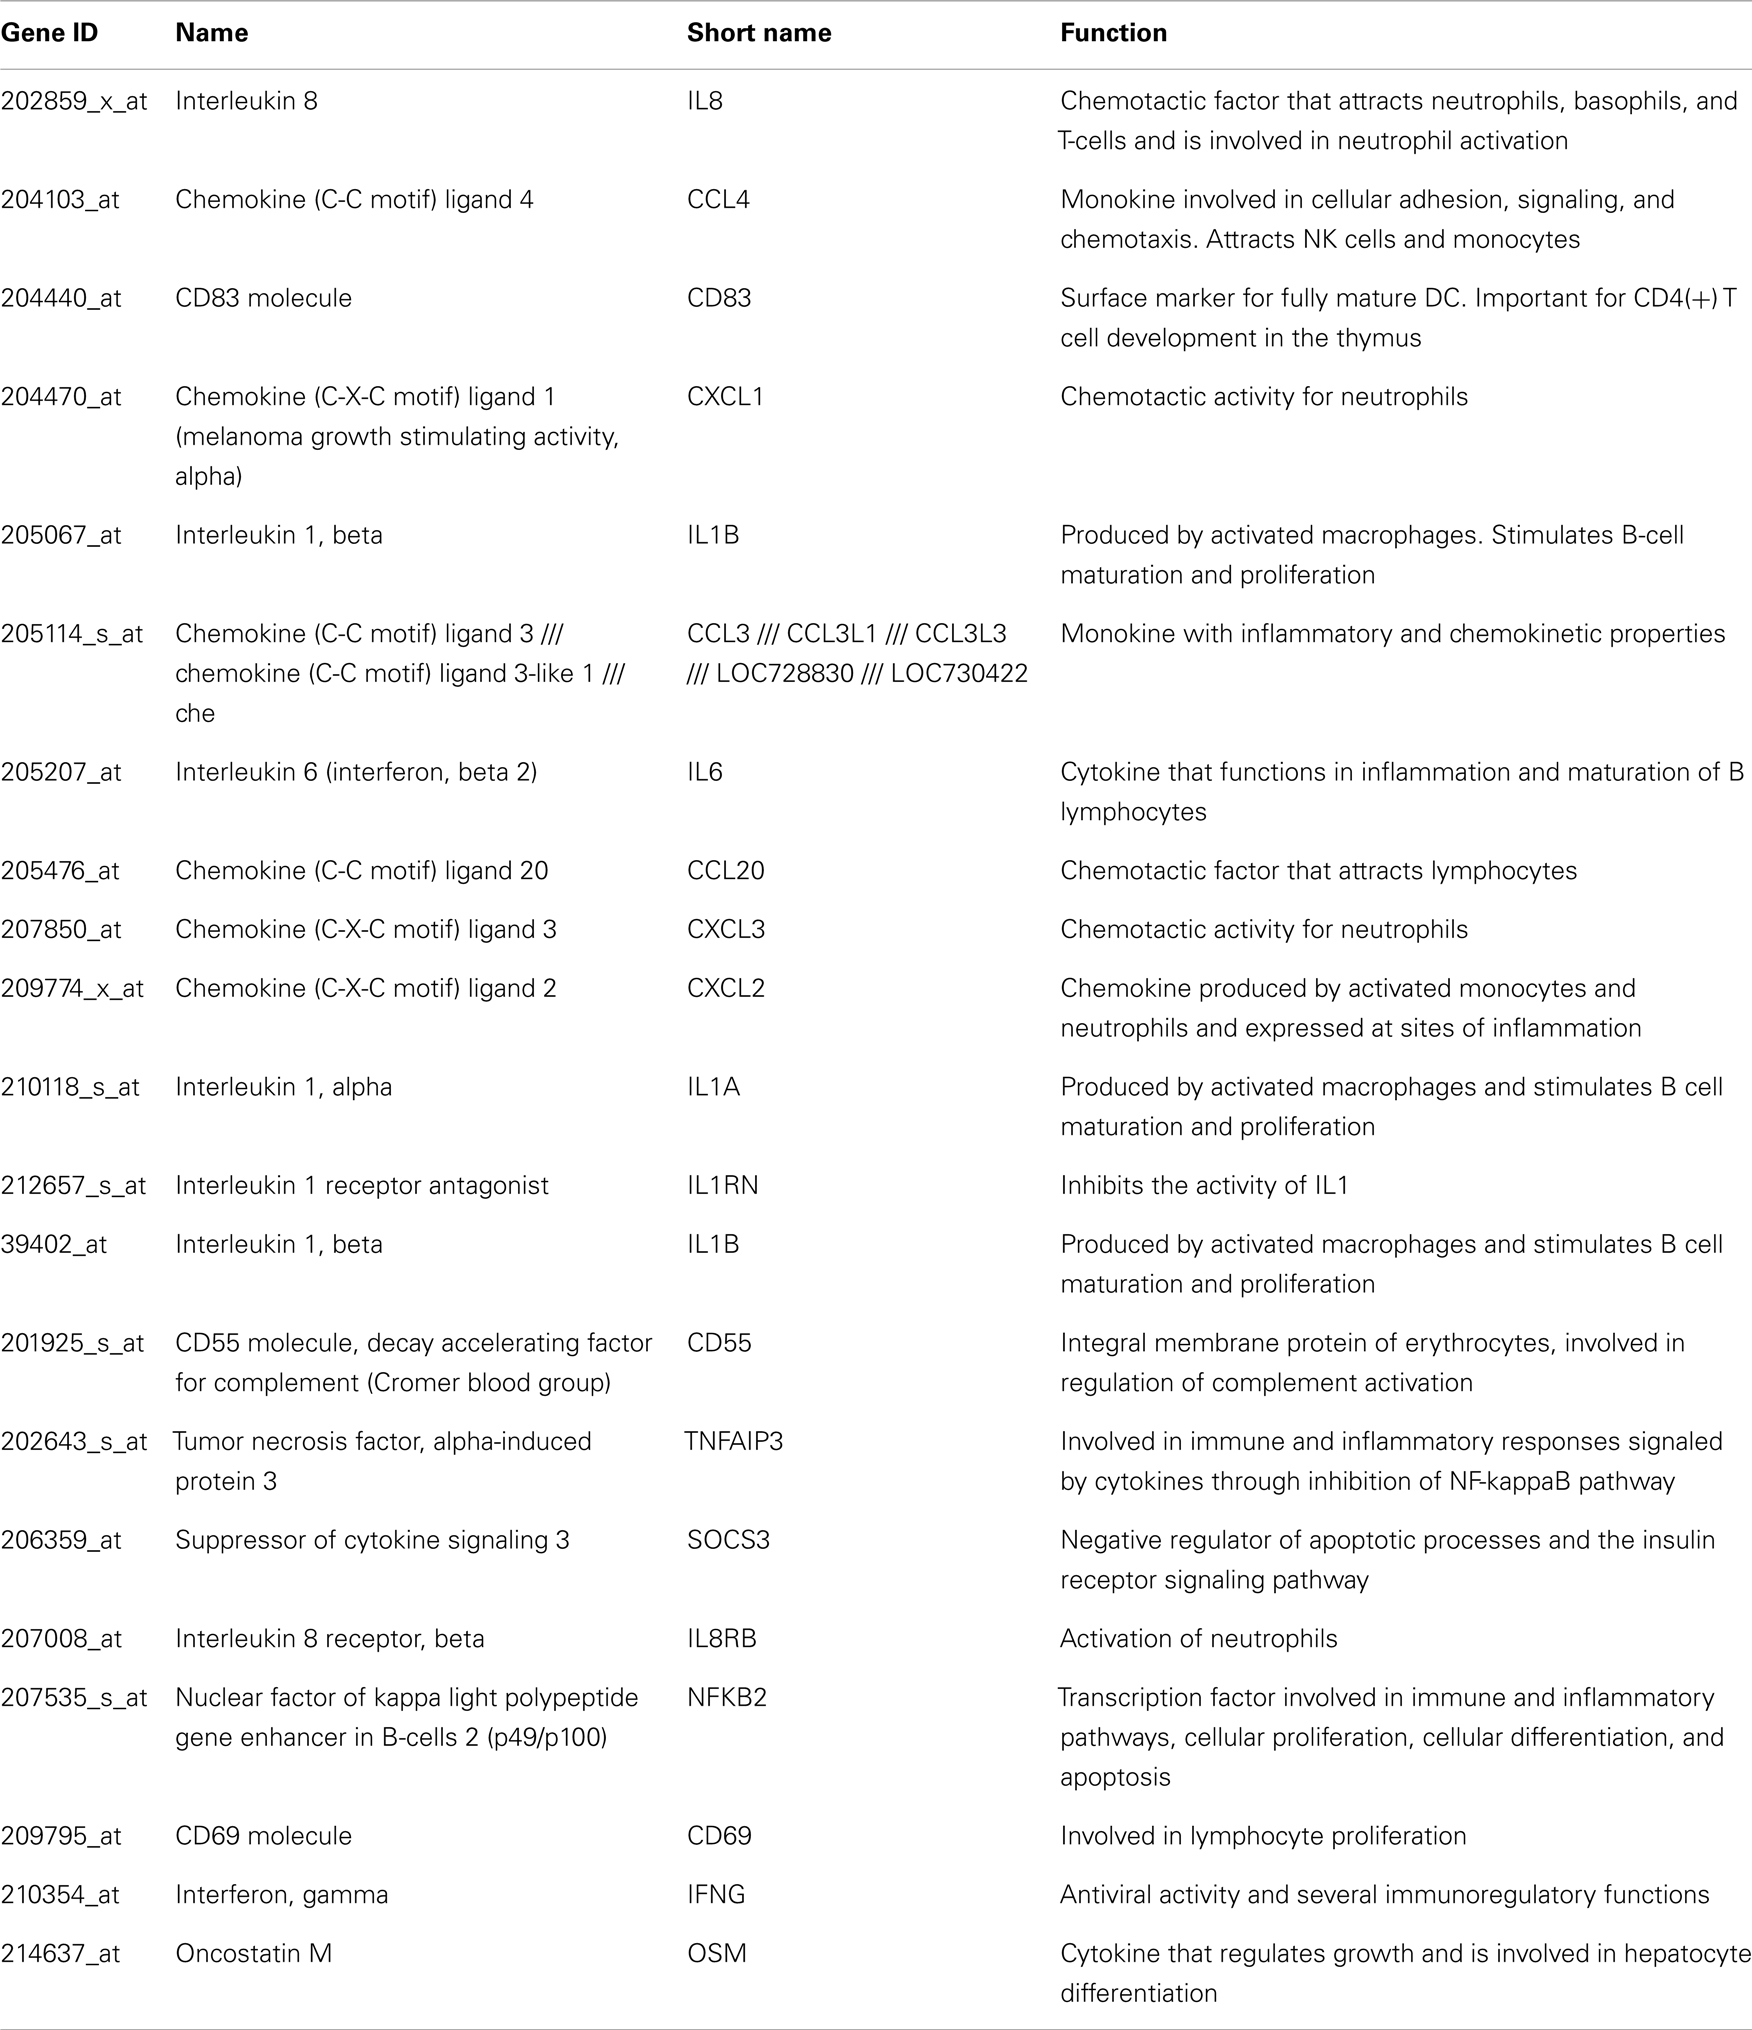
Table A2. Genes upregulated in HCV monoinfected subjects.
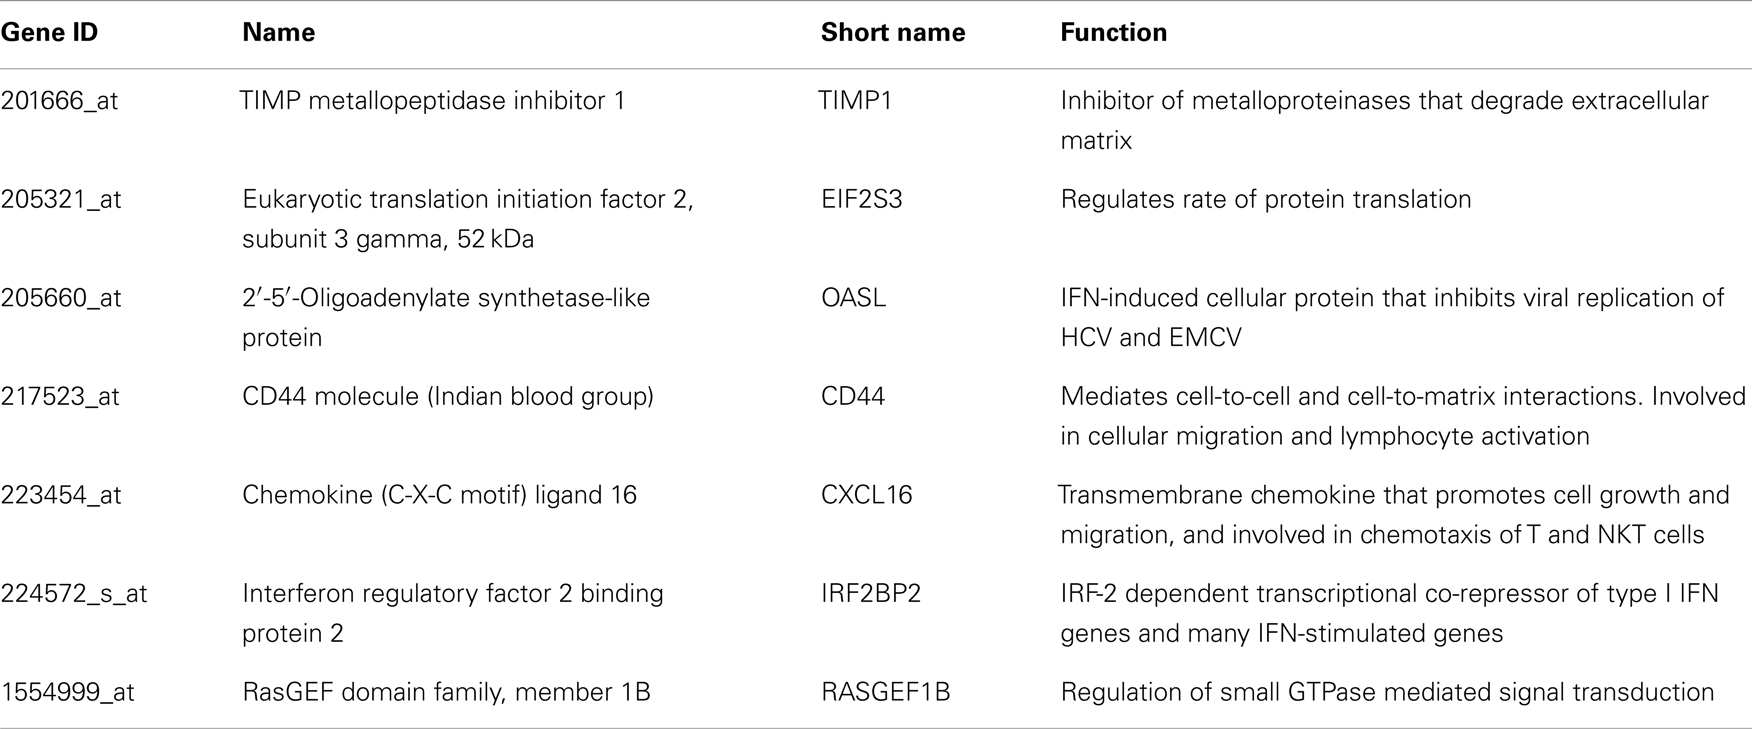
Table A3. Genes up regulated in all HCV vasculitis subjects compared to others.
Keywords: hepatitis C, mixed cryoglobulinemia, vasculitis, interferon-stimulated genes
Citation: Sidharthan S, Kim C-W, Murphy AA, Zhang X, Yang J, Lempicki RA, Sneller MC and Kottilil S (2014) Hepatitis C-associated mixed cryoglobulinemic vasculitis induces differential gene expression in peripheral mononuclear cells. Front. Immunol. 5:248. doi: 10.3389/fimmu.2014.00248
Received: 26 December 2013; Accepted: 12 May 2014;
Published online: 27 May 2014.
Edited by:
Lynn B. Dustin, University of Oxford, UKReviewed by:
António Gil Castro, University of Minho, PortugalEdgar D. Charles, Merck Sharpe and Dohme Co., USA
Copyright: © 2014 Sidharthan, Kim, Murphy, Zhang, Yang, Lempicki, Sneller and Kottilil. This is an open-access article distributed under the terms of the Creative Commons Attribution License (CC BY). The use, distribution or reproduction in other forums is permitted, provided the original author(s) or licensor are credited and that the original publication in this journal is cited, in accordance with accepted academic practice. No use, distribution or reproduction is permitted which does not comply with these terms.
*Correspondence: Shyam Kottilil, Immunopathogenesis Section, Laboratory of Immunoregulation, National Institute of Allergy and Infectious Diseases, National Institutes of Health, Building 10, Room 11N204, Bethesda, MD 20892, USA e-mail: skottilil@niaid.nih.gov
†Sreetha Sidharthan and Cheol-Woo Kim have contributed equally to this work.