 Stephanie A. Bora1,2
 Mary J. Kennett1Philip B. Smith2,3
 Andrew D. Patterson1,2,3
 Margherita T. Cantorna1,2*
- 1Department of Veterinary and Biomedical Sciences, The Pennsylvania State University, University Park, PA, United States
- 2The Huck Institutes of Life Sciences, The Pennsylvania State University, University Park, PA, United States
- 3Eberly College of Science, The Pennsylvania State University, University Park, PA, United States
To determine the effect of the microbiota on vitamin D metabolism, serum 25-hydroxyvitamin D(25D), 24,25-dihydroxyvitamin D (24,25D), and 1,25-dihydroxyvitamin D (1,25D) were measured in germ-free (GF) mice before and after conventionalization (CN). GF mice had low levels of 25D, 24,25D, and 1,25D and were hypocalcemic. CN of the GF mice with microbiota, for 2 weeks recovered 25D, 24,25D, and 1,25D levels. Females had more 25D and 24,25D than males both as GF mice and after CN. Introducing a limited number of commensals (eight commensals) increased 25D and 24,25D to the same extent as CN. Monocolonization with the enteric pathogen Citrobacter rodentium increased 25D and 24,25D, but the values only increased after 4 weeks of C. rodentium colonization when inflammation resolved. Fibroblast growth factor (FGF) 23 was extremely high in GF mice. CN resulted in an increase in TNF-α expression in the colon 2 days after CN that coincided with a reduction in FGF23 by 3 days that eventually normalized 25D, 24,25D, 1,25D at 1-week post-CN and reinstated calcium homeostasis. Neutralization of FGF23 in GF mice raised 1,25D, without CN, demonstrating that the high FGF23 levels were responsible for the low calcium and 1,25D in GF mice. The microbiota induce inflammation in the GF mice that inhibits FGF23 to eventually reinstate homeostasis that includes increased 25D, 24,25D, and 1,25D levels. The microbiota through FGF23 regulates vitamin D metabolism.
Introduction
The gastrointestinal tract is colonized with complex communities of microorganisms that regulate host metabolism and immune function (1, 2). Germ-free (GF) mice are useful for determining the effects of microbes on host physiology. Experimental animal models of inflammatory bowel disease (IBD) fail to develop in GF mice (2–4). GF mice have underdeveloped immune systems and elevated Th2 responsiveness and reduced Th1/Th17 and Treg responses (2, 5, 6). Colonization of GF mice with microbes decreased the Th2 response, increased the Th1 and Th17 responses and induced regulatory T cells (7–9). The microbiome is an important regulator of immunity.
Vitamin D is either produced in the skin following UVB exposure, or consumed as part of the diet. Vitamin D is inactive and is hydroxylated twice to form the high affinity ligand for the vitamin D receptor (VDR), 1,25-dihydroxyvitamin D (1,25D). The vitamin D metabolizing enzymes are CypP450 genes. Vitamin D 25hydroxylation occurs in the liver, where Cyp2R1 and possibly Cyp27A1 catalyze the production of 25-hydroxyvitamin D (25D) (10). 25D is a relatively stable molecule, has a relatively long half-life, and reflects vitamin D intake (11). 25D is a low affinity ligand for the VDR, and under normal physiological conditions does not bind to the VDR (12). The vitamin D 1 α-hydroxylase (Cyp27B1) is expressed primarily in kidney and produces 1,25D (13). 1,25D binds to the VDR in nanomolar concentrations and acts as a transcription regulator (14). Cyp enzymes found in either the liver or kidney regulate endocrine vitamin D metabolism.
Vitamin D regulates calcium homeostasis and bone formation. The level of circulating 1,25D is tightly controlled by multiple interconnected feedback loops to maintain serum calcium levels in a small range (15, 16). When serum calcium is low, the parathyroid hormone (PTH) goes up and stimulates Cyp27B1 in the kidney to produce 1,25D (17). The increase in 1,25D inhibits PTH expression and induces the expression of the vitamin D 24hydroxylase (Cyp24A1). Cyp24A1 hydroxylates both 25D and 1,25D to form 24,25-dihydroxyvitamin D (24,25D) and 1,24,25-trihydroxyvitamin D, which leads to the clearance of 1,25D and a decreased pool of available 25D (18–21). Fibroblast growth factor (FGF) 23 inhibits PTH and induces Cyp24A1, which results in decreased 1,25D production (22). FGF23, PTH, and 1,25D form a series of feedback loops that together regulate 1,25D production to maintain mineral homeostasis.
Vitamin D is an important regulator of experimental IBD. Cyp27B1 knockout (KO) and VDR KO mice were extremely susceptible to colitis (23). The increased susceptibilities of Cyp27B1 KO and VDR KO mice to colitis were shown to be caused in part by shifts in the composition of the gut microbiota in mice (24). Sequencing of fecal DNA from Cyp27B1 KO and VDR KO mice showed increased frequencies of Proteobacteria and colitis causing Helicobacteraceae family members (24). Vitamin D supplementation in humans and 1,25D treatment of Cyp27B1 KO mice decreased Proteobacteria and increased beneficial organisms including members of the Firmicutes phyla (24, 25). Vitamin D regulates host immunity, experimental colitis, and the composition of the microbiota.
To determine whether the microbiota regulated vitamin D metabolism; serum levels of vitamin D, 25D, 24,25D, and 1,25D were measured in GF mice before and after conventionalization (CN). GF mice had high FGF23 with low 1,25D and 24,25D, and hypocalcemia. CN for 2 weeks increased 25D, 24,25D, and 1,25D levels significantly. Colonization with only commensals [altered Schaedler’s flora (ASF)], also raised 25D, and 24,25D levels in the previously GF mice. Monocolonization with a murine enteric pathogen raised 25D, and 24,25D levels, after 4 weeks, but not 2 weeks, of colonization. Neutralizing FGF23 in GF mice was effective for increasing 1,25D and 24,25D levels. Females had higher levels of 25D and 24,25D than males both when they were GF or CN. The earliest effects of CN were on inflammation and FGF23; that was followed by changes in calcium, 1,25D, and 24,25D. GF mice have defects in vitamin D metabolism that are corrected slowly following reduction in FGF23 and reinstatement of homeostasis which includes increased 1,25D.
Materials and Methods
Mice
Germ-free C57BL/6 wild-type (WT) mice were bred and maintained at The Pennsylvania State University (University Park, PA, USA) gnotobiotic animal research facility. The GF isolators and mice are routinely monitored to ensure the GF status of the mice. All mice were fed the autoclaved sterile chow routinely fed to maintain the GF colony. In addition, GF mice have enlarged cecums, which is additional assurance of their GF status on necropsy. At the start of the experiments, mice were 5–8 weeks of age. Male and female mice were used as indicated in the figure legends. Mice were orally supplemented with 5 µg vitamin D3 in corn oil, or vehicle treated with corn oil, three times weekly. Microbial transplantation was done using the cecal contents of WT mice. For some experiments stool from ASF (Taconic Biosciences, Hudson, NY, USA) colonized mice was used as the source of microbes for transplantation. Infection with pure strains of Citrobacter rodentium used strain ICC169 (gift of Gad Frankel, London School of Medicine and Dentistry, London, United Kingdom, nalidixic acid resistant) cultured in Luria-Bertani (EMD Chemicals, Inc., Gibbstown, NJ, USA) exactly as described (26). The monoclonization with C. rodentium was confirmed by doing gram stains of the cecal contents when the mice were sacrificed. All experimental procedures were approved by the Office of Research Protection’s Institutional Animal Care and Use Committee (Pennsylvania State University).
LPS and FGF23 Neutralization
Mice were injected ip with 6 mg/kg LPS (Sigma-Aldrich, St. Louis, MO, USA) in sterile PBS and blood was collected 6 and 12 h later. For FGF23 neutralization, mice were injected ip with 5 mg/kg rat monocolonal anti-FGF23 or rat isotype control (kindly provided by Amgen, Thousand Oaks, CA, USA) three times weekly for 2 weeks, and sacrificed 24 h after the last injection.
Vitamin D Metabolite Measurements
Sample preparation was done as described by Kaufmann et al. (27). 100 µL of pooled 13C3-vitamin D3 (100 ng/mL), d3-25D3 (100 ng/mL), and d6-24,25D3 (50 ng/mL) (Isosciences, King of Prussia, PA, USA) internal standard was added to 50 µL of sample. 50 µL of 0.1 M hydrochloric acid, 50 µL 0.2 M zinc sulfate, and 225 µL of 100% methanol were added to precipitate protein as described (27). Organic extraction was done by adding 350 µL n-hexanes, 350 µL MTBE (methyl tertiary butyl ether, Acros Organics, Geel, Belgium) and collecting the upper organic phase. Derivatization was done by redissolving the dried residue in 30 µL 4-[2-(6,7-dimethoxy-4-methyl-3,4-dihydroquinoxalinyl)ethyl]-1,2,4-triazoline-3,5-dione (DMEQ-TAD, 0.1 mg/mL in ethyl acetate Santa Cruz Biotechnology, Santa Cruz, CA, USA), drying, and the residue was dissolved in 30 µL 50/50 acetonitrile/water. All other LC–MS/MS solvents and reagents were Optima LC–MS grade (Fisher Scientific, Pittsburgh, PA, USA). The limit of detection was 1 ng/mL each of vitamin D, 25D, and 24,25D. Concentrations of each vitamin D metabolite were determined by calculating the ratio of the integrated peak areas of the metabolite and the relevant internal standard, compared with the values obtained from the standard curve.
Samples (5 µL) were separated by reverse phase HPLC using a Prominence 20 UFLCXR system (Shimadzu, Columbia, MD, USA) with a Waters (Milford, MA, USA) BEH Phenyl column (100 mm × 2.1 mm 1.7 µm particle size) and a flow rate of 250 µL/min. Solvents used were HPLC grade water with 0.1% formic acid and HPLC grade acetonitrile with 0.1% formic acid. The initial conditions were 70% water and 30% acetonitrile, increasing to 50% acetonitrile at 10 min, 90% acetonitrile at 12 min where it was held at 90% acetonitrile until 13 min before returning to the initial conditions. The eluate was delivered into a 5600 (QTOF) TripleTOF using a Duospray™ ion source (AB Sciex, Framingham, MA, USA). The capillary voltage was set at 5.5 kV in positive ion mode with a declustering potential of 80 V. The mass spectrometer was operated with a 250 ms TOF scan from 50 to 950 m/z, and 7 100 ms MS/MS product ion scans (m/z 730.5, 733.5, 746.5, 749.5, 762.5, and 768.5) from 50 to 950 per duty cycle using a collision energy of 45 V with a 30 V spread.
1,25D Measurements
1,25D was measured using a chemiluminescent assay or LC–MS. LIASON XL chemiluminescent assay was performed by Dr. Claudia Zierold (detection limit 5 pg/mL, DiaSorin, Stillwater, MN, USA) (28). For measurement by LC–MS, 1,25D was first concentrated according to kit instructions (Immundiagnostick, Bensheim, Germany) and measured as described earlier using authentic standards (d3-1,25D3 and 1,25D3, Isosciences) 1,25D samples (10 µL) were separated as described earlier with a Waters (Milford, MA, USA) BEH Phenyl column (150 mm × 1.0 mm 1.7 μm particle size) and a flow rate of 90 µL/min. The eluate was delivered either into a 5600 QTOF or a 6500 QTRAP as described earlier, with two 100 ms MS/MS product ion scans (m/z 762.5 and 765.5) from 50 to 950 per duty cycle using a collision energy of 37 V. For the QTRAP the capillary voltage was 5.5 kV in positive ion mode with a declustering potential of 80 V and the collision energy was 38 V. LC–MS/MS using the QTRAP was performed by Dr. Rahul Baghla (detection limit 4 pg/mL, Sciex, Redwood City, CA, USA). Chromatograms, ion spectra, structure, and fragmentation of DMEQ-TAD 4-[2-(6,7-dimethoxy-4-methyl-3,4-dihydroquinoxalinyl)ethyl]-1,2,4-triazoline-3,5-dione (DMEQ-TAD) adducts of vitamin D, 25D, 24,25D, and 1,25D examples are shown in Figure S1 in Supplementary Material (27).
PTH, FGF23, and Calcium Measurements
Parathyroid hormone (1–84) and FGF23 were measured by ELISA, according to manufacturer’s instructions (Immutopics, San Clemente, CA, USA). Limits of detection were 32 pg/mL PTH and 25 pg/mL FGF23. Serum calcium levels were measured by colorimetric assay using QuantiChrom Calcium Assay Kit (BioAssay Systems, Hayward, CA, USA), according to manufacturer’s instructions.
RNA Isolation and RT-PCR
RNA from kidney, liver, and colon were extracted using TRIzol reagent using manufacturer’s instructions. 4 μg/sample RNA was reverse transcribed into cDNA using AMV reverse transcriptase (Promega, Madison, WI, USA). Mouse HPRT, Cyp2R1, cyp27a1, cyp24a1, cyp27b1, vdr, tnf-α, il-1β, il-6, and ifn-γ mRNA were quantified by real-time PCR using the StepOnePlus real-time PCR system (Thermo Fisher Scientific, Rockford, IL, USA) with StepOnePlus software and BioRad SYBR Green Master Mix (Hercules, CA, USA). Gene expression was determined as relative expression compared with a linear curve based on a gel-extracted standard. Values were normalized to hprt and expressed as a fold change over GF. Primer sequences can be found in Table S1 in Supplementary Material.
Colon Histology
Distal colon was fixed in 10% formalin, sectioned, and stained with hematoxylin and eosin (Pennsylvania State University Animal Diagnostic Laboratory). Sections were scored blinded by a board-certified laboratory animal veterinarian with training in pathology (Dr. Mary Kennett) and scored on a scale from 0 to 3 for extent of inflammatory cell infiltrates, and from 0 to 4 for severity of inflammatory cell infiltrates. Values of 0 = normal, 1 = mucosal, 2 = mucosal and submucosal, and 3 = mucosal, submucosal, and transmural for extent of inflammatory cell infiltrates. Values of 0 = none, 1 = minimal, 2 = mild, 3 = moderate, and 4 = marked for severity of inflammatory cell infiltration. Scores were added, resulting in a total inflammation score of 7 for each sample.
Statistical Analysis
Statistical analyses were performed using GraphPad Prism software (GraphPad, La Jolla, CA, USA). One-way ANOVA with Tukey’s post hoc and two-way ANOVA with Bonferroni’s post hoc test were used to compare levels of vitamin D metabolites, PTH, and FGF23 in mice. Two-tailed Student’s t-test was used for some vitamin D metabolite, FGF23, and calcium measurements. For all analyses, * indicates P < 0.05, ** indicates P < 0.01, and *** indicates P < 0.0001.
Results
Increased 25D and 24,25D Values following CN of GF Mice
Germ-free mice were supplemented with vitamin D for 2 and 4 weeks and vitamin D, 25D, and 24,25D levels were measured in the +D GF mice. Vitamin D levels (P = 0.1, Figure 1A) and 24,25D levels (P = 0.4, Figure 1C) were not different after 2 or 4 weeks of +D supplementation of GF mice. 25D levels were significantly lower at 2 weeks of +D supplementation than after 4 weeks of +D supplementation of GF mice (P = 0.02, Figure 1B). GF mice were vehicle treated or +D supplemented for 4 weeks (Figure 1D) as above. After 2 weeks of +D or vehicle treatment the GF mice were bled and then CN, while maintaining the vehicle and +D treatments (Figures 1E–G). The vitamin D metabolites were then measured in the mice before and after CN (Figures 1E–G). Vitamin D levels were not affected by either the vitamin D supplementation or CN (Figure 1E). The levels of 25D increased significantly in both vehicle and +D treated mice after CN (P < 0.0001, Figure 1F). The increase in 25D seen following CN of vehicle treated mice suggests that the microbiota have additional effects on 25D levels outside of any accumulation seen following the 4-week +D treatment (Figures 1B,F). +D mice had higher serum 25D compared with mice receiving vehicle (P = 0.0005), though the combination of +D and CN resulted in the greatest increase in 25D (Figure 1F). There was not a significant interaction between +D and CN on serum 25D levels (P = 0.07, Figure 1F). There was no change in 24,25D levels between vehicle (12 ng/mL) and +D (13 ng/mL) treated GF mice. CN caused an overall significant increase in 24,25D in vehicle and +D mice (P < 0.0001). There was an effect of +D supplementation on serum 24,25D levels (P = 0.009, Figure 1G). There was a significant interaction between +D and CN on 24,25D levels in the serum of mice (P = 0.002, Figure 1G). +D mice had the highest 25D and 24,25D levels following CN and therefore the rest of the experiments were done using +D treated mice.
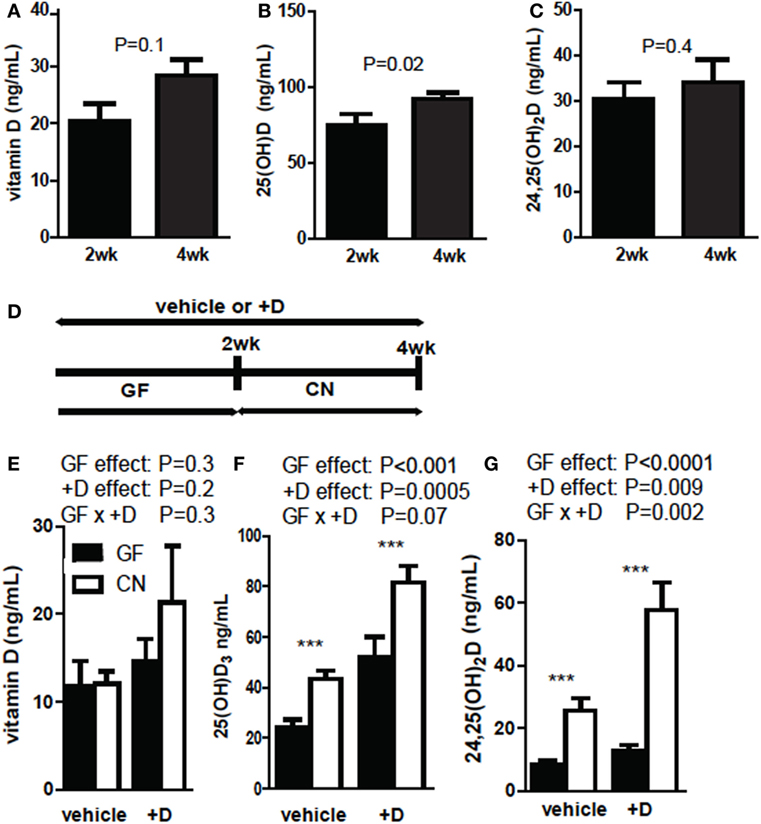
Figure 1. 25D and 24,25D increases following CN of germ-free (GF) mice. (A) Vitamin D, (B) 25D, and (C) 24,25D at 2 and 4 weeks of +D supplementation. Values are ± SEM of n = 10 mice per group, five males and five females. Student’s t-test was used to test significance. (D) Experimental design of conventionalization (CN) and vehicle or +D supplementation. (E) Vitamin D, (F) 25D, and (G) 24,25D levels from plasma of GF before and after 2-week CN. Values are the mean ± SEM of n = 9 mice per group, four males and five females, and two independent experiments. Two-way ANOVA with Bonferroni post hoc tests was used to test significance (*P < 0.05, **P < 0.01, and ***P < 0.001).
The experiments shown in Figure 1 used both male and female mice. Sex was also evaluated separately for effects on vitamin D metabolism (Figure 2). +D males had higher vitamin D levels following CN than females (Figure 2B). Overall, female mice produced more 25D than male mice (Figures 2C,D). In addition, female mice had the biggest increase in both 25D and 24,25D following CN (Figures 2C,D). There were significant effects of CN in both +D male and +D female mice for 25D and 24,25D levels (Figures 2D,F). Females produced more 25D and 24,25D than males (Figures 2C–F). Since sex is an important variable affecting the measurements of vitamin D metabolites, experiments used equal numbers of males and females when possible, or only one sex as indicated in each figure.
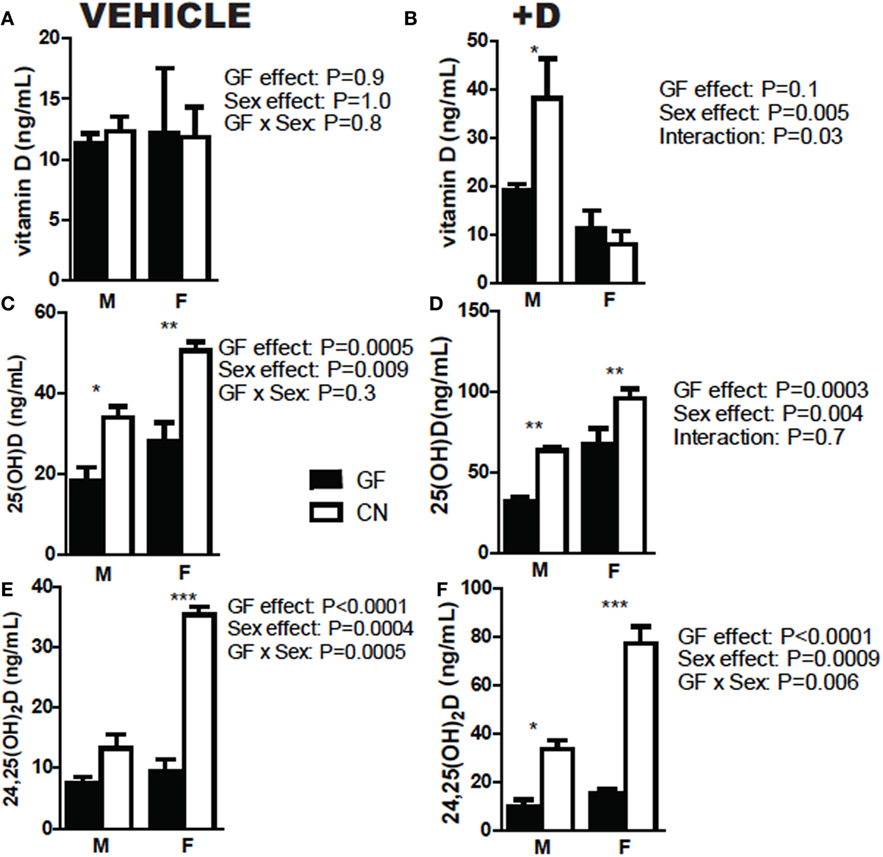
Figure 2. Females produce more 25D and 24,25D than males. (A,B) Vitamin D, (C,D) 25D, and (E,F) 24,25D in vehicle and +D, male and female mice, before and after 2 weeks conventionalization. Values are the mean ± SEM of n = 9 mice per group, four males and five females, and two independent experiments. Two-way ANOVA with Bonferroni post hoc tests was used to test significance (*P < 0.05, **P < 0.01, and ***P < 0.001).
The Effects of CN on Expression of mRNA for Cyp Metabolizing Enzymes
mRNA for cyp2R1, cyp27A1, cyp24A1, cyp27B1, and the vdr were measured in GF mice and 2-week CN mice. mRNA for cyp2r1 (P = 0.004) and cyp27a1 (P = 0.04) increased in the liver following CN (Figure S2A in Supplementary Material). In the kidney cyp24a1 was significantly inhibited (P = 0.009, Figure S2B in Supplementary Material) and cyp27b1 was significantly increased following CN (P = 0.03, Figure S2B in Supplementary Material). There was no change in kidney expression of vdr mRNA following CN of GF mice (Figure S2B in Supplementary Material). In the colon, CN resulted in an insignificant induction of cyp24a1 (P = 0.06), no effect on cyp27b1, and significant inhibition of vdr expression (Figure S2C in Supplementary Material). CN resulted in increased mRNA in the liver for Cyp2R1 and Cyp27A1 that corresponded with the increase in 25D following CN. In the kidney, expression of mRNA for cyp24a1 went down at 2 weeks post-CN, even though 24,25D levels were higher in the serum of CN mice suggesting post-transcriptional regulation of cyp24a1. Expression of cyp27b1 was higher in the kidney and VDR was higher in the colon with CN.
Kinetics of Increased 24,25D following CN of GF Mice
+D GF mice were dosed and sacrificed at several different time points following CN to determine the kinetics of the increases in 25D and 24,25D. Early following CN, vitamin D levels decreased and remained low 48 h post-CN (P = 0.005, Figure 3A). The reduced vitamin D was accompanied by reduced levels of 25D (P = 0.007, Figure 3B). 24,25D levels went up early post-CN compared with GF mice, but did not reach significance at 48 h post-CN (P = 0.4, Figure 3C). Vitamin D levels increased significantly at 3 days and were higher at 14-day post-CN than in GF female mice (P < 0.0001, Figure 3D). 25D levels in females spiked at 3 days and remained higher (insignificant) than GF mice at 14-day post-CN (P < 0.0001, Figure 3E). 24,25D levels increased in female (P < 0.0001, Figure 3B) and mixed sexes (P = 0.02) following CN (data not shown), and the increase in 24,25D was significantly higher by 7d of CN (Figure 3F). The more frequent collection of blood needed for the kinetic experiments shown in Figure 3 required sacrificing mice at different time points. The data shown in Figures 1 and 2 utilized the same mice before and after CN. This may account for the discrepancies between the effects of CN on vitamin D and 25D measurements between experiments. Nonetheless, the data are consistent for the increased 24,25D levels as a result of CN. The effects of the microbiota on 24,25D levels were evident by d7 of CN.
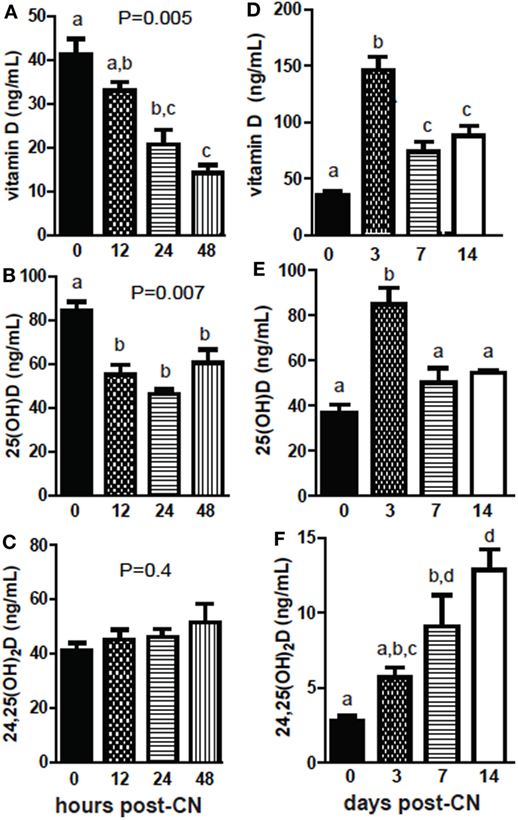
Figure 3. The kinetics of increased 24,25D following conventionalization (CN) of germ-free mice. (A) Vitamin D, (B) 25D, and (C) 24,25D from 0 to 48 h after CN. Values are the mean ± SEM of n = 3–4 males per group. (D) Vitamin D, (E) 25D, and (F) 24,25D from 0 to 2 weeks after CN. Values are the mean ± SEM of n = 5–9 female mice per group. One-way ANOVA with Tukey’s post hoc tests was used to test significance. Bars without a letter in common indicate a significant difference.
Colonization with Only Commensals Increased 24,25D
Conventionalization of GF mice increased 24,25D levels significantly across multiple experiments (Figures 1–3). ASF, which contains eight commensal organisms, was used to colonize GF mice (29, 30). Colonization of +D GF mice with ASF significantly increased vitamin D, 25D, and 24,25D levels in the serum (Figure 4). Vitamin D increased with ASF colonization at 2 weeks (P = 0.0006 Figure 4A). Increased vitamin D levels with CN have been seen in some experiments (Figure 3D) but not all (Figure 1). ASF colonization for 2 weeks increased 25D levels significantly (P < 0.0001, Figure 4B) and increased 24,25D levels significantly (P = 0.003, Figure 4C).
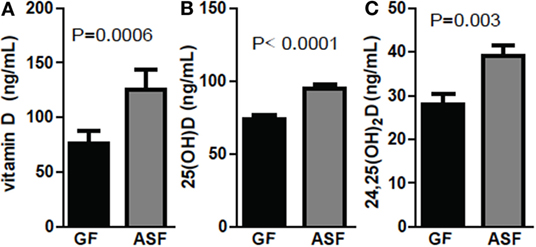
Figure 4. Colonization with commensals increased 24,25D after 2 weeks. (A) Vitamin D, (B) 25D, and (C) 24,25D levels following colonization of germ-free (GF) mice with altered Schaedler’s flora (ASF). Values are the mean ± SEM of n = 10–15 mice per group, 5 males and 10 females, and 2 independent experiments. Student’s t-test was used to test significance.
Monocolonization with C. rodentium Increased 24,25D after 4 weeks
+D GF mice were infected with C. rodentium, a murine enteric pathogen. C. rodentium infection of WT mice is cleared within 4 weeks of colonization, while in GF mice the infection is not cleared although the mice no longer exhibit symptoms [inflammation or diarrhea (31)]. Vitamin D levels went down in GF mice monocolonized with C. rodentium for 2 weeks and then back up after 4 weeks of monocolonization (Figure 5A). The changes in vitamin D over time following monocolonization with C. rodentium were not significant (P = 0.08, Figure 5A). There was a decrease in 25D at 2 weeks post-colonization with C. rodentium that mirrored the decline in vitamin D at this time point (P < 0.0001, Figure 5B). 25D levels increased significantly at 4 weeks of monocolonization compared with the levels in the GF mice before C. rodentium infection (P < 0.0001, Figure 5B). There was an insignificant increase in 24,25D at 2 weeks and a significant increase at 4 weeks of monocolonization with C. rodentium (P < 0.001, Figure 5C). Monocolonization with C. rodentium for 2 weeks decreased 25D levels and had no effect on 24,25D levels. The effects of C. rodentium monocolonization for 4 weeks were to increase 25D and 24,25D levels significantly compared with GF mice before infection (Figure 5).
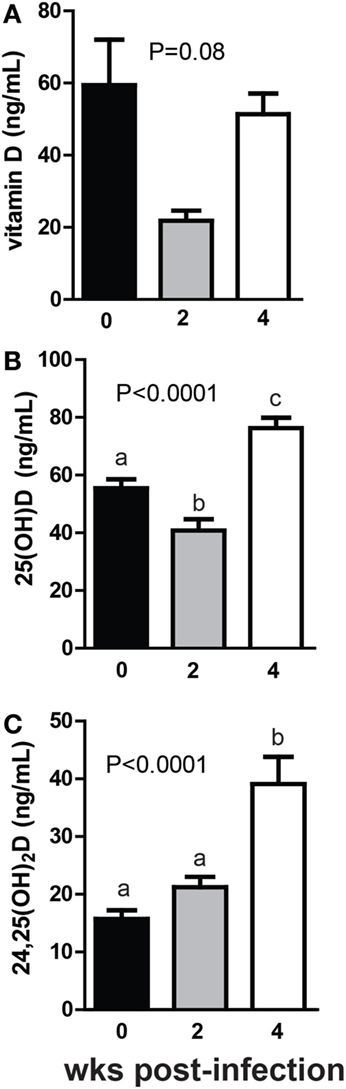
Figure 5. Monocolonization with Citrobacter rodentium increased 24,25D after 4 weeks. (A) Vitamin D, (B) 25D, and (C) 24,25D at 0, 2, and 4 weeks after colonization with 1 × 10⁹ CFU C. rodentium. Values are the mean ± SEM of n = 7–16 mice per group, 6 males and 10 females, and 2 independent experiments. One-way ANOVA with Tukey’s post hoc tests was used to test significance. Bars without a letter in common indicate a significant difference.
Effects of CN on Calcium, FGF23, and 1,25D Levels
Germ-free mice were hypocalcemic and had high levels of FGF23 and low levels of 1,25D (Figures 6A–C). PTH levels were not significantly different (data not shown). Calcium levels were low in the serum of mice 3-day post-CN and then were significantly higher at 1-week post-CN (P < 0.0001, Figure 6A). FGF23 levels went down 3-day post-CN and remained lower than GF values at 1- and 2-week post-CN (P = 0.007, Figure 6B). 1,25D levels were extremely low in GF and 3-day post-CN mice and in some experiments remained below or at detection levels (<5 pg/mL, Figure 6C; Figure S3 in Supplementary Material). 1,25D levels increased and were detectable in all mice by 1 week after CN (Figure S3 in Supplementary Material). At 2-week post-CN mice had significantly higher 1,25D levels than GF mice (P = 0.007, Figure 6C). FGF23 blocking antibodies were administered to +D GF mice. Blocking FGF23 in +D GF mice had no effect on vitamin D or 25D levels (Figures 6D,E) but significantly increased 1,25D (P = 0.02, Figure 6F) and 24,25D levels (P = 0.03, Figure 6G). Either CN or blocking FGF23 in GF mice induced 1,25D and 24,25D levels.
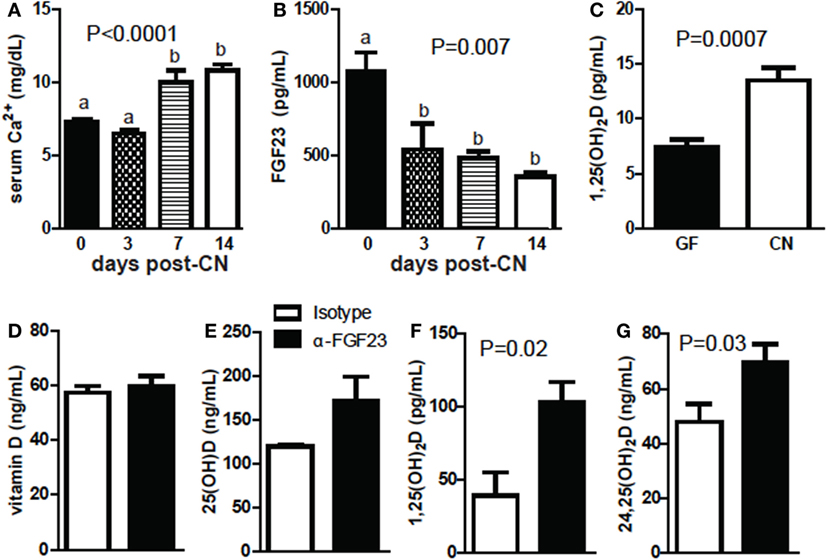
Figure 6. Conventionalization (CN) decreases fibroblast growth factor (FGF) 23 and increases calcium and 1,25D levels. (A) Serum Ca following CN of mice. Values are the mean ± SEM of n = 3–21 mice per group, and one to three independent experiments. (B) FGF23 levels following CN of mice. Values are the mean ± SEM of n = 3–6 female mice per group, and one to two experiments. One-way ANOVA with Tukey’s post hoc tests was used to test significance. Bars without a letter in common indicate a significant difference. (C) 1,25D levels following CN of previously germ-free (GF) mice. Values are the mean ± SEM of n = 7 female mice per group, from three independent experiments. (D) Vitamin D, (E) 25D, (F) 1,25D, and (G) 24,25D in GF mice receiving isotype or FGF23-neutralizing antibody. Values are the mean ± SEM of n = 6 mice per group, three males and three females. Student’s t-test was used to test significance.
The Effect of CN on Colonic Inflammation
The colon length of GF mice decreased at day 3 of CN and did not change significantly thereafter (P = 0.005, Figure 7A). Histopathology sections showed an increase in inflammation in the colon (P = 0.03, Figure 7B). Histology scores were higher at 1 week of CN and remained unchanged at 2 weeks compared with GF histology scores (Figure 7B). mRNA for tnf-α increased significantly after day 1 and was highest at day 2 of CN (P < 0.0001, Figure 7C). By day 3 of CN tnf-α mRNA went down to the same level present in GF mice (Figure 7C). mRNA in the colon for il-1β, and il-6 did not change significantly with CN (data not shown). ifn-γ mRNA was higher but not significantly higher with time post-CN (P = 0.08, Figure 7D). CN resulted in early (day 1–day 2 post-CN) expression of tnf-α mRNA in the colon and shortening of the colon compared with GF mice.
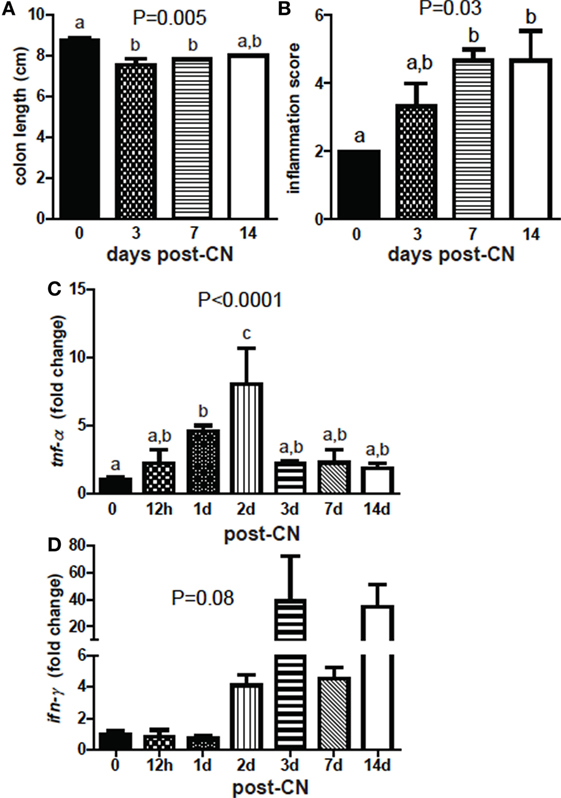
Figure 7. Conventionalization (CN) induces colonic shortening and TNF-α. (A) Colon length and (B) histological score of inflammation in distal colons from mice following CN. Values are the mean ± SEM of n = 3 females per group. (C) Expression of (C) tnf-α and (D) ifn-γ in the colon. Values are the mean ± SEM of n = 3–6 mice per group, 15 males and 6 females, and 1–2 independent experiments. One-way ANOVA with Tukey’s post hoc tests was used to test significance. Bars without a letter in common indicate a significant difference.
Endotoxemia Reduced 24,25D
Sterile inflammation was induced in +D GF mice following injection with LPS. There was no significant change in vitamin D after LPS injection (Figure 8A) There was no effect of LPS injection on 25D levels (Figure 8B). 24,25D decreased significantly after LPS injection, with the largest decrease 6 h after injection (P = 0.03, Figure 8C). Sterile inflammation reduced 24,25D levels in GF mice.
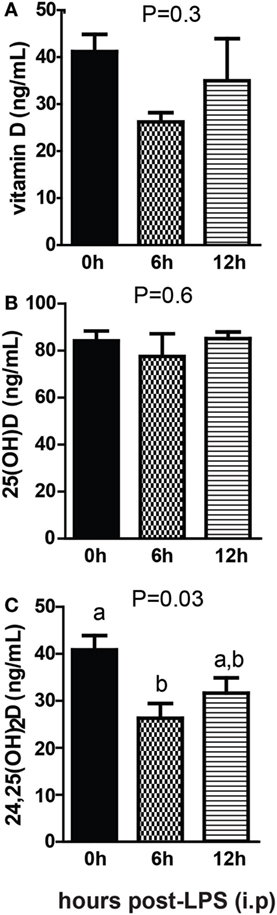
Figure 8. Sterile inflammation reduces 24,25D levels. (A) Vitamin D, (B) 25D, and (C) 24,25D from +D germ-free, 6 and 12 h after LPS injection. Values are the mean ± SEM of n = 4–5 males per group. One-way ANOVA with Tukey’s post hoc tests was used to test significance. Bars without a letter in common indicate a significant difference.
Discussion
Germ-free mice have elevated FGF23, hypocalcemia, and low 1,25D and 24,25D levels. Neutralizing FGF23 increased 1,25D and 24,25D in GF mice, providing evidence that elevated FGF23 is the cause of the low levels of 1,25D and 24,25D in the GF host. FGF23 is produced primarily by bone-mineralizing osteoblasts and osteocytes, although expression of fgf23 has been found in activated monocyte and dendritic cells (32, 33). GF mice have dense bones and fewer bone-resorbing osteoclasts than CN mice (34). CN of the GF mice normalized bone density and induced more T cells and osteoclasts in the bone marrow (34). LPS induced osteoclast development via TNF-α produced by bone marrow macrophages (35). Therefore, the dense bones found in GF mice are likely the cause of the extremely high FGF23. CN resulted in an immune mediated response to the microbiota as shown by d3 colonic shortening, histology, and early TNF-α response in the colon. The inflammatory perturbation that occurs following CN of GF mice resulted in the induction of osteoclasts that coincided with decreased FGF23. The late effects of CN on 1,25D, 24,25D and serum calcium suggest that the increase in 1,25D and 24,25D levels is a result of the reinstatement of homeostasis following normalization of FGF23.
Colonization of GF mice with only eight commensals (ASF) was the same as CN with complex microbial communities and resulted in increased 25D and 24,25D levels. The lack of differentiation between the commensals and complex microbial signals suggest that the host was responding to general bacterial signals, and not that a specific microbe is directing host vitamin D metabolism. The data might also indicate that the commensals are present in the complex microbial communities and provide the signals needed to suppress FGF23 and reinstate vitamin D homeostasis. Infection of GF mice with the murine pathogen C. rodentium decreased vitamin D and 25D levels at 2 weeks post-infection, which was likely due to decreased absorption of vitamin D while the infected mice had diarrhea. The peak of infection occurs after 1–2 weeks of C. rodentium infection and at that time there is significant inflammation and cytokine production, which resolves in both GF and CN mice by 4 weeks of infection (31). The C. rodentium pathogen induces significantly more damage to the GI tract than CN of GF mice. Once the inflammation in the GI tract resolves homeostasis is reinstated and 25D and 24,25D levels increased at 4 weeks following C. rodentium infection. Sterile inflammation following injection of GF mice with LPS significantly decreased 24,25D after 6 h. The effect of systemic inflammation is different than mucosal inflammation on the production of 24,25D. The very fast decrease in 24,25D levels following LPS injection suggests that Cyp24A1 may be directly suppressed via the LPS receptor (toll like receptor-4) or cytokine (TNF-α) signals, but this needs to be investigated further. Microbial regulation of vitamin D metabolism occurs at different rates that depend on the degree of inflammation.
Conventionalization increased 24,25D in both females and males, but females had a 2- to 2.5-fold higher increase following CN compared with males in both +D and vehicle groups. It is well known that sex hormones have effects on the microbiome (36–38). However, female/male microbial differences are probably not the cause of higher 25D and 24,25D levels in females, since ASF and CN had the same effect on 25D and 24,25D levels in both males and females. Instead the higher 25D and 24,25D might reflect more robust immune responses in females versus males, and the well described effects of estrogen on adaptive immunity (39). Estrogen and the sex effect on the immune response affect the composition of the microbiota in females (40, 41). There are also interactions between 1,25D/VDR and estradiol in females (42). Estradiol increased expression of the VDR and decreased expression of Cyp24A1 (42) suggesting direct regulation of vitamin D metabolism by estrogen. Increased 25D and 24,25D levels in female versus male mice may be due to the increased adaptive immune response in females and direct regulation of 25D and 24,25D levels by estrogen.
In the absence of the microbiota GF mice have high FGF23, and low levels of 25D, 24,25D, 1,25D, and calcium. Perturbations of homeostasis in the GF mouse resulted in the induction of an immune response that over time resulted in the reinstatement of homeostasis. In the GF mouse, the earliest changes are to the immune system and reductions in FGF23. Reduced FGF23 eventually reinstated vitamin D homeostasis, which included higher basal levels of calcium, 25D, 24,25D, and 1,25D. Disruptions in the microbiota and homeostasis of the gastrointestinal tract are associated with IBD (23). With more severe inflammation that occurs following C. rodentium infection at 2 weeks, vitamin D and 25D levels were lower. Patients with active Crohn’s disease have lower 25D levels, which is consistent with our data (43). As the inflammation in the colon resolved the 24,25D levels went up in the C. rodentium infected GF mice. Disruption of the microbiota and inflammation had important and previously unappreciated effects on the availability of 25D and 1,25D to the host.
Ethics Statement
All experimental procedures were approved by the Office of Research Protection’s Institutional Animal Care and Use Committee (Pennsylvania State University).
Author Contributions
SB designed and did the experiments, wrote the manuscript. MC designed experiments, wrote the manuscript, interpreted the results, and funded the work. MK evaluated histopathology and interpreted results. PS aided in experiment design and data interpretation. AP designed experiments and interpreted results.
Conflict of Interest Statement
The authors declare that the research was conducted in the absence of any commercial or financial relationships that could be construed as a potential conflict of interest.
The reviewer NT-J and handling editor declared their shared affiliation.
Funding
This work was supported by the United States Department of Agriculture # 2914-38420-21822 and the National Institutes of Health RO1AT005378 and R56AI114972. LC–MS/MS instruments were purchased under NSF-MRI award CBET-1126373.
Supplementary Material
The Supplementary Material for this article can be found online at http://www.frontiersin.org/articles/10.3389/fimmu.2018.00408/full#supplementary-material.
References
1. Turnbaugh PJ, Ley RE, Hamady M, Fraser-Liggett CM, Knight R, Gordon JI. The human microbiome project. Nature (2007) 449(7164):804–10. doi:10.1038/nature06244
2. Round JL, Mazmanian SK. The gut microbiota shapes intestinal immune responses during health and disease. Nat Rev Immunol (2009) 9(5):313–23. doi:10.1038/nri2515
3. Rabot S, Membrez M, Bruneau A, Gerard P, Harach T, Moser M, et al. Germ-free C57BL/6J mice are resistant to high-fat-diet-induced insulin resistance and have altered cholesterol metabolism. FASEB J (2010) 24(12):4948–59. doi:10.1096/fj.10-164921
4. Selwyn FP, Cui JY, Klaassen CD. RNA-seq quantification of hepatic drug processing genes in germ-free mice. Drug Metab Dispos (2015) 43(10):1572–80. doi:10.1124/dmd.115.063545
5. Farache J, Koren I, Milo I, Gurevich I, Kim KW, Zigmond E, et al. Luminal bacteria recruit CD103+ dendritic cells into the intestinal epithelium to sample bacterial antigens for presentation. Immunity (2013) 38(3):581–95. doi:10.1016/j.immuni.2013.01.009
6. Niess JH, Leithauser F, Adler G, Reimann J. Commensal gut flora drives the expansion of proinflammatory CD4 T cells in the colonic lamina propria under normal and inflammatory conditions. J Immunol (2008) 180(1):559–68. doi:10.4049/jimmunol.180.1.559
7. Lee YK, Menezes JS, Umesaki Y, Mazmanian SK. Proinflammatory T-cell responses to gut microbiota promote experimental autoimmune encephalomyelitis. Proc Natl Acad Sci U S A (2011) 108(Suppl 1):4615–22. doi:10.1073/pnas.1000082107
8. Ivanov II, Atarashi K, Manel N, Brodie EL, Shima T, Karaoz U, et al. Induction of intestinal Th17 cells by segmented filamentous bacteria. Cell (2009) 139(3):485–98. doi:10.1016/j.cell.2009.09.033
9. Sefik E, Geva-Zatorsky N, Oh S, Konnikova L, Zemmour D, McGuire AM, et al. MUCOSAL IMMUNOLOGY. Individual intestinal symbionts induce a distinct population of RORgamma(+) regulatory T cells. Science (2015) 349(6251):993–7. doi:10.1126/science.aaa9420
10. Zhu JG, Ochalek JT, Kaufmann M, Jones G, Deluca HF. CYP2R1 is a major, but not exclusive, contributor to 25-hydroxyvitamin D production in vivo. Proc Natl Acad Sci U S A (2013) 110(39):15650–5. doi:10.1073/pnas.1315006110
11. Jones G. Pharmacokinetics of vitamin D toxicity. Am J Clin Nutr (2008) 88(2):582S–6S. doi:10.1093/ajcn/88.2.582S
12. Rowling MJ, Gliniak C, Welsh J, Fleet JC. High dietary vitamin D prevents hypocalcemia and osteomalacia in CYP27B1 knockout mice. J Nutr (2007) 137(12):2608–15. doi:10.1093/jn/137.12.2608
13. DeLuca HF. Metabolism of vitamin D: current status. Am J Clin Nutr (1976) 29(11):1258–70. doi:10.1093/ajcn/29.11.1258
14. Jones G, Strugnell SA, DeLuca HF. Current understanding of the molecular actions of vitamin D. Physiol Rev (1998) 78(4):1193–231. doi:10.1152/physrev.1998.78.4.1193
15. Delmez JA, Tindira C, Grooms P, Dusso A, Windus DW, Slatopolsky E. Parathyroid hormone suppression by intravenous 1,25-dihydroxyvitamin D. A role for increased sensitivity to calcium. J Clin Invest (1989) 83(4):1349–55. doi:10.1172/JCI114022
16. Murayama A, Takeyama K, Kitanaka S, Kodera Y, Kawaguchi Y, Hosoya T, et al. Positive and negative regulations of the renal 25-hydroxyvitamin D3 1alpha-hydroxylase gene by parathyroid hormone, calcitonin, and 1alpha,25(OH)2D3 in intact animals. Endocrinology (1999) 140(5):2224–31. doi:10.1210/endo.140.5.6691
17. Brenza HL, Kimmel-Jehan C, Jehan F, Shinki T, Wakino S, Anazawa H, et al. Parathyroid hormone activation of the 25-hydroxyvitamin D3-1alpha-hydroxylase gene promoter. Proc Natl Acad Sci U S A (1998) 95(4):1387–91. doi:10.1073/pnas.95.4.1387
18. Holick MF, Kleiner-Bossaller A, Schnoes HK, Kasten PM, Boyle IT, DeLuca HF. 1,24,25-Trihydroxyvitamin D3. A metabolite of vitamin D3 effective on intestine. J Biol Chem (1973) 248(19):6691–6.
19. Makin G, Lohnes D, Byford V, Ray R, Jones G. Target cell metabolism of 1,25-dihydroxyvitamin D3 to calcitroic acid. Evidence for a pathway in kidney and bone involving 24-oxidation. Biochem J (1989) 262(1):173–80. doi:10.1042/bj2620173
20. Ohyama Y, Okuda K. Isolation and characterization of a cytochrome P-450 from rat kidney mitochondria that catalyzes the 24-hydroxylation of 25-hydroxyvitamin D3. J Biol Chem (1991) 266(14):8690–5.
21. Jones G, Prosser DE, Kaufmann M. 25-Hydroxyvitamin D-24-hydroxylase (CYP24A1): its important role in the degradation of vitamin D. Arch Biochem Biophys (2012) 523(1):9–18. doi:10.1016/j.abb.2011.11.003
22. Shimada T, Hasegawa H, Yamazaki Y, Muto T, Hino R, Takeuchi Y, et al. FGF-23 is a potent regulator of vitamin D metabolism and phosphate homeostasis. J Bone Miner Res (2004) 19(3):429–35. doi:10.1359/JBMR.0301264
23. Cantorna MT, McDaniel K, Bora S, Chen J, James J. Vitamin D, immune regulation, the microbiota, and inflammatory bowel disease. Exp Biol Med (Maywood) (2014) 239(11):1524–30. doi:10.1177/1535370214523890
24. Ooi JH, Li Y, Rogers CJ, Cantorna MT. Vitamin D regulates the gut microbiome and protects mice from dextran sodium sulfate-induced colitis. J Nutr (2013) 143(10):1679–86. doi:10.3945/jn.113.180794
25. Bashir M, Prietl B, Tauschmann M, Mautner SI, Kump PK, Treiber G, et al. Effects of high doses of vitamin D3 on mucosa-associated gut microbiome vary between regions of the human gastrointestinal tract. Eur J Nutr (2016) 55(4):1479–89. doi:10.1007/s00394-015-0966-2
26. McDaniel KL, Restori KH, Dodds JW, Kennett MJ, Ross AC, Cantorna MT. Vitamin A-deficient hosts become nonsymptomatic reservoirs of Escherichia coli-like enteric infections. Infect Immun (2015) 83(7):2984–91. doi:10.1128/IAI.00201-15
27. Kaufmann M, Gallagher JC, Peacock M, Schlingmann KP, Konrad M, DeLuca HF, et al. Clinical utility of simultaneous quantitation of 25-hydroxyvitamin D and 24,25-dihydroxyvitamin D by LC-MS/MS involving derivatization with DMEQ-TAD. J Clin Endocrinol Metab (2014) 99(7):2567–74. doi:10.1210/jc.2013-4388
28. Valcour A, Zierold C, Podgorski AL, Olson GT, Wall JV, DeLuca HF, et al. A novel, fully-automated, chemiluminescent assay for the detection of 1,25-dihydroxyvitamin D in biological samples. J Steroid Biochem Mol Biol (2016) 164:120–6. doi:10.1016/j.jsbmb.2015.08.005
29. Schaedler RW, Dubs R, Costello R. Association of germfree mice with bacteria isolated from normal mice. J Exp Med (1965) 122:77–82. doi:10.1084/jem.122.1.77
30. Macpherson AJ, McCoy KD. Standardised animal models of host microbial mutualism. Mucosal Immunol (2015) 8(3):476–86. doi:10.1038/mi.2014.113
31. Kamada N, Kim YG, Sham HP, Vallance BA, Puente JL, Martens EC, et al. Regulated virulence controls the ability of a pathogen to compete with the gut microbiota. Science (2012) 336(6086):1325–9. doi:10.1126/science.1222195
32. Masuda Y, Ohta H, Morita Y, Nakayama Y, Miyake A, Itoh N, et al. Expression of Fgf23 in activated dendritic cells and macrophages in response to immunological stimuli in mice. Biol Pharm Bull (2015) 38(5):687–93. doi:10.1248/bpb.b14-00276
33. Bansal S, Friedrichs WE, Velagapudi C, Feliers D, Khazim K, Horn D, et al. Spleen contributes significantly to increased circulating levels of fibroblast growth factor 23 in response to lipopolysaccharide-induced inflammation. Nephrol Dial Transplant (2017) 32(6):960–8. doi:10.1093/ndt/gfw376
34. Sjogren K, Engdahl C, Henning P, Lerner UH, Tremaroli V, Lagerquist MK, et al. The gut microbiota regulates bone mass in mice. J Bone Miner Res (2012) 27(6):1357–67. doi:10.1002/jbmr.1588
35. Abu-Amer Y, Ross FP, Edwards J, Teitelbaum SL. Lipopolysaccharide-stimulated osteoclastogenesis is mediated by tumor necrosis factor via its P55 receptor. J Clin Invest (1997) 100(6):1557–65. doi:10.1172/JCI119679
36. Markle JG, Frank DN, Mortin-Toth S, Robertson CE, Feazel LM, Rolle-Kampczyk U, et al. Sex differences in the gut microbiome drive hormone-dependent regulation of autoimmunity. Science (2013) 339(6123):1084–8. doi:10.1126/science.1233521
37. Org E, Mehrabian M, Parks BW, Shipkova P, Liu X, Drake TA, et al. Sex differences and hormonal effects on gut microbiota composition in mice. Gut Microbes (2016) 7(4):313–22. doi:10.1080/19490976.2016.1203502
38. Haro C, Rangel-Zuniga OA, Alcala-Diaz JF, Gomez-Delgado F, Perez-Martinez P, Delgado-Lista J, et al. Intestinal microbiota is influenced by gender and body mass index. PLoS One (2016) 11(5):e0154090. doi:10.1371/journal.pone.0154090
39. Laffont S, Seillet C, Guery JC. Estrogen receptor-dependent regulation of dendritic cell development and function. Front Immunol (2017) 8:108. doi:10.3389/fimmu.2017.00108
40. Li JY, Chassaing B, Tyagi AM, Vaccaro C, Luo T, Adams J, et al. Sex steroid deficiency-associated bone loss is microbiota dependent and prevented by probiotics. J Clin Invest (2016) 126(6):2049–63. doi:10.1172/JCI86062
41. Li JY, Tawfeek H, Bedi B, Yang X, Adams J, Gao KY, et al. Ovariectomy disregulates osteoblast and osteoclast formation through the T-cell receptor CD40 ligand. Proc Natl Acad Sci U S A (2011) 108(2):768–73. doi:10.1073/pnas.1013492108
42. Spanier JA, Nashold FE, Mayne CG, Nelson CD, Hayes CE. Vitamin D and estrogen synergy in Vdr-expressing CD4(+) T cells is essential to induce Helios(+)FoxP3(+) T cells and prevent autoimmune demyelinating disease. J Neuroimmunol (2015) 286:48–58. doi:10.1016/j.jneuroim.2015.06.015
Keywords: microbiota, fibroblast growth factor 23, vitamin D, inflammation, tumor necrosis factor-α
Citation: Bora SA, Kennett MJ, Smith PB, Patterson AD and Cantorna MT (2018) The Gut Microbiota Regulates Endocrine Vitamin D Metabolism through Fibroblast Growth Factor 23. Front. Immunol. 9:408. doi: 10.3389/fimmu.2018.00408
Received: 29 September 2017; Accepted: 14 February 2018;
Published: 02 March 2018
Edited by:
Raquel Hontecillas, Virginia Tech, United StatesReviewed by:
Caroline Helen Johnson, Yale University, United StatesNuria Tubau-Juni, Virginia Tech, United States
Copyright: © 2018 Bora, Kennett, Smith, Patterson and Cantorna. This is an open-access article distributed under the terms of the Creative Commons Attribution License (CC BY). The use, distribution or reproduction in other forums is permitted, provided the original author(s) and the copyright owner are credited and that the original publication in this journal is cited, in accordance with accepted academic practice. No use, distribution or reproduction is permitted which does not comply with these terms.
*Correspondence: Margherita T. Cantorna, bXhjNjlAcHN1LmVkdQ==