 Nitin Kamble
 Angila Gurung1,2
 Benedikt B. Kaufer
 Ansar Ahmed Pathan
 Shahriar Behboudi
- 1The Pirbright Institute, Woking, United Kingdom
- 2Department of Life Sciences, College of Health and Life Sciences, Brunel University, London, United Kingdom
- 3Institut für Virologie, Freie Universität Berlin, Berlin, Germany
- 4Faculty of Health and Medical Sciences, School of Veterinary Medicine, University of Surrey, Guildford, United Kingdom
Marek’s disease virus (MDV), an avian alphaherpesvirus, infects chickens, transforms CD4+ T cells, and induces immunosuppression early during infection. However, the exact mechanisms involved in MDV-induced immunosuppression are yet to be identified. Here, our results demonstrate that MDV infection in vitro and in vivo induces activation of cyclooxygenase-2 (COX-2) and production of prostaglandin E2 (PGE2). This exerts its inhibitory effects on T cell proliferation at day 21 post infection via PGE2 receptor 2 (EP2) and receptor 4 (EP4). Impairment of the MDV-induced T cell proliferation was associated with downregulation of IL-2 and transferrin uptake in a COX-2/PGE2 dependent manner in vitro. Interestingly, oral administration of a COX-2 inhibitor, meloxicam, during MDV infection inhibited COX-2 activation and rescued T cell proliferation at day 21 post infection. Taken together, our results reveal a novel mechanism that contributes to immunosuppression in the MDV-infected chickens.
Introduction
Several viruses that establish chronic infections have evolved mechanisms to escape immune control. In parallel, the host has developed strategies to suppress antiviral immunity to limit T cell-mediated immunopathology. Development of T cell immunity is an indispensable part of host defense against invading viruses. Viruses counteract the development of adaptive immunity through various mechanisms. One of them is the suppression of antigen specific as well as non-specific T cell proliferation into effector cells which is an essential part of adaptive immune response against infectious agent (1, 2).
Prostaglandin E2 (PGE2) is one of the prostanoid and it is involved in many physiological processes by binding to PGE2 receptors (EP1-EP4). In cells, arachidonic acid can be transformed into PGE2 by actions of cyclooxygenase (COX) enzymes and terminal prostaglandin E synthases (PGES) (3). In mammals, PGE2 exerts diverse physiological and immunological activities, including inhibitory effects on T cell functions such as T cell differentiation, proliferation, cytotoxicity, and cytokine production (3–9). Some viral infections elevate the production of PGE2 which can regulate virus replication and modulate both anti-viral innate and adaptive immune system. The contrasting effects of PGE2 on replication of different viruses have been documented (3). However, most studies have focused on the effects of virus-induced COX-2/PGE2 pathway on virus replication (10–16). We had previously shown that in vitro infection of chicken embryonic fibroblasts (CEFs) with virulent MDV activates COX-2/PGE2 pathway, which is involved in MDV replication (15). However, it was unclear whether MDV can also activate COX2/PGE2 pathway in vivo and very little was known about the effects of MDV-induced PGE2 on function of immune cells. The role of virus-induced PGE2 on modulation of T cell response had been previously suggested (14, 17, 18) and it has been shown that the administration of COX-2 inhibitor can restore T cell proliferation in murine leukemic retrovirus model (18), suggesting that COX-2 inhibitors may be used to overcome virus-induced immunosuppression in vivo. Here, we hypothesized that MDV-induced PGE2 may suppress T cell proliferation during MDV infection.
MDV serotype 1 (e.g., RB1B) is the causative agent of Marek’s disease (MD), an economically important chicken disease, which is characterized by lymphoma formation and immunosuppression. Rispens-CVI988 is the vaccine strain of MDV serotype 1 with an overall identical gene organization compared to the virulent strain (19–21). We had previously shown that virulent MDV, but not the vaccine strain, activates expansion of Treg cells in vivo (22), suggesting that there is an association between Treg cell activation and MDV pathogenesis. Considering the immunosuppressive effects of PGE2 on T cell function (17, 23–26), we hypothesized that the virulent MDV, but not vaccine strain, may exert immunosuppressive effects on T cells via COX-2/PGE2 pathway. Our in vitro results had demonstrated that virulent MDV modulates cell metabolism, including COX-2 activation, in non-transformed primary chicken embryonic fibroblasts (15, 27, 28). Here, the in vitro and in vivo results demonstrate that the virulent MDV, but not Rispens-CVI988, activates the COX-2/PGE2 pathway which modulates T cell proliferation in EP2 and EP4 dependent manner. Oral administration of a COX-2 inhibitor downregulated MDV-induced COX-2 activation and restored T cell proliferation at 21-day post infection in the MDV-infected chickens.
Materials And Methods
Virus Preparation
One-day-old RIR chickens were infected with 200 µl phosphate buffered saline (PBS) containing 1,000 plaque forming units (PFU) of pathogenic RB1B or vaccine strain Rispens-CVI988 (Intervet, Milton Keynes, UK) via the intra-abdominal route. Splenocytes were harvested at 14 dpi and were co-cultured with primary chicken embryo fibroblasts (CEFs) cells for 7 days. Once the cytopathic effects were observed, the cell-associated MDV-infected CEF cells were further passaged two times on fresh CEFs, virus stocks were prepared, stored in medium 199 with Earle’s salts (E199) containing 10% heat inactivated-fetal calf serum (HI-FCS) and 10% dimethyl sulphoxide (DMSO).
Ethics Statement
Animal experiments were approved by the ethical review committee at The Pirbright Institute (TPI) and the experiments were performed based on the guidelines and care approved by the UK government Home Office under project license PPL 30/3169. The personnel engaged in the procedures had acquired personal license from the UK Home Office.
Animal Experiments
The specific pathogen free (SPF) mixed sex inbred Rhode Island Red (RIR) and line P2a (homozygous for the B19 haplotype) chickens reared at The Pirbright Institute. In vivo experiment comprising day-old line P2a chickens were inoculated with 200 µl of PBS containing 1000 PFU of MDV (RB1b) or vaccine (Rispens-CVI988) or mock infected-CEF cells (n = 6) via the intra-abdominal route. In vivo experiment comprising seven-day old RIR chickens were inoculated with 200 µl PBS containing 1000 PFU MDV or mock infected-CEF cells via intra-abdominal route, further, MDV infected chickens RIR chickens were divided into two groups: one was orally administered meloxicam (Cox-2 inhibitor) on daily basis, and second group kept as MDV infected only. For ex vivo assays, spleen was obtained from 3-week-old P2a and RIR chickens by cervical dislocation as mentioned in schedule 1 guidelines. The harvested spleen was collected aseptically in sterile PBS supplemented with penicillin-streptomycin solution (Microbiological Services, Pirbright Institute, Surrey, UK). Splenocytes obtained from P2a chickens and used in the ex vivo expression of COX-2 gene and T cell proliferation studies. Splenocytes obtained from RIR chickens were used to analyse effect of meloxicam on T cell proliferation.
Cell Culture
265L lymphoblastoid monoclonal lymphoma cell line is derived from liver from inbred line P (MHC B19/B19) chickens infected with MDV (RB1b) at the Pirbright Institute (Gift from Professor Nair, Avian Oncogenic virus group, The Pirbright Institute). The cells were cultured in RPMI 1640 medium supplemented with 10 % HI-FCS, 10% tryptose phosphate broth (TPB), penicillin, streptomycin, 50 μM 2-mercaptoethanol (Life Technologies, Warrington, UK) and 1 mM sodium pyruvate (Sigma-Aldrich, Dorset, UK) at 41°C with 5% CO2.
Primary chicken embryonated fibroblasts (CEFs) were used for infection and propagation of MDV. Briefly, chicken embryos from 10-day-old SPF eggs were obtained, homogenized and trypsinized (0.25% w/v) to generate single cell suspension. CEFs cells were seeded (1.5 × 10⁵ cells/ml) in 24-well plates in E199 medium supplemented with 5% fetal calf serum (FCS), 10% TPB, penicillin-streptomycin solution (Life Technologies, Warrington, UK), 2.7 % NaHCO3 (Sigma-Aldrich, Dorset, UK). After 24hrs, the CEF cells were infected with 100 PFU RB1B or Rispens-CVI988. Cell culture Supernatant was collected at 72hrs post infection, filtered through 0.2-micron filter to remove any potentially infected CEFs within the cell culture supernatant. It should be noted that MDV is a highly cell associated virus and MDV infected CEFs are unable to release the virus in the cell culture supernatant. No viral plaque was observed in the co-culture of non-infected CEFs with the cell culture supernatant at 72hpi.
Prostaglandin E2 ELISA
PGE2 in the cell culture supernatant was analyzed using a competitive ELISA kit (R&D Systems, Abingdon, UK) according to the manufacturer’s instruction. In brief, microplates (96 wells), pre-coated with goat anti-mouse mAb, were blocked with PBS containing 3% BSA, and then incubated with the cell culture supernatant or recombinant PGE2. Anti-PGE2 mouse MAb was added, followed by HRP labelled PGE2 conjugate. After washing with PBS, HRP substrate 1-step™ Turbo TMB-ELISA substrate (Thermo Fisher Scientific, Paisley, UK) was added to the plates and incubated for 30 min. The reaction was stopped with addition of 0.16 M sulphuric acid, and the reaction was read at 450 nm (reference absorbance: 650nm). The concentration of PGE2 in collected supernatant was extrapolated from the standard curve generated with PGE2 standard (2500 pg/ml).
Isolation of the Chicken Splenocytes
Splenocytes for in vitro studies were obtained from naïve RIR chickens, whereas for in vivo studies splenocytes were isolated from spleens of MDV infected RIR or MDV-infected line P2a chickens, as described in the results section. Briefly, splenocyte were obtained by mashing the spleens through 40-μm-pore-size Falcon cell strainers (BD Biosciences, Oxford, United Kingdom) overlaying the cells on Histopaque 1.083 (Sigma-Aldrich, Dorset, UK) for density gradient centrifugation (500g for 30 min at 4°C). The buffy coat from the interface was isolated, washed (250g for 10 min at 4°C) and suspended in complete media containing Roswell Park Memorial Institute medium-1640 (RPMI-1640) supplemented with 5% heat inactivated-foetal calf serum (HI-FCS) and penicillin-streptomycin solution. After estimation of live-dead cell number and viability by trypan blue exclusion method, the splenocytes count was adjusted to 5 x 10⁶ cells/ml. Adjusted cells were directly used or incubated in complete media containing Con-A (1µg/ml) at 41°C with 5% CO2 for further use.
Chicken CD4+, CD3 + or CD3neg cells were purified from splenocytes using anti-phycoerythrin (PE) Micro-Bead kits as per manufacturer’s protocol (Miltenyi Biotec, Woking, UK). Briefly, chicken splenocytes (1 × 10⁷) were incubated (30 min at 4°C) with PE-conjugated mouse anti-chicken CD3 mAbs or PE-conjugated mouse anti-chicken CD4 mAb (10 μl/107 cells) (Cambridge Bioscience, Cambridge, UK). The cells were centrifuged (300g for 10 min at 4°C), incubated (30 min at 4°C) with anti-PE MicroBeads (20 μl/107 cells) (Miltenyi Biotec, Woking, UK). The unbound MicroBeads were removed by 2x centrifugation (300g for 10 min at 4°C) and the stained cells were subjected to MACS column (Miltenyi Biotec, Woking, UK) for isolation ofcells. The purity of the isolated CD3+ T cells, CD3neg cells or CD4+ T cells was evaluated by flow cytometry and found to be >97%.
Preparation of Chicken Bone Marrow Derived Dendritic Cells (BMDCs)
The chicken BMDCs were generated from bone marrow cells in vitro as described previously (29). Briefly, bone marrow cells was harvested from the femur by cutting the elongated ends and flushing the cells with PBS using 27-gauge needle. Bone marrow was mashed through 40-μm-pore-size Falcon cell strainers (BD Biosciences, Oxford, United Kingdom) to obtain single cell suspension which was overlayered on Histopaque 1.119 (Sigma-Aldrich, Dorset, UK) and subjected to density gradient centrifugation (500g for 30 min at 4°C). Buffy coat was carefully isolated from interface, washed and re-suspended in complete media supplemented with 5% chicken serum (Sigma-Aldrich, Dorset, UK), 50 μM 2-mercaptoethanol and penicillin-streptomycin solution. After estimation of live-dead cell number and viability by trypan blue exclusion method, the bone marrow cells were adjusted to 1 x 10⁶ cells/ml. For differentiation of bone marrow cells into BMDCs, the cell culture media was supplemented with chicken GM-CSF (10 ng/ml) and IL-4 (20ng/ml) (Cambridge Bioscience, Cambridge, UK). The cells were fed with fresh media and the growth factors on day 1, 3, 5 and 7 of culture. Prior to experiments, the BMDCs were gently harvested using 1x TrypLE select solution (Gibco, Paisley, UK) and seeded in desired cell density.
Flow Cytometry
Carboxy fluorescein diacetate, succinimidyl ester (CFSE)-based T cell proliferation assay was utilized to examine the inhibitory effects of the cell culture supernatant on chicken T cell proliferation. The cells were stained with Vybrant CFDA SE cell tracer dye (Life Technologies, Warrington, UK) as recommended by the manufacturer’s instruction. Briefly, splenocytes (10 x106 cells/ml) were suspended in pre-warmed PBS (37°C) and mixed with equal volume of the dye (5 µM) to give final concentration 2.5 µM of the dye. Following 15 min incubation of the cells with the dye at 41°C, the cells were washed with pre-warmed PBS, suspended in cell culture media for 30 min at 41°C, and the CFSE-stained cells were cultured in the presence of Concanavalin A (Con-A; 10 μg/mL) for 72 hrs (at 41°C with 5% CO2). In some experiments, CFSE-labelled cells were initially incubated with non-toxic concentration of SC236 (COX-2 inhibitor: 5 μg/mL), TG4-155 (EP2 antagonist: 4 μM), ER-819762 (EP4 antagonist: 8 μM) (Bio-Techne Ltd., Abingdon, UK) for 2 hrs prior to stimulation with Con-A. In some experiments, purified chicken CFSE-labelled CD3+ T cells were co-cultured with CD3neg cells in the presence of Con-A (10 μg/mL) with or without addition of the chemical inhibitors of PGE2-COX-2 pathway. In some experiments, BMDCs were treated with PGE2 or the cell culture supernatant, washed prior to co-culture with CFSE-labelled CD3+ T cell in presence of Con-A for 72hrs. CD3+CD25+ expression was analysed by flow cytometry in splenocytes stimulated with con-A in presence of PGE2 or MDV orvaccine or CEF or 265L sup. The cells were stained with 7AAD (BD Bioscience, Oxford, UK) for dead cell exclusion before acquisition in BD LSRFortessa™ flowcytometry (BD Bioscience, Oxford, UK) and analysis of the data using FlowJo v10.07.Chemical used in this study were first evaluated for its dose dependent toxicity by 7-AAD staining and the highest, nontoxic concentrations of the inhibitors and chemicals were selected.
qRT-PCR for COX-2 and IL2 Expression
Fold changes in mRNA level of COX-2 gene in splenocytes of MDV infected and vaccinated chickens and IL-2 gene in splenocytes (from non-infected birds) stimulated with Con-A in presence of I) MDV supernatant (10%) II) Vaccine supernatant (10%) III) control supernatant IV) 265L supernatant (10%) or V) recombinant PGE2 (10 µg/ml) were calculated by qRT-PCR. Briefly RNA was isolated by TRIzol (Life Technologies, Warrington, UK) and converted into cDNA after DNase treatment with Superscript III first-strand synthesis (Life Technologies, Warrington, UK) and used as template for qRT-PCR. List of primers are shown in Table 1. SYBR green chemistry based qRT-PCR was performed on Applied Biosystems 7500 qPCR system by using Luna® universal qPCR master mix as per manufacturer’s protocol.
Table 1 List of primers used for qRT-PCR.
Confocal Microscopy for Transferrin Uptake
Splenocytes were treated with I) MDV sup (10%) II) Vaccine sup (10%) III) CEF mock IV) 265L sup (10%) for 24h and briefly cultured with media containing transferrin from human serum, Alexa Fluor™ 647 conjugate (Life Technologies, Warrington, UK) for 20 min before fixing and staining nuclei with 4’,6’-diamidino-2-phenylindole (DAPI). Slides were imaged on Leica SP2 laser-scanning confocal microscope and the results were analysed using ImageJ software.
Statistical Analysis
Data are represented as mean ± SEM. The transferrin data are analysed using ANOVA Kruskal-Wallis test with post hoc Dunn’s multiple comparison analysis. The mean rank of mock sample was 71.95 and alpha 0.05. The proliferation data were analysed using ordinary one-way ANOVA with post hoc Dunnett’s multiple comparison test with single pooled variance. GraphPad prism software (San Diego, CA) was used for performing statistical analysis. Results were considered statistically significant at a P value of <0.05 (*).
Results
MDV-Induced COX-2/PGE2 Pathway Impairs T Cell Proliferation In Vivo
One-day old Line P2a chickens (MHC B19 haplotype) were administered with non-infected chicken embryo fibroblast cells (CEF) (control group), CEFs infected with virulent strain RB1B (MDV infected group) or CEFs infected with vaccine strain Rispens-CVI988 (vaccinated group). Since MDV-induced Treg cell expansion had been previously reported only at day 21 post infection (22), we initially examined the role of MDV-induced PGE2 on impairment of T cell proliferation at 21 days post infection (dpi). T cell proliferation in response to Concanavalin-A (ConA) stimulation, was analysed in vitro using CFSE-based proliferation assay (Figure 1A). The results demonstrated a significant reduction in CD3+ T cell proliferation in the MDV-infected chickens, while no significant difference was observed between the vaccinated and control groups (Figures 1B, C). These results indicated that infection of chickens with the virulent strain of MDV impaired CD3+ T cell proliferation. Our recent report had demonstrated that MDV infection of CEF activates the COX-2/PGE2 pathway in vitro (15), however, it was unclear whether the vaccine strain of MDV can activate this pathway. To examine whether virulent and vaccine strains MDV can activate the COX-2/PGE2 pathway in vivo, the expression levels of COX-2 gene were analysed in splenocytes of chickens within the different experimental groups using RT-PCR. The results demonstrate that the inoculation of virulent MDV, but not vaccine strain of MDV, upregulates COX-2 gene expression in the splenocytes by over 150-fold (Figure 1D). To determine the role of COX-2/PGE2 pathway in the MDV-induced T cell dysfunction, the splenocytes were treated with chemical inhibitors of the COX-2/PGE2 pathway, TG4-155 (EP2 blocker), ER-819762 (EP4 blocker) and sc-236 (COX-2 inhibitor), and T cell proliferation was analysed using CFSE-based proliferation assays. All the COX-2/PGE2 inhibitors restored CD3+ T cell proliferation in MDV-infected chickens (Figures 1E, F), while these inhibitors did not alter proliferation rate in the control groups, indicating that MDV-induced COX-2/PGE2 pathway suppresses T cell proliferation in an EP2 and EP4 dependent manner.
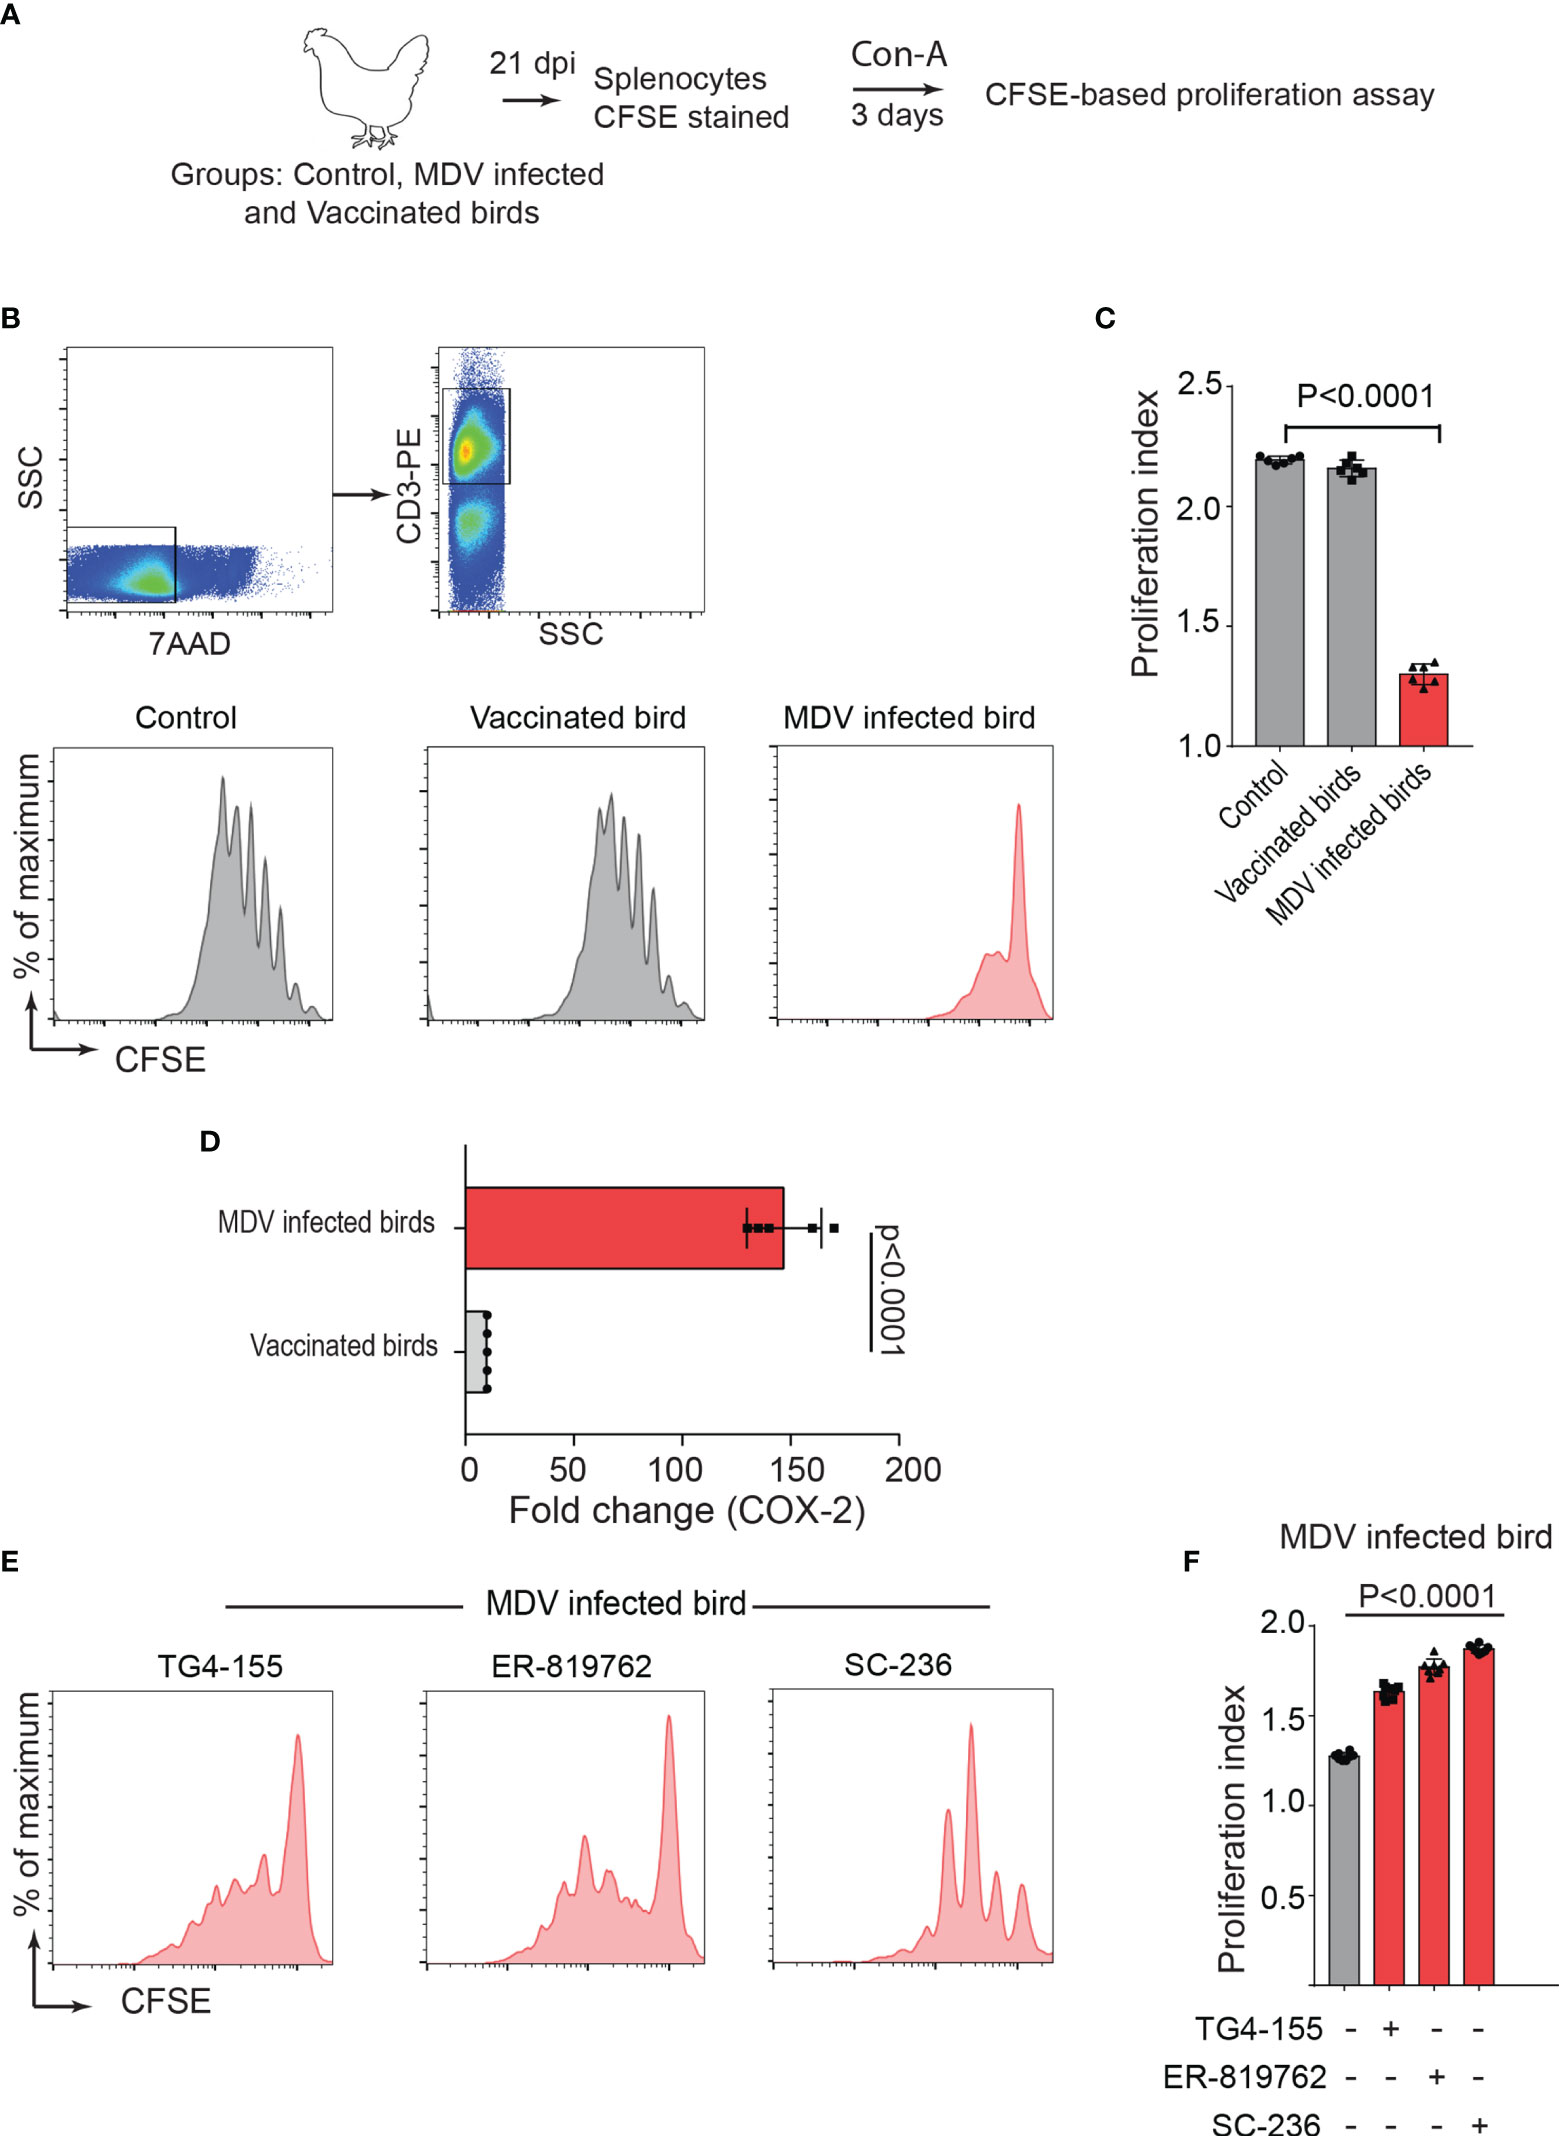
Figure 1 MDV infection upregulates COX-2 expression and impairs T cell proliferation. (A) Graphical presentation for experimental setup for ex vivo proliferation assay: Splenocytes, harvested at 21 dpi from control, MDV infected (RB1B, 1,000 pfu/dose), and vaccinated birds (Rispens-CVI988, 1,000 pfu/dose), were stained with CFSE and stimulated with Con-A (5 µg/ml) for 3 days. (B) Representative dot plot and histograms showing the gating strategy used in acquisition and analysis of CFSE based proliferation data. The proliferation of 7AAD- (live cells) CD3+ T cells was analysed by flow cytometry. (C) Proliferation index showing proliferation in CD3+ T cells from control, MDV infected and vaccinated birds. (D) qRT-PCR data showing fold change in mRNA level for COX-2 gene in MDV infected and vaccinated birds which was calculated over the control birds. (E) Representative histograms and corresponding (F) proliferation index showing proliferation in CD3+ T cells from MDV infected birds stimulated with Con-A in presence of the chemical inhibitors: TG4-155 (4 μM), ER-819762 (8 μM) and SC-236 (5 μg/mL). Grey bars: No significant difference between mock and treatment and red bars: significant difference or restoration to non-significant level between mock and treatment group. Dot plot and histograms are representative of proliferation data from six individual infected birds. Each dot in proliferation index represents the average of three biological replicates from six individual chickens. Error bar represents the mean ± standard deviation. Statistical significance was estimated as p value calculated by ANOVA test.
MDV Downregulates IL-2 Expression and Transferrin Uptake in a PGE2 Dependent Manner
The main identified mechanisms involved in inhibition of human T cell proliferation by PGE2 are downregulation of interleukin (IL)-2, IL-2 receptors, and transferrin uptake (23, 30). To determine the mechanisms involved in the MDV-induced impairment of T cell proliferation, the effects of PGE2 produced by MDV-infected chicken cells on (a) chicken IL-2 gene expression using RT-PCR, (b) the expression of alpha chain of the high-affinity IL-2 receptor (CD25) expression using flow cytometry and (c) transferrin uptake using confocal microscopy were analysed.
In brief, cell culture supernatants isolated from mock (control), virulent MDV (MDV supernatant.; RB1B strain of MDV; 100pfu) and vaccine strain (Vaccine supernatant; Rispens-CVI988 strain of MDV; 100 pfu) infected CEF were collected at 72 hpi and the levels of PGE2 were analysed using a competitive ELISA assay for PGE2 (Figure 2A). In addition, PGE2 levels in cell culture supernatant from non-stimulated purified CD4+ T cells, 265L cells (265L supernatant), an MDV-transformed CD4+ T cell line, were also determined. The results demonstrated that the MDV supernatant, but not the vaccine supernatant, had high levels of PGE2 (~8 ng/ml) (Figure 2A), indicating that there is an association between pathogenicity and release of PGE2 by the infected cells. To attribute impairment of T cell proliferation to the MDV-induced PGE2, chicken splenocytes were treated with either recombinant PGE2 or the cell culture supernatants and subsequently the cells were stimulated with Con-A. Upregulation of chIL-2 expression levels were determined in the Con-A stimulated cells and fold change was calculated based on IL-2 levels in unstimulated cells using RT-PCR. The results demonstrate that splenocytes treated with PGE2 or the soluble factor(s) released by the MDV-infected cells, but not the cells infected with the vaccine strain, downregulates chIL2 expression levels compared to splenocytes treated with the cell culture supernatant from the control groups (Figure 2B). The inhibitory effects of recombinant PGE2 (Figure 2C), MDV supernatant (Figure 2D) or 265L supernatant (Figure 2E) on chIL2 expression were rescued by treatment of splenocytes with chemical inhibitors of EP2 (TG4-155), EP4 (ER-819762) or COX-2 (SC-236). The chemical inhibitors did not alter IL-2 expression in control groups.
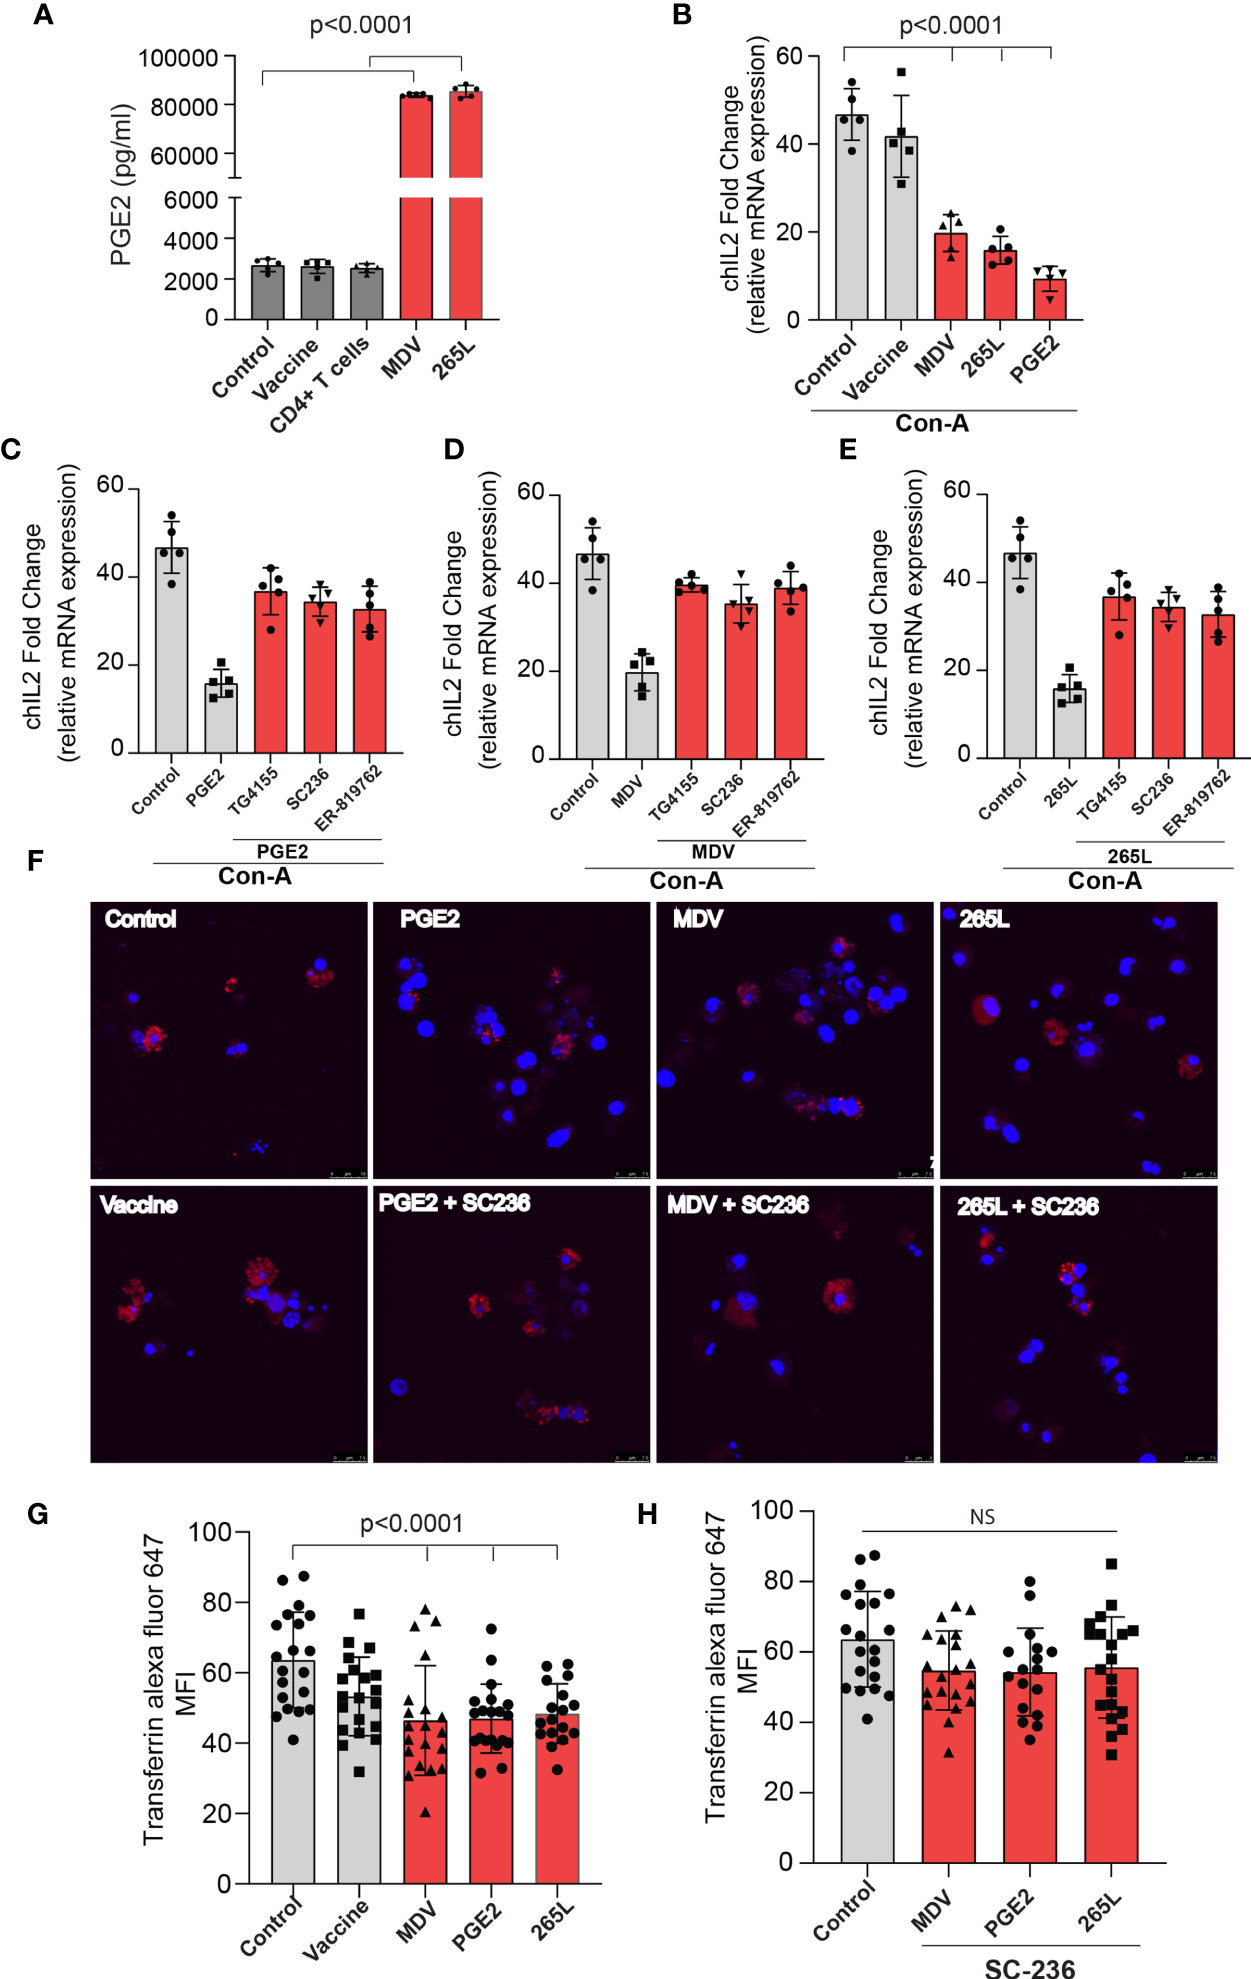
Figure 2 MDV infected CEFs and 265L tumour cells produce high PGE2 level resulting in downregulation of chIL2 and transferrin uptake in CD3+ T cells. Culture supernatants were harvested from control CEF (non-infected),CEF infected with virulent MDV (MDV supernatant) or vaccine strain of MDV (vaccine supernatant) at 72 hrs post-infection. Culture supernatant harvested from CD4+ T cells of naïve splenocytes and MDV-transformed CD4+ T cells (265L supernatant). (A) The levels of PGE2 were determined using an ELISA assay. (B) chIL2 expression level was determined in Con-A stimulated splenocytes treated with PGE2 (10 µg/ml), or the supernatants as described above using qRT-PCR, and fold change are shown. Inhibition of chIL-2 expression by (C) PGE2, (D) MDV supernatant, (E) 265L supernatant was rescued in the presence of the inhibitors of the COX-2/PGE2 pathway; TG4-155 (4 μM), ER-819762 (8 μM) and SC-236 (5 μg/mL). (F) Representative confocal images showing uptake of transferrin (red color) by CD3+ T cells in the Con-A stimulated splenocytes treated with control supernatant, PGE2, MDV supernatant, vaccine supernatant or 265L supernatant using confocal microscopy. (G) Graph shows mean fluorescent intensity (MFI) of transferrin uptake using confocal microscopy. (H) Bar graph shows the effects of a COX-2 inhibitor (SC-236) on transferrin uptake in CD3+ T cells treated with PGE2, MDV supernatant or 265L supernatant using confocal microscopy. Graphs are representative of three independent experiments, each performed with three biological replicates. Grey bars are used in the experimental groups in which no significant difference are found, while red bars are used to represent significant differences. Each dot in ELISA represents the average of three biological replicates from six individual culture groups. Error bar represents the mean ± standard deviation. Statistical significance was estimated as p value calculated by ANOVA test. NS, not significant.
Next, we assessed if the transferrin uptake by the PGE2-treated splenocytes is affected. Our data demonstrated a significant reduction in transferrin uptake in the cells treated with recombinant PGE2 or the soluble factors released by MDV-infected cells. In contrast, splenocytes treated with the vaccine supernatant did not inhibit transferrin uptake (Figures 2F, G). The uptake of transferrin in splenocytes was rescued and restored by treatment of splenocytes with chemical inhibitor of COX-2 (SC-236) (Figure 2H). The chemical inhibitor did not alter transferring uptake in the control group. Altogether, the results demonstrated that MDV downregulated IL-2 expression and inhibited transferrin uptake in a PGE2 dependent manner. In contrast, there was no effect on percentages (Figures 3A, B) of CD3+ T cells expressing CD25 molecules.
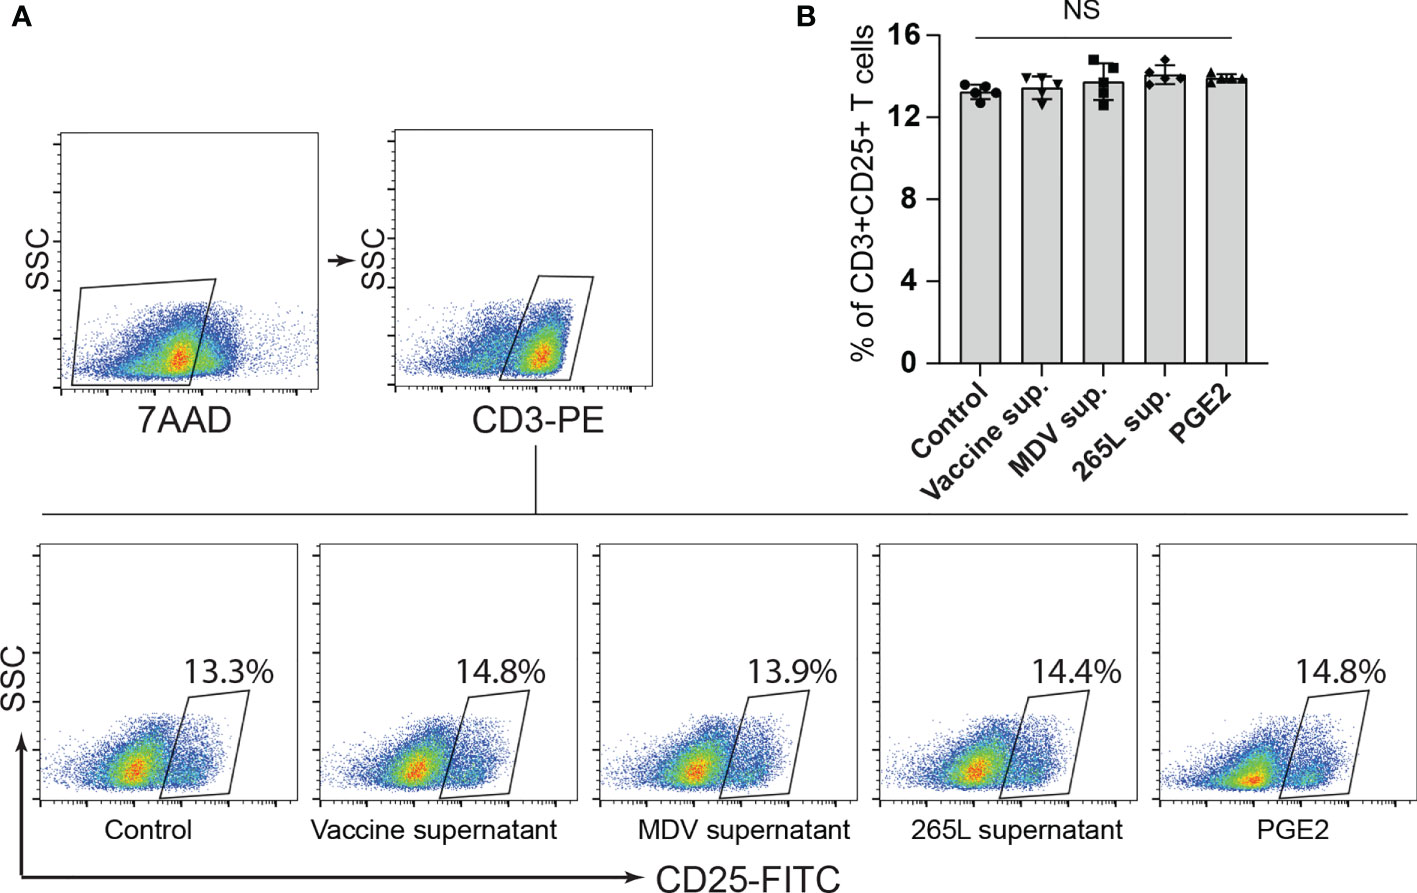
Figure 3 Expression of CD25+ on CD3+ T cells remained unaffected by PGE2 treatment. CD25 surface expression on CD3+ T cells were quantified in splenocytes stimulated with Con-A (5 µg/ml) in presence of cell culture media containing either recombinant PGE2 (5 µg/ml), the control supernatants, MDV supernatant, vaccine supernatant or the 265L supernatant. (A) Dot plot (B) bar graph showing percentage of CD3+CD25+ T cells. Graph is representative of three independent experiments, each performed with three biological replicates per treatment. Each dot in ELISA represents the average of three biological replicates from six individual culture groups. Grey bars represent the experimental groups with no significant difference. Error bar represents the mean ± standard deviation. Statistical significance was estimated as p value calculated by ANOVA test. NS, not significant.
MDV Impairs T Cell Proliferation in a COX-2/PGE2 Dependent Mechanism In Vitro
Series of in vitro experiments were performed to determine the role of MDV-induced PGE2 in the impairment of T cell proliferation. Splenocytes from non-infected naïve Rhode Island Red (RIR) chickens were treated with different concentrations of recombinant PGE2, the MDV supernatant, the vaccine supernatant or the 265L supernatant in presence or absence of the chemical inhibitors of EP2 (TG4-155), EP4 (ER-819762) or COX-2 (SC-236). T cell proliferation was determined using a CFSE-based proliferation assay in response to Con-A stimulation. Recombinant PGE2 (2.5, 5 and 10 ug/ml) suppressed CD3+ T cell proliferation in a dose-dependent manner (Figures 4A, B). Similarly, the MDV supernatant or the 265L supernatant significantly reduced CD3+ T cell proliferation. In contrast, treatment of splenocytes with the vaccine supernatant did not reduce their ability to proliferate in vitro (Figures 4C, D). Beyond that, the results showed that the chemical inhibitors of the COX-2/PGE2 pathway; TG4-155 (EP2 blocker), ER-819762 (EP4 blocker) and SC-236 (COX-2 inhibitor) inhibited impairment of T cell proliferation induced by the recombinant PGE2 (Figures 4E, F), the soluble factors released from MDV-infected cells (Figures 4E, G) and soluble factors released from MDV-transformed T cell lines (265L sup.) (Figures 4E, H). The chemical inhibitors did not alter T cell proliferation in the control groups. Taken together, the results demonstrated that PGE2 released by the MDV-infected cells impaired T cell proliferation in a COX-2/PGE2 dependent manner in vitro.
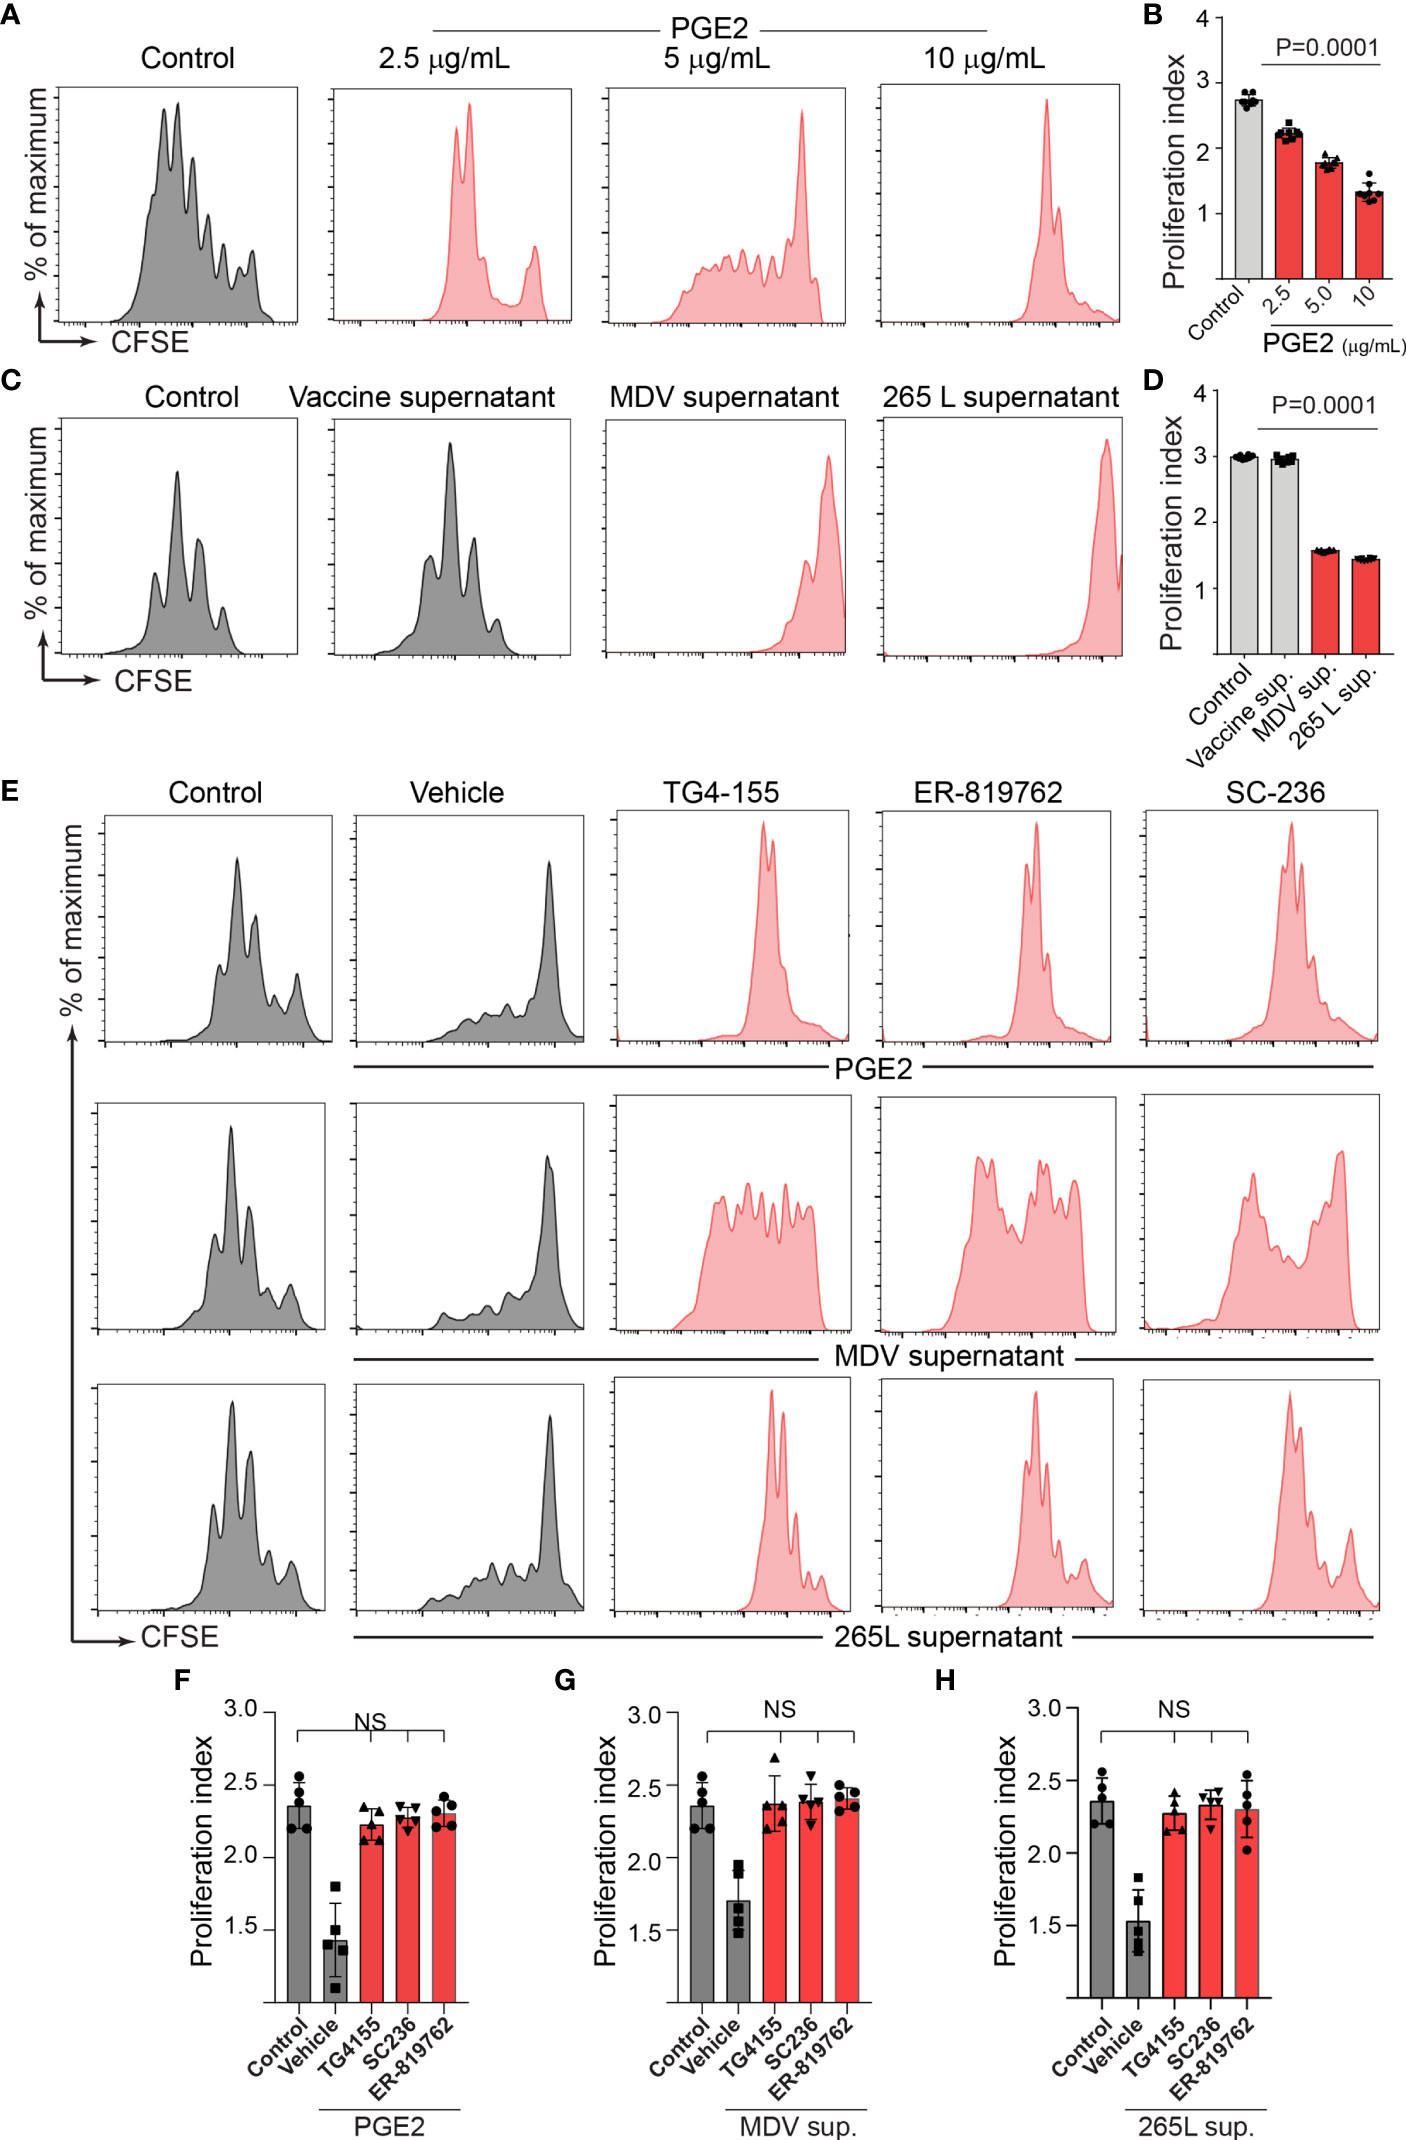
Figure 4 MDV infection drives PGE2/COX-2 dependent downregulation of T cell proliferation in vitro. Splenocytes were harvested from naïve birds and stained with CFSE and then they were stimulated with Con-A (5 µg/ml) in presence of PGE2, control supernatant, MDV supernatant, Vaccine supernatant, or 265L supernatant with or without the chemical the inhibitors of the PGE2-COX-2 pathway. After 3 days of culture, T cell proliferation was analysed by flow cytometry. (A) Representative histograms and corresponding (B) proliferation index showing dose-dependent effect of recombinant PGE2 (2.5, 5 and 10 µg/ml) on in vitro proliferation of CD3+ T cells. (C) Representative histograms and corresponding (D) proliferation index showing effect of control supernatant, MDV supernatant, Vaccine supernatant, or 256L supernatant on in vitro proliferation of CD3+ T cells. (E, G) Representative histograms and corresponding (F, H) proliferation index showing inhibitory effect of the chemical inhibitor: TG4-155 (4 μM), ER-819762 (8 μM) and SC-236 (5 μg/mL). Dot plot and histograms are representative of proliferation data from six individual birds. Grey bars are used in the experimental groups in which no significant difference are found, while red bars are used to represent significant differences. Each dot in proliferation index represents the average of three biological replicates from six individual chickens. Error bar represents the mean ± standard deviation. Statistical significance was estimated as p value calculated by ANOVA test. NS, not significant.
The MDV-Induced COX-2/PGE2 Pathway Impaired T Cell Proliferation by Directly Affecting CD3+ T Cells
To examine whether the MDV-induced COX-2/PGE2 pathway impaired T cell proliferation by directly affecting CD3+ T cells or indirectly via inhibition of other immune cells present in the splenocytes, splenocytes were treated with the recombinant PGE2 or the supernatants. After 3-day culture, CD3+ T cells were isolated from the treated splenocytes, CFSE-stained and then cocultured with the purified fresh untreated CD3neg cells isolated from naïve chickens in presence or absence of the chemical inhibitors of the COX-2/PGE2 pathway. T cell proliferation was analysed using CFSE-based proliferation assay upon 72 hrs CoA stimulation (Figure 5A). The results demonstrated that the isolated CD3+ T cells which were treated with the recombinant PGE2, the MDV supernatant or the 265L supernatant, but not the vaccine supernatant, have lower proliferation index compared to the control T cells (Figures 5B, C). The inhibitory effects of the recombinant PGE2 (Figures 5D, E), the MDV supernatant (Figures 5D, F) or the 265L supernatant (Figures 5D, G) were rescued by the chemical inhibitors of the COX-2/PGE2 pathway. Taken together, our in vitro experiments indicated that the MDV-induced COX-2/PGE2 pathway impaired T cell proliferation by directly affecting CD3+ T cells.
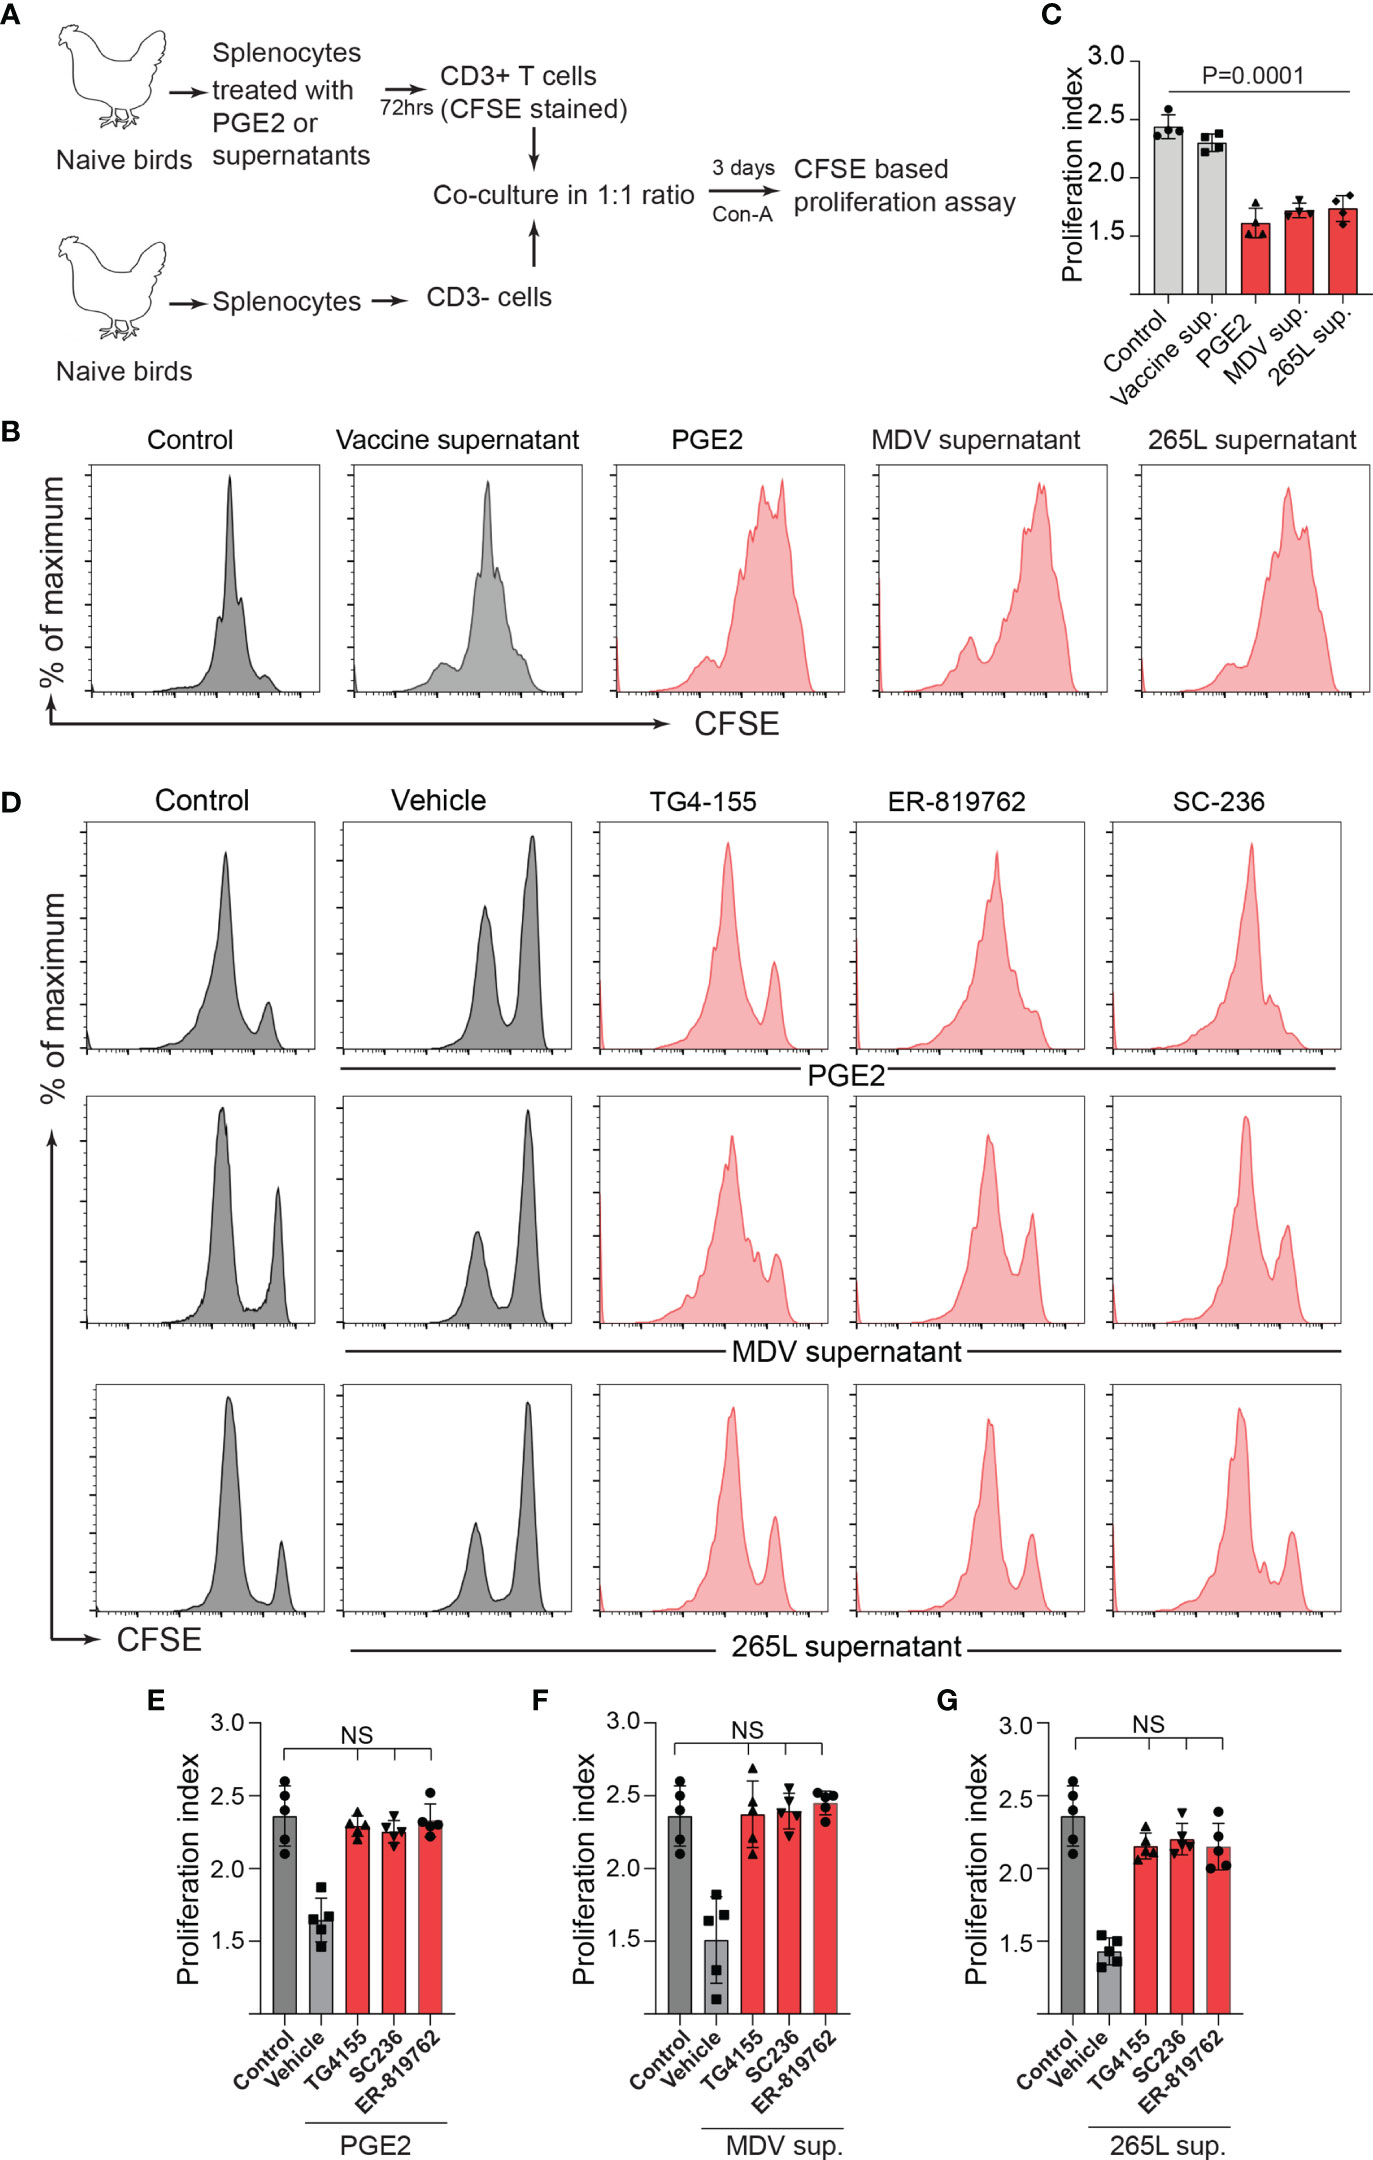
Figure 5 Treatment of splenocytes with PGE2/MDV sup/265L sup induced PGE2-COX-2 pathway drives dysfunction of CD3+ T cells. (A) Splenocytes were cultured for 3 days in media containing recombinant PGE2 (5 µg/ml), control supernatant, MDV supernatant, vaccine supernatant or 265L supernatant. The isolated CD3+ T cells were CFSE stained and co-cultured with freshly isolated CD3 negative cells. The co-culture was stimulated with Con-A (5 µg/ml) in presence or absence of the chemical inhibitors of the PGE2-COX-2 pathway. After 3 days of co-culture, T cell proliferation was analysed by flow cytometry. (B) Representative histograms and corresponding (C) proliferation index. (D) Representative histograms and corresponding (E–G) proliferation index showing in vitro proliferation in CD3+ T cells from splenocytes cultured with PGE2, MDV Supernatant and 265L supernatant in presence of the chemical inhibitors: TG4-155 (4 μM), ER-819762 (8 μM) and SC-236 (5 μg/mL), respectively. Data is representation of three independent experiments, each performed with three biological replicates per treatment. Grey bars are used in the experimental groups in which no significant difference are found, while red bars are used to represent significant differences. Each dot represents the data from individual chicken and the graph represents the mean ± standard deviation of five independent replicates from individual chickens. Statistical significance was estimated by p value calculated by ANOVA test. NS, not significant.
To confirm this in the MDV-infected chickens, one-day-old chickens were inoculated with the virulent MDV (RB1B: 1,000 pfu/dose; n=5), vaccine strain of MDV (Rispens-CVI988; 1,000 pfu/dose; n=5) or mock-infected (non-infected CEF; n=5) via intra-abdominal route. Splenocytes were isolated from the experimental groups at 21 dpi, and CD3+ T cells were purified from the isolated splenocytes. In parallel, CD3neg cells, from non-infected naïve chickens, were co-cultured with the isolated CD3+ T cells from the MDV-infected groups (Figure 6A) in presence or absence of the chemical inhibitors of the COX-2/PGE2 pathway. CD3+ T cell proliferation was analysed, 3 days after Con-A stimulation, using CFSE-based proliferation assay (Figure 6B). The results demonstrated that CD3+ T cells isolated from the MDV infected chickens, but not the vaccinated chickens, were impaired and the coculture with naive CD3neg cells did not rescue CD3+ T cell proliferation (Figures 6B, C). Furthermore, the results showed that the chemical inhibitors of the COX-2/PGE2 pathway rescued T cell proliferation in this system (Figures 6D, E).
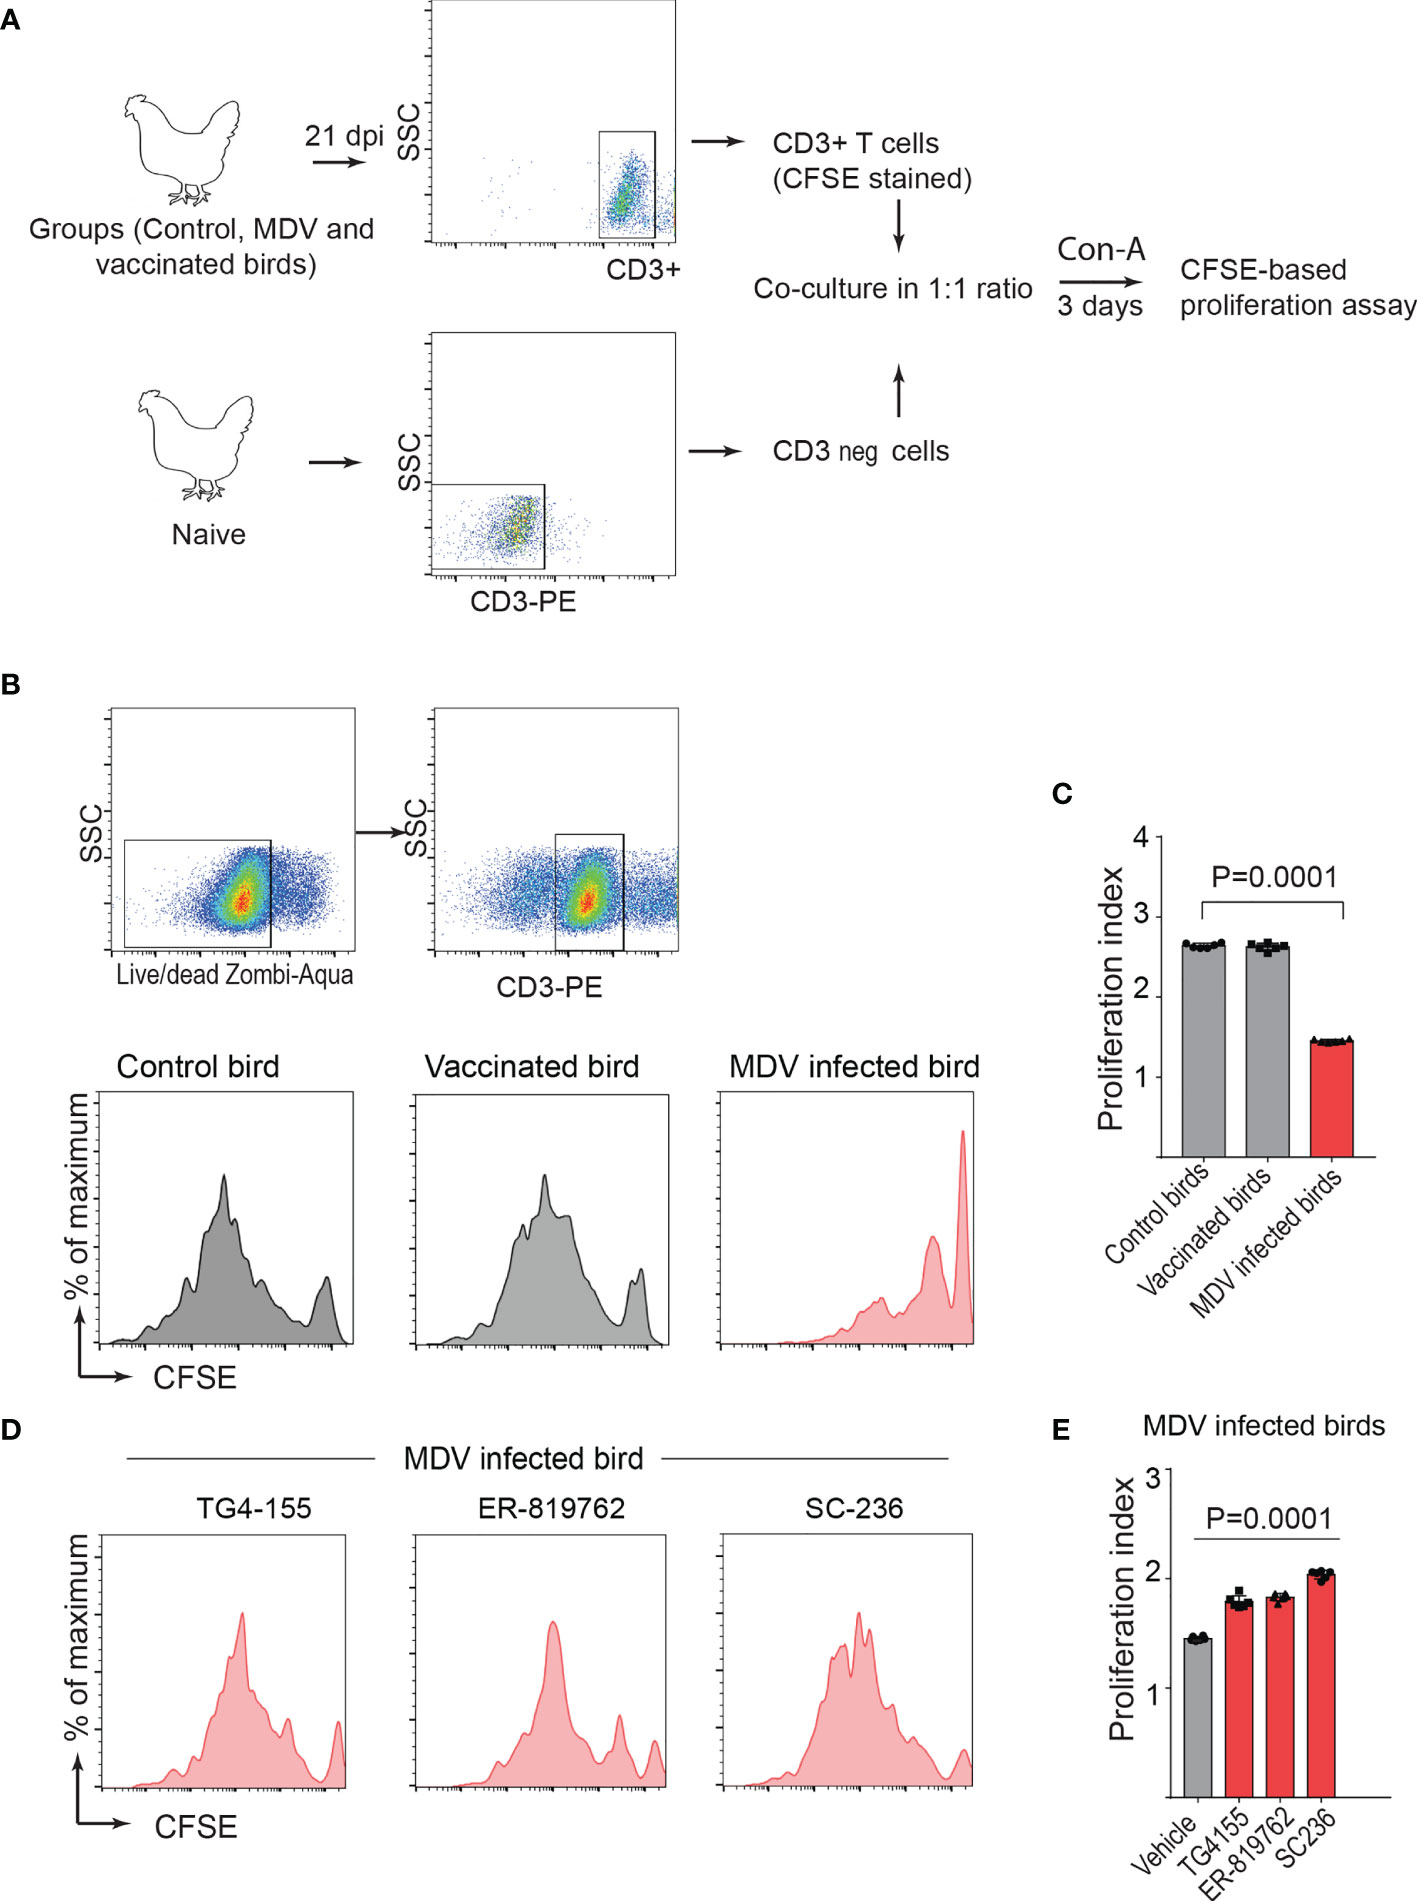
Figure 6 PGE2-COX-2 drives dysfunction of CD3+ T cells in MDV infected chickens. (A) CD3+ T cells were isolated from splenocytes harvested at 21 dpi from control (n=5), MDV infected (n=5) and vaccinated birds (n=5) and stained with CFSE before co-culturing with CD3 negative T cells isolated from splenocytes of naïve birds. The co-culture was stimulated with Con-A (5 µg/ml) in presence or absence of the chemical inhibitors of PGE2-COX-2 pathway. After 3 days of co-culture, T cell proliferation was analysed by flow cytometry. (B, D) Representative histograms showing proliferation in CD3+ T cells from the control, vaccinated birds, and MDV infected birds with or without the chemical inhibitors: TG4-155 (4 μM), ER-819762 (8 μM) and SC-236 (5 μg/mL) and corresponding (C) proliferation index from the experimental groups of birds. (E) Proliferation index for CD3+ T cells from the MDV infected birds in presence of the chemical inhibitors of the PGE2-COX-2 pathway. Each dot represents the data from individual chicken and the graph represents the mean ± standard deviation of five independent replicates from individual chickens. Grey bars are used in the experimental groups in which no significant difference are found, while red bars are used to represent significant differences. Statistical significance was estimated by p value calculated by ANOVA test.
Next, a series of experiments were performed to determine whether treatment of CD3neg cells with the recombinant PGE2 or the supernatants prior to co-culture with CD3+ T cell can inhibit CD3+ T cell proliferation. In vitro, splenocytes were treated with the recombinant PGE2, the MDV supernatant, the vaccine supernatant or the 265L supernatant for 72 hrs. After 3-day culture, CD3neg cells were purified and co-cultured with CFSE-stained fresh CD3+ T cells (from naïve birds) in presence of Con-A for 3 days, and T cell proliferation was analysed using flow cytometry (Figure 7A). The results demonstrated that CD3neg cells treated with PGE2, or the soluble factors released from the MDV-infected cells were unable to suppress CD3+ T cell proliferation in vitro (Figures 7B, C). To confirm these data using professional APCs, bone marrow derived dendritic cells (BMDCs) were generated in vitro and were treated with PGE2, or the soluble factors released by the MDV-infected cells for 3 days. Then, the treated BMDCs were co-cultured with freshly isolated CFSE-labelled naïve CD3+ T cells and Con-A-induced T cell proliferation was examined using flow cytometry (Figure 7D). The results demonstrated that BMDCs treated with PGE2 or the soluble factors from the MDV-infected cells failed to suppress T cell proliferation (Figures 7E, F). To confirm these findings in the MDV infected chickens, CD3neg cells were isolated from splenocytes of chickens infected with the virulent strain of MDV or mock control group at 21 dpi and were co-cultured with CFSE-stained CD3+ T cells isolated from non-infected naïve chickens in the presence of Con-A (Figure 7A). The results demonstrated that CD3neg cells isolated from the MDV-infected chickens were unable to suppress T cell proliferation (Figures 7B, C). Altogether, these results indicated that the MDV-induced COX-2/PGE2 pathway directly affect CD3+ T cells and suppress MDV-induced impairment of T cell proliferation.
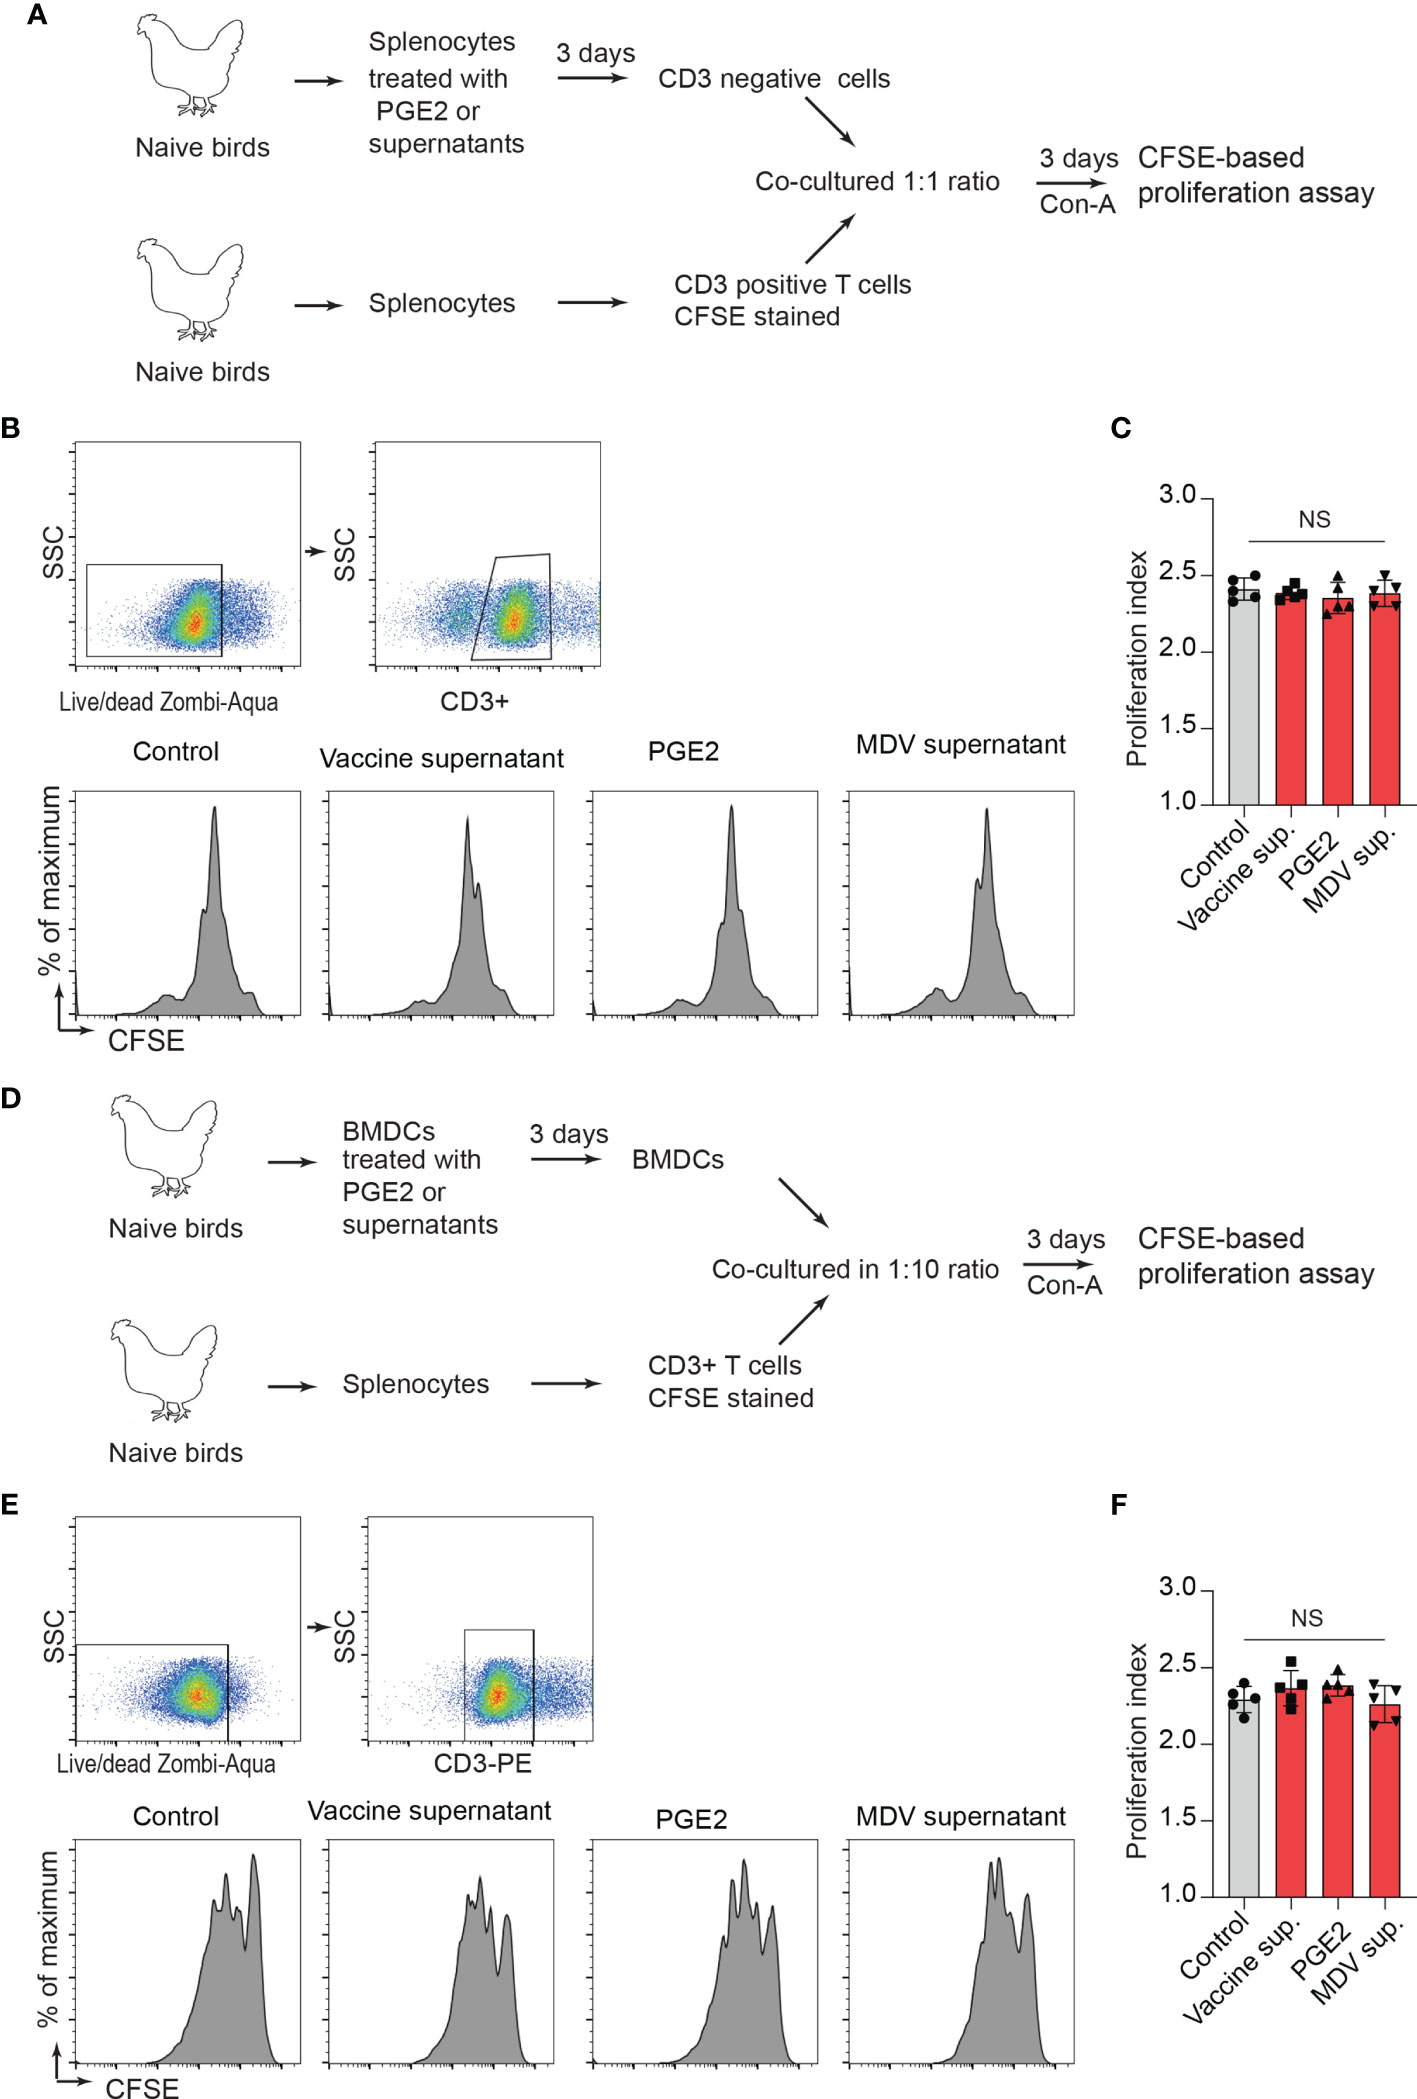
Figure 7 PGE2/MDV supernatant directly affected CD3+ T cells and impaired CD3+ T cells is independent of CD3 negative T cells and BMDCs. (A) CD3 negative cells were isolated from splenocytes cultured for 3 days in media containing recombinant PGE2 (5 µg/ml), the control supernatant, MDV supernatant, vaccine supernatant or 265L supernatant. The isolated CD3 negative cells were co-cultured with CFSE stained CD3+ T cells isolated from naive birds in presence of Con-A (5 µg/ml). After 3 days of co-culture, T cell proliferation was analysed by flow cytometry. (B, C) Representative histograms and corresponding (C) proliferation index showing in vitro proliferation of CD3+ T cells from the experimental groups. (D) BMDCs were cultured for 3 days with media containing recombinant PGE2 (5 µg/ml), the control supernatant, MDV supernatant, vaccine supernatant or 265L supernatant. The treated BMDCs were harvested, washed, and cultured with CFSE stained CD3+ T cells isolated from naïve birds in fresh medium containing Con-A (5 µg/ml) for 3 days. (E) Representative histograms and corresponding (F) proliferation index for CD3+ T cells from the different experimental groups. Data is representation of three independent experiments, each performed with three biological replicates per treatment. Each dot represents the data from individual chicken and the graph represents the mean ± standard deviation of five independent replicates from individual chickens. Grey bars are used in the experimental groups in which no significant difference are found, while red bars are used to represent significant differences. Statistical significance was estimated by p value calculated by ANOVA test. NS, not significant.
Administration of COX-2 Inhibitor Rescued T Cell Proliferation in the MDV Infected Chickens
To examine the role of the MDV-induced COX-2/PGE2 pathway in the dysfunction of T cell proliferation, MDV-infected chickens were orally treated (daily administration until 21 dpi) with meloxicam (a nontoxic COX-2 inhibitor which is used in clinical cases in birds). At day 21 post infection, splenocytes were isolated and expression of COX-2 gene and CD3+ T cell proliferation were analysed in the experimental groups using RT-PCR and a CFSE-based proliferation assays, respectively (Figure 8A). Interestingly, the oral administration of meloxicam in the MDV-infected chickens downregulated COX-2 expression levels (Figure 8B) and rescued CD3+ T cell proliferation (Figures 8C, D).
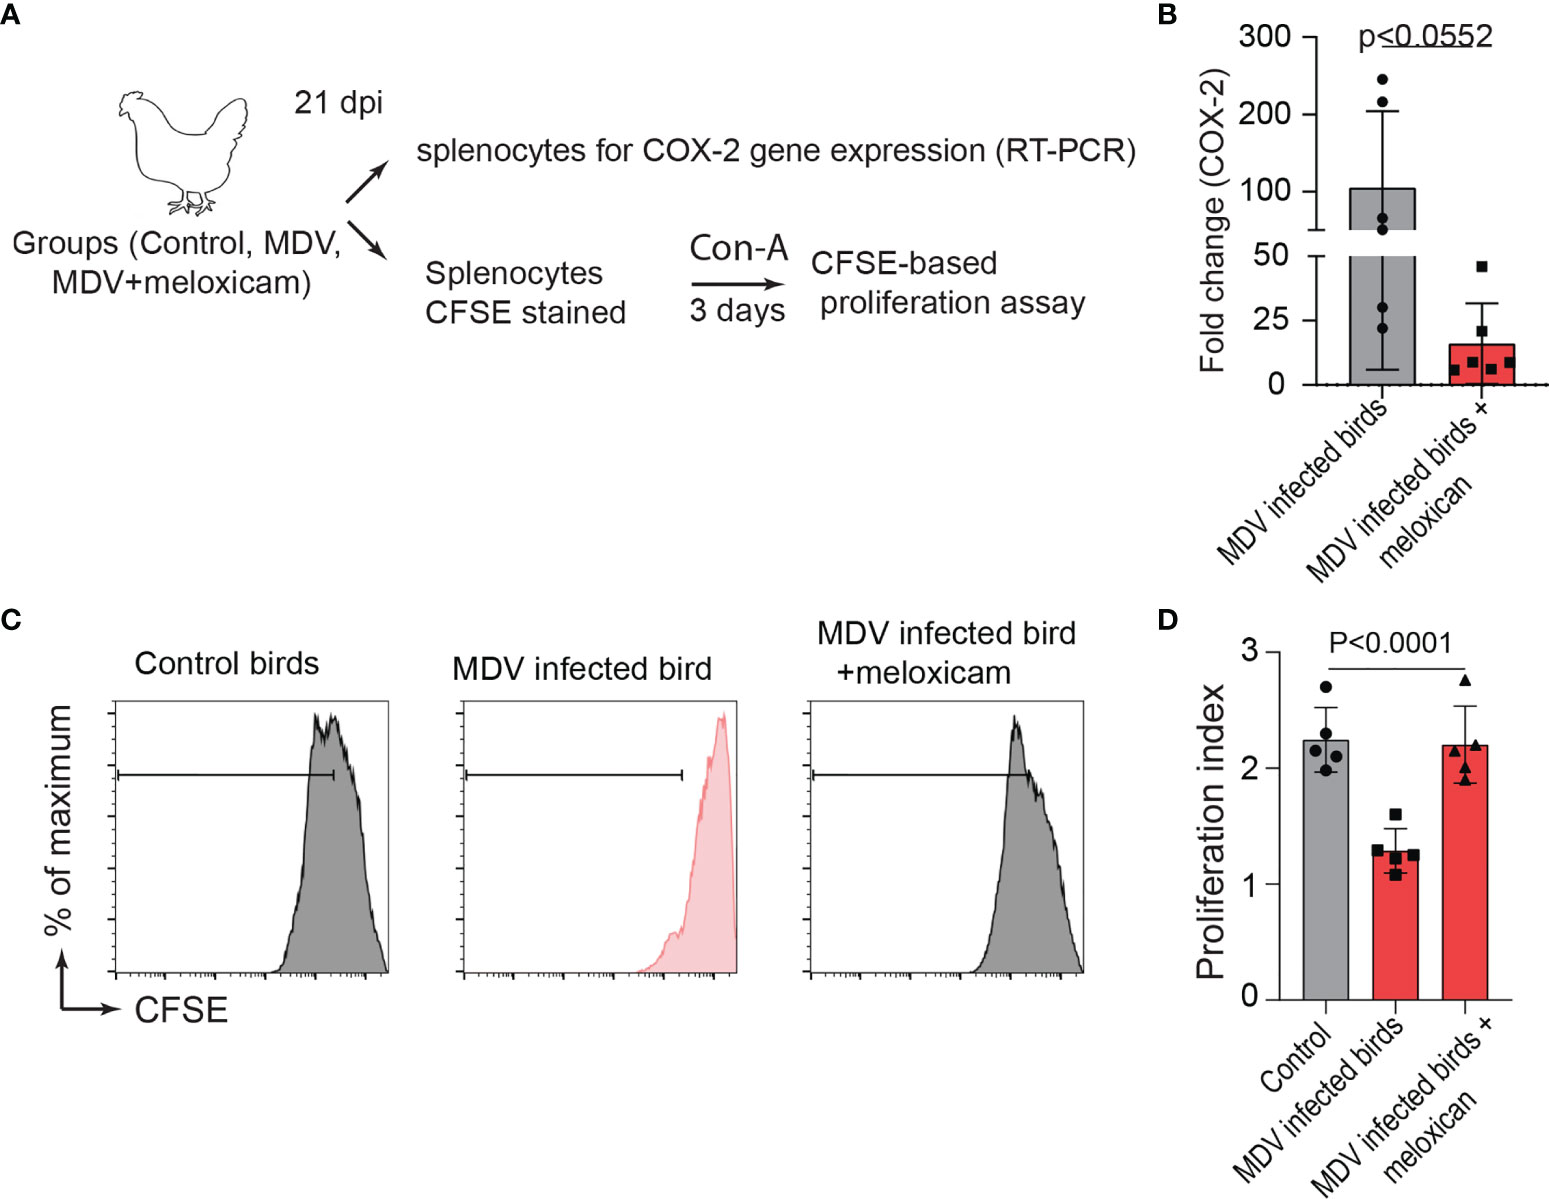
Figure 8 Administration of meloxicam rescues T cell proliferation in MDV infected chickens. (A) Schematic diagram showing the experimental groups; non-infected mock controls, MDV infected birds (RB1B, 1,000 pfu/dose), and MDV infected birds that received daily oral administration of meloxicam. (B) COX-2 expression levels in splenocytes of the experimental groups were analysed using RT-PCR assay. CFSE-labelled splenocytes were stimulated with Con-A and cultured for 3 days in vitro to assess T cell proliferation using flow cytometry. (C) Representative histograms and corresponding (D) proliferation index showing ex vivo proliferation of CD3+ T cells in mock control and MDV infected with and without meloxicam treated birds. Grey bars are used in the experimental groups in which no significant difference are found, while red bars are used to represent significant differences. Each dot represents the data from individual chicken and the graph represents the mean ± standard deviation of five independent replicates from individual chickens. Statistical significance was estimated by p value calculated by ANOVA test.
Discussion
Foxp3-like genes has not been identified in the chicken genome (31) and thus CD25 and membrane bound TGF-beta are used to identify chicken Treg cells (22, 32). In MDV infection, there is a shift towards TGF-beta+ CD4+ T cells while the frequencies of CD4+CD25+ T cells are unchanged (22). MDV infection is characterized by the induction of immunosuppression (33, 34), and a reduction in proliferation of non-transformed T cells. This impairment has been attributed to activation of immunomodulatory molecules by tumour associated macrophages (35), increased production of arginase by chicken macrophages from MDV infected chickens (36) and expansion of TGF-beta+ Treg cells expressing inhibitory molecules such as CTLA4 and PD1 (22). Here, the role of this COX-2/PGE2 pathway activation in MDV-induced immunosuppression and specifically the impairment of T cell proliferation during virus infection is examined at day 21 post infection. In vitro infection of chicken embryonated fibroblasts with virulent strain of MDV activates COX-2/PGE2 pathway which is involved in efficient replication of MDV via Ep2 and EP4 receptors which are upregulated in MDV infected cells (15). It is speculated that PGE2 may contribute to MDV replication by inhibiting other pathway(s) (e.g. NO production, type I IFN production etc.) which potentially can restrict MDV replication. It seems that dynamic of Rispen-CVI988 replication is different than the virulent MDV (37), as the vaccine strain does not activate COX-2/PGE2 pathway and thus does not require PGE2 for its replication. It is possible, but not proven, that infection of cells with Rispens-CVI988 does not activate these inhibitory pathways. COX-2 is considered as an oncogene in mammalian models, and it is possible that COX-2 is activated by MDV genes which have different sequences in MDV and Rispens-CVI998 (e.g. MEQ). It is noteworthy to mention that only small residues of non-structural protein 2 from highly pathogenic porcine reproductive and respiratory syndrome virus promote COX-2 expression in infected pigs leading to clinical signs of the disease (38). We are currently examining the role of MDV gene in activation of COX-2/PGE2 pathway in MDV infected cells. However, it is still unclear whether activation of the COX2/PGE2 pathway is associated with MDV pathogenesis. The results from this study indicate that there is an association between pathogenesis and activation of COX-2 which leads to impairment of T cell proliferation in vitro and in vivo.
Our result reveals that induction of the COX2/PGE2 pathway is only observed in chickens infected with virulent strain of MDV, while administration of vaccine strain of MDV (Rispens-CVI988) does not lead to this activation in vitro or in vivo. Interestingly, the results show that the COX2/PGE2 pathway activation is involved in the impairment of chicken T cell proliferation, and perhaps MDV-induced immunosuppression. Our results also demonstrate that the MDV-induced COX-2/PGE2 pathway suppresses IL 2 gene expression and transferrin uptake. Further research is required to examine whether the release of IL-2 protein is also influenced by this pathway. The effects of MDV-induced COX2/PGE2 pathway on T cell function is in accordance with results showing that PGE2 suppresses human T cell activation and proliferation via two distinct pathways: inhibition of transferrin receptor expression and IL 2 production (23, 39). In contrast, MDV-induced COX2/PGE2 pathway did not modulate CD25 molecule (IL-2 receptor alpha chain) which has been shown to be modulated by PGE2 on human immune cells (40, 41). Interestingly, COX2 inhibitor blocked the effects of PGE2 on T cells, this is only possible if PGE2 can activate COX-2 expression, and this can lead to further release of PGE2 (42). Many mammalian viruses activate the COX-2/PGE2 pathway and contribute to virus replication and spread (11, 43–48), however the role of virus-induced COX2/PGE2 pathway in pathogenesis and especially virus-induced immunosuppression has not been extensively studied. Many viruses may suppress T cell proliferation by inhibiting the function of antigen presenting cells (APCs). Previous results had shown that MDV infection modulates the function of APCs at day 10 post infection (35, 36). In this study, we examined T cell proliferation 21 dpi, and demonstrated that MDV-induced COX2 pathway directly affect T cell proliferation and addition of fresh APCs could not rescue T cell function. The lack of CD3+ responsiveness as a function of time (5, 10 and 21 dpi) is beyond the scope of this study. It is possible that APC populations may already have patterned the T-cells to be a sub-lineage (i.e., Treg), prior to 21 dpi. Considering that PGE2 may modulate the function of APCs (49), it was expected that impairment of T cell proliferation in MDV-infected chickens may be, at least partially, be attributed to the effects of PGE2 on APCs. Surprisingly, our results demonstrate that APCs are not involved in the MDV-induced impairment of T cell proliferation at day 21 post infection. Intriguingly, even recombinant PGE2-treated APCs failed to suppress T cell proliferation. This does not exclude the possibility that MDV-induced COX2/PGE2 activation may modulate other important functions of immune cells (e.g. cytokine production, phagocytosis, induction of T cell subsets, suppression of T cell cytotoxicity etc.) (49–51) which may be important in pathogenesis of viral infections. Combination therapy of COX-2 inhibitors and anti-PD1 antibodies have been used in murine models to increase the efficacy of COX-2 inhibitors in the context of T cell functions and survival during chronic viral infections in mice (17) and cattle infected with leukaemia virus (25). It has been suggested that PGE2 may upregulate PD-L1 expression, and this may suppress effector Th1 type responses (26). Antibodies against chicken PD1 and PDL1 have been generate at our institute (52), and future studies will be conducted to examine the combined effects of COX-2 inhibitors and PD1 antibodies on both viral replication, T cell function and disease progress in MDV-infected chickens.
MDV infection leads to development of CD4+ T cell lymphoma in infected chickens, thus it is possible that the MDV-induced COX2/PGE2 pathway may contribute to tumorigenesis of MDV by suppressing immune response against MDV-induced CD4+ lymphoma cells. The role of COX-2 as an oncogene and its suppression of anti-tumour immunity has been extensively studied in mammalian models, and EP4 inhibitors have been suggested in cancer therapeutic and immunotherapy approaches (53, 54). Understanding the role of MDV-induced COX2/PGE2 activation in the modulation of immune responses against viral infection and tumorigenesis may lead to the development of novel vaccination strategies. Moreover, further studies are required to examine the role COX2/PGE2 pathway in tumorigenesis of MDV and modulation of anti-tumour immunity. Therefore, it may be possible that MDV infection could be used as a model for the development of novel treatment strategies by targeting the COX2/PGE2 pathway to control viral replication, virus-induced immunosuppression, and tumorigenesis.
Data Availability Statement
The original contributions presented in the study are included in the article/supplementary material. Further inquiries can be directed to the corresponding author.
Ethics Statement
The animal study was reviewed and approved by Animal Welfare and Ethical Review Body at The Pirbright Institute.
Author Contributions
Conceptualization: SB and AP. Data curation: NK, AG, and SB. Formal analysis: NK, AG, and SB. Funding acquisition: SB. Investigation: NK, AG, and SB. Methodology: NK, AG, and SB. Supervision: SB Visualization: NK and AG. Writing – original draft: NK, AG, BK, AP, and SB. Writing – review & editing: SB, BK, and AP.
Funding
This work was supported by U.K. Research and Innovation Biotechnology and Biological Sciences Research Council Grants BBS/E/I/00001825, BBS/E/I/00007030, BBS/E/I/00007031, BB/S01506X/1, BBS/E/I/00002529, BBS/E/I/00007039, BBS/E/I/00007032, BB/N002598/1 andBB/V019031/1.
Conflict of Interest
The authors declare that the research was conducted in the absence of any commercial or financial relationships that could be construed as a potential conflict of interest.
Publisher’s Note
All claims expressed in this article are solely those of the authors and do not necessarily represent those of their affiliated organizations, or those of the publisher, the editors and the reviewers. Any product that may be evaluated in this article, or claim that may be made by its manufacturer, is not guaranteed or endorsed by the publisher.
Acknowledgments
We acknowledge the excellent support from Animal facilities at the Pirbright Institute.
References
1. Jerome KR. Viral Modulation of T-Cell Receptor Signaling. J Virol (2008) 82:4194–204. doi: 10.1128/JVI.00059-08
2. Marshall HD, Urban SL, Welsh RM. Virus-Induced Transient Immune Suppression and the Inhibition of T Cell Proliferation by Type I Interferon. J Virol (2011) 85:5929–39. doi: 10.1128/JVI.02516-10
3. Sander WJ, O'Neill HG, Pohl CH. Prostaglandin E(2) As a Modulator of Viral Infections. Front Physiol (2017) 8:89. doi: 10.3389/fphys.2017.00089
4. Agard M, Asakrah S, Morici LA. PGE(2) Suppression of Innate Immunity During Mucosal Bacterial Infection. Front Cell Infect Microbiol (2013) 3:45. doi: 10.3389/fcimb.2013.00045
5. Kalinski P. Regulation of Immune Responses by Prostaglandin E2. J Immunol (2012) 188:21–8. doi: 10.4049/jimmunol.1101029
6. Martínez-Colón GJ, Moore BB. Prostaglandin E(2) as a Regulator of Immunity to Pathogens. Pharmacol Ther (2018) 185:135–46. doi: 10.1016/j.pharmthera.2017.12.008
7. Medeiros A, Peres-Buzalaf C, Fortino Verdan F, Serezani CH. Prostaglandin E2 and the Suppression of Phagocyte Innate Immune Responses in Different Organs. Mediators Inflammation (2012) 2012:327568. doi: 10.1155/2012/327568
8. Phipps RP, Stein SH, Roper RL. A New View of Prostaglandin E Regulation of the Immune Response. Immunol Today (1991) 12:349–52. doi: 10.1016/0167-5699(91)90064-Z
9. Sreeramkumar V, Fresno M, Cuesta N. Prostaglandin E2 and T Cells: Friends or Foes? Immunol Cell Biol (2012) 90:579–86. doi: 10.1038/icb.2011.75
10. Fitzgerald DW, Bezak K, Ocheretina O, Riviere C, Wright TC, Milne GL, et al. The Effect of HIV and HPV Coinfection on Cervical COX-2 Expression and Systemic Prostaglandin E2 Levels. Cancer Prev Res (Phila) (2012) 5:34–40. doi: 10.1158/1940-6207.CAPR-11-0496
11. Harbour DA, Blyth WA, Hill TJ. Prostanglandins Enhance Spread of Herpes Simplex Virus in Cell Cultures. J Gen Virol (1978) 41:87–95. doi: 10.1099/0022-1317-41-1-87
12. Hooks JJ, Chin MS, Srinivasan K, Momma Y, Hooper LC, Nagineni CN, et al. Human Cytomegalovirus Induced Cyclooxygenase-2 in Human Retinal Pigment Epithelial Cells Augments Viral Replication Through a Prostaglandin Pathway. Microbes Infect (2006) 8:2236–44. doi: 10.1016/j.micinf.2006.04.010
13. Luczak M, Gumulka W, Szmigielski S, Korbecki M. Inhibition of Multiplication of Parainfluenza 3 Virus in Prostaglandin-Treated WISH Cells. Arch Virol (1975) 49:377–80. doi: 10.1007/BF01318248
14. Li X, Xie T, Gao L, Ma C, Yang X, Liang X. Prostaglandin E2 Facilitates Hepatitis B Virus Replication by Impairing CTL Function. Mol Immunol (2018) 103:243–50. doi: 10.1016/j.molimm.2018.08.009
15. Boodhoo N, Kamble N, Kaufer BB, Behboudi S. Replication of Marek's Disease Virus Is Dependent on Synthesis of De Novo Fatty Acid and Prostaglandin E(2). J Virol (2019) 93(13):e00352-19. doi: 10.1128/JVI.00352-19
16. Sharma-Walia N, Raghu H, Sadagopan S, Sivakumar R, Veettil MV, Naranatt PP, et al. Cyclooxygenase 2 Induced by Kaposi's Sarcoma-Associated Herpesvirus Early During In Vitro Infection of Target Cells Plays a Role in the Maintenance of Latent Viral Gene Expression. J Virol (2006) 80:6534–52. doi: 10.1128/JVI.00231-06
17. Chen JH, Perry CJ, Tsui YC, Staron MM, Parish IA, Dominguez CX, et al. Prostaglandin E2 and Programmed Cell Death 1 Signaling Coordinately Impair CTL Function and Survival During Chronic Viral Infection. Nat Med (2015) 21:327–34. doi: 10.1038/nm.3831
18. Rahmouni S, Aandahl EM, Nayjib B, Zeddou M, Giannini S, Verlaet M, et al. Cyclo-Oxygenase Type 2-Dependent Prostaglandin E2 Secretion Is Involved in Retrovirus-Induced T-Cell Dysfunction in Mice. Biochem J (2004) 384:469–76. doi: 10.1042/BJ20031859
19. Spatz SJ, Petherbridge L, Zhao Y, Nair V. Comparative Full-Length Sequence Analysis of Oncogenic and Vaccine (Rispens) Strains of Marek's Disease Virus. J Gen Virol (2007) 88:1080–96. doi: 10.1099/vir.0.82600-0
20. Nair V. Spotlight on Avian Pathology: Marek's Disease. Avian Pathol (2018) 47:440–2. doi: 10.1080/03079457.2018.1484073
21. Osterrieder N, Kamil JP, Schumacher D, Tischer BK, Trapp S. Marek's Disease Virus: From Miasma to Model. Nat Rev Microbiol (2006) 4:283–94. doi: 10.1038/nrmicro1382
22. Gurung A, Kamble N, Kaufer BB, Pathan A, Behboudi S. Association of Marek's Disease Induced Immunosuppression With Activation of a Novel Regulatory T Cells in Chickens. PloS Pathog (2017) 13:e1006745. doi: 10.1371/journal.ppat.1006745
23. Chouaib S, Welte K, Mertelsmann R, Dupont B. Prostaglandin E2 Acts at Two Distinct Pathways of T Lymphocyte Activation: Inhibition of Interleukin 2 Production and Down-Regulation of Transferrin Receptor Expression. J Immunol (1985) 135:1172–9.
24. Chouaib S, Robb RJ, Welte K, Dupont B. Analysis of Prostaglandin E2 Effect on T Lymphocyte Activation. Abrogation of Prostaglandin E2 Inhibitory Effect by the Tumor Promotor 12.0 Tetradecanoyl Phorbol-13 Acetate. J Clin Invest (1987) 80:333–40. doi: 10.1172/JCI113077
25. Sajiki Y, Konnai S, Okagawa T, Nishimori A, Maekawa N, Goto S, et al. Prostaglandin E(2)-Induced Immune Exhaustion and Enhancement of Antiviral Effects by Anti-PD-L1 Antibody Combined With COX-2 Inhibitor in Bovine Leukemia Virus Infection. J Immunol (2019) 203:1313–24. doi: 10.4049/jimmunol.1900342
26. Goto S, Konnai S, Hirano Y, Kohara J, Okagawa T, Maekawa N, et al. Upregulation of PD-L1 Expression by Prostaglandin E(2) and the Enhancement of IFN-γ by Anti-PD-L1 Antibody Combined With a COX-2 Inhibitor in Mycoplasma Bovis Infection. Front Vet Sci (2020) 7:12. doi: 10.3389/fvets.2020.00012
27. Boodhoo N, Kamble N, Behboudi S. De Novo Cholesterol Biosynthesis and Its Trafficking in LAMP-1-Positive Vesicles Are Involved in Replication and Spread of Marek's Disease Virus. J Virol (2020) 94(24):e01001-20. doi: 10.1128/JVI.01001-20
28. Boodhoo N, Kamble N, Sharif S, Behboudi S. Glutaminolysis and Glycolysis Are Essential for Optimal Replication of Marek's Disease Virus. J Virol (2020) 94(4):e01680-19. doi: 10.1128/JVI.01680-19
29. Kamble NM, Jawale CV, Lee JH. Activation of Chicken Bone Marrow-Derived Dendritic Cells Induced by a Salmonella Enteritidis Ghost Vaccine Candidate. Poult Sci (2016) 95:2274–80. doi: 10.3382/ps/pew158
30. Maseda D, Ricciotti E, Crofford LJ. Prostaglandin Regulation of T Cell Biology. Pharmacol Res (2019) 149:104456. doi: 10.1016/j.phrs.2019.104456
31. Andersen KG, Nissen JK, Betz AG. Comparative Genomics Reveals Key Gain-Of-Function Events in Foxp3 During Regulatory T Cell Evolution. Front Immunol (2012) 3:113. doi: 10.3389/fimmu.2012.00113
32. Shanmugasundaram R, Selvaraj RK. Regulatory T Cell Properties of Chicken CD4+CD25+ Cells. J Immunol (2011) 186:1997–2002. doi: 10.4049/jimmunol.1002040
33. Boodhoo N, Gurung A, Sharif S, Behboudi S. Marek's Disease in Chickens: A Review With Focus on Immunology. Vet Res (2016) 47:119. doi: 10.1186/s13567-016-0404-3
34. Gimeno IM, Schat KA. Virus-Induced Immunosuppression in Chickens. Avian Dis (2018) 62:272–85. doi: 10.1637/11841-041318-Review.1
35. Lee LF, Sharma JM, Nazerian K, Witter RL. Suppression of Mitogen-Induced Proliferation of Normal Spleen Cells by Macrophages From Chickens Inoculated With Marek's Disease Virus. J Immunol (1978) 120:1554–9.
36. Djeraba A, Musset E, van Rooijen N, Quéré P. Resistance and Susceptibility to Marek's Disease: Nitric Oxide Synthase/Arginase Activity Balance. Vet Microbiol (2002) 86:229–44. doi: 10.1016/S0378-1135(02)00010-X
37. Islam T, Walkden-Brown SW, Renz KG, Islam AF, Ralapanawe S. Replication Kinetics and Shedding of Very Virulent Marek's Disease Virus and Vaccinal Rispens/CVI988 Virus During Single and Mixed Infections Varying in Order and Interval Between Infections. Vet Microbiol (2014) 173:208–23. doi: 10.1016/j.vetmic.2014.07.027
38. Du L, Wang H, Liu F, Wei Z, Weng C, Tang J, et al. NSP2 Is Important for Highly Pathogenic Porcine Reproductive and Respiratory Syndrome Virus to Trigger High Fever-Related COX-2-PGE2 Pathway in Pigs. Front Immunol (2021) 12:657071. doi: 10.3389/fimmu.2021.657071
39. He X, Stuart JM. Prostaglandin E2 Selectively Inhibits Human CD4+ T Cells Secreting Low Amounts of Both IL-2 and IL-4. J Immunol (1999) 163:6173–9.
40. Mary D, Aussel C, Ferrua B, Fehlmann M. Regulation of Interleukin 2 Synthesis by cAMP in Human T Cells. J Immunol (1987) 139:1179–84.
41. von Bergwelt-Baildon MS, Popov A, Saric T, Chemnitz J, Classen S, Stoffel MS, et al. CD25 and Indoleamine 2,3-Dioxygenase Are Up-Regulated by Prostaglandin E2 and Expressed by Tumor-Associated Dendritic Cells In Vivo: Additional Mechanisms of T-Cell Inhibition. Blood (2006) 108:228–37. doi: 10.1182/blood-2005-08-3507
42. Cho W, Choe J. Prostaglandin E2 Stimulates COX-2 Expression via Mitogen-Activated Protein Kinase P38 But Not ERK in Human Follicular Dendritic Cell-Like Cells. BMC Immunol (2020) 21:20. doi: 10.1186/s12865-020-00347-y
43. Cheung W, Gill M, Esposito A, Kaminski CF, Courousse N, Chwetzoff S, et al. Rotaviruses Associate With Cellular Lipid Droplet Components to Replicate in Viroplasms, and Compounds Disrupting or Blocking Lipid Droplets Inhibit Viroplasm Formation and Viral Replication. J Virol (2010) 84:6782–98. doi: 10.1128/JVI.01757-09
44. Guerrero CA, Acosta O. Inflammatory and Oxidative Stress in Rotavirus Infection. World J Virol (2016) 5:38–62. doi: 10.5501/wjv.v5.i2.38
45. Liu L, Cao Z, Chen J, Li R, Cao Y, Zhu C, et al. Influenza A Virus Induces Interleukin-27 Through Cyclooxygenase-2 and Protein Kinase A Signaling. J Biol Chem (2012) 287:11899–910. doi: 10.1074/jbc.M111.308064
46. Bartz H, Büning-Pfaue F, Türkel O, Schauer U. Respiratory Syncytial Virus Induces Prostaglandin E2, IL-10 and IL-11 Generation in Antigen Presenting Cells. Clin Exp Immunol (2002) 129:438–45. doi: 10.1046/j.1365-2249.2002.01927.x
47. Hayes MM, Lane BR, King SR, Markovitz DM, Coffey MJ. Prostaglandin E(2) Inhibits Replication of HIV-1 in Macrophages Through Activation of Protein Kinase a. Cell Immunol (2002) 215:61–71. doi: 10.1016/S0008-8749(02)00017-5
48. Hyman A, Yim C, Krajden M, Read S, Basinski AS, Wanless I, et al. Oral Prostaglandin (PGE2) Therapy for Chronic Viral Hepatitis B and C. J Viral Hepat (1999) 6:329–36. doi: 10.1046/j.1365-2893.1999.00161.x
49. Stephan RN, Conrad PJ, Saizawa M, Dean RE, Chaudry IH. Prostaglandin E2 Depresses Antigen-Presenting Cell Function of Peritoneal Macrophages. J Surg Res (1988) 44:733–9. doi: 10.1016/0022-4804(88)90108-4
50. Boniface K, Bak-Jensen KS, Li Y, Blumenschein WM, McGeachy MJ, McClanahan TK, et al. Prostaglandin E2 Regulates Th17 Cell Differentiation and Function Through Cyclic AMP and EP2/EP4 Receptor Signaling. J Exp Med (2009) 206:535–48. doi: 10.1084/jem.20082293
51. Poloso NJ, Urquhart P, Nicolaou A, Wang J, Woodward DF. PGE2 Differentially Regulates Monocyte-Derived Dendritic Cell Cytokine Responses Depending on Receptor Usage (EP2/EP4). Mol Immunol (2013) 54:284–95. doi: 10.1016/j.molimm.2012.12.010
52. Reddy V, Mwangi W, Sadigh Y, Nair V. In Vitro Interactions of Chicken Programmed Cell Death 1 (PD-1) and PD-1 Ligand-1 (PD-L1). Front Cell Infect Microbiol (2019) 9:436. doi: 10.3389/fcimb.2019.00436
53. Liu B, Qu L, Yan S. Cyclooxygenase-2 Promotes Tumor Growth and Suppresses Tumor Immunity. Cancer Cell Int (2015) 15:106. doi: 10.1186/s12935-015-0260-7
Keywords: Marek’s disease virus, T cell proliferation, COX2 = cyclooxygenase 2, PGE2, immunosuppression
Citation: Kamble N, Gurung A, Kaufer BB, Pathan AA and Behboudi S (2021) Marek’s Disease Virus Modulates T Cell Proliferation via Activation of Cyclooxygenase 2-Dependent Prostaglandin E2. Front. Immunol. 12:801781. doi: 10.3389/fimmu.2021.801781
Received: 25 October 2021; Accepted: 06 December 2021;
Published: 22 December 2021.
Edited by:
Shokrollah Elahi, University of Alberta, CanadaReviewed by:
Mohammad Dar, University of Saskatchewan, CanadaNune Markosyan, University of Pennsylvania, United States
Keith William Jarosinski, University of Illinois at Urbana-Champaign, United States
Copyright © 2021 Kamble, Gurung, Kaufer, Pathan and Behboudi. This is an open-access article distributed under the terms of the Creative Commons Attribution License (CC BY). The use, distribution or reproduction in other forums is permitted, provided the original author(s) and the copyright owner(s) are credited and that the original publication in this journal is cited, in accordance with accepted academic practice. No use, distribution or reproduction is permitted which does not comply with these terms.
*Correspondence: Shahriar Behboudi, shahriar.behboudi@pirbright.ac.uk