 Nicholas L. Li1
- 1 Department of Medical Microbiology and Immunology, University of Alberta, Edmonton, AB, Canada
- 2 Transplant Infectious Diseases, Department of Medicine, University of Alberta, Edmonton, AB, Canada
Leukocyte Ig-like receptor 1 (LIR-1) is an inhibitory Ig superfamily receptor with broad specificity for MHC-I expressed on leukocytes including natural killer (NK) and T cells. The extent of LIR-1 expression on NK cells is quite disparate between donors but the regulation of LIR-1 in NK cells is poorly understood. We examined expression profiles of LIR-1 on NK and T lymphocytes in 11 healthy donors over 1 year. Four of the 11 donors demonstrated substantial increases in LIR-1+ NK cells. High levels of LIR-1 expression were not correlated with exposure to human cytomegalovirus or the fraction of CD57+ NK cells in the donor. LIR-1 levels on ex vivo NK and CD56+ T cells were increased in vitro by short term exposure to IL-2 or IL-15 compared to control but not with various other cytokines tested. Sorted CD56bright NK cells also increased LIR-1 expression when cultured in IL-2. Maintenance of LIR-1 on longer term NK cells was also dependent on continuous stimulation by IL-15 or IL-2. While we could not detect increases in total LIR-1 mRNA in response to cytokine treatment by qPCR, we observed a shift in activity of LIR-1 promoter reporter constructs in the presence of IL-2 favoring the more translationally active transcript from the proximal promoter. Together these results show LIR-1 on NK cells is under the control of cytokines known to drive NK cell maturation and activation and suggest availability of such cytokines may alter the NK repertoire in vivo as we observed in several donors with fluctuating levels of LIR-1 on their NK cells.
Introduction
Leukocyte Ig-like receptors (LIR) regulate a diverse array of functions within the immune system (Colonna et al., 1999; Brown et al., 2004). The LIR family contains 11 functional members encoded within the Leukocyte Receptor Complex on human chromosome 19 (Wende et al., 1999). The LIR family includes both activating and inhibitory receptors, but the ligands and functions for many of these receptors have not yet been elucidated. Leukocyte Ig-like receptor 1 (LIR-1/ILT2/CD85j/LILRB1) is an inhibitory member of the Leukocyte Ig-like receptor family widely expressed in the immune system. The extracellular region of LIR-1 has four Ig domains and the cytoplasmic tail contains two ITIM motifs, as well it has other potential signaling motifs and has been shown to associate with the SH2 domain-containing phosphatase SHP-1 (Cosman et al., 1997; Bellon et al., 2002). LIR-1 was first identified as a receptor for MHC-I with broad specificity for both classical and non-classical forms (Colonna et al., 1997; Cosman et al., 1997; Samaridis and Colonna, 1997). The interaction with MHC-I has been well characterized and involves the first and second Ig domains of LIR-1 making contact with highly conserved regions of the α3-domain and β2-microglobulin, thereby explaining its ability to bind to a wide range of MHC-I alleles (Chapman et al., 1999, 2000; Shiroishi et al., 2003). The strongest MHC-I ligand is HLA-G, a non-classical MHC-I molecule, which is expressed in a restricted manner on placental trophoblasts, various tumors and perhaps induced on endothelial cells (Apps et al., 2008). LIR-1 is also believed to be a target of immune evasion as it is bound by the human cytomegalovirus (HCMV)-encoded MHC-I homolog, UL18, with an affinity orders of magnitude higher than for MHC-I (Cosman et al., 1997; Shiroishi et al., 2003). Recently, LIR-1 was also reported to bind to several types of bacteria although the details of this interaction and its role in infection remain to be determined (Nakayama et al., 2007).
Leukocyte Ig-like receptor 1 is expressed on monocytes, dendritic cells (DC), B and T lymphocytes, and natural killer (NK) cells (Borges et al., 1997; Colonna et al., 1997; Cosman et al., 1997; Fanger et al., 1998). It has been reported to be capable of inhibiting the activation of T cells (Saverino et al., 2000, 2002; Dietrich et al., 2001; Merlo et al., 2001), B cells (Merlo et al., 2005), DC (Tenca et al., 2005; Apps et al., 2007; Young et al., 2008), and NK (Vitale et al., 1999; Kirwan and Burshtyn, 2005; Prod’homme et al., 2007; Morel and Bellon, 2008). B cells and monocytes uniformly express high levels of LIR-1, whereas the surface expression of LIR-1 on T and NK cells is low and only on a subset of the cells. For T cells, LIR-1 expression is correlated with an effector/memory cell phenotype (Young et al., 2001). The expression of LIR-1 on NK cells displays a pattern that varies largely between individuals, similar to certain killer cell Ig-like receptors (KIR) such as KIR3DL1 (Li et al., 2008; Thomas et al., 2008). KIR expression profiles are dictated by the various KIR genotypes and are believed to remain quite stable in an individual (Valiante et al., 1997; Shilling et al., 2002; Pascal et al., 2004). We have previously found that the different LIR-1 phenotypes on NK cells between individuals associates with polymorphisms within the putative promoter region of the gene encoding LIR-1, LILRB1, and the level of transcript (Davidson et al., 2010). Sequencing analysis on a panel of donors identified 10 different alleles producing 9 protein variants, and while variability was also observed within the coding region of LILRB1, donor NK cell LIR-1 expression profiles were more strongly correlated with promoter region polymorphisms. However, very little is known regarding transcriptional control of LIR-1 expression. LIR-1 expression can be driven by the activity of two distinct promoters, a proximal promoter and a distal promoter located 13 kb further upstream that leads to inclusion of an additional exon (Lamar et al., 2010). Lymphocytes including NK cells preferentially employ the distal promoter, which accounts in part for lower levels of expression compared to myeloid cells due to the presence of elements encoded in the upstream exon that repress translation (Lamar et al., 2010). There is also some evidence that LIR-1 on NK cells can be modulated in vitro by ligands such as HLA-G and in vivo during infection by HCMV (LeMaoult et al., 2005; Wagner et al., 2007).
Here we assessed the stability of LIR-1 expression on NK cells in 11 healthy individuals over the course of 1 year, and the influence of particular cytokines on LIR-1 expression in NK cells. While most donors displayed a stable pattern of expression over time, we did observe a substantial increase in a subset of the donors, suggesting these cells had arisen due to selective expansion or induction of LIR-1 in vivo. Of a variety of pro- and anti-inflammatory cytokines we examined, we found that only IL-2 and IL-15 were capable of increasing the proportion of LIR-1+ NK cells in vitro. The increase in LIR-1 expression by this family of cytokines was correlated with enhanced activity of the proximal promoter, suggesting a shift to the more translationally active transcript might enhance LIR-1 expression in NK cells. Therefore while certain NK cell LIR-1 phenotypes may be dictated by LILRB1 genotypes, our data suggests there are additional levels of regulation beyond the inherent genetic control for this receptor.
Materials and Methods
Human Subjects, Blood Samples, and Cell Lines
Blood samples were drawn from healthy individuals over the course of this study. Written consent was obtained from all donors and all procedures were performed as approved by the Health Research Ethics Board at the University of Alberta. For longitudinal study, the donors answered a short questionnaire on health status at the time of each sampling. The study was initiated between February and June for all of the donors involved, and donors typically gave blood in the morning on various days of the week. All donors were self-declared as healthy and not involved in endurance training at the time of donation. Primary human peripheral blood mononuclear cells (PBMC) were isolated from blood using Lympholyte-H (Cedarlane, Burlington, ON, Canada) density gradient separation medium. Primary NK cells were further isolated from PBMC using the EasySep Human NK Cell Enrichment Kit (Stem Cell Technologies, Vancouver, BC, Canada) as directed by the manufacturer. In brief, PBMC were resuspended in sterile phosphate buffered saline (PBS) with 2% fetal bovine serum and 1 mM EDTA at a concentration of 5 × 10⁷ cells/ml prior to NK cell separation. Cells were then incubated with EasySep Negative Selection Human NK Cell Enrichment Cocktail (Stem Cell Technologies) at 50 μl/ml followed by EasySep Magnetic Microparticles (Stem Cell Technologies) at 100 μl/ml. For short term cultures, NK cells were then isolated by immunomagnetic separation using an EasySep Magnet (Stem Cell Technologies). Total PBMC or isolated NK cells were cultured in assay medium consisting of Iscoves (Invitrogen, Carlsbad, CA, USA), 10% Human Serum (Sigma, Oakville, ON, Canada), 2 mM glutamine, gentamicin, penicillin–streptomycin, and anti-mycotic (all from Invitrogen). For in vitro expansion, NK cells were purified from total PBMC using the StemSep Human NK Cell Enrichment Kit (Stem Cell Technologies). NK cells were then resuspended in Iscoves, medium 10% human serum, and 2 mM glutamine and provided with irradiated 721.221 cells as feeders cells, 0.5 μg/ml phytohaemagglutinin (PHA), and 200 U/ml rIL-2. CMV IgG testing was performed using the Siemens Behring Enzygost® CMV IgG assay as per manufacturer’s instructions. Once dividing, NK cells were maintained in culture media with 100 U/ml rIL-2. 721.221 cells were cultured in Iscoves medium, 10% FBS, and 2 mM glutamine. The YTS cell line was maintained in Iscoves medium, 15% FBS, 2 mM glutamine, and 50 μM β-mercaptoethanol.
Antibodies and Flow Cytometry
APC Anti-Human CD3 (HIT3a), PE-Cy5 Anti-Human CD85j (GHI/75), FITC Anti-Human CD57 (HNK-1) were purchased from BD Biosciences (Mississauga, ON, Canada). FITC Anti-Human CD69 (FN50) and PE Anti-Human CD56 (MEM188) were purchased from eBiosciences (San Diego, CA, USA). Isotype matched controls were obtained from the same companies as staining antibodies. For the time course studies of LIR-1, 1 × 10⁶ cells were stained ex vivo with 5 μl of each antibody in a minimal volume (<50 μl) for 30–60 min at 4°C. Cell surface staining analysis was performed using adjusted settings to obtain overlapping staining for the isotype matched control antibodies and analyzed using a FACSCanto or FACSCanto II (BD Biosciences). Subsequent experiments were also analyzed on a LSRII analyzer (BD Biosciences). Data analysis was performed using BD FACSDiva Software and FlowJo (Tree Star Inc.). For intracellular phospho-STAT5 staining, cells were permeabilized using the Cytoperm/Cytofix kit (BD Biosciences) and then stained with AF647 Anti STAT5 (pY694; Clone 47) or isotype matched control (BD Biosciences). Cell sorting was performed on a BD FACSAria cell sorter.
Cytokine Stimulations
Total PBMC were resuspended in assay media and plated out in a 48-well plate with 2 × 10⁶ cells per well in a volume of 400 μl. For purified NK cell stimulations, cells were cultured in a 96-well plate with 5 × 10⁵ cells in a volume of 200 μl. Cells were stimulated with human recombinant IL-2 (200 U/ml; Invitrogen), IL-12 (20 ng/ml), IL-15 (30 ng/ml), IL-10 (10 ng/ml), IFNα (5 U/ml), IFNβ (5 U/ml), IFNΓ (1 U/ml; R&D Systems, Burlington, ON, Canada), IL-18 (100 ng/ml; MBL International, Woburn, MA, USA). Cytokine cultures with expanded NK cell populations were performed in the presence of low dose IL-2 (20 U/ml). Cells were then incubated at 37°C and 5% CO2 for 24 or 72 h. The statistical significance of changes in LIR-1 expression following cytokine culture was determined by applying a two-sample t-test assuming equal variances comparing culture conditions with control using Microsoft Excel software. Changes were considered to be statistically significant when they yielded P-values less than 0.05, corresponding to a 95% confidence interval.
Quantitative Real-Time PCR and Luciferase Assays
Total RNA was purified using the RNeasy kit (Qiagen, Mississauga, ON, Canada) with DNase digestion performed as directed using the RNase-free DNase Set (Qiagen), and cDNA synthesized using qScript cDNA SuperMix (Quanta Biosciences, Gaithersburg, MD, USA). The LIR-1 quantitative real-time polymerase chain reaction was performed as previously described (Davidson et al., 2010). The RPL24 transcript was detected using primers RPL24FOR (5′-GGACCGACGGGAAGGTTTTCCAG-3′) and RPL24REV (5′-GGAATTTGACTGCTCGGCGGGT-3′). The distal (−14086 to −13793) and proximal (−1287 to −1) promoter regions (relative to the translation start) were amplified by PCR from D258 genomic DNA using the appropriate primers with the addition of KpnI and NheI restriction sites. The fragments were ligated into the pCRII TOPO vector (Invitrogen) and verified by sequence analysis. The fragments were excised using KpnI and NheI and cloned into the pGL3 vector (Promega, Madison, WI, USA) upstream of the firefly luciferase gene. YTS cells were cultured for 22 h in the presence or absence of IL-2 (1000 U/ml), and 5 × 10⁶ cells per sample were then transfected with 2.5 μg of pGL3 with and without the insert, and 10 ng of the pRL-TK plasmid using the Amaxa nucleofection system (AMAXA Biosystems, Gaithersburg, MD, USA) on program T-020 using Kit R. Transfected cells were then cultured for an additional 16 h with or without IL-2 before collection and analysis using the Dual-Luciferase reporter assay system (Promega). Firefly luciferase activity was normalized to the pRL-TK vector and is expressed relative to pGL3 alone.
Results
Fluctuations in LIR-1 Expression Profiles on Human NK Cells
To measure LIR-1 expression on human peripheral blood NK cells and T cells, surface expression was assessed by flow cytometry on freshly isolated PBMC with directly coupled antibodies. Figure 1 displays representative LIR-1 expression profiles on NK (CD56+CD3neg), T cells, and CD56+T cells for two donors exhibiting markedly different NK cell LIR-1 phenotypes. Typical NK cell profiles observed for our donors appeared biphasic, but with poor resolution of high and low expressing cells within the population, and often the LIR-1dim subset overlapping with isotype matched control. As previously reported, both the frequency of LIR-1+ cells and the intensity of LIR-1 staining on NK cells can vary dramatically between individuals. The frequency of LIR-1+CD56+ T cells was also quite variable between donors (Figure 1). Typically, this population of T cells exhibited a much more pronounced biphasic LIR-1 staining compared to NK cells. As expected, the frequency of LIR-1+ CD56neg T cells was consistently lower than the other two subsets with the majority of the cells appearing truly negative (Figure 1).
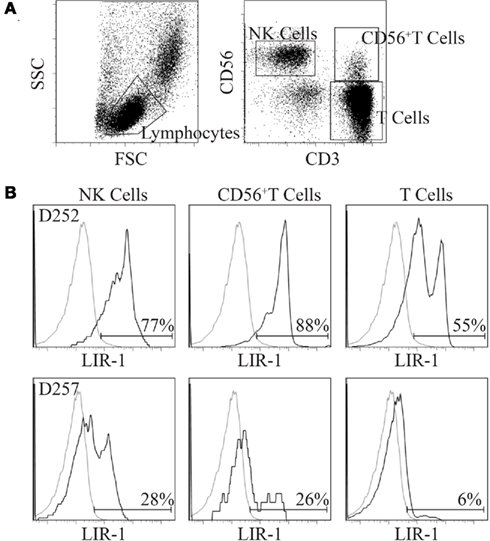
Figure 1. Comparison of LIR-1 expression on primary peripheral blood lymphocyte subsets. Freshly isolated PBMC were stained with antibodies to LIR-1, CD3, and CD56. See the Section “Materials and Methods” for details. (A) The gating strategy depicted was used to generate the LIR-1 staining profiles for the three lymphocyte subsets shown. (B) Representative results for a high donor D252 (top row) and a low donor D257 (bottom row) based on NK cell LIR-1 expression are shown.
To assess the stability of LIR-1 expression patterns on peripheral blood NK cells, we profiled 11 donors at intervals over the course of 1 year. These 11 donors presented a gradient of expression levels ranging from 24.8 to 69.1% LIR-1+ NK cells based on their initial samples. The average percent LIR-1+ cells for the panel at the completion of our time course are shown for the NK, CD56+ T, and CD56neg T cells (Figure 2A). For the 12–14-month period they were followed, the percentage of LIR-1+ NK cells in peripheral blood was relatively stable in most donors as indicated by the standard deviation (SD) (Figure 2A). Consistent staining was observed for each time point in most donors with either high or low initial LIR-1 frequency as illustrated with D105 and D177 (Figure 2B). However, 5 of the 11 donors had an obviously larger SD of the mean LIR-1 frequency (greater than 7%) compared to other donors. In these donors (D230, D224, D226, D225, and D227) the range of values varied ≥15% positive over the time course. When we assessed the trends over time, these changes occurred either as a large single increase between consecutive bleeds as shown for D227, or as stepwise increments over time as seen in D226 (Figure 2B). Interestingly with D227, following the large increase at month 3, the new LIR-1 frequency stabilized for the remaining 9 months of the study. One donor out of the 11 monitored (D224) exhibited a noticeable, sustained decrease in the proportion of LIR-1+ NK cells over time, although by the completion of the time course it had returned to the initial frequency.
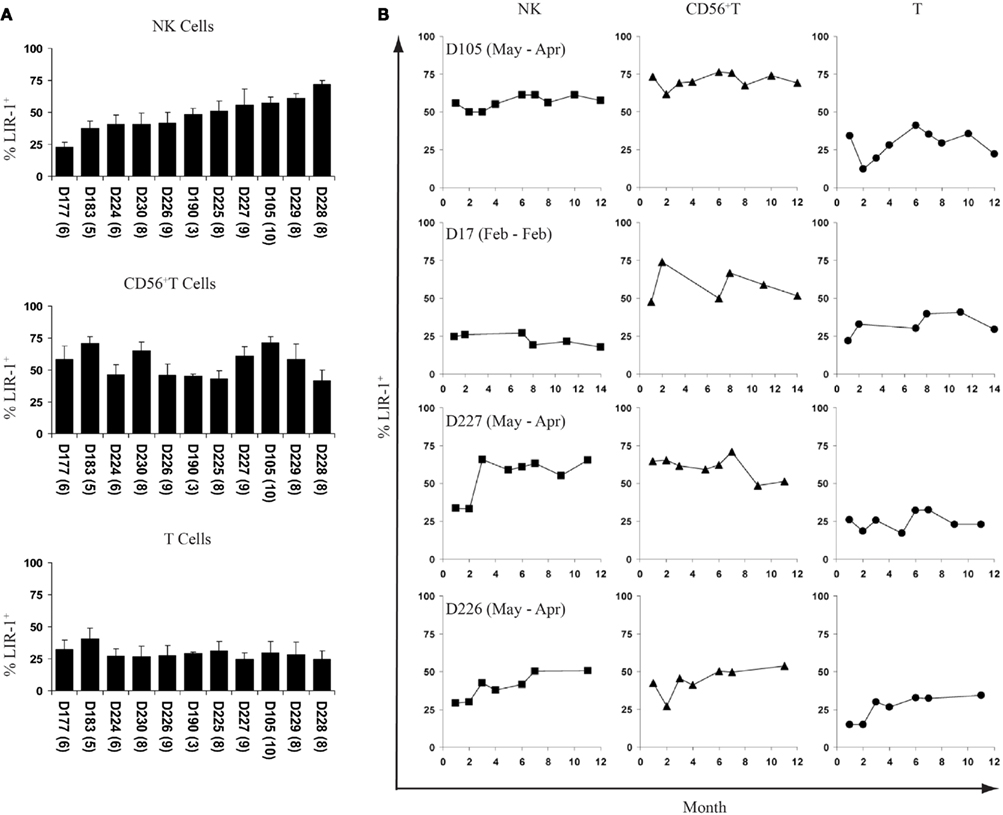
Figure 2. Fluctuations of LIR-1 expression over time. The frequency of LIR-1 expression in the three lymphocyte subsets were examined on ex vivo PBMC by flow cytometry as depicted in Figure 1 for the panel of donors. (A) The average frequency of LIR-1+ cells for each subset was calculated for each donor for all time points collected. Donors are in order of increasing NK cell LIR-1 expression from left to right. The number of bleeds for each donor is included in parenthesis underneath the x-axis labels. Error bars indicate the SD. (B) LIR-1 frequency in each cell subset with respect to the time of bleed is plotted for representative donors.
The range of the mean LIR-1 frequency in the CD56+ T cell subset was 41.9–71.2% and fluctuation in the LIR-1 expression on these cells was also evident in our panel of donors. However, unlike the NK cell changes we observed, where expression mostly increased, the population of LIR-1+CD56+ T cells expanded and contracted over time in a number of donors (Figure 2B). The observed changes in the LIR-1+CD56+ T cell population did not always parallel what was seen in the NK cells from the same donor, and there was no overall correlation between the frequency of LIR-1+CD56+ T cells and the LIR-1+ NK cells. The average frequency of LIR-1+CD56neg T cells was more similar between donors compared to other cell types (Figure 2A). The mean frequency of LIR-1 in this subset was 29.3% positive across the donor panel (range = 16.2% positive) and varied between samples in most donors but with no particular trends (Figure 2B).
HCMV and CD57 are Not Correlated with High LIR-1+ NK
We next wanted to determine what factors might influence or be correlated with LIR-1 expression on NK cells in vivo. In our data set, there was no obvious correlation with either sex or age of the donors and no donors reported any severe illnesses during the course of the study (Figure 3A and data not shown). Illnesses that were reported by donors during the time course included allergies and common cold symptoms. Importantly, no illnesses were reported by donors between bleeds where dramatic increases in the proportion of LIR-1+ NK cells were observed. However, the age range of our cohort allowed for the possibility that the donors might have acquired HCMV infection during the period of our study. Several studies have suggested HCMV infection can alter the NK repertoire (Guma et al., 2004) and LIR-1 profiles (Wagner et al., 2007). To address the possibility that HCMV exposure was responsible for the changes in LIR-1 expression we observed, serum samples were collected from the donors only at the conclusion of the time course and tested for the presence of HCMV antibody. Only 3 of 11 donors were found to be HCMV seropositive: D177, D183, and D227 (Figure 3A). While D227 was one of four donors who exhibited expansion in the LIR-1+ subset, none of the other donors with high levels of LIR-1 were found to be HCMV seropositive. Therefore HCMV exposure does not appear to be required to induce or maintain a high frequency of LIR-1+ NK cells. However, there are many other pathogens that might drive a selective expansion or general maturation of NK cells. Recently, work from Lanier and colleagues has implicated the CD57 epitope as a marker of more mature NK cells and these authors found a high frequency of LIR-1 expression within the CD57+ subset (Lopez-Verges et al., 2010). We performed a similar analysis to determine if there was a correlation between CD57 and LIR-1 expression in NK cells in our donors. Analysis of CD57 and LIR-1 expression on ex vivo NK cells from a number of our donors revealed that some donors present a high degree of co-expression, but this was not exclusive as a number of donors also possessed large single positive NK cell subsets (Figure 3B). Furthermore in a number of our donors, we found that the brightest LIR-1 expressing NK cells were in fact within the CD57neg subset. When comparing the expression of LIR-1 on CD57neg and CD57+ NK cell subsets between our donors, we observed a slightly lower mean LIR-1 frequency on the CD57 expressing cells (Figure 3C). Thus overall, we detected no significant correlation between the degree of CD57 expression and LIR-1 on NK cells in our donors. These results suggest the frequency of LIR-1 on NK is not linked to the overall state of maturation in NK cells.
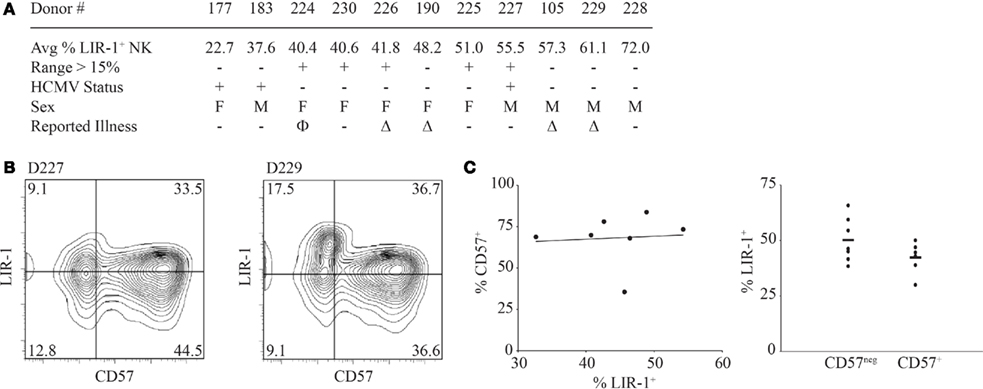
Figure 3. Natural killer cell LIR-1 expression, demographics, and maturation. (A) The sex and HCMV status is shown relative to the average percent of LIR-1+ NK cells for the same set of donors in Figure 2. The HCMV status was determined at the end of the study. The “+” indicates positive serology for HCMV (see Materials and Methods for details). All donors fall within the age range of 20–40 years old. For reported illnesses Δ represents common cold symptoms reported and Φ represents reported allergy symptoms at the time of a donation. (B) High LIR-1 expression does not correlate with high CD57 staining. Ex vivo PBL were examined for the co-expression of LIR-1 and CD57 on NK cells as described in the Section “Materials and Methods.” Representative profiles from two donors are shown. (C) The frequency of CD57 is plotted against the frequency of LIR-1 examined on donor NK cells. Each point represents an individual donor (left panel). The proportion of LIR-1 positive cells on CD57+ and CD57neg NK cells from the same donors is shown with the mean frequency indicated (right panel).
IL-15 and IL-2 Increase LIR-1+ CD56+T Cells in PBMC Cultures
In an attempt to understand what factors might alter LIR-1 expression profiles in vivo, we investigated the ability of cytokine stimulation to affect LIR-1 expression on peripheral blood lymphocytes ex vivo. We first examined the effects of the NK stimulatory cytokines IL-2, IL-15, and IL-12. Freshly isolated PBMC were cultured in the presence of each cytokine for 24 h, after which cell surface expression of LIR-1 on different cell types was measured by flow cytometry and compared to control cultures. In the majority of donors tested, these cytokines failed to significantly affect LIR-1 expression on NK cells despite their ability to induce the early activation marker CD69 (Figures 4A,B; Table 1). While the IL-12 induction of CD69 was modest on donor NK cells, we confirmed its ability to markedly increase expression of NKG2A, as has been previously reported (data not shown; Saez-Borderias et al., 2009). IL-15 stimulation increased NK cell LIR-1 expression slightly in most donors, but increases were found to reach statistical significance compared to control in only two of eight donors (Table 1). The CD56neg T cells were also unresponsive to cytokine stimulation in all donors tested in terms of affecting the expression of both LIR-1 and CD69 (Figure 4A, and data not shown). However, for the CD56+ T cell subset, both IL-15 and IL-2 were able to significantly increase the percentage of LIR-1+ cells (Figure 4A; Table 1). IL-15 stimulation significantly increased LIR-1 relative to control in all eight donors tested, and IL-2 in 5/8 donors (Table 1). Whether these responses represent LIR-1 induction, selective survival, or expansion of the LIR-1+ subset remains to be investigated. IL-12 culture appeared to slightly increase LIR-1 expression in this T cell subset, but only one donor exhibited a statistically significant increase in expression. We also tested the ability of IL-12 in combination with IL-18 to augment LIR-1 expression, but found no change relative to control despite inducing IFN-Γ expression by NK cells (data not shown). Alternatively, we tested the effect of the anti-inflammatory cytokine IL-10, but once again LIR-1 expression on primary NK cells was unaffected (data not shown). When cytokine cultures were extended to 72 and 120 h, LIR-1 expression on NK cells remained comparable with control (data not shown).
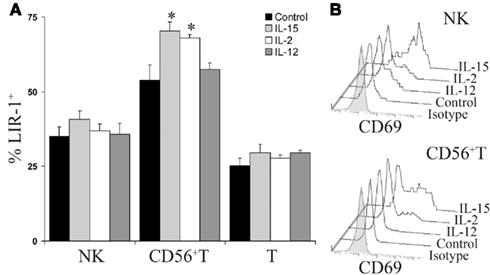
Figure 4. IL-15 and IL-2 increase LIR-1+ CD56+T cells in PBMC cultures. (A) Donor peripheral blood mononuclear cells were stimulated ex vivo with IL-15, IL-2, IL-12, or media alone for 24 h and the three lymphocyte subsets were then examined for LIR-1 expression by flow cytometry. Error bars indicate the SEM (n = 5). Representative results for D230 are shown (*P < 0.05). (B) CD69 expression profiles of NK cells and CD56 + T cells following 24 h cytokine stimulation. Representative results from an assay with D230 are shown. T cell histograms are excluded as CD69 expression was not induced over 24 h culture under all conditions.
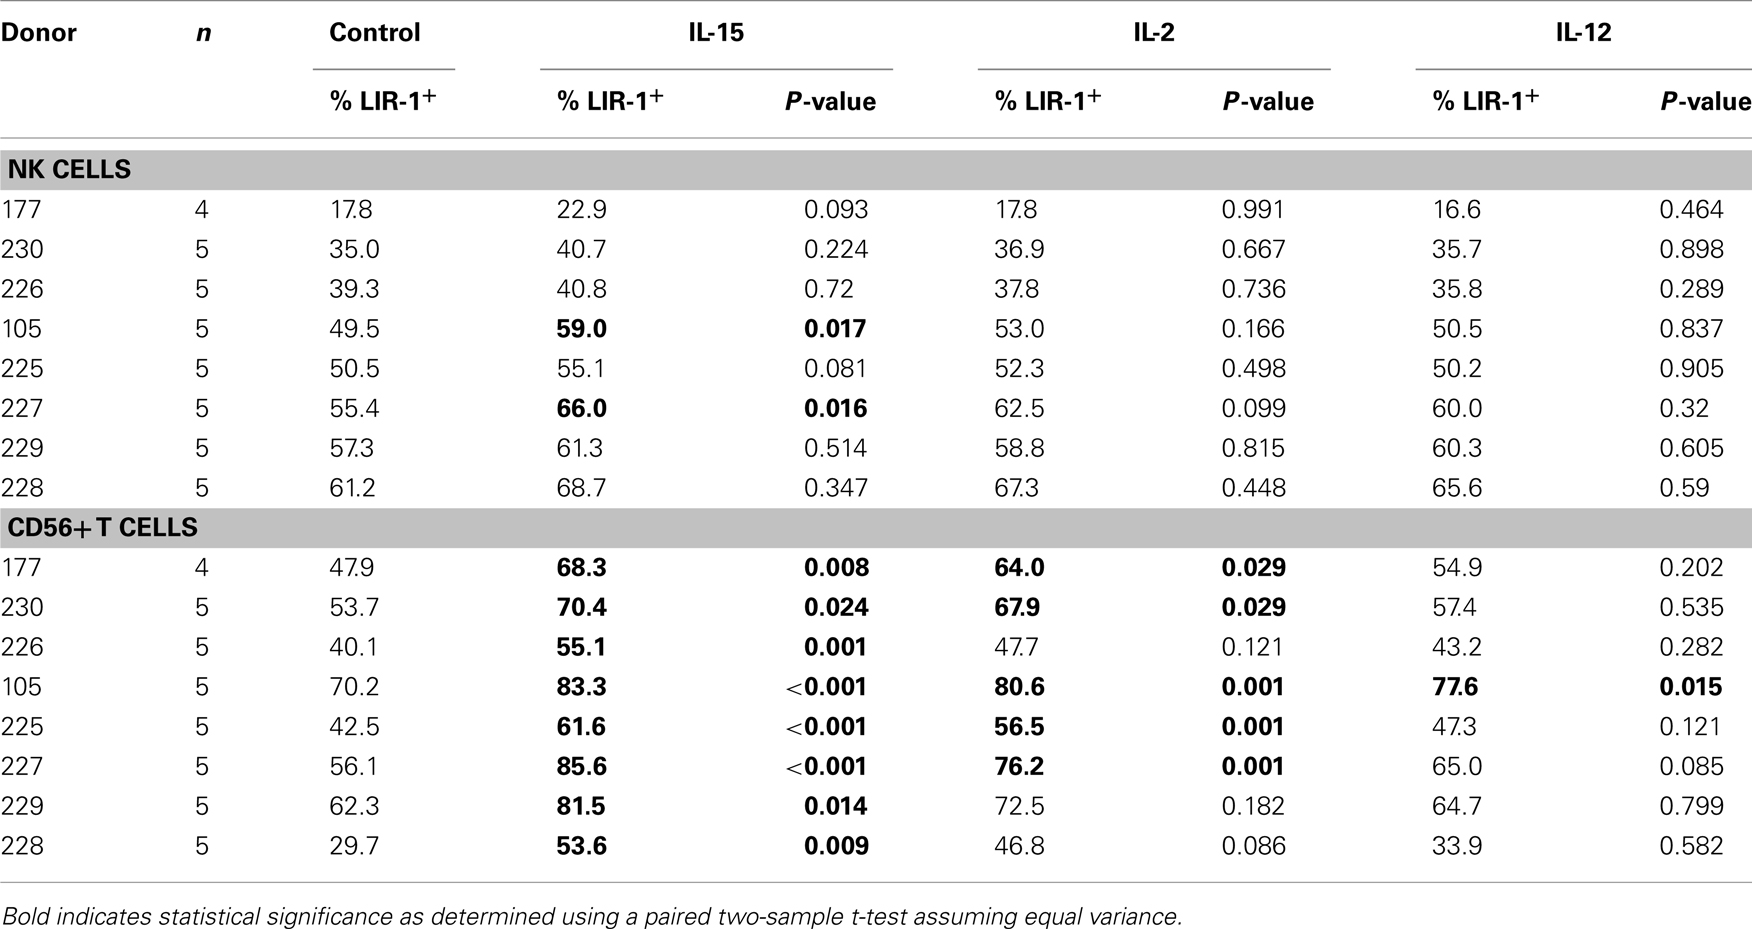
Table 1. The effect of cytokine stimulation on cell surface LIR-1 expression in lymphocyte subsets isolated from various healthy donors and cultured for 24 h.
IL-15 and IL-2 Increase LIR-1 on Purified NK Cells
In our donors we observed a slight trend toward increased surface expression of LIR-1, on NK cells treated with IL-15 in PBL cultures though largely not statistically significant (Table 1). To further investigate this we performed similar stimulations on purified NK cells. Freshly isolated NK cells were placed in culture in the presence of IL-15, IL-2, or media alone. Both cytokines were used at a high enough concentration to signal through the intermediate-affinity IL-2/15 receptor thereby overcoming the requirement for trans-presentation of IL-15 (Pillet et al., 2009). Following 72 h treatment of purified NK cells, the proportion of LIR-1+ cells was observed to significantly increase with both IL-15 and IL-2, and these increases correlated with increases in the fluorescence intensity of LIR-1 staining as well (Figures 5A,B). This increase in LIR-1+ cells was greater in stimulated purified NK cultures compared to that observed in PBL cultures. Consistent with our observations following PBL stimulation, the effect of IL-15 was greater than the effect of IL-2 on enhancing LIR-1 expression on purified NK cells. This effect of IL-15 treatment on purified NK cells was reproducible among different donors of varying LIR-1 phenotypes to different degrees and there was a significant increase in both the frequency of positive cells and the intensity of expression in the treated group collectively (Figure 5C). Altogether these data suggests that IL-15 and IL-2 stimulation increase the expression of LIR-1 on both NK cells and CD56+ T cells in vitro.
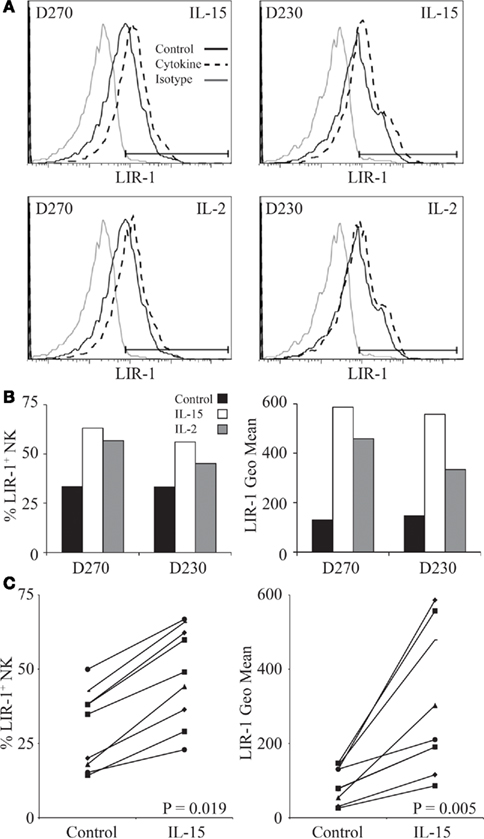
Figure 5. IL-15 and IL-2 increase LIR-1 expression on purified NK cells. (A) NK cells were isolated from donor PBMC and stimulated ex vivo with IL-15, IL-2, or media alone for 72 h and then examined for LIR-1 expression by flow cytometry. Representative histograms are shown for assays with D270 and D230. (B) The proportion of LIR-1+ NK cells and the geometric mean fluorescence intensity in each sample from the assays with D270 and D230 depicted in (A) with the background subtracted. (C) Changes in LIR-1 expression on NK cells stimulated with IL-15 are shown for various donors. The left panel shows changes in the frequency of LIR-1+ cells while the right hand panel shows the changes in the geometric MFI. The P-values are for the differences in the means between the stimulated and unstimulated samples.
We next examined whether activated NK cells would respond similarly to cytokine stimulation. Peripheral NK cell populations were isolated from whole blood with high purity and cultured with mitogen, irradiated feeder cells, and IL-2 to support cell growth and division. We investigated the ability of IL-15 and a number of other cytokines to increase LIR-1 expression in these activated populations. Following expansion, NK cells were removed from culture and rested out of cytokine for a period of 48 h. All cultured NK cells were then placed in a low dose of IL-2 (20 U/ml) alone (control) to maintain survival of cells in culture with or without additional cytokine and examined for LIR-1 expression on day 3. NK cells cultured in low dose IL-2 appeared to lose a bit of LIR-1 expression on a subset of cells, indicated by the appearance of biphasic staining on day 3 (Figure A1A in Appendix). However, the majority of cells in low dose IL-2 cultures maintained their level of expression comparable to day 0. When cultured in high dose IL-2 or IL-15, both culture conditions were able to increase LIR-1 expression relative to control (Figure A1A in Appendix). Similar to the results obtained from cultures of donor PBL, culture of IL-2 starved NK cells in the presence of IL-12, IL-18, IL-10, IFN-α, -β, -Γ for a period of 72 h were all unsuccessful in increasing the proportion of LIR-1+ cells beyond control (Figure A1A in Appendix). For comparison we included combined staining for KIR on expanded NK cells (KIR3DL1, KIR2DL1/S1) in cytokine cultures (Figure A1B in Appendix). Overall, the staining of KIR remained comparable between control treated and cytokine treated samples, although there did appear to be slight upregulation between control and samples treated with IL-15. Therefore IL-15 and IL-2 appear to be able to increase LIR-1 expression on activated NK cells as well.
We also assessed the ability of triggering different activating receptors, alone or in combination with IL-15, to modify LIR-1 expression on ex vivo NK cells. Peripheral blood NK cells were isolated and stimulated with plate-bound antibody directed against the activating receptors NKG2D and NKp46, separately and in combination, in the presence and absence of IL-15 for 72 h. As a positive control for activation, NK cell expression of CD69 was examined following culture (Figure A2A in Appendix). With antibody stimulation, the triggering of both NKG2D and NKp46 together caused the greatest induction of CD69 over unstimulated or singly triggered NK cells, though the highest level of activation was still observed following IL-15 treatment. Antibody stimulation in the presence of IL-15 was not able to increase CD69 expression beyond that of IL-15 treatment alone in this assay (data not shown). When examining LIR-1 expression following culture, consistent with previous results IL-15 was able to increase the proportion of LIR-1+ cells, and this increase was not dramatically enhanced with the additional triggering of NKG2D and/or NKp46 (Figure A2B in Appendix). The triggering of these activating receptors in the absence of IL-15 was also unable to induce LIR-1 expression on NK cells beyond control.
The observed shifts in profiles we detected could be due to either the upregulation of LIR-1 expression or selective expansion of LIR-1+ cells. To examine if increases in LIR-1 were associated with cell division, cells were labeled with Cell Trace proliferation dye on day 0 without starvation and examined on day 3 for expression of LIR-1 (Figure 6A) and dilution of the dye (Figure 6B). By day 3, we found that control (low dose IL-2) cells did not dilute their cytoplasmic dye indicating that cell division had not occurred over the 72-h period in these cells (Figure 6B). Under these conditions, IL-15 treated cells also demonstrated very little cell division over the same time period, although greater Cell Trace dilution was evident relative to control. When IL-15 treated NK cells were divided into Cell Trace bright and dim populations and LIR-1 expression examined, we observed that the LIR-1 levels were comparable between the two populations (Figure 6C). In fact, between the two populations, the cells that possessed the highest level of LIR-1 expression were cells that had not diluted their Cell Trace over the 72-h period, suggesting selective expansion of LIR-1+ NK cells in IL-15 culture is not the main mechanism responsible for the observed increase in LIR-1 frequency.
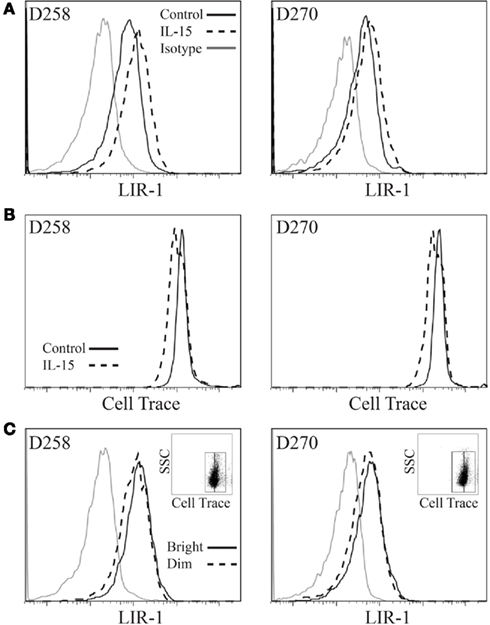
Figure 6. Leukocyte Ig-like receptor 1bright NK cells do not proliferate preferentially in vitro. Expanded NK cell populations were labeled with Cell Trace Violet proliferation dye and then placed in culture in the presence of IL-15 plus low dose IL-2 or low dose IL-2 alone (control) for 72 h and examined by flow cytometry. (A) LIR-1 expression profiles. (B) Cell Trace signal for the same samples as in (A). (C) LIR-1 expression profiles for the IL-15 stimulated NK cell populations depicted in (B) divided into Cell Trace Violet bright and dim populations as shown in insert panel. Representative results from experiments with D258 and D270 are shown (n ≥ 3).
We observed that CD56bright NK cells typically displayed lower to dim expression of LIR-1 compared to CD56dim NK cells ex vivo. However, following cytokine culture we were unable to differentiate the two NK cell populations given the fact that with activation, CD56bright NK decrease CD56 expression and CD56dim NK gain expression. To determine whether the two NK cell subsets respond differently to cytokine stimulation, we sorted CD56dim and CD56bright NK (Figure 7A) and cultured them in the presence of IL-2 for 5 days. Following culture we observed that the CD56bright population had increased LIR-1 expression and acquired the profile of the CD56dim subset (Figures 7B,C).
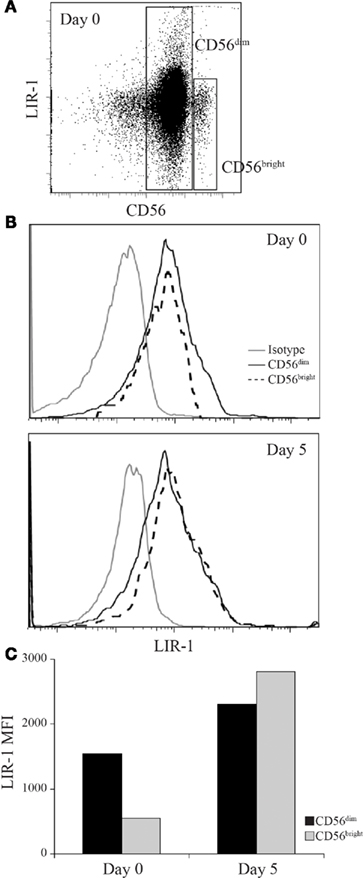
Figure 7. Leukocyte Ig-like receptor 1 expression can be induced on CD56bright NK to match the profile of CD56dim NK cells. D231 NK cells were sorted on day 0 into CD56dim and CD56bright populations and cultured in IL-2 for 5 days. NK cells were provided with fresh IL-2 on day 3. (A) Peripheral blood NK cells were isolated from D231 and examined for CD56 and LIR-1 expression. (B) LIR-1 expression profiles for D231 NK cells as gated in (A) are shown in the upper panel and NK cell LIR-1 expression on both subsets on day 5 are shown in the lower panel. (C) Mean fluorescence intensity of LIR-1 staining from the NK cells shown in (B). Data is representative of two separate experiments with different donors.
IL-2 Regulation of the LIR-1 Promoters
The simplest mechanism for IL-2 or IL-15 to regulate LIR-1 expression is through regulation of LIR-1 transcription. IL-2 and IL-15 signal through the same signaling chains on NK cells leading to activation of the transcription factor STAT5. Therefore, we first examined if the loss or induction of LIR-1 expression was correlated with the degree of phosphorylated STAT5 in the cells. In vitro expanded NK cell populations were washed with media and plated in the absence of IL-2 for 48 h leading to a decrease in LIR-1 expression (Figure 8A left panel). As expected, those cells cultured in 200 U/ml IL-2 for 48 h maintained a high level of phospho-STAT5. However, NK cells cultured in the absence of IL-2 exhibited a decrease in phopho-STAT5 levels which coincided with the observed decrease in LIR-1 expression (Figure 8A right panel). Notably, the pSTAT5 levels did not return to baseline suggesting pSTAT5 is maintained in the cells for some time following the cessation of receptor signaling. We then examined the amount of LIR-1 message in ex vivo NK cells stimulated with IL-15 by qPCR for the amount of total transcript, as well as the longer lymphocyte specific form of the transcript. Total RNA was extracted from ex vivo NK cells isolated from D258 and D270, cultured in the presence or absence (control) of IL-15 for 72 h (Figure 8B), and used for cDNA synthesis. Interestingly, despite observing increased LIR-1 surface expression on the stimulated NK cells, we were unable to detect a correlation with increased levels of transcript (Figure 8C). When quantifying total LIR-1 transcript from these donors, we found that levels were slightly decreased in IL-15 treated NK cells compared to control cultured cells. These experiments were performed with a number of other donors and though we did detect increases in total LIR-1 transcript with cytokine stimulation with some, this was not consistently observed. We did note a trend toward a greater loss of signal from the distal promoter in many of the repetitions. However, the effects on transcription of LIR-1 in these types of assays may be masked by overall effects of the cytokines on transcription in general making the normalization difficult as RPL24, actin and GAPDH all exhibited some increase in absolute amounts (data not shown). Therefore as an alternative approach, we looked directly at the ability of cytokine signaling to affect transcription from the two different promoters using luciferase assays (Figure 8D). For these experiments we exploited the IL-2-independent NK-like cell line YTS that is able to respond to exogenous IL-2. We observed a dramatic decrease in the activity of the distal promoter when the cells were stimulated with IL-2, while the activity of the proximal promoter was increased (Figure 8E). The data presented is representative of the results from two out of three independent experiments, with the third repeat yielding only a slight change in activity. The results suggest that IL-2 stimulation is able to enhance expression from the proximal LIR-1 promoter.
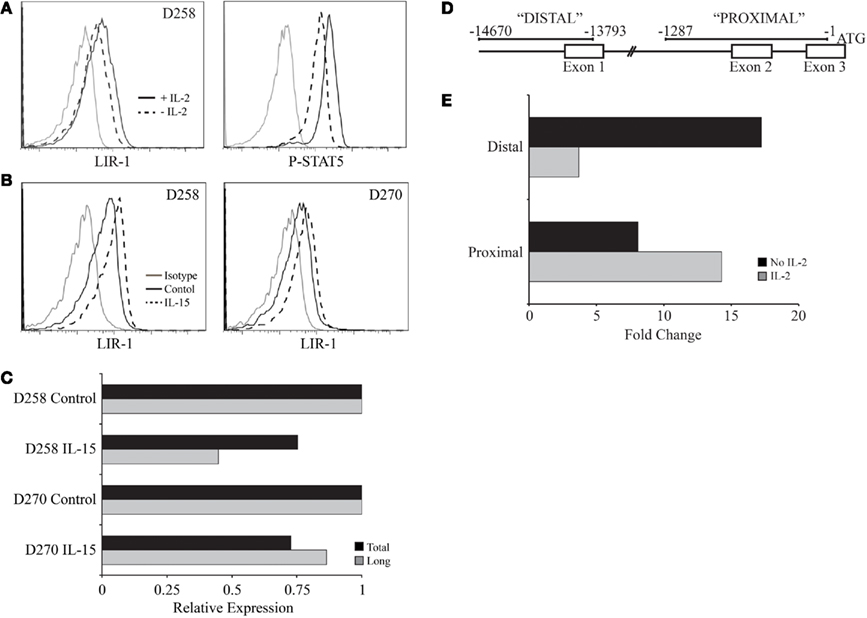
Figure 8. IL-2 regulation of pSTAT5 and LIR-1 promoter activity. (A) Activated primary NK cell populations were removed from culture, washed with media, and re-plated in the presence or absence of IL-2 for 48 h. LIR-1 expression and phospho-STAT5 levels were examined following culture by flow cytometry. Representative results for D258 are shown (n ≥ 3). (B) Ex vivo NK cells were cultured in the presence or absence of IL-15 for RNA extraction and qPCR analysis. (C) Representative results from quantitative PCR analysis of the total LIR-1 transcript and the long LIR-1 transcript present in NK cells depicted in (B). Values are normalized to the RPL24 transcript and presented relative to control treated NK cells for each donor. (D) Illustration of the regions used for measuring promoter activity. (E) Differential effect of IL-2 on the activity of the two LIR-1 promoter regions. The luciferase activity was measured in YTS cells cultured in the presence or absence of IL-2 for 38 h. Data is representative of two out of three separate assays.
Discussion
We have previously reported that the expression patterns of LIR-1 on NK cells in different individuals is linked to genetic variation within the LILRB1 gene (Davidson et al., 2010). In the present study we investigated the stability of differential expression of LIR-1 on NK cells between individuals and we observed marked increases in the NK cell LIR-1 frequency over the course of just 1 year in several individuals. Increases in LIR-1+ NK cells have been observed during virus infection (O’Connor et al., 2007; Wagner et al., 2007), as well the proportion of LIR-1+ NK cells was reported to be larger in old aged individuals compared to newborns and middle aged donors (Le Garff-Tavernier et al., 2010). However this is the first observation that this subset of NK cells can increase in the periphery of “healthy” individuals during short term monitoring. There are at least three plausible mechanisms that could lead to differences in the LIR-1 profile on NK cells within an individual: (1) induction on mature or developing NK cells by environmental stimuli such as cytokines; (2) induction during stimulation by antigen-presenting cells or target cells; (3) expansion of LIR-1+ cells following stimulation. Other NK cell receptors can be modified in vitro by cytokines, such as the transient expression of CD94/NKG2A in response to IL-12 (Saez-Borderias et al., 2009), and changes have been observed in vivo such as NKG2C in HCMV carriers (Guma et al., 2004). Induction of LIR-1 in human NK cells has been shown in response to interactions with HLA-G in vitro (LeMaoult et al., 2005), but the healthy and non-pregnant status of our donors make it unlikely that contact with HLA-G is responsible for the changes we observed. The relationship of LIR-1 expression with chronic infection is perhaps the most interesting. Increases in the fraction of NK cells expressing LIR-1 have been reported in long-term non-progressing HIV patients (O’Connor et al., 2007) and transiently in post-transplant patients prior to the development of CMV disease (Wagner et al., 2007). These differences were remarkably detected in comparison with healthy subjects despite the huge variation one expects the healthy population to exhibit. Although our sample size is relatively small, we did not observe any correlation in those donors exhibiting increases in LIR-1 with a known serious infection or HCMV status. In fact, two out of the three HCMV+ individuals were the lowest for LIR-1 on NK cells. A larger survey that includes HCMV status at the outset and end, and including greater numbers, might reveal a long-term influence of HCMV on LIR-1 expression.
Influences of infection on the NK repertoire might be due to either alterations in the cytokine milieu or perhaps the selective expansion of particular NK subsets that are involved in the response to a pathogen. MCMV infection drives expansion of mouse Ly49H+ NK cells that remain marked phenotypically as more mature and remain in circulation for a long time (Sun et al., 2009). To date there is no evidence selective expansions occur in humans, but an intriguing possibility is that the changes we observed in the LIR-1 profiles might be due to LIR-1 being coincidently expressed in responding NK cells. If selective expansions of NK cell populations do occur in humans, it would likely affect the KIR repertoire as well, however, these changes might not have been detected to date in the types of studies that have examined KIR stability within healthy donors, as those analyses, similar to the one presented here for LIR-1, only profiled five donors (Shilling et al., 2002) and examined just two time points (Pascal et al., 2004). It has been very recently reported that NK cells in the periphery which express the T cell maturation marker CD57, represent a highly mature, and possibly terminally differentiated subset in humans (Lopez-Verges et al., 2010). These CD57+ NK cells exhibited a more mature phenotype, were present at higher frequency with increasing age, and possessed a lower proliferative capacity. Interestingly, LIR-1 was also shown to be highly co-expressed with CD57 and the expression of CD57 could be induced on CD57neg NK cells with IL-2 treatment. In our donors a higher frequency of “mature” NK cells is not correlated with more LIR-1+ NK cells as we did not observe a strong correlation of high LIR-1 with high CD57 in our panel of donors. However, it should be noted that our donors tended to have relatively high levels of CD57. In addition to CD57 expression, the down-regulation of the TNF receptor family member CD27 has been implicated in the late stage maturation of human NK cells, as the majority of CD27neg NK cells present in peripheral blood are CD56dim, and the small subset of CD27+ NK cells are primarily found within the CD56bright population (Vossen et al., 2008). It has been recently reported that LIR-1 is preferentially expressed on the CD27neg subset of NK cells, and that only a very small proportion of peripheral blood NK cells co-express these two receptors (Romo et al., 2011), further supporting the possibility that LIR-1 is more highly expressed on the subset of “mature” NK cells that have been suggested to accumulate over time.
The fluctuations we observed in the amount of LIR-1+CD56+ T cells in vivo are likely correlated with ongoing immune responses as several studies have shown increases of LIR-1 on antigen specific T cells with various infections (Merlo et al., 2001; Anfossi et al., 2004; Ince et al., 2004; Poon et al., 2005). We observed that the frequency of LIR-1 expression was significantly increased for CD56+ T cells in response to IL-15 and IL-2. This increase could represent selective survival, proliferation of LIR-1+ cells, or specific induction on LIR-1neg cells. CD56+ T cells are reported to represent the circulating effector cytotoxic T lymphocyte pool in the periphery (Pittet et al., 2000), but the role of LIR-1 on these cells is not fully understood. Interestingly, activation-induced expression of CD56 on peripheral blood T cells is associated with the acquired ability to lyse targets in an MHC-unrestricted manner (Kelly-Rogers et al., 2006). Given this profile and the ability of LIR-1 to inhibit T cell functions (Saverino et al., 2000), it is fitting that this subset of T cells would be able to increase their LIR-1 frequency in response to cytokine stimulus. Increased expression of the inhibitory LIR-1 on CD56+ T cells in the periphery would provide an additional level of regulation during an immune response. It is also interesting to note that in the few donors we assessed, the vast majority of CD56+ T cells in the periphery were CD8+ (data not shown) and therefore LIR-1 on these cells would also compete for binding to the same region of MHC-I (Shiroishi et al., 2003). In the future it may be interesting to define the signaling pathways required to induce LIR-1 expression on CD8+ T cells in comparison with NK cells.
Of the cytokines we examined, only IL-2 and IL-15 were able to influence LIR-1 expression. IL-2 and IL-15 have recently been demonstrated to be able to modify the cell surface repertoire of mature NK cells cultured in vitro (Huenecke et al., 2010; de Rham et al., 2007). In these studies, the NK cell receptors examined included KIR, NCR, CD16, NKG2D, and NKG2A and all were found to be modified by cytokine culture. We have demonstrated that similar to these receptors, the expression of LIR-1 is also enhanced on ex vivo NK cells cultured in the presence of IL-2 and IL-15. We found that, despite signaling through the same cell surface receptor complex, IL-15 was able to increase the proportion of LIR-1+ cells in culture more effectively than IL-2. This is in line with the report that IL-15 is a more potent cytokine on human NK cells compared to IL-2 (Pillet et al., 2009). When we examined the proliferation of NK cells cultured in the presence of IL-15, we observed that cell division was minimal over 72 h cultures. Furthermore, when we examined the expression of LIR-1 on cells that had diluted Cell Trace proliferation dye compared to those that did not, we found that the expression of LIR-1 was comparable suggesting that selective expansion of LIR-1+ cells was not the main mechanism of increase. Instead, we found that the CD56bright subset of NK cells, which proliferate vigorously in response to IL-2 induce LIR-1, similar to the report that they acquire KIRs as they mature (Romagnani et al., 2007).
Differences in the surface expression of NK cell LIR-1 between donors is correlated with differences in the amount of LIR-1 message (Davidson et al., 2010), although we could not detect differences in LIR-1 message following cytokine treatment by qPCR. Our results suggest changes in LIR-1 surface phenotype on NK cells within donors may be associated with a coordinated switch in promoter choice, allowing for enhanced expression driven by the proximal LIR-1 promoter and suppressed expression from the distal. Analysis of the proximal promoter region has identified a putative STAT5 binding site, which would allow for enhanced expression of the shorter LIR-1 transcript in response to IL-15 and IL-2. It remains also possible that additional mechanisms influence cell surface expression of LIR-1 such as post-translational modifications, trafficking, or regulation by microRNA.
We have previously established that heritable features of the LIR-1 gene influence expression on NK cells (Davidson et al., 2010), and have now demonstrated that this level of expression can be further enhanced in vitro by cytokine stimulation, and that there are detectable changes in some cases on NK cells in vivo. At this stage it is not clear if exposure to IL-15 is linked to the changes we observed in the frequency of circulating LIR-1+ NK cells. Regardless, our studies demonstrate that this cytokine can transiently influence the amount of LIR-1 expressed by NK cells, and might therefore increase NK cell sensitivity to MHC-I ligands in various scenarios. Therefore, while an individual’s genotype may initially direct a certain LIR-1 phenotype, there may be additional levels of regulation involved, allowing for expression to be enhanced, perhaps temporarily, under specific environmental conditions. The concept of combined genetic and environmental regulation of expression of NK cell receptors has previously been proposed for KIR3DL1, in which multiple overlapping transcription factor binding sites were identified in the promoter allowing for the maintenance of expression in diverse cellular environments (Presnell et al., 2006). Differences in LIR-1 on NK cells may have important consequences to the host, as having too many LIR-1+ NK cells would increase vulnerability to immune evasion by pathogens such as HCMV. Furthermore, higher levels of inhibitory receptor per cell might raise the threshold for activation too high, while lower levels might be associated with autoimmune type pathologies, such as those already noted for rheumatoid arthritis (Kuroki et al., 2005). Therefore, there is a need to differentially regulate the expression of this receptor in a variety of cell types and it will be useful to gain a more complete understanding of the tight regulation of this receptor.
Conflict of Interest Statement
The authors declare that the research was conducted in the absence of any commercial or financial relationships that could be construed as a potential conflict of interest.
Acknowledgments
The authors would like to thank all donors who participated in the study, Melanie Abel for assistance with phlebotomy, Deanna Hockley for performing some preliminary experiments, Dr. Daniel McVicar for comments on the manuscript, and members of the Burshtyn and Stafford labs for their input. This work was supported by awards from the Canadian Institutes of Health Research and the Alberta Heritage Foundation for Medical Research.
References
Anfossi, N., Doisne, J. M., Peyrat, M. A., Ugolini, S., Bonnaud, O., Bossy, D., Pitard, V., Merville, P., Moreau, J. F., Delfraissy, J. F., Dechanet-Merville, J., Bonneville, M., Venet, A., and Vivier, E. (2004). Coordinated expression of Ig-like inhibitory MHC class I receptors and acquisition of cytotoxic function in human CD8+ T cells. J. Immunol. 173, 7223–7229.
Apps, R., Gardner, L., and Moffett, A. (2008). A critical look at HLA-G. Trends Immunol. 29, 313–321.
Apps, R., Gardner, L., Sharkey, A. M., Holmes, N., and Moffett, A. (2007). A homodimeric complex of HLA-G on normal trophoblast cells modulates antigen-presenting cells via LILRB1. Eur. J. Immunol. 37, 1924–1937.
Bellon, T., Kitzig, F., Sayos, J., and Lopez-Botet, M. (2002). Mutational analysis of immunoreceptor tyrosine-based inhibition motifs of the Ig-like transcript 2 (CD85j) leukocyte receptor. J. Immunol. 168, 3351–3359.
Borges, L., Hsu, M. L., Fanger, N., Kubin, M., and Cosman, D. (1997). A family of human lymphoid and myeloid Ig-like receptors, some of which bind to MHC class I molecules. J. Immunol. 159, 5192–5196.
Brown, D., Trowsdale, J., and Allen, R. (2004). The LILR family: modulators of innate and adaptive immune pathways in health and disease. Tissue Antigens 64, 215–225.
Chapman, T. L., Heikema, A. P., West, A. P. Jr., and Bjorkman, P. J. (2000). Crystal structure and ligand binding properties of the D1D2 region of the inhibitory receptor LIR-1 (ILT2). Immunity 13, 727–736.
Chapman, T. L., Heikeman, A. P., and Bjorkman, P. J. (1999). The inhibitory receptor LIR-1 uses a common binding interaction to recognize class I MHC molecules and the viral homolog UL18. Immunity 11, 603–613.
Colonna, M., Nakajima, H., Navarro, F., and Lopez-Botet, M. (1999). A novel family of Ig-like receptors for HLA class I molecules that modulate function of lymphoid and myeloid cells. J. Leukoc. Biol. 66, 375–381.
Colonna, M., Navarro, F., Bellon, T., Llano, M., Garcia, P., Samaridis, J., Angman, L., Cella, M., and Lopez-Botet, M. (1997). A common inhibitory receptor for major histocompatibility complex class I molecules on human lymphoid and myelomonocytic cells. J. Exp. Med. 186, 1809–1818.
Cosman, D., Fanger, N., Borges, L., Kubin, M., Chin, W., Peterson, L., and Hsu, M. L. (1997). A novel immunoglobulin superfamily receptor for cellular and viral MHC class I molecules. Immunity 7, 273–282.
Davidson, C. L., Li, N. L., and Burshtyn, D. N. (2010). LILRB1 polymorphism and surface phenotypes of natural killer cells. Hum. Immunol. 71, 942–949.
de Rham, C., Ferrari-Lacraz, S., Jendly, S., Schneiter, G., Dayer, J. M., and Villard, J. (2007). The proinflammatory cytokines IL-2, IL-15 and IL-21 modulate the repertoire of mature human natural killer cell receptors. Arthritis Res. Ther. 9, R125.
Dietrich, J., Cella, M., and Colonna, M. (2001). Ig-like transcript 2 (ILT2)/leukocyte Ig-like receptor 1 (LIR1) inhibits TCR signaling and actin cytoskeleton reorganization. J. Immunol. 166, 2514–2521.
Fanger, N. A., Cosman, D., Peterson, L., Braddy, S. C., Maliszewski, C. R., and Borges, L. (1998). The MHC class I binding proteins LIR-1 and LIR-2 inhibit Fc receptor-mediated signaling in monocytes. Eur. J. Immunol. 28, 3423–3434.
Guma, M., Angulo, A., Vilches, C., Gomez-Lozano, N., Malats, N., and Lopez-Botet, M. (2004). Imprint of human cytomegalovirus infection on the NK cell receptor repertoire. Blood 104, 3664–3671.
Huenecke, S., Zimmermann, S. Y., Kloess, S., Esser, R., Brinkmann, A., Tramsen, L., Koenig, M., Erben, S., Seidl, C., Tonn, T., Eggert, A., Schramm, A., Bader, P., Klingebiel, T., Lehrnbecher, T., Passweg, J. R., Soerensen, J., Schwabe, D., and Koehl, U. (2010). IL-2-driven regulation of NK cell receptors with regard to the distribution of CD16+ and CD16- subpopulations and in vivo influence after haploidentical NK cell infusion. J. Immunother. 33, 200–210.
Ince, M. N., Harnisch, B., Xu, Z., Lee, S. K., Lange, C., Moretta, L., Lederman, M., and Lieberman, J. (2004). Increased expression of the natural killer cell inhibitory receptor CD85j/ILT2 on antigen-specific effector CD8 T cells and its impact on CD8 T-cell function. Immunology 112, 531–542.
Kelly-Rogers, J., Madrigal-Estebas, L., O’connor, T., and Doherty, D. G. (2006). Activation-induced expression of CD56 by T cells is associated with a reprogramming of cytolytic activity and cytokine secretion profile in vitro. Hum. Immunol. 67, 863–873.
Kirwan, S. E., and Burshtyn, D. N. (2005). Killer cell Ig-like receptor-dependent signaling by Ig-like transcript 2 (ILT2/CD85j/LILRB1/LIR-1). J. Immunol. 175, 5006–5015.
Kuroki, K., Tsuchiya, N., Shiroishi, M., Rasubala, L., Yamashita, Y., Matsuta, K., Fukazawa, T., Kusaoi, M., Murakami, Y., Takiguchi, M., Juji, T., Hashimoto, H., Kohda, D., Maenaka, K., and Tokunaga, K. (2005). Extensive polymorphisms of LILRB1 (ILT2, LIR1) and their association with HLA-DRB1 shared epitope negative rheumatoid arthritis. Hum. Mol. Genet. 14, 2469–2480.
Lamar, D. L., Weyand, C. M., and Goronzy, J. J. (2010). Promoter choice and translational repression determine cell type-specific cell surface density of the inhibitory receptor CD85j expressed on different hematopoietic lineages. Blood 115, 3278–3286.
Le Garff-Tavernier, M., Beziat, V., Decocq, J., Siguret, V., Gandjbakhch, F., Pautas, E., Debre, P., Merle-Beral, H., and Vieillard, V. (2010). Human NK cells displaymajor phenotypic and functional changes over the life span. Aging Cell 9, 527–535.
LeMaoult, J., Zafaranloo, K., Le Danff, C., and Carosella, E. D. (2005). HLA-G up-regulates ILT2, ILT3, ILT4, and KIR2DL4 in antigen presenting cells, NK cells, and T cells. FASEB J. 19, 662–664.
Li, H., Pascal, V., Martin, M. P., Carrington, M., and Anderson, S. K. (2008). Genetic control of variegated KIR gene expression: polymorphisms of the bi-directional KIR3DL1 promoter are associated with distinct frequencies of gene expression. PLoS Genet. 4, e1000254. doi: 10.1371/journal.pgen.1000254
Lopez-Verges, S., Milush, J. M., Pandey, S., York, V. A., Arakawa-Hoyt, J., Pircher, H., Norris, P. J., Nixon, D. F., and Lanier, L. L. (2010). CD57 defines a functionally distinct population of mature NK cells in the human CD56dimCD16+ NK cell subset. Blood 116, 3865–3874.
Merlo, A., Saverino, D., Tenca, C., Grossi, C. E., Bruno, S., and Ciccone, E. (2001). CD85/LIR-1/ILT2 and CD152 (cytotoxic T lymphocyte antigen 4) inhibitory molecules down-regulate the cytolytic activity of human CD4+ T-cell clones specific for Mycobacterium tuberculosis. Infect. Immun. 69, 6022–6029.
Merlo, A., Tenca, C., Fais, F., Battini, L., Ciccone, E., Grossi, C. E., and Saverino, D. (2005). Inhibitory receptors CD85j, LAIR-1, and CD152 down-regulate immunoglobulin and cytokine production by human B lymphocytes. Clin. Diagn. Lab. Immunol. 12, 705–712.
Morel, E., and Bellon, T. (2008). HLA class I molecules regulate IFN-gamma production induced in NK cells by target cells, viral products, or immature dendritic cells through the inhibitory receptor ILT2/CD85j. J. Immunol. 181, 2368–2381.
Nakayama, M., Underhill, D. M., Petersen, T. W., Li, B., Kitamura, T., Takai, T., and Aderem, A. (2007). Paired Ig-like receptors bind to bacteria and shape TLR-mediated cytokine production. J. Immunol. 178, 4250–4259.
O’Connor, G. M., Holmes, A., Mulcahy, F., and Gardiner, C. M. (2007). Natural killer cells from long-term non-progressor HIV patients are characterized by altered phenotype and function. Clin. Immunol. 124, 277–283.
Pascal, V., Schleinitz, N., Brunet, C., Ravet, S., Bonnet, E., Lafarge, X., Touinssi, M., Reviron, D., Viallard, J. F., Moreau, J. F., Dechanet-Merville, J., Blanco, P., Harle, J. R., Sampol, J., Vivier, E., Dignat-George, F., and Paul, P. (2004). Comparative analysis of NK cell subset distribution in normal and lymphoproliferative disease of granular lymphocyte conditions. Eur. J. Immunol. 34, 2930–2940.
Pillet, A. H., Bugault, F., Theze, J., Chakrabarti, L. A., and Rose, T. (2009). A programmed switch from IL-15- to IL-2-dependent activation in human NK cells. J. Immunol. 182, 6267–6277.
Pittet, M. J., Speiser, D. E., Valmori, D., Cerottini, J. C., and Romero, P. (2000). Cutting edge: cytolytic effector function in human circulating CD8+ T cells closely correlates with CD56 surface expression. J. Immunol. 164, 1148–1152.
Poon, K., Montamat-Sicotte, D., Cumberbatch, N., Mcmichael, A. J., and Callan, M. F. (2005). Expression of leukocyte immunoglobulin-like receptors and natural killer receptors on virus-specific CD8+ T cells during the evolution of Epstein-Barr virus-specific immune responses in vivo. Viral Immunol. 18, 513–522.
Presnell, S. R., Zhang, L., Ramilo, C. A., Chan, H. W., and Lutz, C. T. (2006). Functional redundancy of transcription factor-binding sites in the killer cell Ig-like receptor (KIR) gene promoter. Int. Immunol. 18, 1221–1232.
Prod’homme, V., Griffin, C., Aicheler, R. J., Wang, E. C., Mcsharry, B. P., Rickards, C. R., Stanton, R. J., Borysiewicz, L. K., Lopez-Botet, M., Wilkinson, G. W., and Tomasec, P. (2007). The human cytomegalovirus MHC class I homolog UL18 inhibits LIR-1+ but activates LIR-1- NK cells. J. Immunol. 178, 4473–4481.
Romagnani, C., Juelke, K., Falco, M., Morandi, B., D’agostino, A., Costa, R., Ratto, G., Forte, G., Carrega, P., Lui, G., Conte, R., Strowig, T., Moretta, A., Munz, C., Thiel, A., Moretta, L., and Ferlazzo, G. (2007). CD56brightCD16- killer Ig-like receptor- NK cells display longer telomeres and acquire features of CD56dim NK cells upon activation. J. Immunol. 178, 4947–4955.
Romo, N., Fitó, M., Gumá, M., Sala, J., García, C., Ramos, R., Muntasell, A., Masiá, R., Bruguera, J., Subirana, I., Vila, J., de Groot, E., Elosua, R., Marrugat, J., and López-Botet, M. (2011). Association of Atherosclerosis with expression of the LILRB1 receptor by human NK and T-cells supports the infectious burden hypothesis. Arterioscler. Thromb. Vasc. Biol. 31, 2314–2321.
Saez-Borderias, A., Romo, N., Magri, G., Guma, M., Angulo, A., and Lopez-Botet, M. (2009). IL-12-dependent inducible expression of the CD94/NKG2A inhibitory receptor regulates CD94/NKG2C+ NK cell function. J. Immunol. 182, 829–836.
Samaridis, J., and Colonna, M. (1997). Cloning of novel immunoglobulin superfamily receptors expressed on human myeloid and lymphoid cells: structural evidence for new stimulatory and inhibitory pathways. Eur. J. Immunol. 27, 660–665.
Saverino, D., Fabbi, M., Ghiotto, F., Merlo, A., Bruno, S., Zarcone, D., Tenca, C., Tiso, M., Santoro, G., Anastasi, G., Cosman, D., Grossi, C. E., and Ciccone, E. (2000). The CD85/LIR-1/ILT2 inhibitory receptor is expressed by all human T lymphocytes and down-regulates their functions. J. Immunol. 165, 3742–3755.
Saverino, D., Merlo, A., Bruno, S., Pistoia, V., Grossi, C. E., and Ciccone, E. (2002). Dual effect of CD85/leukocyte Ig-like receptor-1/Ig-like transcript 2 and CD152 (CTLA-4) on cytokine production by antigen-stimulated human T cells. J. Immunol. 168, 207–215.
Shilling, H. G., Young, N., Guethlein, L. A., Cheng, N. W., Gardiner, C. M., Tyan, D., and Parham, P. (2002). Genetic control of human NK cell repertoire. J. Immunol. 169, 239–247.
Shiroishi, M., Tsumoto, K., Amano, K., Shirakihara, Y., Colonna, M., Braud, V. M., Allan, D. S., Makadzange, A., Rowland-Jones, S., Willcox, B., Jones, E. Y., Van Der Merwe, P. A., Kumagai, I., and Maenaka, K. (2003). Human inhibitory receptors Ig-like transcript 2 (ILT2) and ILT4 compete with CD8 for MHC class I binding and bind preferentially to HLA-G. Proc. Natl. Acad. Sci. U.S.A. 100, 8856–8861.
Sun, J. C., Beilke, J. N., and Lanier, L. L. (2009). Adaptive immune features of natural killer cells. Nature 457, 557–561.
Tenca, C., Merlo, A., Merck, E., Bates, E. E., Saverino, D., Simone, R., Zarcone, D., Trinchieri, G., Grossi, C. E., and Ciccone, E. (2005). CD85j (leukocyte Ig-like receptor-1/Ig-like transcript 2) inhibits human osteoclast-associated receptor-mediated activation of human dendritic cells. J. Immunol. 174, 6757–6763.
Thomas, R., Yamada, E., Alter, G., Martin, M. P., Bashirova, A. A., Norman, P. J., Altfeld, M., Parham, P., Anderson, S. K., Mcvicar, D. W., and Carrington, M. (2008). Novel KIR3DL1 alleles and their expression levels on NK cells: convergent evolution of KIR3DL1 phenotype variation? J. Immunol. 180, 6743–6750.
Valiante, N. M., Uhrberg, M., Shilling, H. G., Lienert-Weidenbach, K., Arnett, K. L., D’andrea, A., Phillips, J. H., Lanier, L. L., and Parham, P. (1997). Functionally and structurally distinct NK cell receptor repertoires in the peripheral blood of two human donors. Immunity 7, 739–751.
Vitale, M., Castriconi, R., Parolini, S., Pende, D., Hsu, M. L., Moretta, L., Cosman, D., and Moretta, A. (1999). The leukocyte Ig-like receptor (LIR)-1 for the cytomegalovirus UL18 protein displays a broad specificity for different HLA class I alleles: analysis of LIR-1+ NK cell clones. Int. Immunol. 11, 29–35.
Vossen, M. T., Matmati, M., Hertoghs, K. M., Baars, P. A., Gent, M. R., Leclercq, G., Hamann, J., Kuijpers, T. W., and Van Lier, R. A. (2008). CD27 defines phenotypically and functionally different human NK cell subsets. J. Immunol. 180, 3739–3745.
Wagner, C. S., Riise, G. C., Bergstrom, T., Karre, K., Carbone, E., and Berg, L. (2007). Increased expression of leukocyte Ig-like receptor-1 and activating role of UL18 in the response to cytomegalovirus infection. J. Immunol. 178, 3536–3543.
Wende, H., Colonna, M., Ziegler, A., and Volz, A. (1999). Organization of the leukocyte receptor cluster (LRC) on human chromosome 19q13.4. Mamm. Genome 10, 154–160.
Young, N. T., Uhrberg, M., Phillips, J. H., Lanier, L. L., and Parham, P. (2001). Differential expression of leukocyte receptor complex-encoded Ig-like receptors correlates with the transition from effector to memory CTL. J. Immunol. 166, 3933–3941.
Young, N. T., Waller, E. C., Patel, R., Roghanian, A., Austyn, J. M., and Trowsdale, J. (2008). The inhibitory receptor LILRB1 modulates the differentiation and regulatory potential of human dendritic cells. Blood 111, 3090–3096.
Appendix
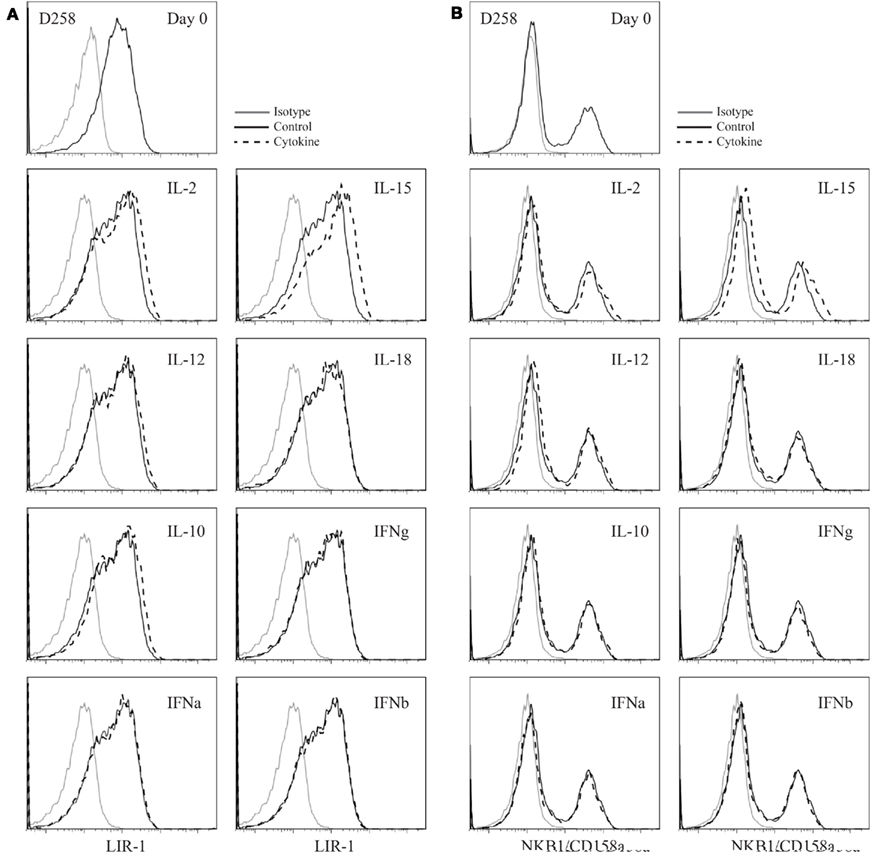
Figure A1. Cytokine stimulation of activated peripheral blood NK cell populations. (A) Expanded D258 NK cells were rested out of IL-2 for 48 h and placed into culture for 72 h in the presence of low dose IL-2 alone (control) or in combination with the cytokines indicated and examined for LIR-1 expression compared to control. (B) D258 NK cells were cultured as in (A) and examined for pooled KIR expression on day 3.
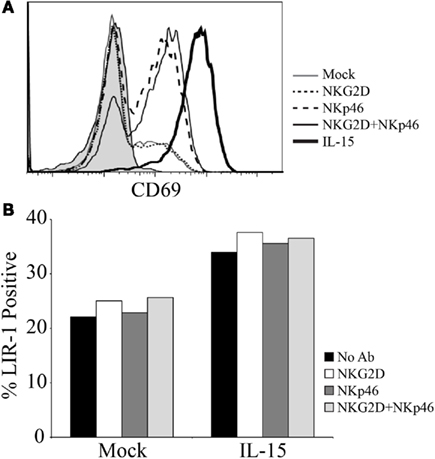
Figure A2. Triggering activating receptors on NK cells does not increase LIR-1 expression. (A) D183 NK cells were isolated from peripheral blood and purity was assessed by CD56 and CD3 expression (data not shown). Anti-human NKG2D (1D11) and anti-human NKp46 (195314) were used at 10 μg/ml to coat wells of a 96-well plate for NK cell stimulation. NK cells were plated in the presence and absence of IL-15 and incubated for a period of 72 h. On day 3, cells were harvested and examined for expression of CD69. The shaded histogram represents the staining profile with an isotype control antibody. (B) NK cells shown in (A) were co-stained for LIR-1 expression.
Keywords: natural killer cells, inhibitory receptor, LIR-1
Citation: Li NL, Davidson CL, Humar A and Burshtyn DN (2011) Modulation of the inhibitory receptor leukocyte Ig-like receptor 1 on human natural killer cells. Front. Immun. 2:46. doi: 10.3389/fimmu.2011.00046
Received: 22 June 2011;
Accepted: 05 September 2011;
Published online: 20 September 2011.
Edited by:
Lewis L. Lanier, University of California San Francisco, USAReviewed by:
Stephen K. Anderson, National Cancer Institute-Frederick, USAMiguel López-Botet, Hospital del Mar Research Institute, Spain
Copyright: © 2011 Li, Davidson, Humar and Burshtyn. This is an open-access article subject to a non-exclusive license between the authors and Frontiers Media SA, which permits use, distribution and reproduction in other forums, provided the original authors and source are credited and other Frontiers conditions are complied with.
*Correspondence: Deborah N. Burshtyn, Department of Medical Microbiology and Immunology, University of Alberta, 659 Heritage Medical Research Centre, Edmonton, AB, Canada T6G 2S2. e-mail: burshtyn@ualberta.ca