 Haowen Zhong1,2†
 Ya Liu3†
 Zhenjian Xu1,4†Peifeng Liang1,4Hui Yang1,4Xiao Zhang1,4Jun Zhao2Junzhen Chen1,4Sha Fu1,4
 Ying Tang1,4Jun Lv1,4Julie Wang5Nancy Olsen5Anping Xu1,4*
 Song Guo Zheng2,5*
- 1Department of Nephrology, Sun Yat-sen Memorial Hospital of Sun Yat-sen University, Guangzhou, China
- 2Department of Clinical Immunology, The Third Affiliate Hospital of Sun Yat-sen University, Guangzhou, China
- 3Department of Nephrology, The Affiliated Hospital of Xuzhou Medical University, Xuzhou, China
- 4Guangdong Provincial Key Laboratory of Malignant Tumor Epigenetics and Gene Regulation, Sun Yat-sen Memorial Hospital of Sun Yat-sen University, Guangzhou, China
- 5Division of Rheumatology, Milton S. Hershey Medical Center, Penn State University, Hershey, PA, United States
Lupus nephritis is one of most severe complications of systemic erythematosus lupus and current approaches are not curative for lupus nephritis. Although CD4+Foxp3+ regulatory T cells (Treg) are crucial for prevention of autoimmunity, the therapeutic effect of these cells on lupus nephritis is not satisfactory. We previously reported that CD8+CD103+ Treg induced ex vivo with TGF-β1 and IL-2 (CD8+CD103+ iTreg), regardless of Foxp3 expression, displayed potent immunosuppressive effect on Th cell response and had therapeutic effect on Th cell-mediated colitis. Here, we tested whether CD8+CD103+ iTreg can ameliorate lupus nephritis and determined potential molecular mechanisms. Adoptive transfer of CD8+CD103+ iTreg but not control cells to chronic graft-versus-host disease with a typical lupus syndrome showed decreased levels of autoantibodies and proteinuria, reduced renal pathological lesions, lowered renal deposition of IgG/C3, and improved survival. CD8+CD103+ iTreg cells suppressed not only T helper cells but also B cell responses directly that may involve in both TGF-β and IL-10 signals. Using RNA-seq, we demonstrated CD8+CD103+ iTreg have its own unique expression profiles of transcription factors. Thus, current study has identified and extended the target cells of CD8+CD103+ iTreg and provided a possible application of this new iTreg subset on lupus nephritis and other autoimmune diseases.
Introduction
Systemic lupus erythematosus (SLE) is a serious autoimmune disease with incompletely understood pathogenesis. A major immune feature of SLE is the hypersecretion of autoantibodies by dysfunctionally autoreactive B cells (1). Lupus nephritis, a foremost cause of morbidity and mortality, is present in up to 60% SLE patients (2), and features immune complex deposition in the glomerulus, consequently causing tissue damage and proteinuria. Therapeutic approaches available include immunosuppressive drugs, biologicals, and corticosteroids (3). Among these, B cell depletion using rituximab has been used for the treatment of SLE and many autoimmune and chronic inflammatory diseases (4, 5), but its role is restricted for incapable of depleting long-lived plasma cells (6). All of these treatment options are not a permanent cure which would be one that ideally reverses immune imbalance.
Regulatory T cells (Treg) are a subset of T cells that maintain self-tolerance by suppressing autoreactive lymphocytes, mainly consisting of natural occurring Treg cells (nTreg) and induced Treg cells (iTreg) (7, 8). We and others have widely reported that both nTreg and iTreg have immunosuppressive properties and exert therapeutic effects on autoimmune diseases (9–14). However, CD4+Foxp3+ nTreg showed instability in inflammatory conditions and their therapeutic effects on the established autoimmune diseases were sometimes unsatisfactory (15, 16). It has been shown that some CD4+Foxp3+ nTreg had converted to Th17 cells after encountering IL-6 and other inflammatory cytokines (15, 16), although CD4+Foxp3+ iTreg might be more stable in the inflammation environment (15, 17–19).
Although Foxp3 is essential for the development and function of CD4+ Treg cells, it is not a case for CD8+ iTreg cells. We previously reported that CD8+CD103+ iTreg induced ex vivo with TGF-β and IL-2 potently suppressed Th cell response and Th1/Th17-mediated colitis, regardless of Foxp3 expression (20). CD8+Foxp3+CD103+ iTreg and CD8+Foxp3−CD103+ iTreg shared similar immunosuppressive capability in suppress Th cell response, while CD8+CD103− T cells showed no inhibition ability. These studies imply that CD8+CD103+ iTreg may have some advantages in treating inflammatory diseases since their role is not dependent upon Foxp3 expression. As CD4+Foxp3+ nTreg cells had a minimal therapeutic effect on lupus nephritis (11), we were interested in exploring whether CD8+CD103+ iTreg have therapeutic effect on SLE/lupus nephritis.
In the current article, we show that infusion of CD8+CD103+ iTreg to lupus mice displayed a potent therapeutic effect on lupus nephritis. CD8+CD103+ iTreg reduced autoantibody titers and proteinuria, decreased renal pathological lesions, as well as diminished IgG and C3 deposition in renal glomerulus. Further observation demonstrated that the therapeutic effect is greatly dependent on the direct suppression of B cell responses which involve both TGF-β and IL-10 signals. RNAseq technology further identified that CD8+CD103+ iTreg have a unique expression profile of transcription factors that distinguishes them from CD4+ Treg cells.
Results
Infusion of CD8+CD103+ iTreg Cells Significantly Ameliorates Lupus Nephritis
To determine the therapeutic effect of CD8+CD103+ iTregs on lupus nephritis mice, we have used chronic graft-versus-host disease (cGVHD) mice as established lupus nephritis model (21, 22). Naive CD8+ cells isolated from DBA/2 mouse were stimulated with anti-CD3/CD28 coating beads and IL-2 in the absence (CD8 Med) and presence (CD8 iTreg) of TGF-β for 3 days, and then CD8+CD103− cells were sorted from CD8 Med as CD8 control cells (CD8 Med), CD8+CD103+ cells were sorted from iTreg cells as CD8+CD103+ iTreg cells as previously described (20). Adoptive transfer of DBA2 spleen cells to DBA2xC57BL/6 F1 mouse will develop a typical lupus syndrome characterized by increased levels of IgG autoantibody on the first week and proteinuria on the eighth week after cell transfer, providing an ideal model to study SLE/lupus nephritis. CD8+CD103+ iTreg or CD8+CD103− were transferred into chronic GVHD mice at 3 and 8 weeks after DBA2 cell transfer. Infusion of CD8+CD103+ iTreg cells significantly reversed the decrease of weight, the increase of proteinuria in mice after 8 weeks, whereas CD8+CD103− control cells did not show these effects (Figures 1A,B).
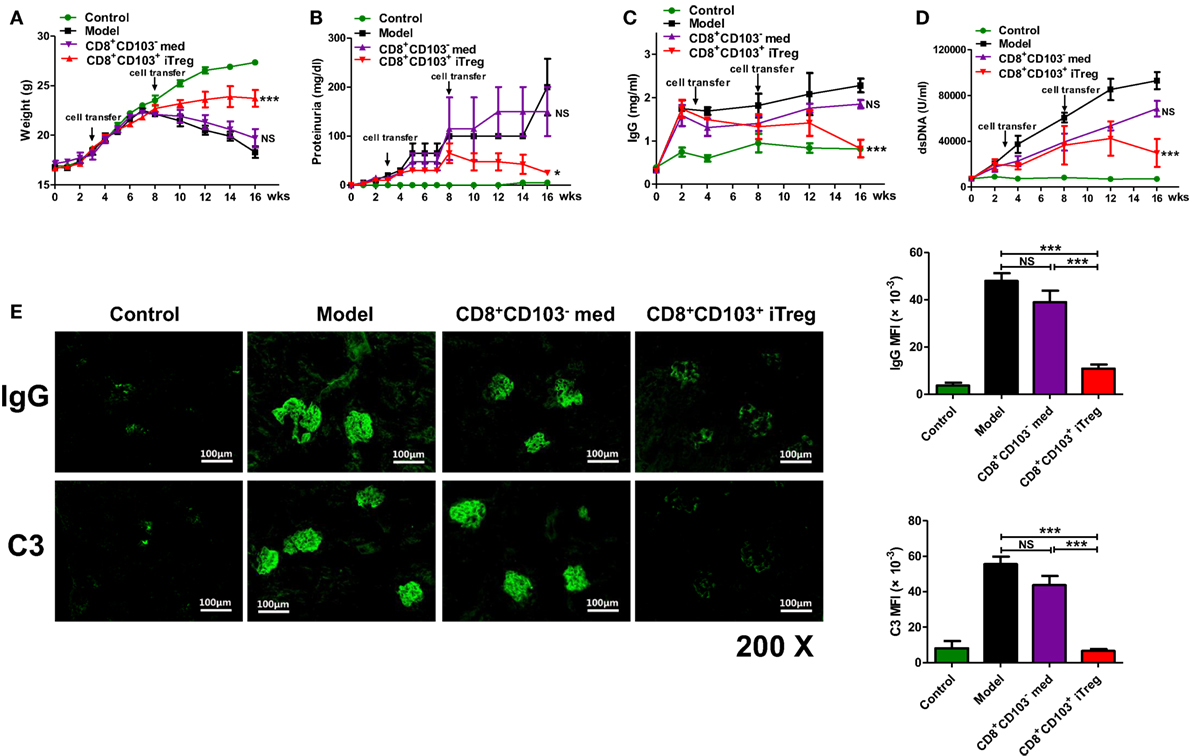
Figure 1. CD8+CD103+ iTregs show potent therapeutic effect on chronic graft-versus-host disease (cGVHD) lupus nephritis mice. CD8+CD103− med, CD8+CD103+ iTregs induced from DBA/2 mice were adoptively transferred to cGVHD lupus nephritis mice at 3 and 8 weeks. There were four mice in each group. (A–D) CD8+CD103+ iTreg cells significantly reversed the decrease in weight, and the increase in proteinuria in lupus nephritis mice after 8 weeks, and also prevented the continuous rise in dsDNA Ab and total IgG titers. The data indicate the mean ± SEM of four individuals (NS means no significance, *P < 0.05, ***P < 0.001, CD8+CD103− med or CD8+CD103+ iTreg versus model). (E) CD8+CD103+ iTregs reduced IgG or C3 immune deposition in the glomeruli, IgG or C3 mean fluorescence intensity are significantly lower in CD8+CD103+ iTreg group. The data indicate the mean ± SEM of four independent experiments (NS means no significance, ***P < 0.001).
We also determined effects on serum dsDNA Ab and total IgG titers. CD8+CD103+ iTreg prevented the continuous rise in total IgG and dsDNA Ab titers after cell transfer. The levels of dsDNA Ab and total IgG were significantly lower in cGVHD mice that received CD8+CD103+ iTreg than in cGVHD, although infusion of CD8+CD103− cells was also slightly decreased the levels during 8–14 weeks (Figures 1C,D).
All mice were sacrificed for pathological examination of kidneys at 16 weeks post DBA/2 cell transfer. Immunofluorescence staining in kidney revealed that the IgG or C3 immune deposition in the glomeruli of cGVHD mice that received CD8+CD103+ iTreg was reduced compared to the untreated cGVHD model mice or cGVHD mice that received CD8+CD103− control cells. IgG or C3 mean fluorescence intensity (MFI) of glomeruli was significantly lower in CD8+CD103+ iTreg group versus control groups (Figure 1E).
Using HE, Masson, periodic acid-Schiff (PAS), or periodic acid-silver metheramine (PASM) staining on kidney paraffin sections, we observed that renal pathologic lesions were much less in cGVHD mice treated with CD8+CD103+ iTreg compared to control groups (Figure 2A). CD8+CD103+ iTreg treatment also resulted in a significant lower degree of disease activity and chronicity indices (Figures 2B,C), while cGVHD model group and CD8+CD103− cell treatment group mice exhibited typical pathological damage of lupus nephritis, as shown by disease activity and chronicity index scores (Figures 2A–C).
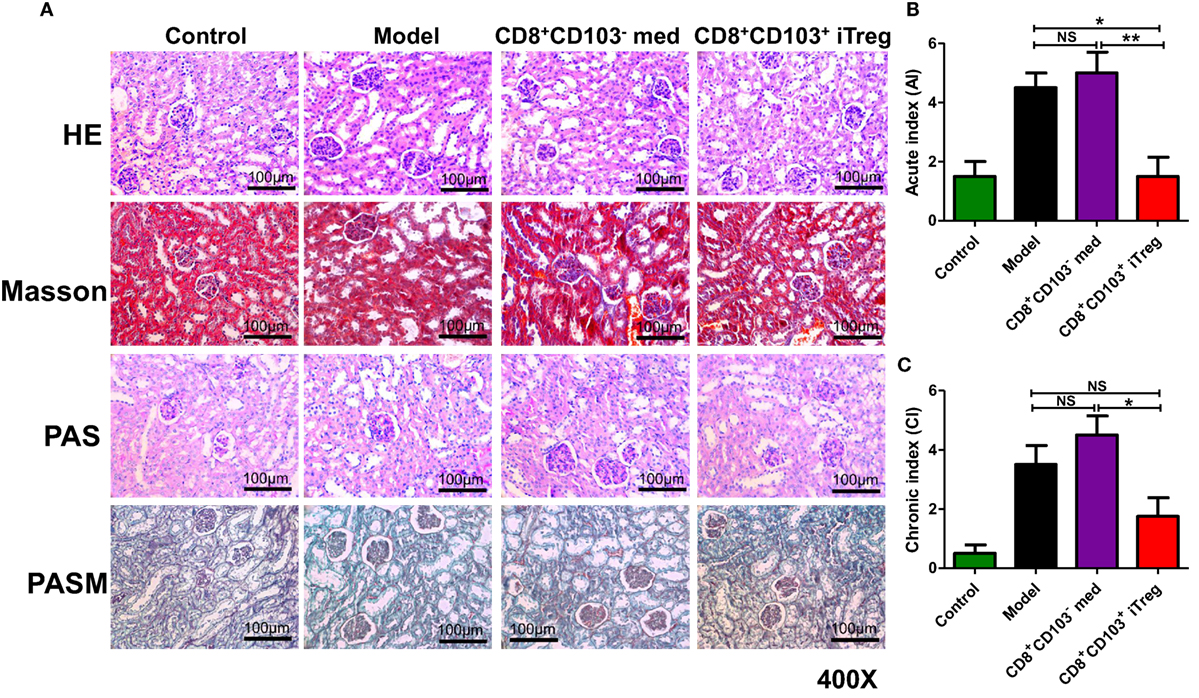
Figure 2. CD8+CD103+ iTregs reduced renal pathological lesions in lupus nephritis mice. CD8+CD103− med, CD8+CD103+ iTregs were adoptively transferred to chronic graft-versus-host disease lupus nephritis mice at 3 and 8 weeks. There were four mice in each group in one experiment. (A) CD8+CD103+ iTregs alleviated the renal pathologic lesion. (B,C) Lupus nephritis mice with CD8+CD103+ iTreg treatment had lower disease activity and chronicity indices. The data indicate the mean ± SEM of four independent experiments (NS means no significance, *P < 0.05, **P < 0.01).
CD8+CD103+ iTreg Cells Suppress B Cell Responses Ex Vivo
A previous study has demonstrated that CD8+CD103+ iTreg mainly suppress Th cells (20). Given that B cells play an important role in the pathogenesis and development of lupus and lupus nephritis (23, 24), we also sought to determine whether CD8+CD103+ iTregs can directly suppress B cells. The first experiment was carried out using an ex vivo assay. CD8+CD103+ iTreg or control cells and B cells were cocultured, and B cell activation and proliferation, including the ability of B cells to produce antibodies in the presence of lipopolysaccharide (LPS) were analyzed at different time points. Compared with the CD8+CD103− control cells, CD8+CD103+ iTregs markedly suppressed the expression of CD25, CD69, CD86 on B cells (Figure 3A), indicating that CD8+CD103+ iTreg cells may directly suppress B cell activation. We further studied the gradient effects of this suppressive capacity at the ratio of 1:1 to 1:4 (T: B) and which shows a dose-dependent effect (Figure 3B). CD8+CD103+ iTregs also suppressed the expression of CD138 while control cells slightly reduced the expression with no significance (Figure S1 in Supplementary Material).
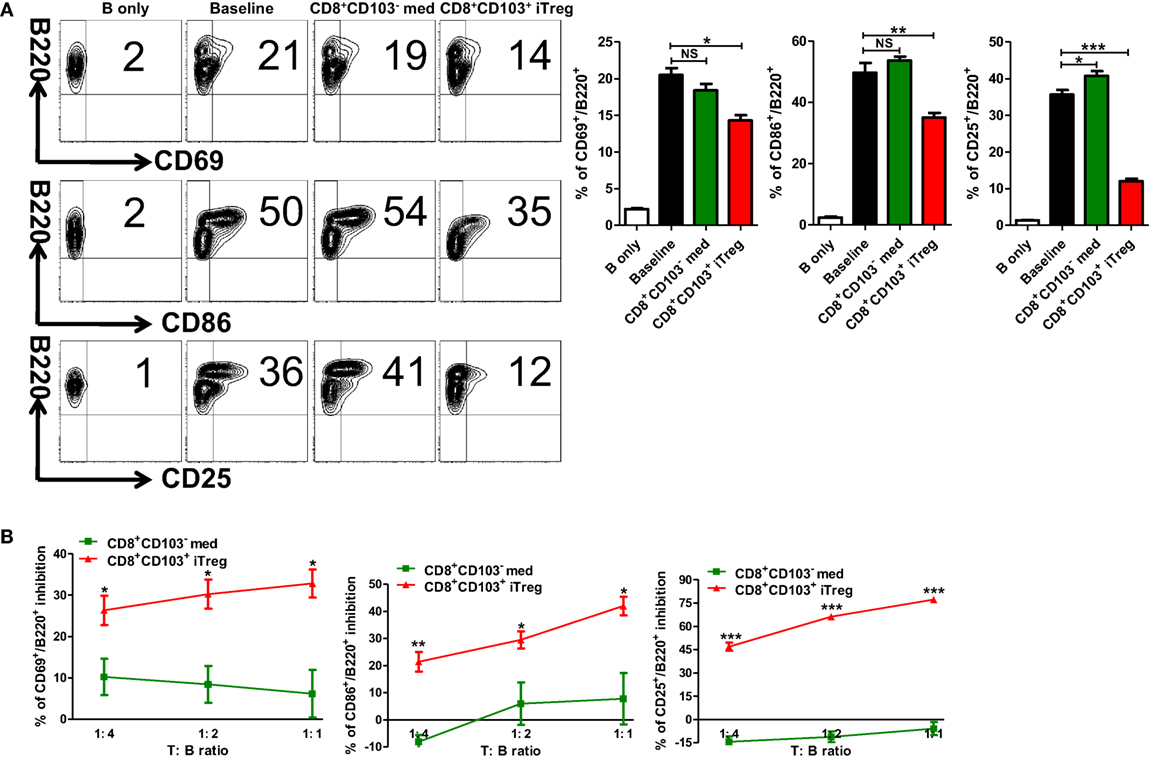
Figure 3. CD8+CD103+ iTregs directly suppress B cell responses ex vivo. (A) B cells were isolated from C57BL/6, stimulated with (baseline) or without lipopolysaccharide (B only) in the presence or absence of CD8+CD103− med or CD8+CD103+ iTregs (T:B = 1:2). The expression of B cell early activation (CD69, CD86) and later activation (CD25) markers was detected after 48 h of culture by flow cytometry. Typical FACS plots and summary data are shown. The data indicate the mean ± SEM of three independent experiments. (NS means no significance, *P < 0.05, **P < 0.01, ***P < 0.001.) (B) Then, B cells cocultured with CD8+CD103− med or CD8+CD103+ iTreg in the same way (ratio of T to B cells was 1:4 to 1:1). The inhibition percentages are given. The data indicate the mean ± SEM of three independent experiments (*P < 0.05, **P < 0.01, ***P < 0.001, CD8+CD103+ iTreg versus CD8+CD103− med at the same ratio).
We next determined whether CD8+CD103+ iTreg cells also suppress B cell proliferation. B cells have been labeled with CFSE that enables quantitation of cell proliferation. As shown in Figure 4A, CD8+CD103+ iTregs but not CD8+CD103− control cells markedly suppressed B cell proliferation and the inhibitory efficiency was comparable to that of CD4+ iTreg or nTreg subsets.
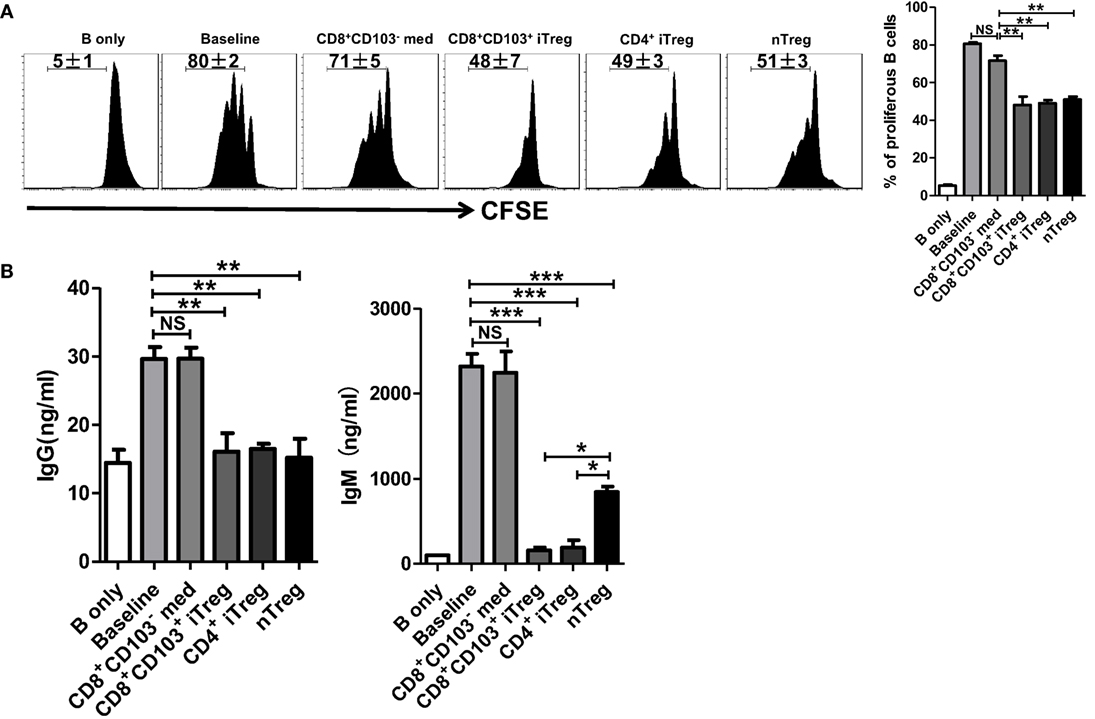
Figure 4. CD8+CD103+ iTregs directly suppress B cell proliferation and the ability to secrete antibody ex vivo. (A) Fresh B cells labeled with CFSE were cultured in 96-well plates with CD8+CD103− med, CD8+CD103+ iTreg, CD4+ iTreg, or nTreg cells (the ratio of T cells: B cells was 1:2) in the presence of lipopolysaccharide. B cell proliferation was determined by the CFSE dilution rates after 3 days of culture. Typical FACS histogram and summary data were shown. (B) The supernatants were collected from T cells and B cells co-culture systems after 3-day culture, and the IgG and IgM secretion was detected by ELISA. The data indicate the mean ± SEM of three independent experiments (NS means no significance, *P < 0.05, **P < 0.01, ***P < 0.001).
One of mostly important features of B cells is the ability to produce antibodies. We therefore also analyzed the ability of CD8+CD103+ iTregs or CD8+CD103− control cells to regulate antibody production by B cells. As expected, CD8+CD103+ iTreg significantly suppressed IgG and dramatically inhibited IgM production when these cells were cocultured with LPS-stimulated B cells. Conversely, CD8+CD103− control cells did not display any suppressive effect on antibody production (Figure 4B). Thus, CD8+CD103+ iTreg cells at least demonstrate their suppression of B cells similar to their partners of CD4+ Treg cells (25–28).
Cell Contact and TGF-β/IL-10 Signals Are All Needed for Suppressive Effect of CD8+CD103+ iTreg Cells on B Cell Responses
We further explored underlying mechanisms whereby CD8+CD103+ iTreg cells suppress B cell responses. B cells and CD8+CD103+ iTreg cells were cocultured through either cell contact or Transwell system that enables isolation of both cell populations while allowing soluble molecules secreted from Treg cells to permeate the B cell compartment. The proliferative levels and antibody secretion of LPS-stimulated B cells in the presence of either CD8+ iTreg or control cells were measured to evaluate the inhibitory ability of CD8+ cells. We observed that CD8+CD103+ iTregs suppressed the B cell proliferation and antibody secretion when cell–cell is present in the culture, but this ability to suppress B cells proliferation disappeared when CD8+ Treg cells were isolated from B responder cells. The ability to suppress the antibody secretion of B cells was also weaken under Transwell situation. CD8+ control cells did not suppress B cell functions, regardless of the presence or absence of cell contact (Figures 5A,B).
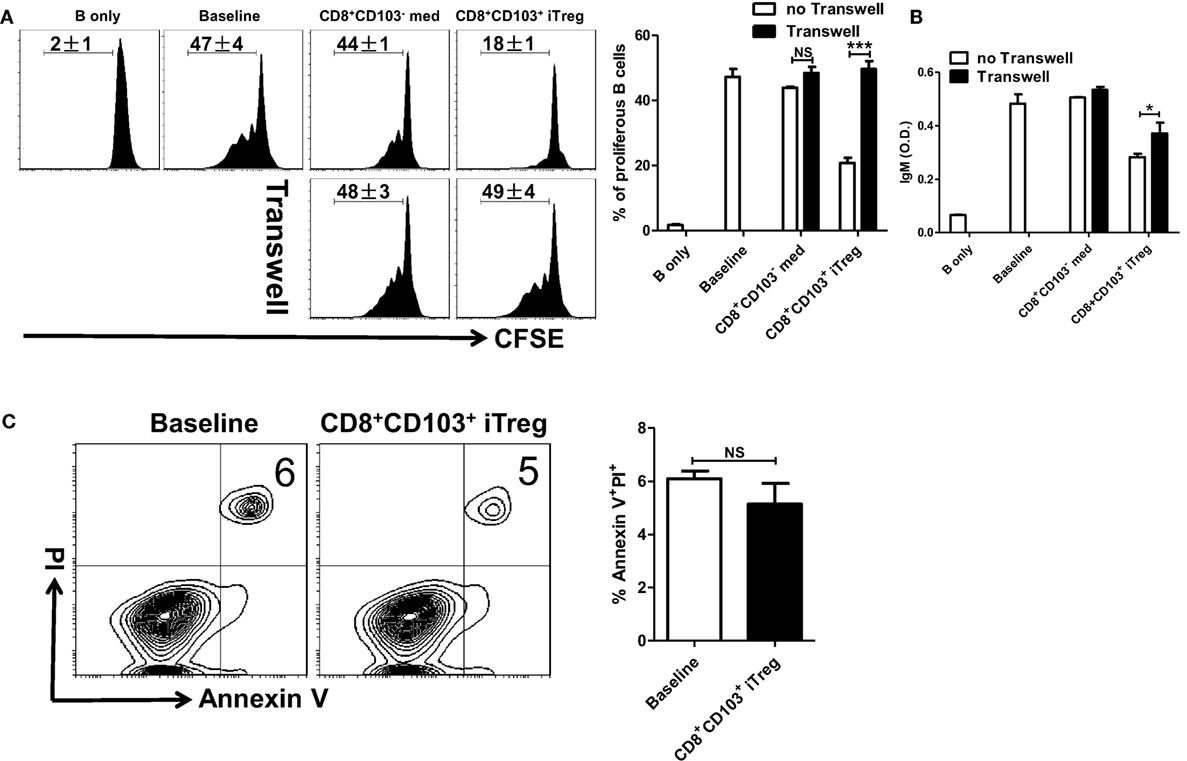
Figure 5. CD8+CD103+ iTregs suppress B cell responses by a cell contact dependent mechanism. (A,B) Fresh B cells labeled with CFSE were cultured in 24-well plates with CD8+CD103− med or CD8+CD103+ iTreg (the ratio of T cells: B cells was 1:2) in the presence of lipopolysaccharide (LPS), with or without Transwell (0.4 μM). The proliferation was analyzed by the flow cytometry. The supernatants were collected from T cells and B cells co-culture systems after 3-day culture, and the IgM secretion was measured by an ELISA. Typical FACS histogram and summary data are shown. (C) CD8+CD103+ iTreg cells were cocultured with B cells in the presence of LPS. After 16 h of culture, the apoptosis percentage of B220+ cells was detected by flow cytometry using the Annexin V/PI kit. Representative FACS plots were gated on B220+ cells and summarized data were shown. The data indicate the mean ± SEM of three independent experiments (NS means no significance, ***P < 0.001).
We also extended our study to determine whether CD8+CD103+ iTregs suppress B cell responses ex vivo through TGF-β or/and IL-10 signals. As shown in Figure S2 in Supplementary Material, TGF-β or/and IL-10 signals were indeed needed for their suppressive effects on B cell responses ex vivo. It is likely that CD8+CD103+ iTreg cells act target cells via their secretion of active TGF-β and TGF-β binding on membrane-bound (cell surface) receptors.
CD8+CD103+ iTreg Cells Suppress B Cell Responses That Is Independent upon Cytotoxicity
Given that nTreg directly suppress B cell responses by cytotoxic mechanisms (26, 28), largely by secreting the cytotoxic molecules granzyme A, granzyme B, and perforin; and CD4+ iTreg directly suppress B cell responses through a non-cytotoxic mechanism involving TGF-β signaling (25), we explored the possibility whether cell killing is involved in the inhibitory effect of CD8+CD103+ iTregs on B cell responses.
CD8+CD103+ iTreg cells were cocultured with B cells in the presence of LPS. After 16 h of coculture, apoptosis percentage of B220+ cells was detected by flow cytometry. We found that CD8+CD103+ iTregs did not promote apoptosis of B cells in the coculture system (Figure 5C). We also conducted coculture measurements at different time points, 48 and 72 h, and no significant B cell apoptosis change was observed (data not shown). Then we observed that cytotoxic molecules including granzyme A, granzyme B, and perforin were no expressed in CD8+CD103+ iTreg cells (Figure S3 in Supplementary Material), which strengths the conclusion that CD8+CD103+ iTreg suppress B cell responses by non-cytotoxicity way.
CD8+CD103+ iTreg Suppress B Cell Responses In Vivo
The results generated from in vitro experiments do not necessarily reflect the consequences in vivo. To determine the role and mechanisms of CD8+ iTreg against B cell responses, we carried out the in vivo experiments as established previously to address this possibility (25). B cells pretreated with LPS were cotransferred with CD8+CD103− med, CD8+CD103+ iTreg, or nTreg cells (2:1 ratio) into Rag1−/− mice; in some groups, TGF-β receptor I inhibitor (TβRI inhibitor, ALK5i), anti-IL-10R Ab, control IgG, or DMSO (for Alk5i control) were injected i.p. 3 days after cell transfer (Figure 6A). Ki-67 expression in LPS-stimulated B cells is markedly increased in this model. Co-transfer of CD8+CD103+ iTregs or nTregs significantly reversed the high expression of Ki-67 in B cells in vivo, while co-transfer of CD8+CD103− med cells only slightly reduced Ki-67 expression, without statistical significance (Figures 6B,C).
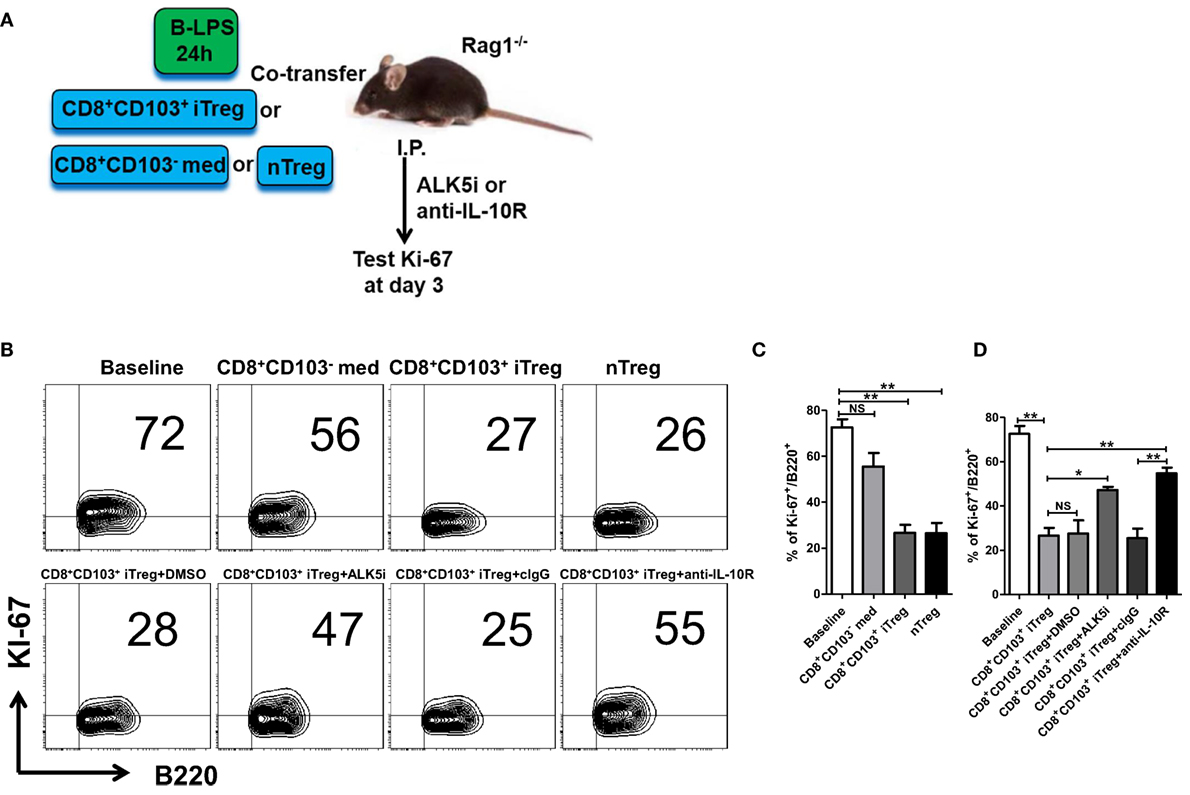
Figure 6. CD8+CD103+ iTregs directly suppress allogeneic B cell responses in vivo. (A) Fresh B cells were stimulated with lipopolysaccharide (LPS) for 24 h and then cotransferred with CD8+CD103− med, CD8+CD103+ iTreg, or nTreg cells (T: B = 2:1, B cells 8 million per mouse) into Rag1−/− mice, in some groups, ALK5i (1 mg/kg), anti-IL-10R Ab (1 mg/kg), DMSO (for ALK5i control), or control IgG were i.p. injected at days 0 and 2. The mice were sacrificed at day 3, and splenic B cells were harvested and prepared to test Ki-67 expression on B cells by flow cytometry. (B,C) Co-transfer of CD8+CD103+ iTregs or nTregs significantly reversed the high expression of Ki-67 in B cells in vivo. (B,D) Blockade of TβRI or IL-10R greatly abolished the suppressive effect of CD8+CD103+ iTregs on B cells proliferation in in vivo. There were three mice in each group. The data indicate mean ± SEM of three independent experiments (NS means no significance, *P < 0.05, **P < 0.01).
We observed that suppression of CD8+CD103+ iTregs on B cell responses in vivo was largely dependent upon TGF-β or/and IL-10 signals, because blockade of TβRI or IL-10R greatly abolished the suppressive effect (Figure 6D). Of interest, the IL-10 signal seemed to have a more important role in the suppression of CD8+CD103+ iTregs on B cells in vivo, whereas the suppression of CD4+ iTregs on B cell responses was mostly dependent on the TGF-β signal and partly dependent on the IL-10 signal (25).
Further evidence that CD8+CD103+ iTregs suppress B cell response in vivo was provided using the lupus model. CD8+CD103− med, CD8+CD103+ iTreg, or nTreg cells were adoptively transferred to cGVHD lupus mice with proteinuria of greater than100 mg/dl, in which endogenous T cells had been previously deleted and endogenous B cells had been previously stimulated (Figure 7A). The results showed that the percentages of peripheral blood CD138+ plasma cells were significantly decreased in CD8+CD103+ iTreg or nTreg group compared with the CD8+CD103− group 2 weeks post cell transfer. CD8+CD103+ iTregs also significantly reduced the percentages of splenic CD138+ plasma cells, but nTregs did not show such suppressive ability at similar time points (Figure 7B). Nonetheless, both CD8+CD103+ iTregs and nTregs similarly suppressed IgG production in cGVHD lupus mice 2 weeks after cell transfer (Figure 7C). These results suggest that CD8+CD103+ iTregs suppress not only allogenic B cells but also autoreactive B cell responses in vivo.
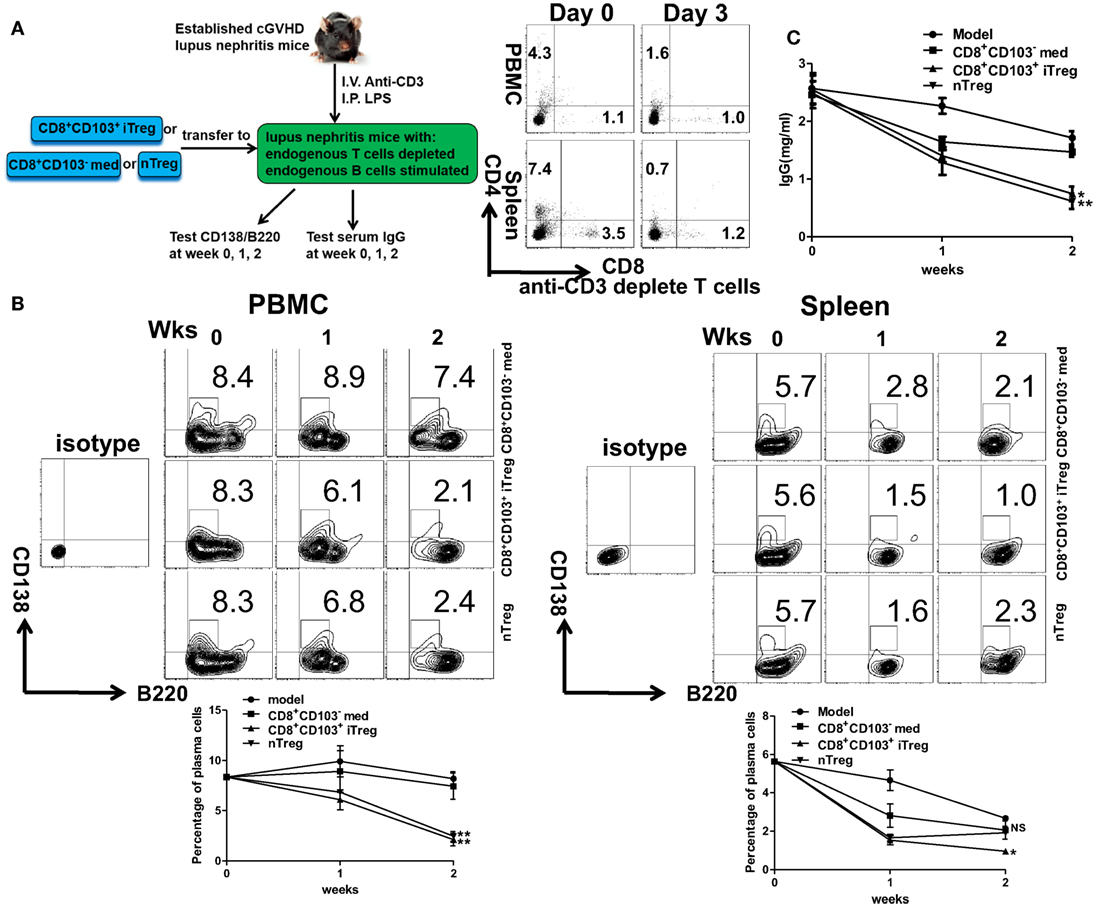
Figure 7. CD8+CD103+ iTregs directly suppress autoreactive B cells in chronic graft-versus-host disease (cGVHD) lupus nephritis mice. (A) CD8+CD103− med, CD8+CD103+ iTreg, or nTreg cells were adoptively transferred to B6D2F1 cGVHD lupus nephritis mice with high titers of anti-dsDNA and proteinuria. These lupus nephritis mice were previously depleted of endogenous T cells (300 mg anti-mouse CD3 Ab, i.v.) and had activation of B cells [10 μg lipopolysaccharide (LPS) per mouse, i.p.] 3 days before the cell transfer. There were three mice in each group. On day 3, there were almost no CD4+ or CD8+ T cells in cGVHD mice with anti-CD3 depletion. (B) The percentage of CD138/B220 (CD138 is plasma cell marker) in PBMC or spleen was measured in different lupus nephritis mice groups at the 0-, 1-, and 2-week time points after cell transfer. (C) The serum total IgG titer at 0-, 1-, and 2-week time points after cell transfer were detected by ELISA. The data indicate the mean ± SEM of three independent experiments. (NS means no significance, *P < 0.05, **P < 0.01, CD8+CD103− med, or CD8+CD103+ iTreg versus model.)
Although previous studies have shown that B cells express TGF-β receptor I (TβRI) (29) and IL-10 receptor α (IL-10Rα) (30), it is not clear whether the expression of this two receptors were changed during the cGVHD lupus-like disease model establishing process. Real-time PCR experiments were carried out and we observed that the expression of TβRI and IL-10Rα on B cells was not changed during the model processing (Figure S4 in Supplementary Material). Thus, it is reasonable that CD8+CD103+ iTreg suppress B cell responses via TGF-β and IL-10 signals.
RNA-seq Identifies That CD8+CD103+ iTreg Is a Unique Treg Population
To determine and compare possible differences between CD8+CD103+ Treg cells and other Treg subsets or non-Treg cells, we carried out RNA-seq analysis for differentially expressed genes in CD8+CD103− med, CD8+CD103+ iTreg, CD4+ iTreg, and nTreg subsets. A total 48,440 genes were detected using fastx-toolkit v0.0.14 and cutadapt v1.7.1. There were 323 significantly differentially expressed genes in genes expression heatmap for the four different cell subsets (Figure S5A in Supplementary Material). Pairwise genes expression comparison histograms of CD8+CD103− med versus CD8+CD103+ iTreg, CD8+CD103+ iTreg versus CD4+ iTreg, CD8+CD103+ iTreg versus nTreg are also shown (Figures 8A–C), using the filter of |log2FoldChange| ≥ 5 [fold change (FC)]. Each cell subset has its own specific gene profile that may be used as a tool to distinguish one population from another.
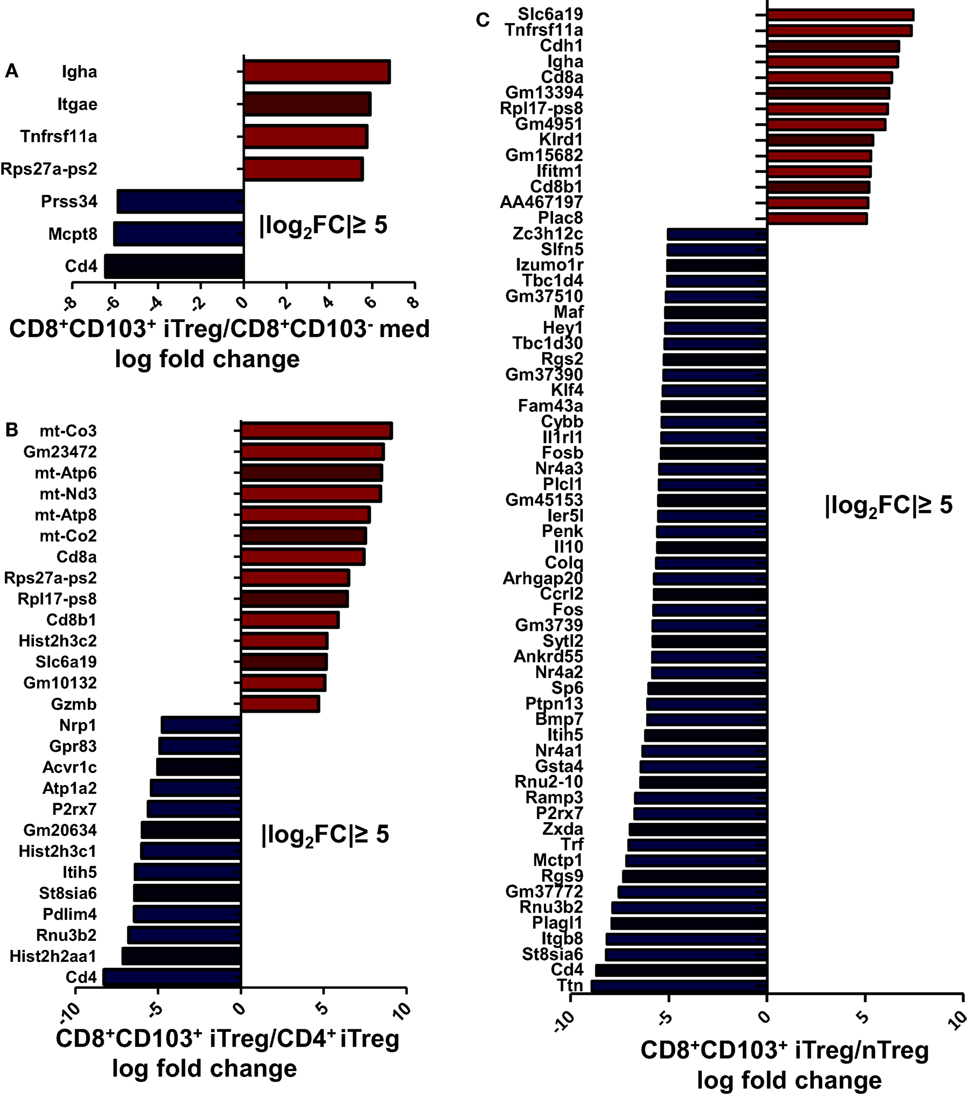
Figure 8. Each regulatory T cells (Treg) subsets has its own gene expression profile. CD8+CD103− med, CD8+CD103+ iTreg, CD4+ iTreg, and nTreg cells were prepared, RNA was extracted, and DNA libraries were constructed. RNAseq was conducted on an Illumina HiSeq platform following the manufacturer’s instructions. (A–C) Significantly altered genes fold change (FC) plotted for specific two cell subsets are shown, with the filter of |log2FC| ≥ 5.
Compared with CD8+CD103− non-Treg cells, CD8+CD103+ iTreg cells have higher expression of Igha, Itgae, and Tnfrsf11a. It is reasonable to expect that CD103 coded by gene Itgae would be highly expressed on the CD103+ cell population. CD103 expression has been shown to be an essential molecule for CD8+ iTregs to suppress Th cell responses (20) and may be centrally involved in the suppressive effect on B cell responses. CD265, also known as receptor activator of NF-κB (RANK), coded by gene Tnfrsf11a, may be a specific marker for CD8+CD103+ iTregs which may also play an important role in immunosuppressive function of CD8+CD103+ iTregs (Figure S5B in Supplementary Material). Previous studies have demonstrated that CD265 is involved in T cell/dendritic cell interactions and tolerance induction (31, 32).
After applying the filter of |log2FC| ≥ 5, a total of 27 genes showed differential expression between CD8+CD103+ iTreg and CD4+ iTreg, of which 14 were upregulated in CD8+CD103+ iTreg and 13 were upregulated in CD4+ iTreg (Figure 8B). With the same filter, a total of 63 genes showed differential expression between CD8+CD103+ iTreg and nTreg, of which 13 were upregulated in CD8+CD103+ iTreg and 50 were upregulated in nTreg (Figure 8C).
Discussion
Thymus-derived CD4+CD25+ T regulatory cells (nTreg) maintain immune tolerance and possess immunosuppressive capacity (33). Although nTreg cells have an ideal role in preventing autoimmune and inflammatory diseases (9–11), the therapeutic effect of these cells on established diseases including lupus nehpritis is fairly unsatisfactory since they are unstable and dysfunctional in inflammation conditions (15, 16, 34–38), CD4+ Treg cells induced ex vivo provide a new Treg population and have displayed advantages in the inflammation conditions (12–15, 39–41), showed the therapeutic effect on established autoimmune diseases (12, 18), but others have reported that Foxp3 CPG is highly methylated in CD4+ iTreg cells, raising a concern about whether CD4+ iTregs can sustain long-term therapeutic effects on autoimmune diseases (42).
We recently reported that CD8+CD103+ Treg cells induced ex vivo have a similar functional characteristic compared to CD4+ nTregs and iTregs. Interestingly, these Treg cells suppress autoimmune diseases independent of Foxp3 expression (20). They need both TGF-β and IL-10 to suppress immune responses distinguishing them from Tr1 and Th3 cells (43, 44). New evidence provided from current study demonstrates that CD8+CD103+iTreg suppress lupus B cells also via TGF-β and IL-10 signals since these lupus B cells indeed maintain the expression of TGF-β and IL-10 receptors.
CD103, the αEβ7 integrin, is a receptor for the epithelial cell-specific ligand E-cadherin that was first reported expressed on CD8+ cytolytic T lymphocytes. CD103 plays a crucial role in responding to allogeneic epithelial cells and in affecting allograft survival (45). In a rat liver transplantation model, the levels of CD8+ T cells with upregulated CD103 expression were associated with long-time survival of allograft recipients (46). In another mouse renal transplantation model, it was found that the development of CD8+CD103+ cells depends on TGF-β signaling and facilitates their migration to renal allograft (47). In eye-derived tolerance, CD103 is necessary for CD8+ T cells regulatory mechanisms (48). Thus, CD103 expression may help distinguish the CD8+ cell Treg population from non-Treg cell population and may also participate in maintaining immune balance or in immunosuppression in diverse diseases (49, 50).
Besides CD103, we found some potential specific markers for CD8+CD103+ iTreg according to RNA-seq data. CD265 might be a specific marker, as previous studies have demonstrated that CD265 is involved in T cell/dendritic cell interactions and tolerance induction (31, 32). However, more data are needed to address this possibility including the development of CD265 KO mouse. Although CD226 also seems to be another specific marker for CD8+CD103+ iTreg, the previous study also showed that CD226 is a costimulatory molecule and plays an important role in activation and effector functions of Th1 cells (51), making CD226 less likely to be a specific marker for CD8+CD103+ iTreg.
In human SLE, the spontaneous activity of antibody-forming B cells is increased in the peripheral blood (52). In established autoimmune disease models, dysfunction of B cells also exists (53). As the most important part of humoral immunity, B cells play a crucial role in occurrence and development of autoimmune diseases mostly through the abnormal secretion of autoAbs, presentation of autoantigens, abnormal secretion of inflammatory cytokines, modulation of Ag processing, and generation of heterotopic germinal centers (6). A recent study revealed that B cells are major source of pro-inflammatory IL-6 and a key driver of lupus nephritis (54). In addition to its role in humoral immunity, IL-6 also sabotages the functional activity of Treg cells (15, 16, 55).
Hence, the depletion of B cells or suppression of B cell function represents a new therapeutic strategy in patients with SLE and other autoimmune diseases. Anti-IL-6 antibody has been approved for the treatment of patients with rheumatoid arthritis and may extend to patients with SLE (56) or other conditions. In addition, application of Treg cells may have a potential therapeutic effect, since several Treg subsets can suppress B cells. Although nTreg cells kill B cells, that may not happen in patients with SLE (26, 28) and CD4+ iTreg cells suppress B cells via a non-cytotoxic mechanism that may provide an advantage in clinical applications (25).
To overcome the concern that Foxp3 is unstable in inflammatory conditions, we have studied the functional characteristics of CD8+CD103+ iTreg cells in a lupus nephritis model. These cells not only strongly suppressed LPS-stimulated B cell responses, and reduced the levels of serum IgG and IgM secreted by B cells in lupus, but also prevented renal pathologic damage. Unlike nTreg cells, these cells suppress B cells independent of cell killing. RNA-seq technique identified that this is a unique Treg cell population, distinguishing them from nTreg and CD4+ Treg cells. Given their role does not need Foxp3 expression, it is likely that they are more stable and functional in the presence of inflammation. We had also conducted experiment where we transferred CD8+CD103+ iTregs or nTregs population into RAG1−/− mice and look their stability in different time points. The results turned out that the CD103 expression in CD8+CD103+ iTregs is more stable than the Foxp3 expression in nTreg (Figure S6 in Supplementary Material).
Although other CD8+ Treg cell subsets, such as CD8+CD28low/− or CD8+CD122+ cells, also suppress immune response, CD8+CD103+ Treg subset might be different from them. First, they did not completely share the phenotypic similarities, for example, CD8+CD103+ Treg cells are both CD122+ and CD122−, these cells also express somehow CD28 (20). Second, both CD122+ and CD28low/− cells can be produced naturally or developmentally. Last, CD8+CD28low/− cells suppress immune responses via IL-10 but not TGF-β although CD8+CD122+ cells requires both IL-10 and TGF-β (57). More studies including gene profiles are needed to fully distinguish these cell subsets.
Taken together, we now reveal that CD8+CD103+ iTreg induced ex vivo significantly control the appearance and development of nephritis in lupus-like diseases; therefore, use of CD8+CD103+ iTregs may have a potential promise for the treatment of lupus nephritis and other autoimmune and inflammatory diseases.
Materials and Methods
Mice
Female C57BL/6 (B6) mice were purchased from Guangdong Medical Laboratory Animal Center (Guangzhou, CHN), 6- to 8-week-old female DBA/2 mice and (C57BL/6 × DBA/2) B6D2DF1 mice were purchased from Vital River (Beijing, CHN) and Jackson Lab (USA). RAG1−/− mice (B6.129S7-Rag1tm1Mom/JNju) were purchased from Nanjing Biomedical Research Institute of Nanjing University (Nanjing, China) and Jackson Lab (USA). This study was carried out in accordance with the recommendations of Sun Yat-sen University for the Use and Care of Animals (Approval No. IACUC- DB-16-0909) and Milton S. Hershey Medical Center (IACUC NO. 46887). The protocol was approved by the Sun Yat-sen University and Penn State University.
Flow Cytometry
The following fluorescent mouse Abs from Biolegend (San Diego, CA, USA) were used for flow cytometry analysis: CD3, CD4, CD8, CD103, CD25, CD62L, CD69, CD86, CD138, Foxp3, and Ki-67; from eBioscience (San Diego, CA, USA): B220, granzyme B, perforin; from Santa Cruz (Dallas, TX, USA): granzyme A. Cell subsets were stained with mAbs and isotype control as indicated above and analyzed on BD LSRFortossa™ flow cytometer (BD Biosciences, San Diego, CA, USA) using FACSDiva Software (BD Biosciences). For intracellular staining, such as Foxp3, Granzyme A, GranzymeB, Perforin, and Ki-67, cells were first stained with surface marker, and further fixed and permeabilized for intracellular staining using Fix and Perm (eBioscience). Final plmiceot/histogram figures were prepared using FlowJo Software (Tree Star, Ashland, OR, USA).
The Generation of CD4+ iTreg, CD8+CD103− Med, CD8+CD103+ iTreg, and nTreg
CD4+ naive T cells (CD4+CD25−CD62L+CD44low) were isolated from splenic cells of C57BL/6 mice using a naive CD4+ T cell isolation kit (Miltenyi Biotec, Auburn, GER) (Purity around 95%). CD8+ naive T cells (CD8+CD25−CD62L+CD44low) were isolated from splenic cells of C57BL/6 or DBA/2 mice, by first staining with Biotin-conjugated (Biolegend): anti- B220, CD4a, CD11b, CD11c, CD25, CD49b, Ter-119, CD44, and then with Biotin beads (Miltenyi Biotec), using AutoMACSpro (Miltenyi Biotec) to negatively select CD8+ naive T cells (purity around 95%). Cells were cultured in 48-well plates and stimulated with anti-CD3/CD28-coated beads (one bead per five cells; Life Technologies, Carlsbad, CA, USA) in the presence of IL-2 (50 U/ml; R&D Systems, San Diego, CA, USA) with (CD4+/CD8+ iTreg) or without (CD8med) TGF-β1 (2 ng/ml; R&D Systems) for 3 days. After 3 days, CD4+/CD8+ iTreg and CD8med cells were harvested and the beads were removed, then cells were positively selected for CD103 (CD103+ around 90%) with Biotin-CD103 (Biolegend) and Biotin beads (Miltenyi Biotec) using AutoMACSpro (Miltenyi Biotec) (purity of CD8+CD103+ more than 95%); the same method was used to negatively select CD103 in CD8med (purity of CD8+CD103− more than 97%). nTreg cells were sorted by FACS using FACSAria™ (BD Biosciences) (purity of CD4+CD25+ more than 98%), expanded with anti-CD3/CD28-coated beads (one bead per three cells; Invitrogen) and IL-2 (300 U/ml; R&D Systems) for 3 days. A total of 300 U/ml IL-2 was renewed at day 2. After cultures, cells were harvested and beads removed with DynaMagTM (Life Technologies). RPMI 1640 medium supplemented with 100 U/ml penicillin, 100 mg/ml streptomycin, 10 mM HEPES (Gibco, Carlsbad, CA, USA), and 10% heat-inactivated FBS (ExCell Bio, SHH, CHN) was used for all cultures. Foxp3 expression was determined by flow cytometry.
The Selection of B Cells
B cells were positive selected from spleen cells of C57BL/6 mice with Biotin-B220 (Biolegend) and Biotin Beads (Miltenyi Biotec) using AutoMACSpro (Miltenyi Biotec). The purity of B cells was more than 99%. For determination of B cell proliferation, B cells were labeled with CFSE (Biolegend) before being cocultured with Tregs.
cGVHD Lupus Nephritis Model and Treg Adoptive Transfer
To establish the cGVHD lupus nephritis model (22, 58), single-cell suspensions of splenic cells from DBA/2 donors were prepared by gently grinding the spleens in a 40 μm filter (BD Falcon) with RPMI 1640. Then erythrocytes were removed with Red Blood Cell Lysing Buffer (Sigma-Aldrich), suspensions were washed twice in PBS and centrifuged for 5 min at 300 g, and then cells were resuspended in PBS. The B6D2F1 recipients were injected intravenously in 0 week with 80 × 106 of these viable cells in 0.3 ml PBS. Proteinuria was determined with Semi-quantitative Albustix paper (Gaoerbao, Guangzhou, China). The levels of serum IgG, dsDNA were determined by ELISA every 2 weeks. The mice that had proteinuria were selected to use as the lupus nephritis model. In weeks 3 and 8, 3 × 10⁶ CD8+CD103+ iTreg or CD8+CD103− med cells in 0.3 ml PBS were, respectively, transferred into cGVHD group. Control and model group mice received the same volume of PBS. There were 3–4 mice for each group in one experiment and experiments were repeated with similar results at least 3–4 times. We measured body weight and proteinuria every 2 weeks, the level of dsDNA, IgG in sera were also measured every 2 weeks.
Pathology and Immunofluorescence
At week 16, all mice were sacrificed for kidney pathology. The kidney tissues were processed for light and immunofluorescence microscopy. The light-microscopic slides were stained with hematoxylin–eosin, Masson, PAS or PASM, and used to calculate the activity and chronicity indices (59, 60) of different groups. Immunofluorescence slides were stained with rabbit anti-mouse IgG (Abcam, Cambs, UK) or rabbit anti-mouse C3 (Santa Cruz), and then stained with goat anti-rabbit IgG (Abcam), observed with fluorescence microscope (Axio Vert A1, ZEISS, Germany), and the MFI of glomerulus in different groups was calculated using ImageJ software (National Institutes of Health, USA).
In Vitro Suppression Assays
To examine the suppressive effect of Treg on B cell in vitro, B cells were stimulated with or without LPS (Escherichia coli 0111, 5 μg/ml, B4, Sigma-Aldrich, St. Louis, MO, USA) in the presence or absence of graded numbers of CD8+CD103− med or CD8+CD103+ iTreg. The ratio of T cells to B cells ranged from 1:4 to 1:1. In other experiments, B cells were also cocultured with CD8+CD103− med, CD8+CD103+ iTreg, CD4+ iTreg, or nTreg cells (the ratio of T: B was 1:2). For determination of the activation and differentiation of B cells, after 2 day coculture, CD69/CD86 (early activation index), CD25 (later activation index), and CD138 (differentiation index) were determined by flow cytometry. For determining the proliferation of B cells, fresh B cells were labeled with CFSE before coculture, and proliferation levels were judged by the intensity of CFSE dilution with flow cytometry after 3 days of coculture.
To determine the mode of suppressive action of the Treg, 0.4 μm Transwell plates (Corning, NY, USA) were used to separate CD8+CD103− med/CD8+CD103+ iTreg and B cells from direct contact during the coculture.
Apoptosis Assays
CD8+CD103+ iTregs were cocultured with B cells in the presence or absence of LPS (5 μg/ml, Sigma) for 16, 48, or 72 h. Then cells were collected and stained with Annexin V and propidium iodide (PI) using an Annexin V apoptosis detection kit (Sungene Biotech, Tianjin, China) following the manufacturer’s specifications. Both Annexin V and PI expression were measured by LSRFortossa™ flow cytometer (BD Biosciences), gated on B220+ cells.
Autoantibody Detection
To compare the IgG, IgM Abs production secreted by B cells in vitro, the supernatants were collected from abovementioned systems after 3 days of culture. For the in vivo autoantibody detection, mice were bled at the indicated time points, and sera were collected. IgG, IgM, and anti-dsDNA were, respectively, measured by IgG ELISA kit (eBioscience), IgM ELISA kit (eBioscience), and dsDNA ELISA kit (Alpha Diagnostic, San Antonio, TX, USA). All samples were performed with triplicate. Sera samples were diluted 1/100 for anti-dsDNA and 1/25,000 for measuring IgG.
Real-time PCR
Total RNA was extracted from B cells isolated from cGVHD lupus mice or normal control mice using the TRIzol reagent (Invitrogen) according to the manufacturer’s instructions. Reverse transcription (RT) of total RNA was carried out with PrimeScript™ RT reagent Kit (TaKaRa). cDNA Amplification was performed using a Roche LightCycler 480 Sequence Detection System (Roche) with Ssofast EvaGreen supermix (Bio-RAD). Primer sequence were as follows: GAPDH, 5′-GGTTGTCTCC TGCGACTTCA-3′ and 5′-TGGTCCAGGGTTTCTTACTCC-3′; TβRI,5′-CTATGCTGGTCCAGTCTTCG-3′and 5′-TGGTGAATGACAGTGCGGTTATGG-3′;IL-10Rα, 5′-AAGCAATGGACGGCATCATCTATGG-3′and 5′-AACTCGGAGATC CTTGAAGACTTGTTC-3′.
In Vivo Suppression Assays
B cells stimulated with LPS (5 μg/ml) for 24 h were then washed with PBS to remove LPS. These B cells were then cotransferred with CD8+CD103− med, CD8+CD103+ iTreg, or nTreg cells (the ratio of T:B was 1:2, 8 million B cells per mouse) into B6 Rag1−/− mice (6 weeks age). In addition, TβRI inhibitor (ALK5) (1 mg/kg, Sigma-Aldrich), anti-IL-10R (1 mg/kg, Biolegend), or DMSO (control for ALK5i) or cIgG (control for anti-IL-10R) were given to some groups mice by i.p. injection at days 0 and 2. The mice were sacrificed as indicated time points and splenic B cells were harvested and used to measure Ki-67 expression in cells gated on B220+ by flow cytometry. Then we carried out another in vivo suppression assay. The established cGVHD lupus nephritis mice with evident lupus nephritis were depleted of endogenous CD3+ T cells (26) with a single-dose 300 mg anti-mouse CD3 Ab (ExCell Bio, Shanghai, CHN), or with the isotype control, and endogenous B cells were stimulated with a single 10 μg dose of LPS (Sigma-Aldrich). Three days later, CD8+CD103− med, CD8+CD103+ iTregs, or nTregs were adoptively transferred to the mice with anti-CD3 Ab treatment. The percentages of plasma cells (CD138+) were detected and sera were collected 0, 1, and 2 weeks after cell transfer for IgG measurement.
Library Construction and Sequencing, Data Analysis
CD8+CD103− med, CD8+CD103+ iTreg, CD4+ iTreg (the Foxp3 expression in CD4+CD25+ iTreg more than 90%), and nTreg cells were prepared as described, and RNA was extracted using MiniBEST Universal RNA Extraction kit (TaKaRa, Japan). cDNA library was constructed using TruSeq Stranded Total RNA Sample Preparation Kit with Ribo-Zero Gold (Illumina, San Diego, CA, USA). The products were sequenced on an Illumina HiSeq platform using a pair-end 150bp mode, following the manufacturer’s instructions. Raw data were cleaned using fastx-toolkit v0.0.141 and cutadapt v1.7.1.2 The clean read-pairs were then aligned to the human reference genome (UCSC hg 19) by Tophat v2.1.1,3 read counts were calculated using HTSeq v0.6.1,4 and differential expression analysis was performed using DESeq.5 The RNA-seq data were submitted to NCBI SRA database, the accession number for RNA-seq is PRJNA419054 (SRP125726).
Statistical Analysis
Data were expressed as mean ± SEM unless otherwise indicated. Data were analyzed using the unpaired t tests for comparison between two groups or ANOVA for comparison among multiple groups as appropriate in SPSS. Comparison between two groups in multiple groups used Bonferroni. Differences were considered statistically significant when p < 0.05.
Ethics Statement
This study was carried out in accordance with the recommendations of Sun Yat-sen University for the Use and Care of Animals (Approval No. IACUC- DB-16-0909) and Milton S. Hershey Medical Center (IACUC No. 46887). The protocol was approved by the Sun Yat-sen University and Penn State University.
Author Contributions
AX and SZ designed the research topic and charge correspondence; HZ wrote the manuscript; HZ, YL, and ZX designed and carried out all the experiments; PL, HY, XZ, and JZ helped carrying out experiments; JC, SF, YT, and JL analyzed experimental results and analyzed data and developed analysis tools; JW provide assistance and guidance on experiments; NO provide manuscript modification.
Conflict of Interest Statement
The authors declare that the research was conducted in the absence of any commercial or financial relationships that could be construed as a potential conflict of interest.
Funding
This work was in part supported by the grants from the Project Supported by the National Key R&D Program of China (2017YFA0105800), National Natural Science Funds, China (81670641, 81400739, 81671611), Guangdong Natural Science Foundation (2014A030308005), Program from Guangdong Introducing Innovative and Entrepreneurial Teams (2016ZT06S252), Department of Science and Technology of Guangdong Province (2014A020212062), NIH (AR059103, NIH AR073409), and NIH STAR Award.
Supplementary Material
The Supplementary Material for this article can be found online at http://www.frontiersin.org/articles/10.3389/fimmu.2018.00035/full#supplementary-material.
Footnotes
References
1. Tsokos GC. Systemic lupus erythematosus. N Engl J Med (2011) 365(22):2110–21. doi:10.1056/NEJMra1100359
2. Saxena R, Mahajan T, Mohan C. Lupus nephritis: current update. Arthritis Res Ther (2011) 13(5):240. doi:10.1186/ar3378
3. Thong B, Olsen NJ. Systemic lupus erythematosus diagnosis and management. Rheumatology (2016) 56:i3–13. doi:10.1093/rheumatology/kew401
4. Pescovitz MD, Greenbaum CJ, Krause-Steinrauf H, Becker DJ, Gitelman SE, Goland R, et al. Rituximab, B-lymphocyte depletion, and preservation of beta-cell function. N Engl J Med (2009) 361(22):2143–52. doi:10.1056/NEJMoa0904452
5. Dorner T, Burmester GR. New approaches of B-cell-directed therapy: beyond rituximab. Curr Opin Rheumatol (2008) 20(3):263–8. doi:10.1097/BOR.0b013e3282f5e08d
6. Hampe CS. B cell in autoimmune diseases. Scientifica (Cairo) (2012) 2012:215308. doi:10.6064/2012/215308
7. Sakaguchi S, Yamaguchi T, Nomura T, Ono M. Regulatory T cells and immune tolerance. Cell (2008) 133(5):775–87. doi:10.1016/j.cell.2008.05.009
8. Lan Q, Fan H, Quesniaux V, Ryffel B, Liu Z, Zheng SG. Induced Foxp3(+) regulatory T cells: a potential new weapon to treat autoimmune and inflammatory diseases? J Mol Cell Biol (2012) 4(1):22–8. doi:10.1093/jmcb/mjr039
9. Mottet C, Uhlig HH, Powrie F. Cutting edge: cure of colitis by CD4+CD25+ regulatory T cells. J Immunol (2003) 170(8):3939–43. doi:10.4049/jimmunol.170.8.3939
10. Lan Q, Zhou X, Fan H, Chen M, Wang J, Ryffel B, et al. Polyclonal CD4+Foxp3+ Treg cells induce TGFbeta-dependent tolerogenic dendritic cells that suppress the murine lupus-like syndrome. J Mol Cell Biol (2012) 4(6):409–19. doi:10.1093/jmcb/mjs040
11. Scalapino KJ, Tang Q, Bluestone JA, Bonyhadi ML, Daikh DI. Suppression of disease in New Zealand Black/New Zealand White lupus-prone mice by adoptive transfer of ex vivo expanded regulatory T cells. J Immunol (2006) 177(3):1451–9. doi:10.4049/jimmunol.177.3.1451
12. Zheng SG, Wang JH, Koss MN, Quismorio F Jr, Gray JD, Horwitz DA. CD4+ and CD8+ regulatory T cells generated ex vivo with IL-2 and TGF-beta suppress a stimulatory graft-versus-host disease with a lupus-like syndrome. J Immunol (2004) 172(3):1531–9. doi:10.4049/jimmunol.172.3.1531
13. Zheng SG, Wang JH, Gray JD, Soucier H, Horwitz DA. Natural and induced CD4+CD25+ cells educate CD4+CD25- cells to develop suppressive activity: the role of IL-2, TGF-beta, and IL-10. J Immunol (2004) 172(9):5213–21. doi:10.4049/jimmunol.172.9.5213
14. Zheng SG, Wang J, Wang P, Gray JD, Horwitz DA. IL-2 is essential for TGF-beta to convert naive CD4+CD25- cells to CD25+Foxp3+ regulatory T cells and for expansion of these cells. J Immunol (2007) 178(4):2018–27. doi:10.4049/jimmunol.178.4.2018
15. Zheng SG, Wang J, Horwitz DA. Cutting edge: Foxp3+CD4+CD25+ regulatory T cells induced by IL-2 and TGF-beta are resistant to Th17 conversion by IL-6. J Immunol (2008) 180(11):7112–6. doi:10.4049/jimmunol.180.11.7112
16. Xu L, Kitani A, Fuss I, Strober W. Cutting edge: regulatory T cells induce CD4+CD25-Foxp3- T cells or are self-induced to become Th17 cells in the absence of exogenous TGF-beta. J Immunol (2007) 178(11):6725–9. doi:10.4049/jimmunol.178.11.6725
17. Kong N, Lan Q, Chen M, Wang J, Shi W, Horwitz DA, et al. Antigen-specific transforming growth factor β-induced Treg cells, but not natural Treg cells, ameliorate autoimmune arthritis in mice by shifting the Th17/Treg cell balance from Th17 predominance to Treg cell predominance. Arthritis Rheum (2012) 64(8):2548–58. doi:10.1002/art.34513
18. Kong N, Lan Q, Chen M, Zheng T, Su W, Wang J, et al. Induced T regulatory cells suppress osteoclastogenesis and bone erosion in collagen-induced arthritis better than natural T regulatory cells. Ann Rheum Dis (2012) 71(9):1567–72. doi:10.1136/annrheumdis-2011-201052
19. Gu J, Lu L, Chen M, Xu L, Lan Q, Li Q, et al. TGF-β-induced CD4+Foxp3+ T cells attenuate acute graft-versus-host disease by suppressing expansion and killing of effector CD8+ cells. J Immunol (2014) 193(7):3388–97. doi:10.4049/jimmunol.1400207
20. Liu Y, Lan Q, Lu L, Chen M, Xia Z, Ma J, et al. Phenotypic and functional characteristic of a newly identified CD8+ Foxp3- CD103+ regulatory T cells. J Mol Cell Biol (2014) 6(1):81–92. doi:10.1093/jmcb/mjt026
21. Bruijn JA, van Elven EH, Hogendoorn PC, Corver WE, Hoedemaeker PJ, Fleuren GJ. Murine chronic graft-versus-host disease as a model for lupus nephritis. Am J Pathol (1988) 130(3):639–41.
22. Ma J, Liu Y, Li Y, Gu J, Liu J, Tang J, et al. Differential role of all-trans retinoic acid in promoting the development of CD4+ and CD8+ regulatory T cells. J Leukoc Biol (2014) 95(2):275–83. doi:10.1189/jlb.0513297
23. Lipsky PE. Systemic lupus erythematosus: an autoimmune disease of B cell hyperactivity. Nat Immunol (2001) 2(9):764–6. doi:10.1038/ni0901-764
24. Sang A, Zheng YY, Morel L. Contributions of B cells to lupus pathogenesis. Mol Immunol (2014) 62(2):329–38. doi:10.1016/j.molimm.2013.11.013
25. Xu A, Liu Y, Chen W, Wang J, Xue Y, Huang F, et al. TGF-beta-induced regulatory T cells directly suppress B cell responses through a noncytotoxic mechanism. J Immunol (2016) 196(9):3631–41. doi:10.4049/jimmunol.1501740
26. Iikuni N, Lourenco EV, Hahn BH, La Cava A. Cutting edge: regulatory T cells directly suppress B cells in systemic lupus erythematosus. J Immunol (2009) 183(3):1518–22. doi:10.4049/jimmunol.0901163
27. Lim HW, Hillsamer P, Banham AH, Kim CH. Cutting edge: direct suppression of B cells by CD4+ CD25+ regulatory T cells. J Immunol (2005) 175(7):4180–3. doi:10.4049/jimmunol.175.7.4180
28. Zhao DM, Thornton AM, DiPaolo RJ, Shevach EM. Activated CD4+CD25+ T cells selectively kill B lymphocytes. Blood (2006) 107(10):3925–32. doi:10.1182/blood-2005-11-4502
29. Cazac BB, Roes J. TGF-beta receptor controls B cell responsiveness and induction of IgA in vivo. Immunity (2000) 13(4):443–51. doi:10.1016/S1074-7613(00)00044-3
30. Cai G, Nie X, Zhang W, Wu B, Lin J, Wang H, et al. A regulatory role for IL-10 receptor signaling in development and B cell help of T follicular helper cells in mice. J Immunol (2012) 189(3):1294–302. doi:10.4049/jimmunol.1102948
31. Williamson E, Bilsborough JM, Viney JL. Regulation of mucosal dendritic cell function by receptor activator of NF-kappa B (RANK)/RANK ligand interactions: impact on tolerance induction. J Immunol (2002) 169(7):3606–12. doi:10.4049/jimmunol.169.7.3606
32. Page G, Miossec P. RANK and RANKL expression as markers of dendritic cell-T cell interactions in paired samples of rheumatoid synovium and lymph nodes. Arthritis Rheum (2005) 52(8):2307–12. doi:10.1002/art.21211
33. Sakaguchi S, Sakaguchi N, Asano M, Itoh M, Toda M. Immunologic self-tolerance maintained by activated T cells expressing IL-2 receptor alpha-chains (CD25). Breakdown of a single mechanism of self-tolerance causes various autoimmune diseases. J Immunol (1995) 155(3):1151–64.
34. Zhou X, Kong N, Wang J, Fan H, Zou H, Horwitz D, et al. Cutting edge: all-trans retinoic acid sustains the stability and function of natural regulatory T cells in an inflammatory milieu. J Immunol (2010) 185(5):2675–9. doi:10.4049/jimmunol.1000598
35. Zhou X, Bailey-Bucktrout SL, Jeker LT, Penaranda C, Martinez-Llordella M, Ashby M, et al. Instability of the transcription factor Foxp3 leads to the generation of pathogenic memory T cells in vivo. Nat Immunol (2009) 10(9):1000–7. doi:10.1038/ni.1774
36. Wan YY, Flavell RA. Regulatory T-cell functions are subverted and converted owing to attenuated Foxp3 expression. Nature (2007) 445(7129):766–70. doi:10.1038/nature05479
37. Gao Y, Tang J, Chen W, Li Q, Nie J, Lin F, et al. Inflammation negatively regulates FOXP3 and regulatory T-cell function via DBC1. Proc Natl Acad Sci U S A (2015) 112(25):E3246–54. doi:10.1073/pnas.1421463112
38. Lu L, Lan Q, Li Z, Zhou X, Gu J, Li Q, et al. Critical role of all-trans retinoic acid in stabilizing human natural regulatory T cells under inflammatory conditions. Proc Natl Acad Sci U S A (2014) 111(33):E3432–40. doi:10.1073/pnas.1408780111
39. Zheng SG, Gray JD, Ohtsuka K, Yamagiwa S, Horwitz DA. Generation ex vivo of TGF-beta-producing regulatory T cells from CD4+CD25- precursors. J Immunol (2002) 169(8):4183–9. doi:10.4049/jimmunol.169.8.4183
40. Zheng SG, Wang JH, Stohl W, Kim KS, Gray JD, Horwitz DA. TGF-beta requires CTLA-4 early after T cell activation to induce FoxP3 and generate adaptive CD4+CD25+ regulatory cells. J Immunol (2006) 176(6):3321–9. doi:10.4049/jimmunol.176.6.3321
41. O’Connor RA, Floess S, Huehn J, Jones SA, Anderton SM. Foxp3+ Treg cells in the inflamed CNS are insensitive to IL-6-driven IL-17 production. Eur J Immunol (2012) 42(5):1174–9. doi:10.1002/eji.201142216
42. Floess S, Freyer J, Siewert C, Baron U, Olek S, Polansky J, et al. Epigenetic control of the foxp3 locus in regulatory T cells. PLoS Biol (2007) 5(2):e38. doi:10.1371/journal.pbio.0050038
43. Groux H, O’Garra A, Bigler M, Rouleau M, Antonenko S, de Vries JE, et al. A CD4+ T-cell subset inhibits antigen-specific T-cell responses and prevents colitis. Nature (1997) 389(6652):737–42. doi:10.1038/39614
44. Carrier Y, Yuan J, Kuchroo VK, Weiner HL. Th3 cells in peripheral tolerance. I. Induction of Foxp3-positive regulatory T cells by Th3 cells derived from TGF-beta T cell-transgenic mice. J Immunol (2007) 178(1):179–85. doi:10.4049/jimmunol.178.1.172
45. Hadley GA, Rostapshova EA, Gomolka DM, Taylor BM, Bartlett ST, Drachenberg CI, et al. Regulation of the epithelial cell-specific integrin, CD103, by human CD8+ cytolytic T lymphocytes. Transplantation (1999) 67(11):1418–25. doi:10.1097/00007890-199906150-00005
46. Lu L, Yu Y, Li G, Pu L, Zhang F, Zheng S, et al. CD8(+)CD103(+) regulatory T cells in spontaneous tolerance of liver allografts. Int Immunopharmacol (2009) 9(5):546–8. doi:10.1016/j.intimp.2009.01.021
47. Wang D, Yuan R, Feng Y, El-Asady R, Farber DL, Gress RE, et al. Regulation of CD103 expression by CD8+ T cells responding to renal allografts. J Immunol (2004) 172(1):214–21. doi:10.4049/jimmunol.172.1.214
48. Keino H, Masli S, Sasaki S, Streilein JW, Stein-Streilein J. CD8+ T regulatory cells use a novel genetic program that includes CD103 to suppress Th1 immunity in eye-derived tolerance. Invest Ophthalmol Vis Sci (2006) 47(4):1533–42. doi:10.1167/iovs.04-1454
49. Uss E, Rowshani AT, Hooibrink B, Lardy NM, van Lier RA, ten gBerge IJ. CD103 is a marker for alloantigen-induced regulatory CD8+ T cells. J Immunol (2006) 177(5):2775–83. doi:10.4049/jimmunol.177.5.2775
50. Braun A, Dewert N, Brunnert F, Schnabel V, Hardenberg JH, Richter B, et al. Integrin alpha(CD103) is involved in regulatory T-cell function in allergic contact hypersensitivity. J Invest Dermatol (2015) 135(12):2982–91. doi:10.1038/jid.2015.287
51. Dardalhon V, Schubart AS, Reddy J, Meyers JH, Monney L, Sabatos CA, et al. CD226 is specifically expressed on the surface of Th1 cells and regulates their expansion and effector functions. J Immunol (2005) 175(3):1558–65. doi:10.4049/jimmunol.175.3.1558
52. Budman DR, Merchant EB, Steinberg AD, Doft B, Gershwin ME, Lizzio E, et al. Increased spontaneous activity of antibody-forming cells in the peripheral blood of patients with active SLE. Arthritis Rheum (1977) 20(3):829–33. doi:10.1002/art.1780200312
53. Merino R, Iwamoto M, Fossati L, Izui S. Polyclonal B cell activation arises from different mechanisms in lupus-prone (NZB x NZW)F1 and MRL/MpJ-lpr/lpr mice. J Immunol (1993) 151(11):6509–16.
54. Jain S, Park G, Sproule TJ, Christianson GJ, Leeth CM, Wang H, et al. Interleukin 6 accelerates mortality by promoting the progression of the systemic lupus erythematosus-like disease of BXSB.Yaa mice. PLoS One (2016) 11(4):e0153059. doi:10.1371/journal.pone.0153059
55. Pasare C, Medzhitov R. Toll pathway-dependent blockade of CD4+CD25+ T cell-mediated suppression by dendritic cells. Science (2003) 299(5609):1033–6. doi:10.1126/science.1078231
56. Wallace DJ, Strand V, Merrill JT, Popa S, Spindler AJ, Eimon A, et al. Efficacy and safety of an interleukin 6 monoclonal antibody for the treatment of systemic lupus erythematosus: a phase II dose-ranging randomised controlled trial. Ann Rheum Dis (2017) 76(3):534–42. doi:10.1136/annrheumdis-2016-209668
57. Liu J, Chen D, Nie GD, Dai Z. CD8(+)CD122(+) T-cells: a newly emerging regulator with central memory cell phenotypes. Front Immunol (2015) 6:494. doi:10.3389/fimmu.2015.00494
58. Munaut C, Bergijk EC, Baelde JJ, Noel A, Foidart JM, Bruijn JA. A molecular biologic study of extracellular matrix components during the development of glomerulosclerosis in murine chronic graft-versus-host disease. Lab Invest (1992) 67(5):580–7.
59. Bates WD, Halland AM, Tribe RD, Rossouw DJ. Lupus nephritis. Part I. Histopathological classification, activity and chronicity scores. S Afr Med J (1991) 79(5):256–9.
Keywords: TGF-β1, CD8+CD103+ iTreg, lupus nephritis, immunosuppression, B cell responses
Citation: Zhong H, Liu Y, Xu Z, Liang P, Yang H, Zhang X, Zhao J, Chen J, Fu S, Tang Y, Lv J, Wang J, Olsen N, Xu A and Zheng SG (2018) TGF-β-Induced CD8+CD103+ Regulatory T Cells Show Potent Therapeutic Effect on Chronic Graft-versus-Host Disease Lupus by Suppressing B Cells. Front. Immunol. 9:35. doi: 10.3389/fimmu.2018.00035
Received: 14 September 2017; Accepted: 05 January 2018;
Published: 30 January 2018
Edited by:
Duncan Howie, University of Oxford, United KingdomReviewed by:
Lianjun Zhang, University of Lausanne, SwitzerlandAbdelhadi Saoudi, Institut National de la Santé et de la Recherche Médicale, France
Copyright: © 2018 Zhong, Liu, Xu, Liang, Yang, Zhang, Zhao, Chen, Fu, Tang, Lv, Wang, Olsen, Xu and Zheng. This is an open-access article distributed under the terms of the Creative Commons Attribution License (CC BY). The use, distribution or reproduction in other forums is permitted, provided the original author(s) and the copyright owner are credited and that the original publication in this journal is cited, in accordance with accepted academic practice. No use, distribution or reproduction is permitted which does not comply with these terms.
*Correspondence: Anping Xu, YW5weHVAMTYzLmNvbQ==;
Song Guo Zheng, c3poZW5nMUBobWMucHN1LmVkdQ==
†These authors have contributed equally to this work.