
- TNO Human Factors, Soesterberg, Netherlands
In this study, we investigated a Brain-Computer Interface (BCI) based on EEG responses to vibro-tactile stimuli around the waist. P300 BCIs based on tactile stimuli have the advantage of not taxing the visual or auditory system and of being potentially unnoticeable to other people. A tactile BCI could be especially suitable for patients whose vision or eye movements are impaired. In Experiment 1, we investigated its feasibility and the effect of the number of equally spaced tactors. Whereas a large number of tactors is expected to enhance the P300 amplitude since the target will be less frequent, it could also negatively affect the P300 since it will be difficult to identify the target when tactor density increases. Participants were asked to attend to the vibrations of a target tactor, embedded within a stream of distracters. The number of tactors was two, four or six. We demonstrated the feasibility of a tactile P300 BCI. We did not find a difference in SWLDA classification performance between the different numbers of tactors. In a second set of experiments we reduced the stimulus onset asynchrony (SOA) by shortening the on- and/or off-time of the tactors. The SOA for an optimum performance as measured in our experiments turned out to be close to conventional SOAs of visual P300 BCIs.
Introduction
A brain-computer interface (BCI), the first of which was developed by Vidal (1973 , 1977) , enables a user to communicate with the world through her or his brain signals alone. One of the most well-known BCIs was based on the P300 event-related potential (Farwell and Donchin, 1988 ). The P300 is a positive deflection in EEG that occurs around 300 ms after a target stimulus has been presented. In the P300 speller by Farwell and Donchin (1988) , rows and columns of a matrix consisting of letters were sequentially flashed in random order. Every time the row or column was flashed that contained the target symbol that the user wanted to spell, a P300 occurred. In this way, users could spell words. A P300-speller could be especially helpful for, and has been tested on paralyzed users (Hoffmann et al., 2008 ; Nijboer et al., 2008 ). More than two decades later, P300s are still popular to drive BCIs since they are relatively robust and easy to detect (Donchin et al., 2000 ).
The vast majority of P300 based BCIs use visual stimuli to elicit P300s. Recently (off-line) auditory P300 BCIs have also been developed (Sellers and Donchin, 2006 ; Furdea et al., 2009 ; Schreuder et al., 2010 ). The fundamental research on P300s focuses on visual and auditory stimulation. For BCI purposes tactile stimuli can be an interesting alternative. Tactile stimuli can be delivered by tactors that can be hidden under the user’s clothes, making the device go unnoticed to others. Using tactile stimuli will also keep the eyes and ears of the user free. Another important advantage is that a tactile P300 BCI can be used by patients with impaired vision or eye movements. This is especially relevant because one of the main potential groups of BCI users, patients with ALS, experience problems with their eyes as the disease progresses. A tap on your shoulder seems to automatically draw attention into the direction of the person tapping. Consistent with this, tactors applied around the waist have proven to be successful as navigation display, both for pedestrians (van Erp et al., 2005 ) and vehicle drivers (van Erp and van Veen, 2004 ) and can even result in better navigation performance than comparable visual displays. Tactile stimuli applied around the waist may therefore be a good choice for navigation BCIs (van Erp, 2005b , see also Thurlings et al., in press ). Users can focus their attention on the tactile stimulus that corresponds to the direction in which they want to move, possibly eliciting a useful P300 signal. Although tactile P300 BCIs have not been studied before, the feasibility of a BCI based on steady-state somatosensory evoked potentials has been demonstrated (Müller-Putz et al., 2006 ) and the tactile modality has been used as a BCI feedback channel (Chatterjee et al., 2007 ; Cincotti et al., 2007 ).
Previous research has shown that tactile stimuli can elicit P300s (Satomi et al., 1995 ; Ito and Takamatsu, 1997 ; Nakajima and Imamura, 2000 ). In these studies, electrical and mechanical stimuli were delivered to the hands and wrists using relatively long inter stimulus intervals (around 2 s in the study by Nakajima and Imamura). Obviously, for BCI purposes, short stimulus durations and inter stimulus intervals are required. The finding that P300s can be elicited by tactile stimulation of the hands does not guarantee that tactile stimulation of the torso easily elicits P300s as well because the sensitivity threshold and the spatial resolution of the torso is lower than that of the hands (Wilska, 1954 ).
Recently, we investigated whether quickly presented vibro-tactile stimuli at different locations around the waist can elicit robust P300s (Brouwer et al., submitted). We presented participants bursts of vibration delivered by one of eight tactors around the participants’ waist. Vibration duration was 188 ms and vibrations were interleaved by 438 ms breaks. In other conditions, we presented analogous visual stimuli consisting of flashed circles on a monitor in a schematic drawing of the tactor layout. Participants attended to the vibrations and/or flashes of the target tactor presented in a rapid stream of stimuli that also contained the seven distracters. The target was always the front tactor. In addition, this tactor physically stood out from the distracter: the distance to the distracters was larger than the distance between the distracters themselves, and the stimulus intensity of the target was stronger than of the distracters (in the tactile condition, a tactor above and below the target tactor vibrated simultaneously with the target, whereas in the visual condition the target circle was enlarged when flashed). By standing out from the distracters, the target probably drew attention by itself. The results demonstrated that the amplitudes of P300s elicited by tactile and visual stimuli depended on electrode site, but on the whole, they were equally high. Classification accuracy (how well an algorithm can identify the target stimulus) as determined off-line was also similar for visual and tactile stimuli. Whereas one or the other modality could probably have been favored by choosing different experimental parameters, we concluded that it is possible to elicit reliable P300s with quickly presented vibro-tactile stimuli around the waist.
The present study aimed at extending these proof-of-concept findings to a more realistic BCI setting. Whereas the oddball task as used in the previous experiment more or less guaranteed the attention of the participant to the target, it could not be generalized to a BCI where the user can choose the target. Furthermore, reliable online classification of tactile P300s remained to be demonstrated.
Besides tackling the issues mentioned above, we also wanted to explore the effect of varying the number of stimuli (i.e. the number of tactors around the waist) and the effect of varying stimulus timing on classification accuracy and rate of information transfer.
With a large number of tactors, it will be difficult to identify the individual targets because they will be close to the distracters. It has been shown that a low discriminability reduces the P300 amplitude (Comercho and Polich, 1999 ). On the other hand, with a large number of tactors, the target tactor is activated relatively infrequent, which positively affects the P300 (Polich et al., 1991 ), possibly via a longer target-to-target interval (Gonsalvez and Polich, 2002 ; Croft et al., 2003 ; Martens et al., 2009 ). In case of few tactors, the discriminability is high but the probability of target presentation is also high. In order to guide the development of a tactile BCI for navigation, we are interested in the relative importance or tradeoff of these potential effects on type classification accuracy and rate of information transfer within the context of our vibro-tactile stimuli around the waist.
Presenting stimuli quickly after each other shortens the time needed to go through the several different options. This means that the BCI could reach its decision as to which option the user wants to select sooner. However, increasing presentation speed will also likely decrease the quality of the P300 and decrease classification performance. Firstly, refractory effects could result in a lower P300 (Gonsalvez and Polich, 2002 ; Martens et al., 2009 ). Secondly, the quicker stimuli are presented, the more stimuli will be reflected in the EEG of the epochs analyzed by the classification algorithm, probably making successful classification harder (Martens et al., 2009 ). Finally, there will be a limit to presentation speed due to human limits in perception and attention. Several studies investigated the effect of different stimulus timing parameters on the P300. Generally, more time between stimuli seem to result in larger P300 amplitudes. However, this is not always found (Sellers et al., 2006 ) and the exact timing variable(s) underlying possible P300 effects are still not clear. In most studies about timing, the stimulus onset asynchrony (SOA) was varied, i.e. the time interval in between the start of one (non) target stimulus and the next (Farwell and Donchin, 1988 ; Polich et al., 1991 ; Allison and Pineda, 2006 ). Increasing the SOA while holding everything else constant will also increase the time interval between target stimuli (target-to-target interval), which may be the key variable affecting the P300 amplitude (Gonsalvez and Polich, 2002 ; Croft et al., 2003 ; Martens et al., 2009 ). Studies that show an increasing P300 with decreasing relative frequency of target presentation amongst non-targets (Polich et al., 1991 ; Cahill and Polich, 1992 ; Allison and Pineda, 2003 ; Sellers et al., 2006 ) also affect the target-to-target interval. Regardless of the specific underlying cause, decreasing the SOA (which decreases the target-to-target interval if the target probability stays the same) could cause a decrease in the P300 amplitude. Nonetheless, with the resulting shorter required time to go through the different user options, the rate of information transfer may increase. Many P300 BCI studies successfully used visual stimuli with SOAs ranging from as little as 125–500 ms (Farwell and Donchin, 1988 ; Serby et al., 2005 ; Sellers et al., 2006 ; Mell et al., 2008 ; Martens et al., 2009 ). We are interested in whether similar SOAs work for tactile stimuli as well.
In sum, the present study further evaluated (the feasibility of) a tactile P300 BCI. The tactile stimuli were delivered by several tactors placed around the waist. Classification for all experiments in this study was performed online, and the target stimulus did not stand out from the distracters. In Experiment 1, we varied the number of tactors. In Experiment 2 we reduced the SOA with respect to Experiment 1, both by reducing the vibration duration and the breaks in between vibration. Since it turned out that this was possible without sacrificing classification accuracy, we further reduced the SOA in Experiment 3.
Materials and Methods
Experiment 1
Participants
For all experiments described, participants were recruited from a pool of potential participants maintained by TNO Human Factors. Most of them study at a nearby university. In addition, some TNO interns (also students) participated. For each experiment, participants gave informed consent before the experiment started. Approval of the experiments was acquired from the local ethical committee.
Eleven healthy participants (six female) between 20 and 27 years old volunteered to participate in Experiment 1. None of them had participated in any other BCI experiment before.
Stimuli
Participants wore an adjustable vest over their clothes lined with 62 vibrating elements called tactors. For this study, we used one row of 12 equally spaced tactors around the participant’s waist, approximately at the height of the navel. Different combinations of tactors were used in different experimental conditions. Tactors vibrated successively with a vibration time (on-time) of 188 ms and breaks in between vibrations (off-time) of 438 ms. The tactors were custom built. They consisted of plastic cases with a contact area of 1 × 2 cm, containing 160 Hz vibrating motors. (TNO, The Netherlands, model JHJ-3; see van Erp et al. (2007) for comparable equipment and tactor layout). During the experiment, participants viewed a dimmed LCD (Dell 20 inch flatpanel, refresh rate 75 Hz) displaying instructions and a fixation cross. To prevent participants from using auditory cues, we played pink noise from two speakers, one placed left and the other placed right on the desk in front of the participant.
EEG Recording
EEG activity was recorded at the Fz, Cz, Pz, Oz, P3, P4, PO7 and PO8 electrode sites of the 10-20 system (Jasper, 1958 ) using electrodes mounted in an EEG cap (g.tec medical engineering GmbH). A ground electrode was attached to the forehead. The EEG electrodes were referenced to linked mastoid electrodes. The impedance of each electrode was below 5 kΩ. Data were sampled with a frequency of 256 Hz and filtered before storage by a 0.1-Hz high pass-, a 60-Hz low pass- and a 50-Hz notch filter (USB Biosignal Amplifier, g.tec medical engineering GmbH). The experiment (stimulus presentation and data recording) was controlled by a combination of custom built software and BCI2000 (Schalk et al., 2004 ).
Conditions
We used four experimental conditions called Two, Four, Six and FourPlus. Conditions Two, Four and Six refer to the number of equally distributed tactors used (see Figure 1 for a schematic indication of their location). In these conditions, the number of distracters was respectively one, three and five. The probability of target presentation decreased over these conditions (expected to enhance the P300), whereas the distance between the tactors and therewith the spatial discriminability between target and distracters decreased (expected to reduce the P300). The FourPlus condition served as a comparison for condition Four and Six. In this condition, the same tactors were used as in condition Four (see Figure 1 ), that is, the discriminability in Four and FourPlus was the same. However, by having the front and back tactor vibrate twice as often as the other tactors and by only designating the left and right tactors as targets, we made the target probability equal to that in condition Six. This will allow us to directly evaluate the relative importance of the factors discriminability and target probability: when discriminability plays a more important role, condition Four and FourPlus will produce similar results; when target probability is more important, condition Six and FourPlus will produce similar results.
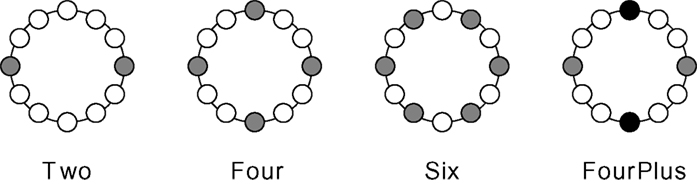
Figure 1. Schematic overview of the tactor layout (top view) in the different conditions of Experiment 1. The tactors used are colored gray whereas the inactive tactors are white. In the FourPlus condition, only the gray tactors could be targets. The black tactors vibrated twice as often as the gray tactors.
Design
The order of conditions was randomized for each participant. For every condition, there were three blocks: two training blocks followed by one test block. After the training blocks, a classification algorithm was applied to the collected data. The resulting model was used in the test block to give participants feedback about the tactor that the algorithm classified as the target. Aside from this feedback, the training and test blocks were the same (please note that training refers to training the classifier, not training the participant).
A block consisted of six sequences of stimuli. Each sequence started with one of the tactors being designated as the target. In condition Six, each of the tactors served as a target once in one block, starting with the front-left tactor and every time going to the next tactor counter-clockwise. In condition Four, the front target and the one counter clockwise served as targets again after the others had been a target. In condition Two and FourPlus, the left and right tactor were designated as a target three times each, alternating and starting with the tactor at the left.
Each of the six sequences consisted of activating each tactor in that condition (the target and the one, three or five distracters) 10 times, in random order. With a stimulus on-time of 188 ms and a stimulus off-time of 438 ms this resulted in mean target-to-target intervals of 1252 ms (condition Two), 2504 ms (condition Four) and 3756 ms (conditions Six and FourPlus).
Task and procedure
Before the experiment started, the complete procedure was explained to the participants, with their task being to concentrate on the target by counting the number of times it occurred, and to ignore the distracters. They were further asked to fixate the fixation cross displayed on the screen, to blink as little as possible and to limit any other movements during tactile stimulation.
Participants were seated comfortably in front of a monitor in a dimly lit, shielded room, wearing the tactile vest and an EEG electrode cap. During the recording, an analog noise generator produced pink noise in order to mask the sound of the tactors. The monitor always displayed a fixation cross. A sequence of stimuli started by the appearance of the word ‘focus’ on the monitor. Simultaneously, one of the tactors vibrated for 750 ms. This indicated the target for the upcoming sequence. Then, each of the tactors used in that condition vibrated 10 times in random order. The appearance of a dashed line (in the case of a training block) or the word ‘result’ (in the case of a test block) indicated the end of a sequence. In the latter case, one of the tactors vibrated for 750 ms simultaneously with the word ‘result’, to indicate to the participant which tactor the algorithm designated as being the target. Participants took 1- to 5-min breaks in between blocks.
Classification algorithm and analysis
Classification models were built during the experiment for each participant and each of the four conditions after two training blocks. Using step-wise linear discriminate analysis (SWLDA; Krusienski et al., 2006 ) a maximum of 60 features were extracted from the EEG data. The epochs used in the analysis started at stimulus onset and ended 797 ms afterwards. The data was down sampled with a factor of four. Each of the two training blocks yielded 60 target epochs (6 sequences × 10 repetitions) for the algorithm to be trained on. Since the number of distracters differed between conditions, the number of distracter epochs per block was 60 in condition Two, 180 in condition Four and 300 in condition Six and Four Plus.
For each participant and each condition, we determined classification accuracy as the proportion of targets that was correctly identified by the algorithm. However, the conditions differed with respect to chance level: 50% or three targets correct for each participant in condition Two, 25% or 1.5 target correct in condition Four, and 17% or one target correct in the other conditions. Therefore, we also present the results after correcting for chance by subtracting chance performance from the observed classification accuracy and normalizing the results.
Besides classification accuracy, BCI performance can also be expressed in terms of bitrate (Wolpaw et al., 2002 ; Serby et al., 2005 ). This is a measure of performance that represents the amount of information being communicated, taking into account the number of possible options, the classification accuracy and the time required to communicate the chosen option. The bitrate is calculated as follows (Serby et al., 2005 ):
Bitrate = BM
where M is the mean number of decisions per minute and B is the amount of bits communicated per decision:
B = log2N + Plog2P + (1 − P)log2[(1 − P)/(N − 1)].
N is the number of possible decisions and P is the accuracy probability. In this study P is the classification performance, without the correction for chance. N is set to 2, 4, 6 and 6 in conditions Two, Four, Six and FourPlus condition respectively. We computed bitrate for each subject and each condition, where we set bitrate to the theoretically maximal achievable bitrate of log2(N) × M if the target was correctly identified after each of the six sequences, and to 0 if performance was below chance level.
We used one-sample t-tests, repeated measures ANOVA and post-hoc Tukey tests to evaluate classification accuracy and bitrate.
Results
Figure 2 A shows the classification accuracy for each condition, together with an indication of chance performance. Figure 2 B presents the classification accuracy corrected for chance. The one-sample t-tests against zero on classification accuracy corrected for chance showed that classification accuracy was well above chance for all conditions (all p-values < 0.01). A repeated measures ANOVA showed no effect of condition [F(3,30) = 0.19, p = 0.90]. Figure 2 C shows the achieved bitrate for each condition. Again, a repeated measures ANOVA indicated no effect of condition [F(3,30) = 0.11, p = 0.95]. Table 1 displays timing characteristics of the conditions in the different experiments, the maximal achievable bitrate, the mean achieved bitrate, the number of participants that achieved the maximal achievable bitrate and finally the mean bitrate aligned to Experiment 2 (see General Discussion). In every condition of Experiment 1, at least one participant achieved the maximal achievable bitrate.
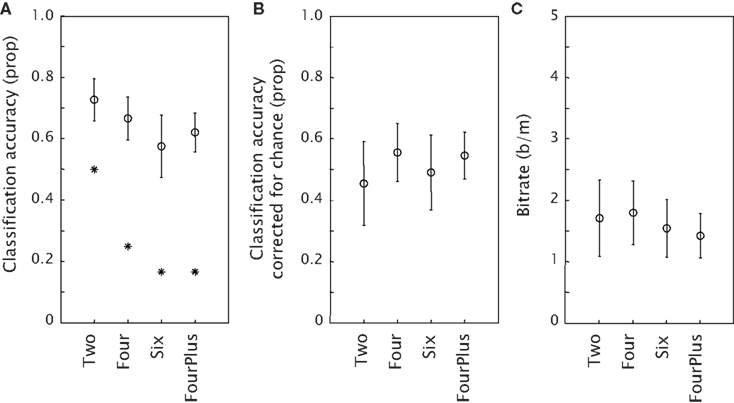
Figure 2. Mean performance of the classification model in the four conditions of Experiment 1 as expressed by classification accuracy, or proportion of targets correct (A), classification accuracy corrected for chance (B) and bitrate (C). The stars in (A) indicate chance performance. Error bars represent standard errors of the mean.
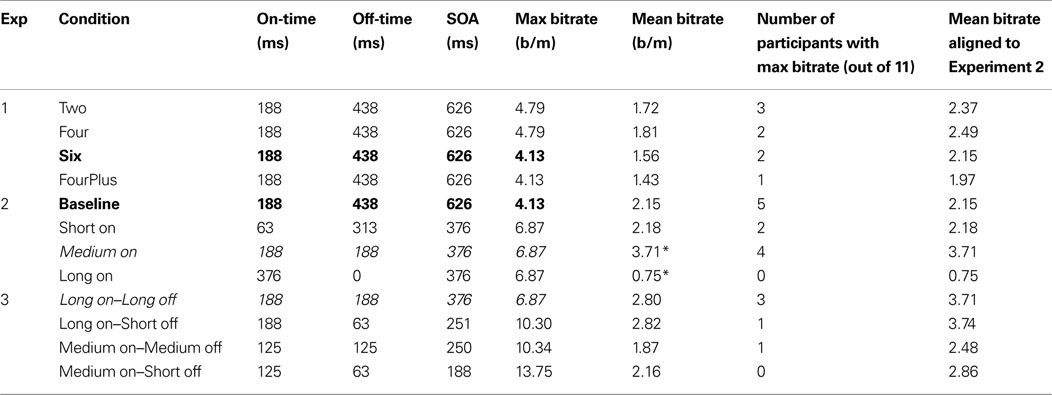
Table 1. Timing characteristics and bitrate results for the different conditions in the different experiments. The maximal bitrate is the bitrate that would be achieved when classification would always be correct. The mean bitrate is the bitrate achieved in the corresponding condition, averaged across participants. Asterisks indicate a significant difference within an Experiment as indicated by Tukey post-hoc tests. In the next column, the number of participants that achieved the maximal achievable bitrate is indicated. The last column presents the mean bitrate aligned to Experiment 2 (see General Discussion). Equal conditions in different experiments that serve to compare results between experiments are highlighted in bold and italic font.
Figure 3 depicts the mean Pz EEG samples from 200 ms before stimulus onset until 800 ms after, for each condition, and separately for target and standard presentations (solid and dashed curves respectively). Pz is a location where the P300 is usually strongly displayed (e.g. Ravden and Polich, 1999 ; Srinivasan, 2007 ). Clearly, a P300 is present in all conditions, even in condition Two, although the amplitude seems to be smaller. The P300 occured later than 300 ms after the start of the stimulus. This corresponds to many P300 studies that report this as well (e.g. Ravden and Polich, 1999 ; Bledowski et al., 2004 ; Gerson et al., 2006 ).
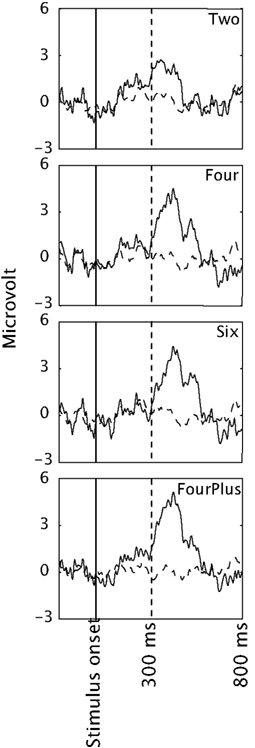
Figure 3. EEG averaged across participants and presented separately for targets (solid lines) and distracters (dashed lines) in the four conditions of Experiment 1. Only data from electrode Pz is presented.
Discussion
In a proof-of-concept study (Brouwer et al., submitted) we showed that an oddball tactile stimulus presented within a stream of tactile distracters around the waist elicited P300s that could be classified offline. Experiment 1 demonstrated that a BCI in which a tactile target is chosen among similar non-targets in an array around the waist is also feasible. Using different tactors as targets, online classification performance was well above chance for all conditions; ranging from an average of 58% correct for six alternatives to an average of 73% correct for two alternatives.
We did not find significant differences in classification accuracy corrected for chance between the conditions that varied in target-distracter discriminability and target probability. We expected at least to find a difference between the FourPlus condition and either the Four or the Six condition, or both. The FourPlus condition was expected to produce clearer P300s than the Four condition because of a more favorable target probability, and than the Six condition because of a more favorable discriminability. An explanation could be that in all conditions, target probability was low enough (or target-to-target interval long enough) and that the distinction between target and distracter was clear enough (van Erp, 2005a ), even though some participants remarked that in the Six condition, they sometimes experienced difficulties in distinguishing the target from adjacent distracters.
Since at least under these experimental conditions, different numbers of tactors do not affect classification accuracy and bitrate, the number of choices in a tactile BCI (two, four or six) can be directly tailored to the user application. For instance, it makes no sense to use a six tactor BCI for a yes–no choice.
The mean EEG signals suggested a slightly different picture than the classification results. The amplitude in condition Two seemed smaller than in the other conditions. The fact that this was not reflected in the classification accuracy could be because even though the amplitude was smaller, it was sufficiently different from that of the distracters. When fewer trials would have been used to train the classification algorithm, or fewer repetitions of the stimuli before the BCI decided on the target, there may have been a difference. Another possible reason for discrepancies between classification results and P300 amplitudes is that the classification model used different features than P300 amplitude only. From classification results obtained in experiments that are supposed to manipulate the P300, one cannot directly conclude anything about P300s without further looking at the signals and the features that a model uses. So-called P300 BCIs (including our own) probably often rely on non-P300 components in differentiating between targets and standards (Allison and Pineda, 2006 ; Brouwer et al., submitted).
Our main concern for this study was to build an online tactile BCI and to compare the effects of tactor number between conditions; not to optimize classification performance. Even so, the bitrate that we achieved is modest (see for example bitrates of online visual P300 BCIs in Table V of Serby et al. (2005) where bitrates range from 2.35 to 10.88 b/m). There are several possible reasons for our relatively low bitrate. We used only eight electrodes and each model was trained on a limited dataset obtained in 4–10 min. Even though the P300 signal itself is often referred to and liked for being relatively independent on training, most studies mentioned by Serby et al. (2005) used training times from seven sessions up to a few months. We expect that acquiring more data to train the model and leaving out less representative blocks (e.g. at the start of the experiment) could increase classification performance. Furthermore, there may be a difference between P300s elicited by visual and tactile stimuli. In virtually all visual P300 BCI paradigms, participants are allowed to fixate their eyes on the target. This will likely result in a perceptual difference between (fixated) target and (non-fixated) distracters as well as the possibility for the classification algorithm to distinguish between target and distracter on the basis of low-level visual evoked potentials (Treder and Blankertz, submitted). A strategy analogous to visual fixation is not possible in the tactile modality. A third reason for our modest bitrate may be the motivation of our (naïve) participants (Nijboer et al., 2009 ; Kleih et al., in press ). In our experimental procedure, we did not check whether participants counted the correct number of targets and the financial reward did not depend on performance. Introducing performance checks and possibly boosting their motivation by rewarding them for every correctly classified target stimulus may be ways to increase performance. Finally, our SOA of 626 ms is short compared to classic P300 studies, but long compared to P300 BCI studies, leaving a high bitrate unlikely (see Table 1 for maximal achievable bitrates).
In Experiment 2 we increased the maximal possible bitrate of the tactile P300 BCI by shortening the SOA. This was done by adjusting the stimulus on- and off-times by different amounts. Even though the effects of SOA and target-to-target interval on P300s and classification performance have been studied before (e.g. Farwell and Donchin, 1988 ; Serby et al., 2005 ; Allison and Pineda, 2006 ; Sellers et al., 2006 ; Martens et al., 2009 ; Mell et al., 2008 ), we did not encounter studies on the specific effect of stimulus on- and off-time. However, in a psychophysical discrimination study, varying these timing parameters produced differential effects (van Erp, 2005a ). Participants judged relative location of tactile stimuli. Whereas for vibration durations between 50 and 350 ms, vibration duration did not have a large effect on the discriminability, discriminability increased with increasing inter stimulus intervals in the range from 0 to 200 ms.
Experiment 2
Participants
Eleven healthy participants (four female) between 19 and 27 years old volunteered to participate in Experiment 2. None of them had participated in any other BCI experiment before.
Stimuli
The same vibro-tactile stimuli were used as in Experiment 1, except that the tactors were mounted in a belt rather than a vest. Taking the participants’ waist circumference into account, six tactors were positioned at equal distances from each other along the belt. All six tactors were used in all four experimental conditions. The vibrating on- and off-times differed between conditions as explained below. As in Experiment 1, participants viewed a dimmed LCD (Dell 20 inch flatpanel, refresh rate 75 Hz) displaying instructions and a fixation cross. Again, pink noise was played to mask auditory cues.
Conditions
In Experiment 2 we used four different settings of stimulus timing (see also Table 1 ). The on-time and off-time in the Baseline condition were the same as those used in Experiment 1 (188 ms on, 438 ms off), making this condition exactly equal to condition Six of Experiment 1. Besides this Baseline condition, we had three other experimental conditions in which the SOA was reduced to 376 ms as compared to the 626 ms of the Baseline condition. Referring to stimulus on-time, these are called Short On (63 ms on, 313 ms off), Medium On (188 ms on, 188 ms off) and Long On (376 ms on, 0 ms off).
Design
The design was almost the same as in Experiment 1. The order of conditions was randomized for each participant. For every condition, there were two blocks to train the classification algorithm followed by one block to test it. Again, a block consisted of six sequences of stimuli. Each sequence started with one of the tactors being designated as the target. Each of the tactors served as a target once in one block, starting with the front-left tactor and every time going to the next tactor counter-clockwise. Each of the six sequences consisted of activating each tactor in that condition (the target and the five distracters) 10 times, in pseudo random order. One tactor could not vibrate twice in a row, since that would have resulted in one long vibration for the Long On condition.
The recording materials, task and procedure and Classification algorithm and analysis were exactly the same as in Experiment 1.
Results
Figure 4 A shows the classification accuracy for each condition, together with an indication of chance performance (1/6 for all conditions). Figure 4 B presents the classification accuracy corrected for chance. One-sample t-tests against zero showed that the classification was above chance in all conditions (all p-values 0.01 or lower). A repeated measures ANOVA showed an effect of condition [F(3,30) = 4.51; p < 0.01]. Tukey post-hoc tests indicated that both the Baseline condition and the Medium On condition differed significantly from the Long On condition (p < 0.01 in both cases). The difference between the Short On condition and the Medium On condition approached significance (p = 0.06). Figure 4 C shows the bitrate and Table 1 the numerical values. A repeated measures ANOVA indicated an effect of condition [F(3,30) = 5.03; p < 0.01]. Tukey post-hoc tests showed that bitrate was significantly higher in the Medium On than in the Long On condition (p < 0.01). In every condition of Experiment 2, except for the Long On condition, at least two participants achieved the maximal achievable bitrate. For the Baseline and Medium On condition the number of participants achieving the maximal score was even 5 and 4 respectively.
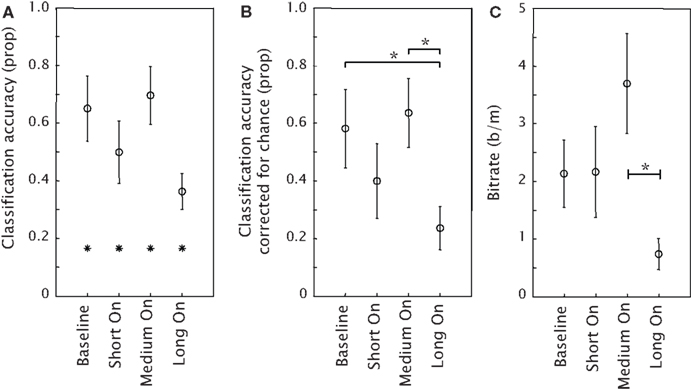
Figure 4. Mean performance of the classification model in the four conditions of Experiment 2 as expressed by classification accuracy (A), classification accuracy corrected for chance (B) and bitrate (C). The stars in (A) indicate chance performance. Error bars represent standard errors of the mean.
Figure 5 depicts the mean Pz EEG samples from 200 ms before stimulus onset until 800 ms after, for each condition, and separately for target and distracter presentations (solid and dashed curves respectively). In line with the classification accuracy, the P300 for the Long On condition seems relatively small.
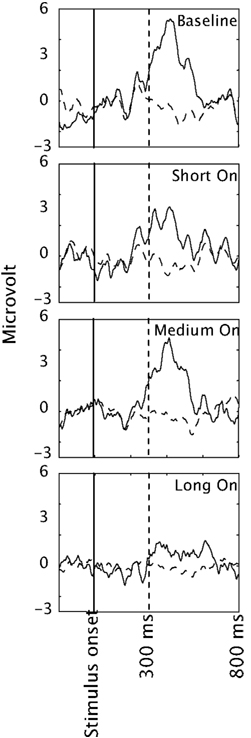
Figure 5. EEG averaged across participants and presented separately for targets (solid lines) and distracters (dashed lines) in the four conditions of Experiment 2. Only data from electrode Pz is presented.
Discussion
The results of Experiment 2 showed that we can reduce the SOA from 626 to 376 ms without reducing classification accuracy. The resulting bitrate could be increased by a factor 1.7 compared to the timing settings of Experiment 1. However, consistent with van Erp (2005a) it is critical how the SOA was reduced. The Medium On condition resulted in a significantly higher classification accuracy and bitrate than the Long On condition even though the SOA was 376 ms in both conditions. Because in our design, SOA and target-to-target interval were coupled, this means that target-to-target interval is at least not the only factor determining classification accuracy and bitrate.
Since shortening the SOA from 626 to 376 did not necessarily decrease classification accuracy and could result in a higher bitrate, we further reduced the SOA in Experiment 3.
Experiment 3
Participants
Eleven healthy participants (six female) between 19 and 32 years old volunteered to participate in Experiment 2. None of them had participated in any other BCI experiment before.
Conditions
As a baseline we took the best condition of Experiment 2, which was Medium On (188 ms on, 188 ms off) and called it Long On–Long Off in this experiment. We then reduced either the on-time or the off-time arriving at the following conditions: Long On–Short Off (188 ms on, 63 ms off), Medium On–Medium Off (125 ms on, 125 ms off) and Medium On–Short Off (125 ms on, 63 ms off). Table 1 summarizes the details of the four different conditions in Experiment 3. As in Experiment 2, there were six tactors in all conditions.
The stimuli, recording materials, design, task and procedure and classification algorithm and analysis were exactly the same as in Experiment 2.
Results
Figure 6 A shows the classification accuracy for each condition and Figure 6 B the classification accuracy corrected for chance. One-sample t-tests against zero on classification accuracy corrected for chance revealed that in all conditions except for the Medium On – Short Off condition (p = 0.052), classification performance was significantly higher than chance (p = 0.046 for Medium On–Medium Off, other p-values < 0.01). A repeated measures ANOVA showed a significant effect of condition [F(3,30) = 2.98; p < 0.047]. Tukey post-hoc tests did not show significant differences, although the differences between condition Long on–Long Off compared to conditions Medium On–Medium Off and Medium On–Short Off approached significance (p = 0.10 and p = 0.07 respectively). Figure 6 C shows the bitrate and Table 1 the numerical values. A repeated measures ANOVA indicated no effect of condition on bitrate [F(3,30) = 0.57; p = 0.64]. In every condition of Experiment 3, except for the Medium On–Short Off condition, at least one participant achieved the maximal achievable bitrate.
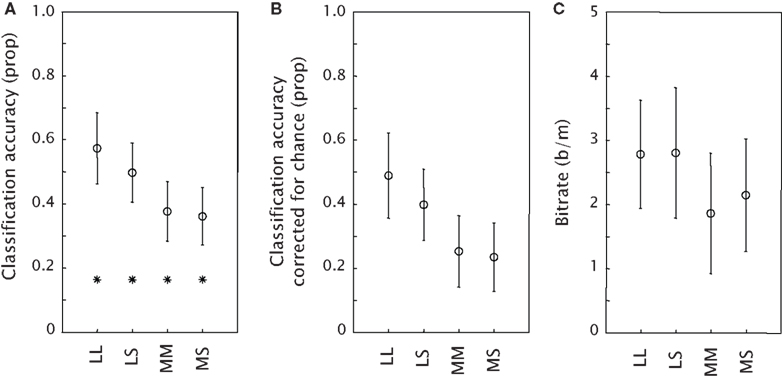
Figure 6. Mean performance of the classification model in the four conditions of Experiment 2b as expressed by classification accuracy (A), classification accuracy corrected for chance (B) and bitrate (C). The stars in (A) indicate chance performance. LL: Long On–Long Off, LS: Long On–Short Off, MM: Medium On–Medium Off, MS: Medium On–Short Off. Error bars represent standard errors of the mean.
Figure 7 depicts the mean Pz EEG for each condition. The mean P300 amplitudes seem roughly consistent with classification accuracy.
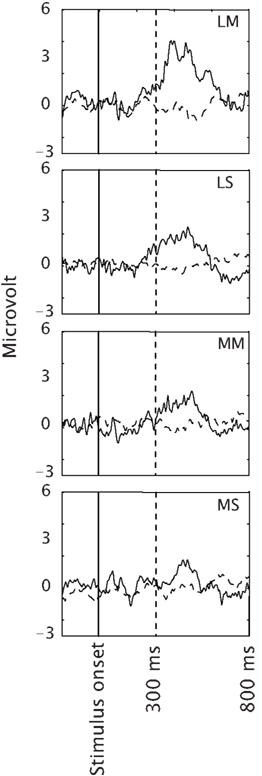
Figure 7. EEG averaged across participants and presented separately for targets (solid lines) and distracters (dashed lines) in the four conditions of Experiment 2b. LL: Long On–Long Off, LS: Long On–Short Off, MM: Medium On–Medium Off, MS: Medium On–Short Off. Only data from electrode Pz is presented.
Discussion
By shortening on- and off-time further in Experiment 3, we did not achieve a further increase in classification accuracy or bitrate. The best results in terms of bitrate tended to be reached in the Long On–Long Off condition (188 ms on-time and 188 ms off-time, i.e. an SOA of 376 ms) and the Long On–Short Off condition (188 ms on time and 63 ms off-time, i.e. an SOA of 251 ms). The accuracy tended to decrease in this latter condition. Thus, reducing the SOA below the baseline of 376 did not have a positive effect in our experiment.
The trend in the pattern of our results did not replicate that of the psychophysical study by van Erp (2005a) which indicated that off-time affected performance more strongly than on-time. Here we find similar results for conditions with equal on-times and varying off-times and different results for conditions with different on-times and equal off-times. Thus, the tendency is rather that on-time has a stronger effect than off-time. Apparently the task used in van Erp (2005a) , judging relative locations of tactile stimuli, does not directly generalize to the present task (counting tactile stimuli at a particular absolute location on the body).
General Discussion and Conclusions
The bitrate results of the three experiments are summarized in Table 1 . It is difficult to compare bitrates across experiments directly, since different participants were recorded in each experiment and (as commonly found in BCI experiments) there are large individual differences in performance. In Experiment 2, participants scored on average 1.4 higher than in Experiment 1 as can be seen when comparing the Six and the Baseline condition. Comparing the Medium On condition to the Long On–Long Off condition shows that participants of Experiment 2 scored about 1.3 times better than the participants of Experiment 3. To facilitate a rough direct comparison between experiments, we computed the mean bitrate aligned to the results of Experiment 2 (last column Table 1 ). For this, the mean bitrates of Experiment 1 were multiplied by 1.4 and the mean bitrates of Experiment 3 were multiplied by 1.3. With this rough procedure we neglect possible effects that the context created by the other conditions in the experiment could exert. Even though the conditions are technically exactly the same, the Long On–Long Off condition in Experiment 3 could be experienced as relatively easy compared to the Medium On condition in Experiment 2 which again might have influenced the results. Keeping in mind that most differences between bitrates were not significant, the highest bitrates for our setup were achieved with an on-time of 188 and an off-time between 63 and 188 ms (where the accuracy tended to be slightly higher for the longer off-time). Lengthening the off-time did not result in a higher bitrate (compare Baseline versus Medium On in Experiment 2) since higher classification accuracies could not outweigh the longer presentation time. Reducing the on-time below 188 ms while keeping the off-time the same tended to reduce the bitrate (compare Long On–Short Off and Medium On–Short Off). The only room for further bitrate improvement through manipulation of stimulus timing parameters might be reducing the off-time below 63 ms for an on-time of 188. However, an off-time of 0 ms seems too short as indicated by the particularly bad result of the Long On condition in Experiment 2. Off-times close to 0 ms may result in spatio-temporal interactions like apparent motion (Kirman, 1974a ) and therewith impede performance.
The optimal timing parameters as found in Experiment 2 and 3 using six tactors cannot be generalized to other numbers of tactors without further investigation. When using less tactors, ERP overlap effects could cause a decrease in performance for short on- and off-times. On the other hand, stimuli delivered by few evenly spaced tactors are less vulnerable to spatio-temporal interactions compared to many tactors (Kirman, 1974b ).
The achieved levels of classification accuracy in this study are not high enough for most potential applications. There are several ways to possibly improve performance (both accuracy and bitrate) of our tactile P300 BCI. As already mentioned, more electrodes and training could help though obviously, these adjustments have their downsides. We also mentioned increasing user motivation. In contrast to many studies, we recorded from naïve, paid participants. The classification technique that we used may not be optimal, as well as the number of stimulus repetitions before the algorithm made a decision on the attended tactor. The optimal number of repetitions, the optimal timing parameters and classification technique may best be determined for each individual user. With respect to the number of repetitions this may be done relatively easy online – that is, the BCI could stop presenting stimuli and make a decision once it is ‘certain enough’ about the user’s choice. Another potential way to (massively) increase bitrate is to adjust stimulus presentation so that different combinations of options are presented simultaneously, much like the traditional P300 speller. For example, think of adding other information than, in our navigation example, the desired movement direction such as the desired step size by adding a dimension like torso height. In this way, different heights in torso location would act as P300 speller rows while different locations around the waist act as columns. Finally, an intelligent way of presenting options, e.g. by taking into account how likely different options are to be chosen and omitting presentation of impossible options (which will be often present in navigation applications) will certainly improve accuracy and bitrate.
This study demonstrated the feasibility of a BCI controlled by EEG responses, elicited by attending to specific vibro-tactile stimuli around the waist. Tactile stimuli are particularly useful in BCIs for patients who cannot fixate or move their eyes well, or who completely lost visual perception. For other users the advantages of a tactile BCI are that it allows them to look and listen to their environment rather than to stimuli necessary for controlling the BCI, and that tactile stimuli can easily go unnoticed by others. Although a BCI with tactile stimuli to for example the hands and wrists could work as well (Satomi et al., 1995 ; Ito and Takamatsu, 1997 ; Nakajima and Imamura, 2000 ) and would be suitable for some applications, tactile stimuli around the waist are specifically appropriate for navigation displays (van Erp and van Veen, 2004 ; van Erp et al., 2005 ) and thus a logical choice for navigation BCIs. We tested stimulus configurations consisting of two, four and six equally distributed tactors and did not find a significant difference in classification performance. This suggests that all of these numbers of tactors could be used in such a BCI. With optimal on-times of about 188 ms and off-times of 63–188 ms, SOAs are similar to those of many visual BCIs.
Conflict of Interest Statement
Part of this study was previously published as a proceeding paper at the 4th International BCI Workshop and training course in Graz: A.-M. Brouwer, J. B. F. Erp (2008) A tactile P300 BCI and the optimal number of tactors: Effects of target probability and discriminability.
Acknowledgments
Thanks to Thijs Rinsma, Fabio Aloise, Antoon Wennemers, Febo Cincotti and Marieke Thurlings. This work was supported by the Dutch Smartmix project BrainGain.
References
Allison, B. Z., and Pineda, J. A. (2003). ERPs evoked by different matrix sizes: implications for a brain computer interface (BCI) system. IEEE Trans. Neural Syst. Rehabil. Eng. 11, 110–113.
Allison, B. Z., and Pineda, J. A. (2006). Effects of SOA and flash pattern manipulations on ERPs, performance, and preference: implications for a BCI system. Int. J. Psychophysiol. 59, 127–140.
Bledowski, C., Prvulovic, D., Hoechstetter, K., Scherg, M., Wibral, M., Goebel, R., and Linden, D. E. J. (2004). Localizing P300 generators in visual target and distracter processing: a combined event-related potential and functional magnetic resonance imaging study. J. Neurosci. 24, 9353–9360.
Cahill, J. M., and Polich, J. (1992). P300, probability, and introverted/extroverted personality types. Biol. Psychol. 33, 23–35.
Chatterjee, A., Aggarwal, V., Ramos, A., Acharya, S., and Thakor, N. V. (2007). A brain-computer interface with vibrotactile biofeedback for haptic information. J. Neuroeng. Rehabil. 4, art. 40.
Cincotti, F., Kauhanen, L., Aloise, F., Palomäki, T., Caporusso, N., Jylänki, P., Mattia, D., Babiloni, F., Vanacker, G., Nuttin, M., Marciani, M. G., and Millán, J. D. R. (2007). Vibrotactile feedback for brain-computer interface operation. Comput. Intell. Neurosci. art. 48937.
Comercho, M. D., and Polich, J. (1999). P3a and P3b from typical auditory and visual stimuli. Clin. Neurophysiol. 110, 24–30.
Croft, R. J., Gonsalvez, C. J., Gabriel, C., and Barry, R. J. (2003). Target-to-target interval versus probability effects on P300 in one- and two-tone tasks. Psychophysiology 40, 322–328.
Donchin, E., Spencer, K. M., and Wijesinghe, R. (2000). The mental prosthesis: assessing the speed of a P300-based brain-computer interface. IEEE Trans. Neural Syst. Rehabil. Eng. 8, 174–179.
Farwell, L. A., and Donchin, E. (1988). Talking off the top of your head: a mental prosthesis utilizing event-related brain potentials. Electroencephalogr. Clin. Neurophysiol. 70, 510–523.
Furdea, A., Halder, S., Krusienski, D. J., Bross, D., Nijboer, F., Birbaumer, N., and Kübler, A. (2009). An auditory oddball (P300) spelling system for brain-computer interfaces. Psychophysiology 46, 617–625.
Gerson, A. D., Parra, L. C., and Sajda, P. (2006). Cortically coupled computer vision for rapid image search. IEEE Trans. Neural Syst. Rehabil. Eng. 14, 174–179.
Gonsalvez, C. L., and Polich, J. (2002). P300 amplitude is determined by target-to-target interval. Psychophysiology 39, 388–396.
Hoffmann, U., Vesin, J.-M., Ebrahimi, T., and Diserens, K. (2008). An efficient P300-based brain–computer interface for disabled subjects. J. Neurosci. Methods 167, 115–125.
Ito, J. A., and Takamatsu, N. B. (1997). Somatosensory event-related potentials in healthy subjects: single trial analysis and averages of reaction time terciles. J. Psychophysiol. 11, 2–11.
Jasper, H. (1958). Report of the committee on methods of clinical examination in electroencephalography. Electroencephalogr. Clin. Neurophysiol. 10, 370–375.
Kirman, J. H. (1974a). Tactile apparent movement: the effects of interstimulus onset interval and stimulus duration. Percept. Psychophys. 15, 1–6.
Kirman, J. H. (1974b). Tactile apparent movement: the effects of number of stimulators. J. Exp. Psychol. 103, 1175–1180.
Kleih, S. C., Nijboer, F., Halder, S., and Kübler, A. (in press). Motivation modulates the P300 amplitude during brain-computer interface use. Clin. Neurophysiol.
Krusienski, D. J., Sellers, E. W., Cabestaing, F., Bayoudh, S., McFarland, D. J., Vaughan, T. M., and Wolpaw, J. R. (2006). A comparison of classification techniques for the P300 Speller. J. Neural Eng. 3, art. 7.
Martens, S. M. M., Hill, N. J., Farquhar, J., and Schölkopf, B. (2009). Overlap and refractory effects in a brain-computer interface speller based on the visual P300 event-related potential. J. Neural Eng. 6 026003, 9.
Mell, D., Bach, M., and Heinrich, S. P. (2008). Fast stimulus sequences improve the efficiency of event-related potential P300 recordings. J. Neurosci. Methods 174, 259–264.
Müller-Putz, G. R., Scherer, R., Neuper, C., and Pfurtscheller, G. (2006). Steady-state somatosensory evoked potentials: suitable brain signals for brain-computer interfaces? IEEE Trans. Neural Syst. Rehabil. Eng. 14, 30–37.
Nakajima, Y., and Imamura, N. (2000). Relationships between attention effects and intensity effects on the cognitive N140 and P300 components of somatosensory ERPs. Clin. Neurophysiol. 111, 1711–1718.
Nijboer, F., Halder, S., Furdea, S. A., Kleih, S. C., Koene, R. A., and Kubler, A. (2009). The Effect of Monetary Reward and Stimulus Modality on Motivation and Performance in a Brain-Computer Interface Paradigm Based on Event-Related Potentials. Poster presented at the 2009 Annual Meeting of the Society for Neuroscience. 2009 Neuroscience Meeting Planner. Program No. 289.14. Chicago, IL: Society for Neuroscience, 2009.
Nijboer, F., Sellers, E. W., Mellinger, J., Jordan, M. A., Matuz, T., Furdea, A., Halder, S., Mochty, U., Krusienski, D. J., Vaughan, T. M., Wolpaw, J. R., Birbaumer, N., and Kübler, A. (2008). A P300-based brain-computer interface for people with amyotrophic lateral sclerosis. Clin. Neurophysiol. 119, 1909–1916.
Polich, J., Brock, T., and Geisler, M. W. (1991). P300 from auditory and somatosensory stimuli: probability and inter stimulus interval. Int. J. Psychophysiol. 11, 219–223.
Ravden, D., and Polich, J. (1999). On P300 measurement stability: habituation, intra-trial block variation, and ultradian rhythms. Biol. Psychol. 51, 59–76.
Satomi, K., Horai, T., Kinoshita, Y., and Wakazono, A. (1995). Hemispheric asymmetry of event-related potentials in a patient with callosal disconnection syndrome: a comparison of auditory, visual and somatosensory modalities. Electroencephalogr. Clin. Neurophysiol. 94, 440–449.
Schalk, G., McFarland, D. J., Hinterberger, T., Birbaumer, N., and Wolpaw, J. R. (2004). BCI2000: a general purpose brain-computer interface (BCI) system. IEEE Trans. Biomed. Eng. 51, 1034–1043.
Schreuder, M., Blankertz, B., and Tangermann, M. (2010). A new auditory multi-class brain-computer interface paradigm: spatial hearing as an informative cue. PLoS ONE 5(4): e9813. doi:10.1371/journal.pone.0009813.
Sellers, E. W., and Donchin, E. (2006). A P300-based brain-computer interface: initial tests by ALS patients. Clin. Neurophysiol. 117, 538–548.
Sellers, E. W., Krusienski, D. J., McFarland, D. J., Vaughan, T. M., and Wolpaw, J. R. (2006). A P300 event-related potential brain-computer interface (BCI): the effects of matrix size and inter stimulus interval on performance. Biol. Psychol. 73, 242–252.
Serby, H., Yom-Tov, E., and Inbar, G. F. (2005). An improved P300-based brain-computer interface. IEEE Trans. Neural Syst. Rehabil. Eng. 13, 89–98.
Srinivasan, N. (2007). Cognitive neuroscience of creativity: EEG based approaches. Methods 42, 109–116.
Thurlings, M. E., van Erp, J. B. F., Brouwer, A.-M., and Werkhoven, P. J. (in press). “EEG-Based navigation from a human factors perspective,” in (B + H)CI: the Human in Brain-Computer Interfaces and the Brain in Human-Computer Interaction, eds D. S. Tan and A. Nijholt (Springer LNCS).
van Erp, J. B. F. (2005a). “Vibrotactile spatial acuity on the torso: effects of location and timing parameters,” in Proceedings of Worldhaptics (Los Alamitos, CA: IEEE Computer Society), 80–85.
van Erp, J. B. F. (2005b). Presenting directions with a vibro-tactile torso display. Ergonomics 48, 302–313.
van Erp, J. B. F., Eriksson, L., Levin, B., Carlander, O., Veltman, J. E., and Vos, W. K. (2007). Tactile cueing effects on performance in simulated aerial combat with high acceleration. Aviat. Space Environ. Med. 78, 1128–1134.
van Erp, J. B. F., and van Veen, H. A. H. C. (2004). Vibrotactile in-vehicle navigation system. Transp. Res. Part F Traffic Psychol. Behav. 7, 247–256.
van Erp, J. B. F., van Veen, H. A. H. C., Jansen, C., and Dobbins, T. (2005). Waypoint navigation with a vibrotactile waist belt. ACM Trans. Appl. Percept. 2, 106–117.
Vidal, J. J. (1973). Towards direct brain–computer communication. Annu. Rev. Biophys. Bioeng. 2, 157–180.
Vidal, J. J. (1977). Real-time detection of brain events in EEG. IEEE Proc. 65, 633–664 [Special issue on Biological Signal Processing and Analysis].
Wilska, A. (1954). On the vibrational sensitivity in different regions of the body surface. Acta Physiol. Scand. 31, 285–289.
Keywords: BCI, BMI, tactile, P300, somatosensory
Citation: Brouwer A-M and van Erp JBF (2010) A tactile P300 brain-computer interface. Front. Neurosci. 4:19. doi: 10.3389/fnins.2010.00019
Received: 08 February 2010;
Paper pending published: 27 February 2010;
Accepted: 29 March 2010;
Published online: 06 May 2010
Edited by:
Gert Pfurtscheller, Graz University of Technology, AustriaReviewed by:
Dennis J. McFarland, Wadsworth Center for Laboratories and Research, USAAndrea Kubler, University of Wuerzburg, Germany
Copyright: © 2010 Brouwer and van Erp. This is an open-access article subject to an exclusive license agreement between the authors and the Frontiers Research Foundation, which permits unrestricted use, distribution, and reproduction in any medium, provided the original authors and source are credited.
*Correspondence: Anne-Marie Brouwer, TNO Human pFactors, Kampweg 5, 3769 ZG Soesterberg, Netherlands. e-mail: anne-marie.brouwer@tno.nl