1
Laboratoire de Physiologie de la Perception et de l’Action, Collège de France, Centre National de la Recherche Scientifique, Paris, France
2
Institut des Systèmes Intelligents et de Robotique, Université Pierre et Marie Curie, Centre National de la Recherche Scientifique, Paris, France
3
Center for Neuroscience, Swammerdam Institute for Life Sciences, Faculty of Science, Universiteit van Amsterdam, Amsterdam, Netherlands
During Slow Wave Sleep (SWS), cortical activity is dominated by endogenous processes modulated by slow oscillations (0.1–1 Hz): cell ensembles fluctuate between states of sustained activity (UP states) and silent epochs (DOWN states). We investigate here the temporal structure of ensemble activity during UP states by means of multiple single unit recordings in the prefrontal cortex of naturally sleeping rats. As previously shown, the firing rate of each PFC cell peaks at a distinct time lag after the DOWN/UP transition in a consistent order. We show here that, conversely, the latency of the first spike after the UP state onset depends primarily on the session-averaged firing rates of cells (which can be considered as an indirect measure of their intrinsic excitability). This latency can be explained by a simple homogeneous process (Poisson model) of cell firing, with sleep averaged firing rates employed as parameters. Thus, at DOWN/UP transitions, neurons are affected both by a slow process, possibly originating in the cortical network, modulating the time course of firing for each cell, and by a fast, relatively stereotyped reinstatement of activity, related mostly to global activity levels.
During Slow Wave Sleep (SWS), cortical activity spontaneously fluctuates between periods of sustained activity, the ‘UP’ state, and periods of generalized silence, the ‘DOWN’ state. These are the so-called slow oscillations (0.1–1 Hz) of the neocortex (Steriade et al., 1993
). Slow oscillations are generated within the neocortex (Contreras et al., 1996
; Timofeev et al., 2000
; Cash et al., 2009
) and support global and long-scale synchronization of cortical activity (Amzica and Steriade, 1995
; Massimini et al., 2004
; Dang-Vu et al., 2008
; Nir et al., 2008
). After several tens of ms in the DOWN state, the cortical network reinitiates its activity. The reinstatement and maintenance of the UP state are network processes, depending on the effectiveness of synaptic transmission (Sanchez-Vives and McCormick, 2000
; Massimini and Amzica, 2001
; Reig et al., 2006
) as well as on ionic currents which endow neurons with intrinsic bistability (Metherate and Ashe, 1993
; Mao et al., 2001
; Timofeev et al., 2001
; Bazhenov et al., 2002
; Compte et al., 2003
). At the beginning of an UP state it is likely that activity spreads from a ‘core’ of particularly excitable cells (Sanchez-Vives and McCormick, 2000
; MacLean et al., 2005
; Kang et al., 2008
) to the rest of the cortical network. High synaptic bombardment would then keep the network in an active state thereafter (Compte et al., 2003
; Destexhe et al., 2003
; Steriade, 2006
) by means of recurrent excitatory feedback (Contreras et al., 1996
; Holcman and Tsodyks, 2006
).
The pattern of cell discharges at these times is informative about the intrinsic structure, connectivity and recent activity patterns of the local cortical network. Indeed, in sensory cortices, at the transition from a DOWN to an UP state, principal cells have been shown to fire in sequential order which is preserved for long periods in both anesthetized and naturally sleeping rats (Luczak et al., 2007
). Understanding sequential cell firing in the neocortex and its functional implications has been the objective of several experimental studies (Prut et al., 1998
; Villa et al., 1999
; Ikegaya et al., 2004
; Euston et al., 2007
; Ji and Wilson, 2007
). Computational models posit that this would underlie key mechanisms of information processing and transmission (Abeles, 1991
; Destexhe and Contreras, 2006
). Such precise temporal sequences might arise during spontaneous activity (Mao et al., 2001
; Kang et al., 2008
). Moreover, it has been recently shown that cell assemblies formed in the medial prefrontal cortex (PFC) of awake rats are transiently reactivated during SWS in the form of transient co-firing of subgroups of cells, most often near the beginning and end of the UP state (Peyrache et al., 2009
). Nevertheless, the temporal structure of firing in UP states and its determinants are still largely unexplored.
Here we study cell firing order at UP state initiation by analyzing neuronal ensemble data from the prefrontal cortex of naturally sleeping rats, concentrating on the global cortical dynamics giving rise to the UP state, and the activation of information-carrying activity patterns which may play a role in memory trace consolidation (Buzsaki, 1989
; Sutherland and McNaughton, 2000
).
Furthermore, from a methodological point of view, it is important to be able to rigorously characterize sequential neural activity during UP states, and the underlying mechanisms. Previously, two principal approaches have been used to detect activation sequences: first, sequences are constructed on the basis of the firing time of the first spike of the respective neurons. Sequences are then detected with a statistical matching algorithm based on the order of spike occurrence only, inspired by genome analysis techniques (Lee and Kesner, 2002
; Ikegaya et al., 2004
; Ji and Wilson, 2007
). Alternatively, sequences are derived from peak firing times in the time series of binned spike counts (Euston et al., 2007
; Luczak et al., 2007
). Based on this ‘center of mass’ of firing (the expected value of the time of firing for each cell, computed over the time distribution of spike events in the initial phase of the UP state), the cells are then ordered from the first to the last, and a template sequence is constructed, which is then matched over the binned spike counts during sleep to detect repeated instances of the same sequence.
We examine here whether the differences between these two approaches are mere methodological subtleties, or if they reflect different physiological processes which must be considered separately. This is accomplished by comparing the latencies of the first spike at the DOWN/UP transition and the peak firing times with characteristic properties for each cell in ensembles of prefrontal neurons.
Animals
Four Long-Evans (pigmented) male rats (René Janvier, Le Genest-St-Isle, France) weighing 250–300 g at arrival, were handled and pre-trained. All experiments were in accord with institutional (CNRS Comité Opérationnel pour l’Ethique dans les Sciences de la Vie), international (NIH guidelines) standards and legal regulations (Certificate No. 7186, French Ministère de l’Agriculture et de la Pêche) regarding the use and care of animals. The experimental methods have been described in detail in a previous paper analyzing other aspects of these data (Peyrache et al., 2009
). Briefly, for surgical implantation of the recording devices, rats were anesthetized with intramuscular xylazine (Rompun, 0.1 ml), and intra-peritoneal pentobarbital (35 mg/kg). A drive containing seven tetrodes (bundles of four 13 μm diameter fine wires: six for recording and one reference) was attached to the skull and implanted above the right medial prefrontal cortex (AP 3.5–5 mm, ML 0.5–1.5 mm). Four of these tetrodes targeted the superficial layers and three the deep layers of the medial bank of the cortex, and were gradually lowered during the experiment, sampling different dorso-ventral levels in successive sessions. A separate micro-drive containing three tetrodes was targeted to the ventral hippocampus (AP −5.0 mm, ML 5.0 mm). These tetrodes recorded hippocampal local field potentials (LFPs). For LFP recordings, a screw implanted on the occipital bone above the cerebellum served as a reference. Data analyzed here pertain to recordings during two rest periods of 25–30 min before and after performance of a behavioral task on a Y-maze as described in (Peyrache et al., 2009
).
Histology
At the end of the experiments, a small electrolytic lesion was made by passing a small cathodal DC current (20 μA, 10 s) through each recording tetrode to mark the location of its tip. The rats were then deeply anesthetized with pentobarbital. Intracardial perfusion with saline was followed by 10% (v/v) formalin saline. Histological sections were stained with cresyl violet. The electrode tracks were reconstructed, verifying that the recording sites were in the prelimbic cortex, or in exceptional cases, in the dorsal part of the infralimbic cortex. The day-to-day positions of the electrodes were reconstructed by interpolating the histologically assessed positions of the marking lesions with the history of electrode descents (Peyrache et al., 2009
).
SWS Detection
SWS was automatically detected via power spectrograms of cortical and hippocampal LFPs computed for each sleep session with bins of 1 s. Power in the cortical delta band (1–4 Hz), hippocampal theta band (5–10 Hz), cortical spindles (10–20 Hz) and speed of head motion were clustered with a K-means algorithm. Clusters corresponding to high values of delta and spindle powers, and to negligible head movements, were considered to correspond to SWS. Successive SWS clusters occurring within intervals of less than 1 min were merged and finally resulting time intervals of SWS briefer than 10 s were discarded.
Data Preprocessing
For single unit activity discrimination, the first three principal components of the energy-normalized waveforms were computed from spike waveforms for the four tetrodes, generating a 12-dimensional vector describing each spike. Those vectors were analyzed by the KlustaKwik (Harris et al., 2000
) clustering program. The resulting classification was manually refined using the Klusters interface. Following (Bartho et al., 2004
; Hazan et al., 2006
), putative pyramidal cells and interneurons were identified on the basis of the neuron’s spike width. The half peak width distribution was strongly bimodal, with the narrowest spikes corresponding to interneurons, thus allowing a reliable discrimination between the two cell types. According to the estimates in (Bartho et al., 2004
) this method yields 0% false positives and less than 10% false negatives in classifying interneurons.
DOWN and UP State Identification
Following Luczak et al. (2007)
, DOWN states were defined as periods of at least 60 ms where at most one spike could be detected from each of the simultaneously recorded cells. The DOWN to UP state transition was taken to occur when the detected spikes in the following 60 ms included at least 10% of the cells, and at least 25% of the cells each fired at least one spike in the following 200 ms.
SWS Epoch Selection
SWS epochs were included in the analysis if at least 20 putative pyramidal cells were detected and the number of detected DOWN states exceeded 100.
Poisson Process
The probability of occurrence of a single event for a homogeneous (or Poisson) process of rate λ after a delay Δt is given by the following formula:
Center of Mass Calculations
For each UP state, and for each cell, we computed the average time of arrival for the spikes fired in the time window starting at UP state onset and terminating 500 ms later:
where Nspikes is the number of spikes emitted by the cell in that window.
Then, for each cell, we took the Center of Mass as the mean Δtmean across all UP states.
Multiple tetrode recordings in rat PFC were carried out during natural SWS, and DOWN and UP states were detected as described above. In a total of 18 recording days, 30 experimental recording sessions were carried out prior to and/or after training sessions in the Y maze (Peyrache et al., 2009
). Because of the short duration of the sleep episodes, rats virtually never reached deep SWS (stage 4) or REM for periods long enough to be detected. In total, 887 putative pyramidal cells and 100 interneurons were recorded from the prelimbic (PL) and occasionally from the infralimbic (IL) subdivision of the medial PFC. (Because electrodes were not moved after each session, some cells may have been recorded more than once. In successive pairs of sleep sessions on a given day the same neurons were likely recorded, since the recordings were separated by an active waking period of less than an hour and cluster discrimination was carried out on data combined from the three sessions.) For this analysis, only pyramidal cells with an average firing rate exceeding 1 Hz during SWS were retained (N = 559), because less active cells were inactive during many UP state episodes.
Dynamics of Rate Modulation at UP State Onset
Each cell in sensory cortex reaches a characteristic peak activity at a constant and reliable time lag after UP state onset (Luczak et al., 2007
). Prior to comparative analyses, it was important to first confirm this in PFC. Thus spike trains of putative pyramidal cells recorded during natural SWS were realigned to the UP state onset to obtain Peri-Event Time Histograms (PETH). Figure 1
A shows the PETH for the pyramidal cells from all recording sessions, sorted by increasing center of mass (that is, the mean spike time in the PETH is the average over the first 500 ms of all UP states in the session, as depicted in the schematic of Figure 1
B). The PETH were smoothed with a 30-ms wide gaussian window. At the beginning of UP states firing rates varied among different neurons: each cell fired maximally at a unique but reliable time lag after UP state onset. As a measure of reliability of activity sequences, PETH centers of mass were significantly correlated with the across UP states mean time of spike occurrence (Pearson’s correlation, r = 0.75, p < 10−10, thus explaining ∼55% of the variance) (Figure 1
C). On the other hand, PETH centers of mass were more moderately correlated with cell average firing rates (Pearson’s correlation, r = 0.15, p < 0.001), explaining only 2.5% of the variance. Thus, we confirm and extend the result of (Luczak et al., 2007
) to prefrontal cortex, showing that measures of activity re-initiation at different time scales provide profoundly different pictures.
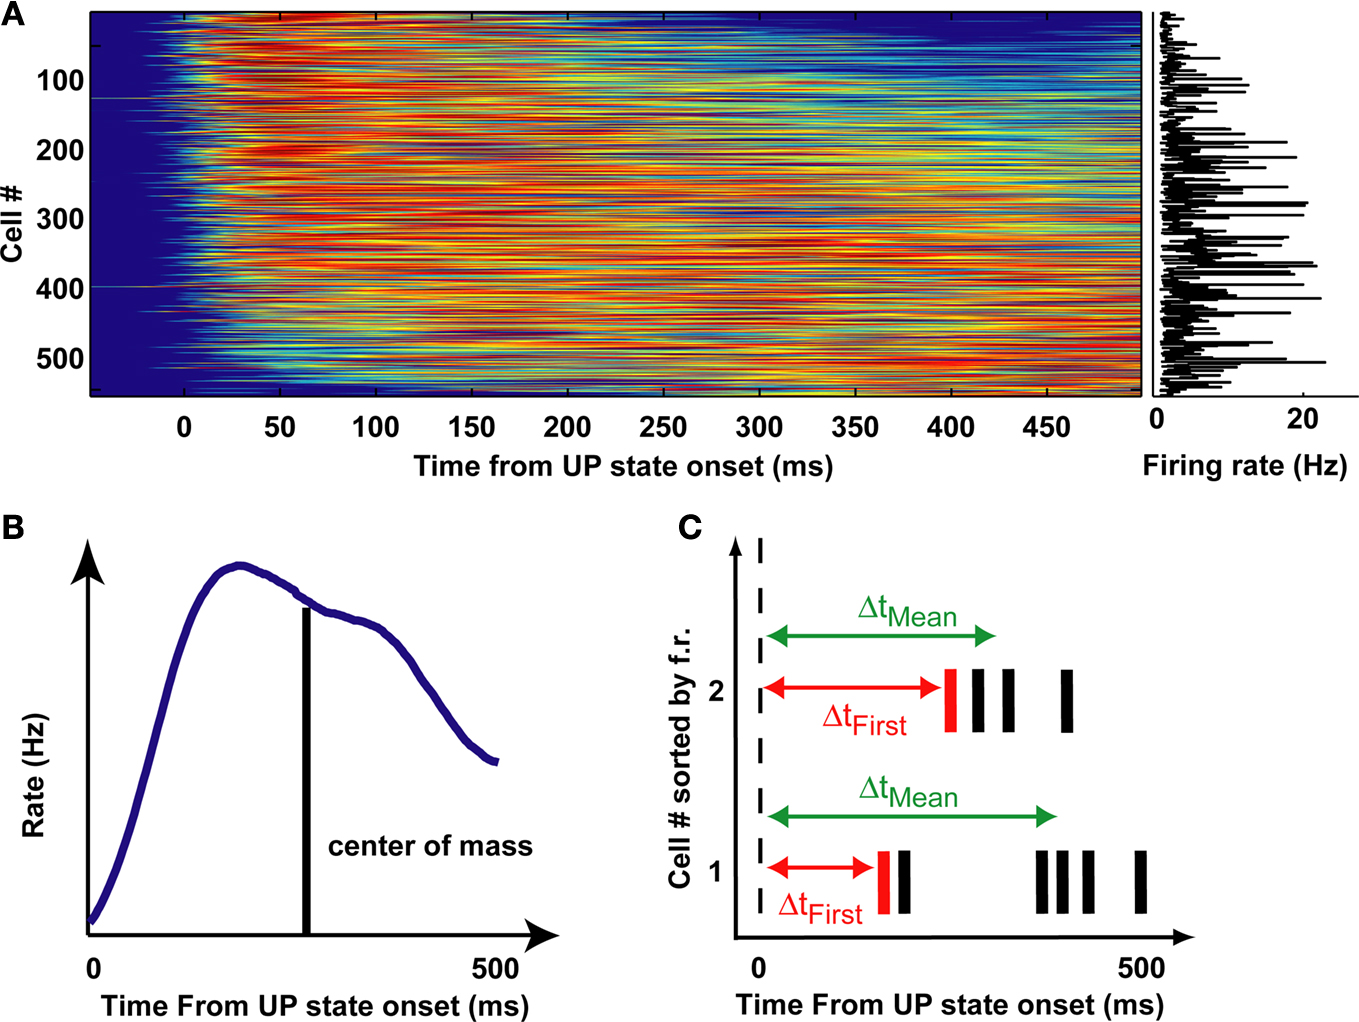
Figure 1. Sequential activation of averaged activity at UP state onset. (A) PETHs of pyramidal cells, triggered on DOWN/UP state transitions from all recording sessions, sorted by their center of mass in the first 500 ms after UP state onset. Color displays normalized PETH magnitude (red: high, blue: low). (B) Center of mass is computed as the mean of the interval between the transition and all spikes emitted by the neuron in the first 500 ms after UP state onset. (C) Schematics of the computation of first spike times (Δtfirst) and mean spike times (Δtmean) at each UP state onset.
At UP-State Onset, Firing Re-Initiation Depends on Global Activity Levels
The rate of increase in firing rate, as measured by the mean spike time after UP state onset, assesses how fast the neuron is recruited in UP state dynamics. As demonstrated above, different cells responded with peak activity at respectively distinct latencies after the UP state began.
To examine whether this inhomogeneity concerned neuronal activity from the very beginning of the UP state, we examined the distribution of the latencies of the first spike after UP state onset across cells. This was defined, for each cell, as the average delay from the UP state onset until the first spike, if any. For this analysis, only UP states with durations of at least 1 s were taken into account. Then the latency distribution for each cell was compared to that expected from a homogeneous Poisson process with the session-averaged firing rate taken as the rate parameter.
Thus, in this model, the probability distribution of the time of occurrence of the first spike is a function only of the firing rate (see Materials and Methods). Each row of color-coded matrices in Figure 2
A (presented for one session in the left panel and for all analyzed cells to the right) is the Poisson probability density function for the first spike, given the firing rates shown on the ordinate. At UP state onset, cells tend to fire the first spike according to the maximum likelihood prediction given for the homogeneous Poisson process. Indeed, first spike latencies and Interspike Spike Interval (ISI, the inverse of the mean firing rate) showed a strong correlation (Pearson’s correlation r = 0.835, p < 10−10).
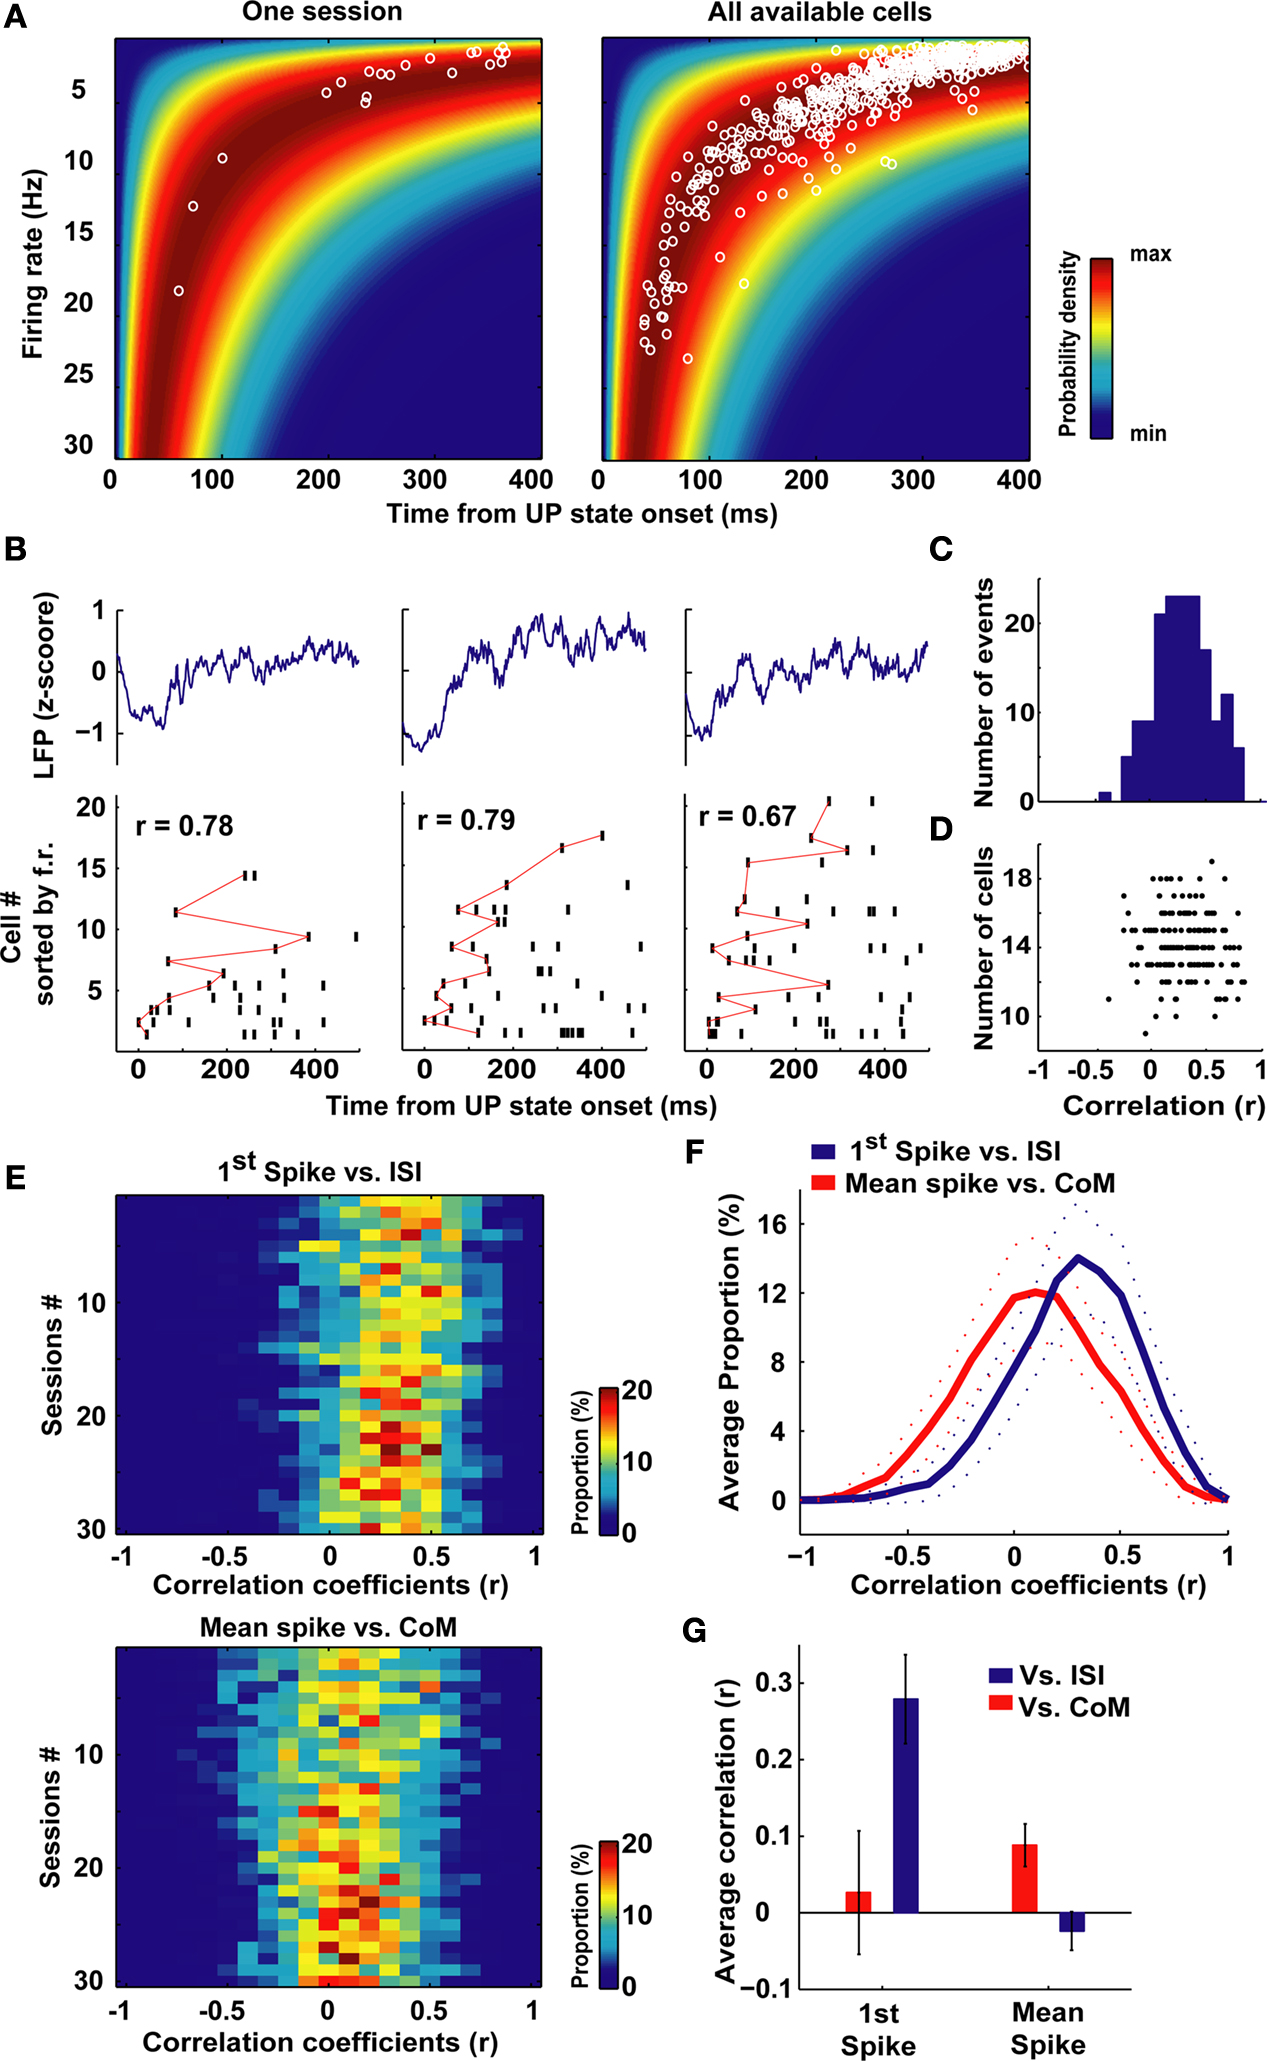
Figure 2. Cell global activity level is associated with the order of firing. (A) The color plot indicates relative probability density of first spike occurrence for a homogeneous Poisson process as a function of time elapsed (abscissa) and rate of the process. The superimposed white circles show, for each neuron, the session-averaged firing rate during SWS (ordinate) plotted against the averaged latency of first spike occurrence at UP state onset (abscissa). Data are from a representative session (left) and from all cells analyzed (right). (B) Representative raster plots of population firing triggered at three different UP state onsets in a single recording session. LFPs appear above. Cells were sorted, from top to bottom, according to increasing values of session-averaged firing rate. Red lines connect first spikes. (C) Distribution across all recorded neurons of the Spearman correlation coefficients between first spike latencies and average firing rates for all the UP state onsets in which spikes were recorded from each cell. Abscissa is same as (D). (D) Correlation coefficients were not significantly dependent on the number of cells involved in each sequence (r = −0.08, p > 0.05, Pearson correlation). (E) Distributions of the correlation coefficients for first spike latency versus average ISI (left) and mean spike latency versus PETH centers of mass (CoM, right) across all sessions (N = 30). In both cases, for all sessions, the correlations were significantly greater than zero (p < 0.05, t-test). (F) Averages of the distributions displayed in (E), dotted lines display envelope of SD. (G) Average correlation coefficients of the first spike (left), or the mean spike (right) time vs. session-averaged ISI and spike center-of-mass (CoM). The two correlations shown in detail in panels (E,F) were the only two significant and positive ones. There was also a small significant, negative correlation between mean spike latencies and firing rate. Note that the correlation of first spike occurrence versus firing rates is three to four times higher than mean spike times versus PETHs center of mass. Error bars display SD.
This observation has a profound impact on interpreting the sequences of first spikes of the respective cells that are recorded following each DOWN to UP state transition. Several studies have reported sequences of firing in cortical cells (Prut et al., 1998
; Villa et al., 1999
; Ikegaya et al., 2004
) to be related to specific behavior or sensory inputs. Also reliable sequences were observed during sleep, replaying temporal patterns recorded during immediately previous experience. By examining individual DOWN to UP state transitions, we could also observe repeated sequential patterns. Such transitions are shown from three transitions in the same ensemble of PFC cells in Figure 2
B. In these raster plots, cells are sorted (from top to bottom) by increasing average firing rate during the SWS epochs. This representation of the data highlights that in each case these neurons fired in reliable sequences following UP state onset. To assess the relation between the order in these sequences and the firing rate of each unit, the Spearman correlation coefficients (r) between cells’ first spike latencies (Δtfirst in the scheme of Figure 1
C), and the inverse of their average firing rate were computed. Thus this amounts to ranking the cells from the most to the least active throughout the session as a sort of ‘template’ for first-spike sequences. For each DOWN to UP state transition this led to a coefficient r which quantified the relation between latencies and ISIs. This analysis was carried out for UP states which lasted longer than 500 ms, and in which more than one-third of all cells fired at least one spike. The distribution of r for an example session is plotted in Figure 2
C. The average of r was 0.35, which is significantly greater than zero (N = 161, t-test, p < 10−10) and thus the latency of onset of the first spike is indeed correlated with average firing rate. The correlation coefficients were independent of the number of cells which were taken into account in each UP state (r = −0.08, p > 0.05, Pearson correlation N = 10–18; Figure 2
D).
Thus, these two ways of defining firing sequences at the onset of UP states appear to concern two different dynamic phenomena: first spike latency is heavily biased by the average firing rate during SWS, whereas mean time of spike occurrence Δtmean is not. These two methods suggest alternative predictors of neuronal activity time course following the initiation of each UP state event: (inverse) firing rate and PETH center of mass. The two predictors were each correlated with different aspects of UP state dynamics: average firing rates correlated with first spike latency (and only weakly with mean spike times, Δtmean in the schematic of Figure 1
C) while the PETH center of mass was strongly correlated with mean spike time. (This is intuitive since PETH peaks are directly related to average mean spike times.) The distributions of r for these two comparisons (Figure 2
E) were significantly greater than zero (t-test, p < 0.05) for all of the sessions. Moreover, the average correlation coefficients of all sessions were not different from zero for the comparison ‘first spike time versus PETHs center of mass’ and negative for the comparison ‘mean spike time versus ISI’ (Figure 2
G), possibly reflecting a tendency for low-firing cells to fire at the beginning of the UP state only, while high-firing cells fire throughout the UP state. Nevertheless, as suggested by the rightward shift of the averaged distributions shown in Figure 2
F, first spike sequences are better explained (p < 0.05, t-test, all sessions) by average firing rates than mean spike times by PETH centers of mass (Figure 2
F) as the average correlation are three to four times higher in the former than in the latter condition. Moreover, these two distributions were significantly different (Kolmogorov–Smirnov test, p < 10−10).
We present here new results concerning the timing of cell activation at the beginning of the UP state during natural sleep. UP state onset is characterized by more rapid reinstatement of activity in those cells with higher average firing rates. The latency of each neuron’s first spike is, to a large extent, predictable from its activity rate during SWS. UP state onset is characterized by an abrupt depolarization of the membrane potential (Steriade et al., 1993
; Sanchez-Vives and McCormick, 2000
; MacLean et al., 2005
) synchronized across cells. It is likely that this process is initiated at the end of the DOWN state in a subset of neurons that can spontaneously activate regardless of synaptic bombardment (Mao et al., 2001
), possibly due to intrinsic rectifier currents (Steriade et al., 1993
; Mao et al., 2001
; Bazhenov et al., 2002
; Compte et al., 2003
; Kang et al., 2008
). The excitation from this subgroup of cells would be sufficient to bring the membrane potential to the UP state in all cells, because of the high input impedance of neurons during the DOWN state (Contreras et al., 1996
). At that moment, the onset of spiking activity in all cells is well explained by a Poisson process, with a rate parameter that can be determined from that cell’s session-wide activity rate. This suggests that at UP state onset, the cell activity may be dominated by the cell’s intrinsic excitability, which may be shaped by intrinsic conductances or by upstream synaptic inputs (Destexhe and Paré, 1999
; Compte et al., 2003
; Steriade, 2006
), both of which are highly variable from cell to cell. Thus, the partly stereotyped reinstatement of activity in the network as a whole does not appear to reflect information processing because of the bias related to each neuron’s firing rate.
Right after UP state initiation, different dynamics seem to take over, which bring cells to peak firing at different delays, unrelated with the latency of the first spike. At the network level, similar to Luczak et al.’s (2007
) observations in sensorimotor cortex, this led to the reliable activation of sequences, which cannot be easily predicted by basic cell activity statistics. These sequences may be more relevant for information processing (as they are not constrained by intrinsic cell dynamics), possibly reflecting sequential replay of activity patterns (Euston et al., 2007
) and coordinated reactivation of cell assemblies (Peyrache et al., 2009
) during sleep. This sequential activation is likely to be an important element in maintaining the UP state, and could be informed by the detailed structure of the synaptic connectivity matrix, including contributions coming from previous experience. A similar decoupling of the detailed patterns of temporal activation from the global mechanisms of network bistability has been predicted in models, e.g. (Kang et al., 2008
).
Thus, two different pictures emerge from examining ensemble activity with different analytical approaches. The latency of the first spike in the UP state (Figure 2
) depends primarily on fast processes, that appear to be non-specific, and dictated by the general activity levels of single cells. In contrast the center of mass analysis, which provides a coarse grained description of the same spike trains (Figure 1
) reveals slower activity modulations, which would reflect different mechanisms. Thus, it seems unlikely that the reliable sequences in the timing of first spikes convey precise information while center of mass sequences would be more relevant for information processing. For example, it has been shown that center of mass sequences during sleep do indeed replay sequences observed during previous wakefulness (Euston et al., 2007
). The distinction is not banal, as spike sequence order has been suggested as a principal mechanism for information encoding in different behavioral contexts and under different dynamical regimes (Abeles, 1991
; Jensen and Lisman, 2000
; VanRullen et al., 2005
), e.g. in ensemble activity in the hippocampus (Nadasdy et al., 1999
; Lee and Kesner, 2002
; Foster and Wilson, 2006
; Pastalkova et al., 2008
) and in the neocortex (Abeles et al., 1994
; Prut et al., 1998
; Villa et al., 1999
; Ikegaya et al., 2004
; Ji and Wilson, 2007
).
In summary, we show here that, under certain dynamical conditions, the intrinsic cell properties reflected by the average firing rate may bias the order of arrival of spikes from different cells in ways that may well be irrelevant for neural computation. This is likely to not only be the case for DOWN to UP transitions, but for any other situation in which there is a rapid change in the general drive to the network. For example, one model of theta phase precession in the hippocampus (Harris et al., 2002
) shows that gradual release from inhibition within a theta oscillation cycle permits spike activity in neurons, starting from the most to the least excited, therefore inducing a non-random order in spike times. While in some cases such a ‘rate-to-time’ transformation may be useful for computation, in other cases, as shown here, it may be a non-coding, confounding factor.
From a methodological point of view, this bias should be carefully taken into consideration when analyzing sequences of neural activity and their potential role in transmitting information. The issue of spike sequence detection in the neocortex is still under intense debate (see for example Oram et al., 1998
; Litvak et al., 2003
; Mokeichev et al., 2007
). Our results show that a null hypothesis of no preferential order of activation across cells may not be appropriate in samples with different average firing rates, and effort should be made to test the sequence hypothesis versus more realistic null alternatives. In conclusion, when testing the temporal coding hypothesis in brain activity, it is imperative to take into account possible ways in which basic physiological mechanisms may bias the probability of different spike sequences.
The authors declare that the research was conducted in the absence of any commercial or financial relationships that could be construed as a potential conflict of interest.
This work was supported by Fondation Fyssen (F.P.B.), Fondation pour la Recherche Medicale (A.P.), and European Community contracts FP6-IST 027819 (Integrating Cognition, Emotion and Autonomy), FP6-IST-027140 (Bayesian Approach to Cognitive Systems) and FP6-IST-027017 (NeuroProbes).
Cash, S. S., Halgren, E., Dehghani, N., Rossetti, A. O., Thesen, T., Wang, C., Devinsky, O., Kuzniecky, R., Doyle, W., Madsen, J. R., Bromfield, E., Eross, L., Halász, P., Karmos, G., Csercsa, R., Wittner, L., and Ulbert, I. (2009). The human K-complex represents an isolated cortical down-state. Science 324, 1084–1087.
Dang-Vu, T. T., Schabus, M., Desseilles, M., Albouy, G., Boly, M., Darsaud, A., Gais, S., Rauchs, G., Sterpenich, V., Vandewalle, G., Carrier, J., Moonen, G., Balteau, E., Degueldre, C., Luxen, A., Phillips, C., and Maquet, P. (2008). Spontaneous neural activity during human slow wave sleep. Proc. Natl. Acad. Sci. U.S.A. 105, 15160–15165.
Nir, Y., Mukamel, R., Dinstein, I., Privman, E., Harel, M., Fisch, L., Gelbard-Sagiv, H., Kipervasser, S., Andelman, F., Neufeld, M. Y., Kramer, U., Arieli, A., Fried, I., and Malach, R. (2008). Interhemispheric correlations of slow spontaneous neuronal fluctuations revealed in human sensory cortex. Nat. Neurosci. 11, 1100–1108.