 Julia K. Baumgart
 Knut Skovereng
 Øyvind Sandbakk
- Department of Neuromedicine and Movement Science, Centre for Elite Sports Research, Norwegian University of Science and Technology, Trondheim, Norway
Objective: To compare peak oxygen uptake (VO2peak) and the test-retest reliability of physiological parameters between a 1-min and a 3-min closed-end and an incremental open-end upper-body poling test.
Methods: On two separate test days, 24 healthy, upper-body trained men (age: 28.3 ± 9.3 years, body mass: 77.4 ± 8.9 kg, height: 182 ± 7 cm) performed a 1-min, a 3-min and an incremental test to volitional exhaustion in the same random order. Respiratory parameters, heart rate (HR), blood lactate concentration (BLa), rating of perceived exertion (RPE), and power output were measured. VO2peak was determined as the single highest 30-s average. Relative reliability was assessed with the intra-class correlation coefficient (ICC2, 1) and absolute reliability with the standard error of measurement (SEM) and smallest detectable change (SDC).
Results: The incremental (3.50 ± 0.46 L·min−1 and 45.4 ± 5.5 mL·kg−1·min−1) and the 3-min test (3.42 ± 0.47 L·min−1 and 44.5 ± 5.5 mL·kg−1·min−1) resulted in significantly higher absolute and body-mass normalized VO2peak compared to the 1-min test (3.13 ± 0.40 L·min−1 and 40.4 ± 5.0 mL·kg−1·min−1) (all comparisons, p < 0.001). Furthermore, the incremental test resulted in a significantly higher VO2peak as compared to the 3-min test (p < 0.001). VO2peak was significantly higher on day 1 than day 2 for the 1-min test (p < 0.05) and displayed a trend toward higher values on day 2 for the incremental test (p = 0.07). High and very high ICCs across all physiological parameters were found for the 1-min (0.827–0.956), the 3-min (0.916–0.949), and the incremental test (0.728–0.956). The SDC was consistently small for HR (1-min: 4%, 3-min: 4%, incremental: 3%), moderate for absolute and body-mass normalized VO2peak (1-min: 5%, 3-min: 6%, incremental: 7%) and large for BLa (1-min: 20%, 3-min: 12%, incremental: 22%).
Conclusions: Whereas both the 3-min and the incremental test display high relative reliability, the incremental test induces slightly higher VO2peak. However, the 3-min test seems to be more stable with respect to day-to-day differences in VO2peak. The 1-min test would provide a reliable alternative when short test-duration is desirable, but is not recommended for testing VO2peak due to the clearly lower values.
Introduction
Exercise testing in a sitting position is relevant for determining upper-body physiological capacities and monitoring training progression in both Paralympic sitting athletes as well as able-bodied athletes involved in an upper-body sport. Various test protocols have been used to determine peak oxygen uptake (VO2peak) in upper-body modes, with the most common test procedure comprising incremental increases in workload until voluntary exhaustion (Bar-Or and Zwiren, 1975; Bhambhani et al., 1991; Leicht et al., 2009, 2013; Hutchinson et al., 2017). In addition, a 3-min self-paced closed-end test is a common procedure to assess VO2peak in upper-body modes (Skovereng et al., 2013; Flueck et al., 2015; Hegge et al., 2015a,b; Baumgart and Sandbakk, 2016).
In cycling, the 3-min and incremental tests resulted in equally high VO2peak values (Sperlich et al., 2011). The 3-min test additionally includes indices of performance and anaerobic capacity (i.e., accumulated oxygen deficit) (Losnegard et al., 2012), and therefore covers a more complementary set of measurements in a single test as compared to incremental workloads. In addition, the ability to increase the utilization of VO2 rapidly plays an important role in sports where high power outputs are produced over a relatively short time period. Examples are middle distance sports or intermittent activities such as cross-country skiing or Para cross-country skiing where hard work is performed in steep uphills followed by recovery in the subsequent downhill sections. Therefore, it would be of interest to explore the maximal rate of VO2 uptake during a test of shorter duration than traditionally employed. However, VO2peak and corresponding physiological responses during closed-end tests of different duration and an incremental protocol have not yet been compared in upper-body exercise modes.
In an athletic context, sport-specificity of the testing mode is important in eliciting performance related peak responses (Roels et al., 2005). Upper-body poling is the most sports-specific mode for ice sledge hockey players and cross-country sit skiers as well as for testing upper-body capacity in cross-country skiers, biathletes and Nordic combined athletes. Thirty-nine Paralympic and 27 Olympic gold medals are contended for in these events, highlighting the importance of reliable test concepts for such sports. The 3-min and the incremental test are regarded reliable for the determination of VO2peak as well as other physiological and perceptual parameters during arm-crank (Bar-Or and Zwiren, 1975; Leicht et al., 2009; Flueck et al., 2015) and wheelchair ergometry (Bhambhani et al., 1991; Leicht et al., 2013). However, the test-retest reliability of physiological parameters in upper-body poling needs to be established before meaningful differences between athletes and repeated tests within athletes can be interpreted.
The determination of test-retest reliability requires a relatively large group of homogeneous participants since most statistical measures of absolute and relative reliability are sensitive to population heterogeneity (Atkinson and Nevill, 1998; Hopkins, 2000; Weir, 2005). High test-retest reliability can solely be the result of a large spread of data points as compared to small intra-participant day-to-day variation (Atkinson and Nevill, 1998; Hopkins, 2000; Weir, 2005). Paralympic athletes represent a small group of participants with a large heterogeneity of physical capacities and are not preferable in this context.
Therefore, the aim of this study was to compare VO2peak and the test-retest reliability between a 1-min and a 3-min closed-end and an incremental open-end upper-body poling test in able-bodied upper-body-trained participants. We hypothesized that the 3-min and the incremental upper-body poling tests would display high test-retest reliability as these protocols were previously found reliable for arm-crank and wheelchair ergometry. In line with previous research in cycling, we expected that the 3-min and incremental protocol would not differ in VO2peak.
Materials and Methods
Participants
Twenty-four able-bodied upper-body-trained male individuals (age 28.3 ± 9.3, body mass 77.4 ± 8.9 kg, and height 1.8 ± 0.1 m) participated in this study. Participants were mainly cross-country skiers (N = 23) and additionally one rower who regularly trained cross-country skiing, all of whom participated in recreational or national level cross-country skiing and rowing races, respectively. All were highly trained with a running VO2max of 66 ± 7 mL·kg−1·min−1 (range 53.0–75.9) and an average of 39 ± 11 (range 22.5–75) training hours per month (based on self-reported training hours from their training diary logs; www.olt-dagbok.net), most of which was endurance training and a considerable part employing the upper-body. The participants were instructed to refrain from heavy training and alcohol consumption 24 h before the start of the testing, caffeine intake the day of the testing and food intake 2 h before. A questionnaire was filled out on each day to monitor if the participants followed these instructions, as well as to exclude any prior illness or injury that might have interfered with the testing. The study was pre-approved by the Regional Committee for Medical and Health Research Ethics of Mid-Norway and conducted in accordance with the Declaration of Helsinki. All participants signed an informed consent form prior to participation in the experiment and were made aware that they could withdraw from the study at any point without providing an explanation.
Overall Design
The testing consisted of two test days, where participants performed a 1-min and a 3-min all out and an incremental test to exhaustion in an upper-body poling mode on a Concept2 ski-ergometer (Concept2, Inc., Morrisville, USA). Each participant performed the tests in the same order and at the same time of the day (to minimize the bias of diurnal variation in performance; Atkinson and Reilly, 1996). The test order was randomized between participants. The time between test days was a minimum of 48 h and an average of 4 ± 3 days (range 2–11 days). Before the start of the testing on the first day, the participants' body mass was assessed by the built-in weighing scale of a bioelectrical impedance analyzer (Inbody Co., Ltd., Seoul, Korea).
Test Set-Up and Familiarization
After being equipped with an oro-nasal mask (Hans Rudolph Inc, Kansas City, MO, USA) and a heart rate (HR) monitor (Polar Electro Inc., Port Washington, NY, USA), the participants tightly strapped themselves around the hips and thighs into a seat construction (see Figure 1). They were then familiarized with the test setup and mode by performing four times 5-min submaximal stages mode at an overall rate of perceived exertion of 9 (very light), 11 (light), 13 (somewhat hard), and 15 (hard) on a 6–20 Borg scale (Borg, 1982; Shephard et al., 1992).
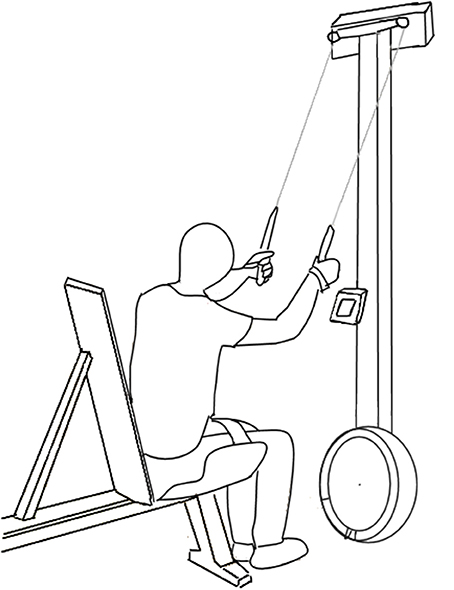
Figure 1. Test set-up with the participant in a sitting position, strapped around the hips and thighs, in front of the Concept2 ski-ergometer.
Test Protocols
A 15-min break followed the submaximal familiarizing stages, before a standardized 5-min warm-up preceded each of the peak tests, consisting of three and two min at the power output of the third (RPE 13) and fourth submaximal stage (RPE 15), respectively. The third minute of warm-up was inter-dispersed by two 5-s sprints at 90–95% of maximal sprint power. Both, the 1-min and the 3-min test were self-paced closed-end tests with the instruction to find a power output that the participants thought they could maintain throughout the test. Three pacing strategies were possible: (1) a higher power output at the start with a drop toward the end (positive pacing), (2) a stable power output throughout the test (even pacing), and (3) a lower power output at the start with an increase toward the end (negative pacing) (Atkinson et al., 2007). Positive and negative pacing were defined as more than a 10% increase or decrease of the last 30-s average as compared to the initial 30-s average power output. The incremental test started at the individual power output of the third submaximal stage (rounded to the nearest 5-W value) and participants were instructed to continuously increase power output by 10 W every 30 s. Between each of the maximal tests, a rest period of 26 ± 3 min was given and the participants were optionally allowed to drink water or sports drink. It has previously been shown that a recovery period of 20 min between maximal tests allows participants to maintain performance (Weltman et al., 1979; Vesterinen et al., 2009; Moxnes and Moxnes, 2014).
VO2, VCO2, and VE were measured breath-by-breath using a spiroergometer (Oxycon Pro, Jaeger, Viasys BV, CA, USA) which was calibrated against a known mixture of gases (5% CO2, 15% O2) and a known air flow (from a 3 L syringe) prior to each test. HR was continuously recorded during the tests. A blood sample was taken 1 and 3 min after each test and blood lactate analyzed by a Biosen C-Line Sport lactate measurement system (EKF-diagnostic GmbH, Magdeburg, Germany). Overall (RPEO), respiratory (RPER) and muscular rate of perceived exertion (RPEM), and were recorded after each test as described more in detail by Shephard et al. (1992). Power output per stroke was recorded by the skiergometer's internal software (Concept2, Morrisville, USA) and recorded by a Sony Alpha 58 video camera (Sony Corporation, NY, USA).
Data Processing and Statistical Analyses
A minimum number 21 participants was determined by a-priori analyses in G*Power 3.1, with an effect size of 0.65 (calculated as a Cohen's d based on VO2peak values in a similar sample from Baumgart and Sandbakk, 2016, an alpha level of 0.05 and a power of 0.80. Two of the 24 participants were not able to complete the 1-min and the 3-min test on the second day. In these two tests, the data from 22 participants were analyzed. Breath-by-breath respiratory data was interpolated at individually fitted sample frequencies, resampled at 1-s intervals and 10, 30, and 60-s averages were calculated in MATLAB 8.1.0. (R2016a; Mathworks Inc., Natick, MA) The single highest 30-s average value was then identified as VO2peak as recommended by Robergs et al. (2010) and used in the further analyses. The highest 10 and 60-s averages were used to investigate if changes in averaging procedure affected the results. Moving 3-s averages were calculated for the HR data and the highest value defined as peak heart rate (HRpeak). The higher of the two blood lactate values was defined as peak blood lactate (BLapeak). Thirty seconds averages were calculated for the PO data and the highest value defined as peak power output (POpeak).
Data are presented as mean ± SD unless specified differently and an α level of 0.05 was employed to indicate statistical significance. All calculations and statistical tests were executed in Microsoft Excel (Version 2010, Microsoft Cooperation, The Microsoft Network, LLC, Richmond, USA) or in SPSS 22.0 (Software for Windows, SPSS Inc., Chicago, IL, USA).
Assumptions
The assumption of homoscedasticity was examined by plotting the individual test-retest differences against the individual means and by calculating the Pearson's r correlation coefficient between the two. A correlation of r > 0.25 was used to define heteroscedasticity (O'Donoghue, 2013). Heteroscedastic variables (VCO2peak, VEpeak, and POpeak of the 1-min test, and RPEO and RPEM of the incremental test) were transformed using the natural logarithm. However, this procedure did not improve the heteroscedasticity and we hence used the non-transformed data. The assumption of normally distributed test-retest differences was assessed by the Shapiro-Wilk test of normality and Normal Q-Q plots. Paired-samples T-Tests were used to assess systematic bias in physiological variables, RPE and POpeak between the two test days. Independent-samples T-Tests were used to investigate whether using the same or unequal pacing strategies led to differences in the VO2peak delta values from day 1 to day 2. A general linear mixed model was used to investigate the interaction effect of test order and the type of upper-body poling peak test on VO2peak.
Comparison of Tests
Paired-samples T-tests were used to compare physiological variables, RPEM, RPER, RPEO, and POpeak between the three tests. To investigate the influence of a different averaging procedure on VO2peak we compared 10 and 60-s average to the 30-s average described above with paired-samples T-tests. The average over day 1 and 2 for each variable was used for these comparisons.
Absolute Reliability
Absolute reliability was assessed by the standard error of measurement (SEM) and the smallest detectable change (SDC). The SEM was calculated as SDdiff/√2 (Hopkins, 2000), and the 80% SDC as SEM·1.28·√2 (Bland and Altman, 1986).
Relative Reliability
Intraclass correlation coefficients (ICC2, 1) with 95% CI were calculated as a measure of relative reliability (Weir, 2005). Ranges of 0.26–0.49, 0.50–0.69, 0.70–0.89, and 0.90–1.0 were classified as low, moderate, high, and very high ICC according to Munro's criteria (Plichta et al., 2013).
Results
Comparison of Tests
Individual differences and mean values of day 1 to day 2 and corresponding limits of agreement are visualized in Bland-Altman plots in Figure 2 and displayed in Table 1. All data used in the analyses of this study are found in Datasheet 1. Based on the average values of test day 1 and 2, the incremental (45.4 ± 5.5 mL·kg−1·min−1, 196 ± 28 W) and the 3-min test (44.5 ± 5.5 mL·kg−1·min−1, 201 ± 36 W) resulted in significantly higher VO2peak and lower POpeak as compared to the 1-min test (40.4 ± 5.0 mL·kg−1·min−1, 256 ± 47 W) (all p < 0.001). Additionally, the incremental test resulted in significantly higher VO2peak (p < 0.03) (see Supplementary Figure 1). A plateau in VO2peak (2 consecutive 30-s values within 2 mL·kg−1·min−1) was observed in ~80% of tests both during the 3-min and the incremental protocols of day 1 and 2, without any difference between test protocol or order of test day.
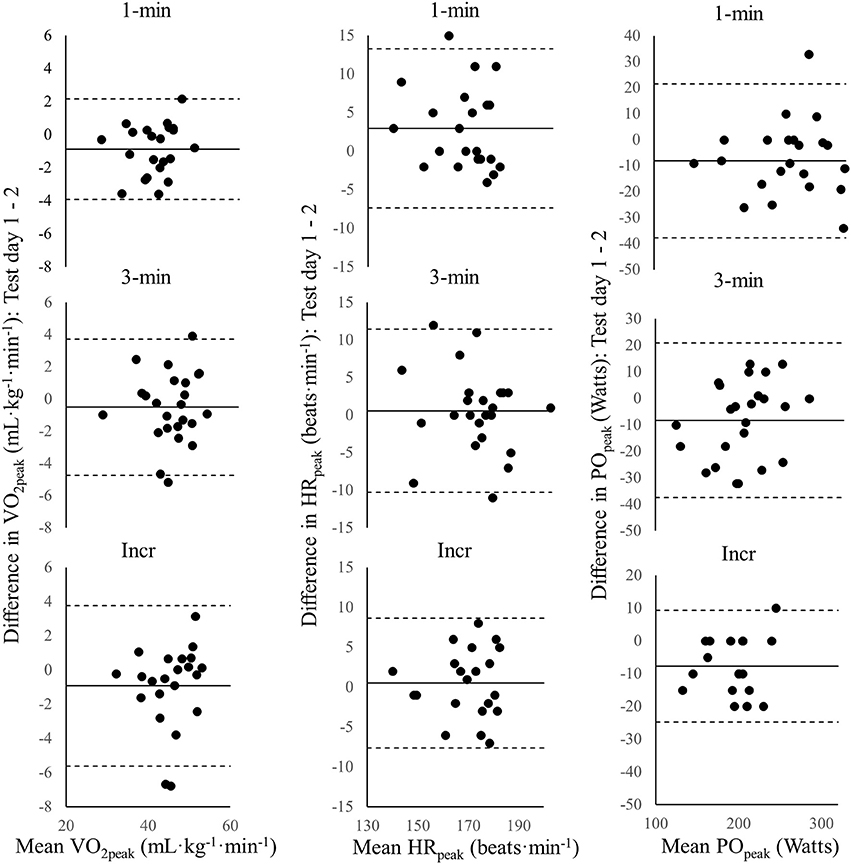
Figure 2. Bland-Altman plots for the individual mean body-mass normalized peak oxygen uptake (VO2peak), peak heart rate (HRpeak), and peak power output (POpeak) of test day 1 and 2 vs. the difference between day 1 and 2 in VO2peak, HRpeak, and POpeak for the 1-min, the 3-min, and the incremental (Incr) test. The solid line is the group mean and the dotted lines indicate ±1.96·SD.
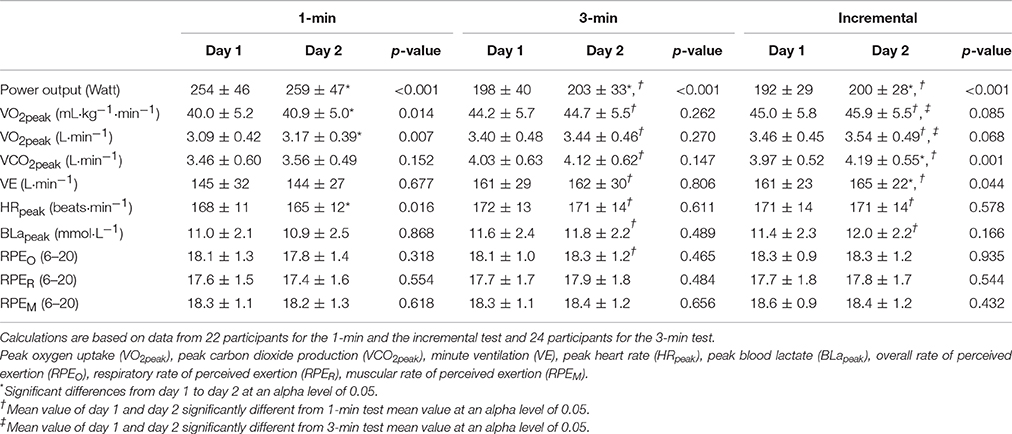
Table 1. Power output, physiological and perceptual parameters of test day 1 and 2 for a 1-min, a 3-min, and an incremental upper-body poling test in able-bodied, upper-body trained participants (means ± SD).
As compared to the 30-s average used in the above, employing a 10 or 60-s average would have resulted in significantly higher or lower VO2peak, respectively, in all three tests (all comparisons p < 0.001). When using 10-s averages, the difference in VO2peak between the tests would have remained unchanged (1-min: 41.3 ± 5.3, 3-min: 45.4 ± 5.5, incremental: 46.3 ± 5.6 mL·kg−1·min−1) compared to using 30-s averages. However, using 60-s averages, the VO2peak difference between the 1-min as compared to the 3-min and the incremental test would have increased, and the differences between the 3-min and the incremental test decreased (1-min: 32.6 ± 4.2, 3-min: 43.8 ± 5.7, incremental: 44.2 ± 5.4).
Relative and Absolute Reliability
High and very high ICCs across all physiological outcome parameters and POpeak were found for the 1-min, the 3-min and the incremental test (Table 2). In all three tests, the SDC was consistently small for HRpeak (1-min: 4%, 3-min: 4%, incremental: 3%), moderate for absolute and body-mass normalized VO2peak (1-min: 5%, 3-min: 6%, incremental: 7%) as well as POpeak (1-min: 10%, 3-min: 9%, incremental: 6%) and large for BLapeak (1-min: 20%, 3-min: 12%, incremental: 22%).
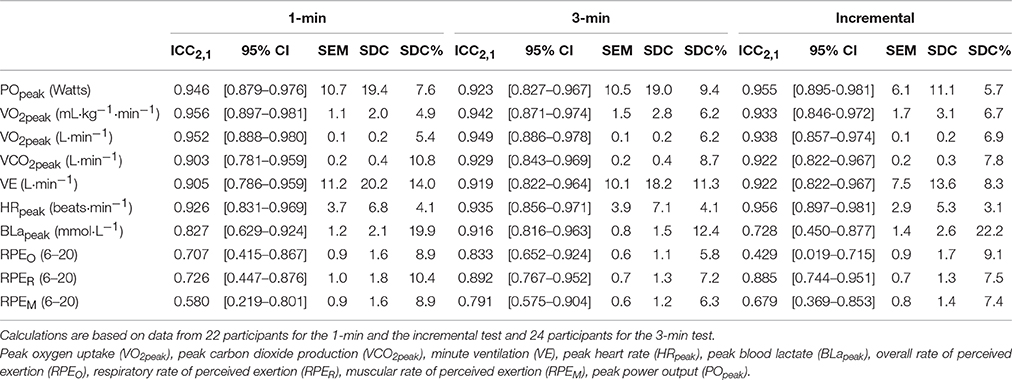
Table 2. Interclass correlation coefficients (ICC) and [95% confidence interval (CI)], standard error of the measurement (SEM), smallest detectable change (SDC) of power output, physiological, and perceptual parameters for a 1-min, a 3-min and an incremental upper-body poling test in able-bodied, upper-body trained participants.
Fourteen and 9 participants changed their pacing strategy from day 1 to day 2 for the 1-min and the 3-min test, respectively. However, there were no differences in VO2peak between day 1 and day 2 for neither the 1-min (1.1 ± 1.7 vs. 0.8 ± 1.7 mL·kg−1·min−1, p = 0.67) nor the 3-min test (0.7 ± 2.0 vs. 0.2 ± 2.5 mL·kg−1·min−1, p = 0.53) when comparing those who changed and those who maintained a stable pacing strategy across test days (Supplementary Figures 2, 3).
There was no significant interaction between type of test and test order on VO2peak (p = 0.779). Furthermore, VO2peak did not differ between test day 1 and 2 for the 3-min test (below 1% change, p > 0.05) or the incremental test (~2%, p = 0.068 and 0.085), but increased significantly for the 1-min test (~2%, p = 0.014 and 0.007). POpeak was significantly higher on test day 1 as compared to test day 2 for the 1-, the 3-min and the incremental test (2, 1, and 4%, all p < 0.015). In line with the increased POpeak, time to exhaustion significantly increased in the incremental test on day 2 (from 326 ± 63 to 346 ± 70 s, p = 0.003).
Discussion
The aim of this study was to compare VO2peak and test-retest reliability of physiological parameters between a 1-min and a 3-min closed-end and an incremental open-end upper-body poling test. The incremental and the 3-min test resulted in significantly higher VO2peak as compared to the 1-min test, with the incremental test inducing slightly higher VO2peak than the 3-min test. High and very high ICCs across all physiological parameters (0.728–0.956) and POpeak (0.923–0.955) were found for all three tests. The SDC, as a measure of absolute reliability, was consistently small for HRpeak, moderate for VO2peak and POpeak, but large for BLapeak for all three tests. Furthermore, the 3-min closed-end test was more stable with respect to day-to-day differences in VO2peak as compared to the incremental and 1-min test.
We found that the 3-min and the incremental test resulted in higher VO2peak values than the 1-min test, demonstrating that 1-min duration is too short for the kinetics of the cardio-respiratory system to respond to the increased work demand during upper-body work. This is supported by the absence of a plateau in VO2peak during the 1-min test in all participants. In contrast, a plateau or drop in VO2peak at the end of the 3-min and the incremental test was observed in the majority of our participants' tests. Even though no study had previously compared a 1-min test to a 3-min or incremental protocol, Price et al. (2014) found significantly lower VO2peak during a 30-s Wingate test as compared to an incremental protocol. Furthermore, the incremental protocol led to slightly higher VO2peak values than the 3-min test, which is in line with a comparable study in cross-country skiing (McGawley, 2017). However, the meaningfulness of the 1 mL·kg−1·min−1 higher VO2peak during the incremental test in the current study can be questioned, since both tests reach a plateau and the difference was in part influenced by the averaging procedure. In the current study the highest 30-s average was chosen to indicate VO2peak as recommended by Robergs et al. (2010). If we shortened the duration to the single highest 10-s VO2peak value, the difference between tests would have stayed stable but the peak values were consistently higher. In contrast, if VO2peak would have been defined over two consecutive 30-s periods, VO2peak differences between the 3-min test and the incremental test become negligible, yet the difference in VO2peak between both these tests and the 1-min test would have increased. The latter is logical since there is a lag in the VO2 kinetics response to the increased work demands included in the 1-min average. Thus, a 30-s average was deemed most appropriate in the current study to be able to compare tests, without taking the initial part of the test into consideration. Concluding from the above, the 1-min is not recommended as a VO2peak test due to the clearly lower responses, whereas the 3-min test might slightly underestimate VO2peak, with the magnitude depending on the averaging procedure.
Our finding of high relative reliability of physiological parameters of the three upper-body poling tests, reflected by high ICCs, are in line with several previous studies. Three minutes closed-end and incremental arm crank ergometry tests displayed similar ICCs in not specifically upper-body trained able-bodied participants (Leicht et al., 2009; Flueck et al., 2015; Hutchinson et al., 2017) as well as incremental wheelchair ergometry or treadmill tests in athletes with different disabilities (Bhambhani et al., 1991; Leicht et al., 2013). The current data shows that the ranks of the participants remain stable from test day 1 to test day 2 also during upper-body poling. However, caution is needed in the ICC's interpretation as it is a measure of the between-subjects variation in relation to the within-subjects variation and can be inflated merely by sample heterogeneity (Atkinson and Nevill, 1998; Hopkins, 2000). In a previous study on the reliability of VO2peak during an incremental wheelchair treadmill test, Leicht et al. (2013) tried to circumvent a too large spread between participants by grouping together athletes with similar disabilities and training status, which consequently lead to small group sample sizes. To achieve a sufficient sample size, yet at the same time have a homogeneous sample, we chose to recruit upper-body trained male participants for our study. Given that the participants in our study were highly and relatively similarly upper-body trained, we expected them to be more homogeneous than athletes with a disability. However, the coefficient of variation of the body-mass normalized VO2peak of 12% during the incremental test was higher than the 8% variation found in a group of participants with lower-limb disabilities (Leicht et al., 2013). As such, the interpretability of the ICC as a measure of test-retest reliability in upper-body testing remains limited, since even homogeneous able-bodied participants show heterogeneous responses.
In comparison to relative reliability outcomes, absolute reliability measures provide the possibility to investigate the degree to which repeated measurements vary for individuals. In this study, the small SDC for HRpeak and moderate SDC for VO2peak and POpeak indicate acceptable absolute reliability of all three peak tests. However, the rather large SDCs for BLapeak, which are in line with previous studies (Leicht et al., 2009, 2013; Flueck et al., 2015), suggest that BLapeak cannot be used as a reliable outcome measure in upper-body testing to exhaustion. That the SDC for absolute and body-mass normalized VO2peak was only moderate can be explained by the higher values on day 2 for the 1-min and the incremental test, and for POpeak for all three tests. The higher POpeak and consequently higher VO2peak values during the 1-min test on day 2 may be attributed to motivation to beat their previous score, although we have no data supporting this speculation. The higher VO2peak during the incremental test on test day 2 can in part be explained by two participants having 0.5–0.6 L·min−1 and 7 mL·kg−1·min−1 higher absolute and body-mass normalized VO2peak, respectively. If the data of the two participants were excluded, VO2peak differences between test day 1 vs. 2 would have become non-significant. During the incremental test, the higher POpeak on day 2 is related to half of the participants being able to sustain at least one extra 30-s stage with a higher POpeak on day 2. Overall, the 3-min test is the most stable with respect to day-to-day differences and, therefore, the most reliable of the three upper-body poling tests.
Methodological Considerations
Our participants were highly trained for the poling movement and the exercise intensities used in this study, and they familiarized themselves with four times 5-min submaximal warm-up stages. We, therefore, chose to not perform a separate familiarization session for the peak tests in advance. However, in hindsight and as a recommendation for further studies, a separate familiarization session should be performed for all tests if the main outcome measure is POpeak and for the 1-min and the incremental test if the main outcome measure is VO2peak.
Furthermore, it remains to be investigated if other durations of the incremental test would result in different VO2peak responses. As the participants in our study performed a thorough warm-up before starting the incremental test, we do not expect higher VO2peak values with increases in duration of the test, but a follow-up study is needed to confirm this.
To be able to identify meaningful differences in body-mass normalized VO2peak with paired comparison tests and similar participants in future studies, we estimated a sample size of 26 participants by n = 8·SDC2·(SEM2)−1 as proposed by Hopkins (2000). Relatively similar numbers apply for most of the variables used in our approach. It is often challenging to recruit so many similarly upper-body trained participants, and in particular when aiming to test Paralympic athletes which are homogeneous with respect to their disability. Therefore, as large sample sizes as possible should be aimed at, if necessary through international collaborations. In addition, detailed description of the testing procedure and individual data should be made available so high-quality meta-analyses can be performed in the future.
Conclusion
In conclusion, we find acceptable absolute and relative reliability of a 1-min and a 3-min closed-end, and an incremental upper-body poling VO2peak test in able-bodied, upper-body trained individuals. However, the 1-min test is not recommended as a VO2peak test due to the clearly lower values than the 3-min and the incremental test. Whereas the 3-min test is more stable with respect to day-to-day differences in VO2peak, the incremental test leads to slightly higher VO2peak.
Author Contributions
JKB, KS, and ØS substantially contributed to the conception and design of the study. JKB and KS acquired the data. JKB analyzed the data and all three authors were involved in the interpretation of data. JKB drafted the study with KS and ØS critically revising it for important intellectual content. The final version sent in for publication was approved by all three authors. Agreement to be accountable for all aspects of the work was reached between JKB, KS, and ØS.
Funding
This study was funded by the Centre for Elite Sports Research, Department of Neuromedicine and Movement Science, Norwegian University of Science and Technology, Trondheim, Norway.
Conflict of Interest Statement
The authors declare that the research was conducted in the absence of any commercial or financial relationships that could be construed as a potential conflict of interest.
Acknowledgments
The eager participation of the participations is deeply appreciated. The authors acknowledge the financial support of the Centre for Elite Sports Research in Trondheim.
Supplementary Material
The Supplementary Material for this article can be found online at: https://www.frontiersin.org/articles/10.3389/fphys.2017.00857/full#supplementary-material
Supplementary Figure 1. Bland-Altman plots for the individual mean body-mass normalized peak oxygen uptake (VO2peak) and peak power output (POpeak) of test day 1 and 2 vs. the difference in VO2peak and POpeak between the 3-min and the incremental test. The solid line is the group mean and the dotted lines indicate ±1.96·SD.
Supplementary Figure 2. Development of power output and VO2 (presented as 30-s averages) of the 1-min test plotted individually for each participant over time. Solid lines demark the power output, dotted lines the VO2. Black lines are for test day 1 and red lines for test day 2.
Supplementary Figure 3. Development of power output and VO2 (presented as 30-s averages) of the 3-min test plotted individually for each participant over time. Solid lines demark the power output, dotted lines the VO2. Black lines are for test day 1 and red lines for test day 2.
Abbreviations
BLapeak, Peak blood lactate; HRpeak, Peak heart rate; ICC, Interclass correlation coefficient; POpeak, Peak power output; RPEM, Muscular rate of perceived exertion; RPEO, Overall rate of perceived exertion; RPER, Respiratory rate of perceived exertion; SDC, Smallest detectable change; SEM, Standard error of the measurement; VE, Minute ventilation; VO2max, Maximal oxygen uptake; VO2peak, Peak oxygen uptake; VCO2peak, Peak carbon dioxide production.
References
Atkinson, G., and Nevill, A. M. (1998). Statistical methods for assessing measurement error (reliability) in variables relevant to sports medicine. Sports Med. 26, 217–238. doi: 10.2165/00007256-199826040-00002
Atkinson, G., Peacock, O., St. Clair Gibson, A., and Tucker, R. (2007). Distribution of power output during cycling: impact and mechanisms. Sports Med. 37, 647–667. doi: 10.2165/00007256-200737080-00001
Atkinson, G., and Reilly, T. (1996). Circadian variation in sports performance. Sports Med. 21, 292–312. doi: 10.2165/00007256-199621040-00005
Bar-Or, O., and Zwiren, L. D. (1975). Maximal oxygen consumption test during arm exercise–reliability and validity. J. Appl. Physiol. 38, 424–426.
Baumgart, J. K., and Sandbakk, Ø. (2016). Laboratory determinants of repeated-sprint and sport-specific-technique ability in World-class ice sledge hockey players. Int. J. Sports Physiol. Perform. 11, 182–190. doi: 10.1123/ijspp.2014-0516
Bhambhani, Y. N., Eriksson, P., and Steadward, R. D. (1991). Reliability of peak physiological responses during wheelchair ergometry in persons with spinal cord injury. Arch. Phys. Med. Rehabil. 72, 559–562.
Bland, J. M., and Altman, D. G. (1986). Statistical methods for assessing agreement between two methods of clinical measurement. Lancet 1, 307–310. doi: 10.1016/S0140-6736(86)90837-8
Borg, G. A. (1982). Psychophysical bases of perceived exertion. Med. Sci. Sports Exerc. 14, 377–381. doi: 10.1249/00005768-198205000-00012
Flueck, J. L., Lienert, M., Schaufelberger, F., and Perret, C. (2015). Reliability of a 3-min all-out arm crank ergometer exercise test. Int. J. Sports Med. 36, 809–813. doi: 10.1055/s-0035-1548811
Hegge, A. M., Bucher, E., Ettema, G., Faude, O., Holmberg, H. C., and Sandbakk, O. (2015a). Gender differences in power production, energetic capacity and efficiency of elite cross-country skiers during whole-body, upper-body, and arm poling. Eur. J. Appl. Physiol. 116, 291–300. doi: 10.1007/s00421-015-3281-y
Hegge, A. M., Myhre, K., Welde, B., Holmberg, H. C., and Sandbakk, Ø. (2015b). Are gender differences in upper-body power generated by elite cross-country skiers augmented by increasing the intensity of exercise? PLoS ONE 10:e0127509. doi: 10.1371/journal.pone.0127509
Hopkins, W. G. (2000). Measures of reliability in sports medicine and science. Sports Med. 30, 1–15. doi: 10.2165/00007256-200030010-00001
Hutchinson, M. J., Paulson, T. A. W., Eston, R., and Goosey-Tolfrey, V. L. (2017). Assessment of peak oxygen uptake during handcycling: test-retest reliability and comparison of a ramp-incremented and perceptually-regulated exercise test. PLoS ONE 12:e0181008. doi: 10.1371/journal.pone.0181008
Leicht, A. S., Sealey, R. M., and Sinclair, W. H. (2009). The reliability of VO2peak determination in healthy females during an incremental arm ergometry test. Int. J. Sports Med. 30, 509–515. doi: 10.1055/s-0029-1202351
Leicht, C. A., Tolfrey, K., Lenton, J. P., Bishop, N. C., and Goosey-Tolfrey, V. L. (2013). The verification phase and reliability of physiological parameters in peak testing of elite wheelchair athletes. Eur. J. Appl. Physiol. 113, 337–345. doi: 10.1007/s00421-012-2441-6
Losnegard, T., Myklebust, H., and Hallén, J. (2012). Anaerobic capacity as a determinant of performance in sprint skiing. Med. Sci. Sports Exerc. 44, 673–681. doi: 10.1249/MSS.0b013e3182388684
McGawley, K. (2017). The reliability and validity of a four-minute running time-trial in assessing [Formula: see text]max and performance. Front. Physiol. 8:270. doi: 10.3389/fphys.2017.00270
Moxnes, J. F., and Moxnes, E. D. (2014). Mathematical simulation of energy expenditure and recovery during sprint cross-country skiing. Open Access J. Sports Med. 5, 115–121. doi: 10.2147/OAJSM.S62020
O'Donoghue, P. (2013). Statistics for Sport and Exercise Studies: An Introduction. Abingdon: Routledge.
Plichta, S. B., Kelvin, E. A., and Munro, B. H. (2013). Munro's Statistical Methods for Health Care Research. Philadelphia, PA: Wolters Kluwer Health/Lippincott Williams & Wilkins.
Price, M., Beckford, C., Dorricott, A., Hill, C., Kershaw, M., Singh, M., et al. (2014). Oxygen uptake during upper body and lower body Wingate anaerobic tests. Appl. Physiol. Nutr. Metab. 39, 1345–1351. doi: 10.1139/apnm-2013-0405
Robergs, R. A., Dwyer, D., and Astorino, T. (2010). Recommendations for improved data processing from expired gas analysis indirect calorimetry. Sports Med. 40, 95–111. doi: 10.2165/11319670-000000000-00000
Roels, B., Schmitt, L., Libicz, S., Bentley, D., Richalet, J. P., and Millet, G. (2005). Specificity of V? o2max and the ventilatory threshold in free swimming and cycle ergometry: comparison between triathletes and swimmers. Br. J. Sports Med. 39, 965–968. doi: 10.1136/bjsm.2005.020404
Shephard, R. J., Vandewalle, H., Gil, V., Bouhlel, E., and Monod, H. (1992). Respiratory, muscular, and overall perceptions of effort: the influence of hypoxia and muscle mass. Med. Sci. Sports Exerc. 24, 556–567. doi: 10.1249/00005768-199205000-00010
Skovereng, K., Ettema, G., Welde, B., and Sandbakk, Ø (2013). On the relationship between upper-body strength, power, and sprint performance in ice sledge hockey. J. Strength Cond. Res. 27, 3461–3466. doi: 10.1519/JSC.0b013e31828f2799
Sperlich, B., Haegele, M., Thissen, A., Mester, J., and Holmberg, H. C. (2011). Are peak oxygen uptake and power output at maximal lactate steady state obtained from a 3-min all-out cycle test? Int. J. Sports Med. 32, 433–437. doi: 10.1055/s-0031-1271770
Vesterinen, V., Mikkola, J., Nummela, A., Hynynen, E., and Hakkinen, K. (2009). Fatigue in a simulated cross-country skiing sprint competition. J. Sports Sci. 27, 1069–1077. doi: 10.1080/02640410903081860
Weir, J. P. (2005). Quantifying test-retest reliability using the intraclass correlation coefficient and the SEM. J. Strength Cond. Res. 19, 231–240. doi: 10.1519/15184.1
Keywords: peak aerobic capacity, endurance performance, all-out, 3-min, exhaustion
Citation: Baumgart JK, Skovereng K and Sandbakk Ø (2017) Comparison of Peak Oxygen Uptake and Test-Retest Reliability of Physiological Parameters between Closed-End and Incremental Upper-Body Poling Tests. Front. Physiol. 8:857. doi: 10.3389/fphys.2017.00857
Received: 18 July 2017; Accepted: 13 October 2017;
Published: 30 October 2017.
Edited by:
Billy Sperlich, Integrative and Experimentelle Trainingswissenschaft, Universität Würzburg, GermanyReviewed by:
Hannes Gatterer, University of Innsbruck, AustriaStefanos Volianitis, Aalborg University, Denmark
Copyright © 2017 Baumgart, Skovereng and Sandbakk. This is an open-access article distributed under the terms of the Creative Commons Attribution License (CC BY). The use, distribution or reproduction in other forums is permitted, provided the original author(s) or licensor are credited and that the original publication in this journal is cited, in accordance with accepted academic practice. No use, distribution or reproduction is permitted which does not comply with these terms.
*Correspondence: Julia K. Baumgart, amsuYmF1bWdhcnRAZ21haWwuY29t