 Ryszard S. Gomolka1
 Stefan Kampusch2
 Eugenijus Kaniusas2Florian Thürk2Jozsef C. Széles3
 Wlodzimierz Klonowski1*
- 1Nalecz Institute of Biocybernetics and Biomedical Engineering, Polish Academy of Sciences, Warsaw, Poland
- 2Institute of Electrodynamics, Microwave and Circuit Engineering, TU Wien, Vienna, Austria
- 3Division of Vascular Surgery, University Clinic for Surgery, Medical University of Vienna, Vienna, Austria
Analysis of heart rate variability (HRV) can be applied to assess the autonomic nervous system (ANS) sympathetic and parasympathetic activity. Since living systems are non-linear, evaluation of ANS activity is difficult by means of linear methods. We propose to apply the Higuchi fractal dimension (HFD) method for assessment of ANS activity. HFD measures complexity of the HRV signal. We analyzed 45 RR time series of 84 min duration each from nine healthy and five diabetic subjects with clinically confirmed long-term diabetes mellitus type II and with diabetic foot ulcer lasting more than 6 weeks. Based on HRV time series complexity analysis we have shown that HFD: (1) discriminates healthy subjects from patients with diabetes mellitus type II; (2) assesses the impact of percutaneous auricular vagus nerve stimulation (pVNS) on ANS activity in normal and diabetic conditions. Thus, HFD may be used during pVNS treatment, to provide stimulation feedback for on-line regulation of therapy in a fast and robust way.
Introduction
Analysis of HRV represents a common tool for assessment of autonomic cardiac regulation and provides information about pathophysiological changes in various diseases (Task Force of the European Society of Cardiology the North American Society of Pacing Electrophysiology, 1996; Ashkenazy et al., 1999; Klonowski, 2007; Pierzchalski et al., 2011; Bian et al., 2012; Jiang et al., 2013; Shaffer and Ginsberg, 2017). Based on evaluation of HRV, it was recently suggested that auricular vagus nerve stimulation (VNS) positively influences the ANS by activating its parasympathetic branch (La Marca et al., 2010; Kampusch et al., 2013, 2015a,b) and deactivating its sympathetic branch (Clancy et al., 2014; Murray et al., 2016). Estimation of sympathetic and parasympathetic activity of ANS is necessary for an accurate adjustment of auricular VNS, the task that is difficult to achieve and potentially vulnerable to erroneous interpretation with standard linear methods (Skinner et al., 1992; Yeragani et al., 1993; Wagner and Persson, 1998; Klonowski, 2007; Sharma, 2009; Sassi et al., 2015).
Herein, we propose to apply a HFD algorithm (Higuchi, 1988), for assessment of ANS activity based on HRV. HFD is simple, fast and it is applicable in real-time calculations. In contrary to the linear methods, HFD can be directly applied to HRV series in time domain and it is suitable for short time series analysis, i.e., of 100–200 data points of a non-stationary signal. HFD needs to be provided with only one input parameter kmax, specifying a maximal distance between the points compared in the time series. As the HFD measures the complexity of the curve that represents the analyzed signal on a plane, it always attains values between 1 and 2. The value of 1 corresponds to a regular time series (simple curve has Euclidean dimension equal 1) while for Gaussian-type noise HFD may attain different values: 1.5 for Brownian, 1.8 for pink, and 2.0 for white noise (Klonowski, 2007, 2011).
Up to date, the Higuchi algorithm was widely used in analysis of biomedical signals (Skinner et al., 1992; Klonowski, 2007, 2011; Sharma, 2009; West, 2010; Di Ieva et al., 2015; Kesić and Spasić, 2016) but only several papers presented HFD evaluation of HRV (Yeragani et al., 1993; Diosdado et al., 2010; Pierzchalski et al., 2011; Kamath, 2013; Sassi et al., 2015; Kesić and Spasić, 2016; Tavares et al., 2016; Wajnsztejn et al., 2016; Gomes et al., 2017). Hence, the aim of our research was to assess whether, based on HRV time series analysis, HFD would: (1) discriminate healthy subjects from patients with diabetes mellitus type II; (2) assess the impact of pVNS on ANS activity in normal and diabetic conditions.
Materials and Methods
Data
We retrospectively analyzed 56 RR time series, of 84 min duration each, from an open-label pilot study registered at ClinicalTrials.gov (no. NCT02098447). The study was approved by the local ethics committee of the Medical University of Vienna (no. 1924/2013) and by the Austrian Agency for Health and Food Safety. The RR time series were recalculated from ECG recordings obtained from nine healthy and five diabetic subjects, aged 40–80 years, with clinically confirmed long-term diabetes mellitus type II, and diabetic foot ulcer (ulcus cruris) lasting for more than 6 weeks (Table 1). Subject’s exclusion criteria were: participation in another clinical trial over the last 5 weeks before the experiment; addiction to substance abuse; autonomous nervous system dysfunction (except diabetic polyneuropathy); medical treatment with vasoactive substances; history of heart arrhythmia or presence of an active implantable device. Women in childbearing age were not included if pregnant or nursing. All diabetic subjects had a history of diabetes in average(SD) of 14(5) years. The ECGs were acquired by means of a MP36 recording system with a three-lead Einthoven II derivation (BIOPAC Systems, Inc., Goleta, CA, United States) and a sampling rate of 1 kHz, for further calculation of heart rate and HRV signals. The measurements were obtained between February 24, 2014 and April 3, 2015. The heart rate was calculated using proprietary MATLAB algorithms with manual control (normal-normal RR series, extrasystoles, and artifacts excluded manually). All subjects gave written informed consent in accordance with the Declaration of Helsinki.
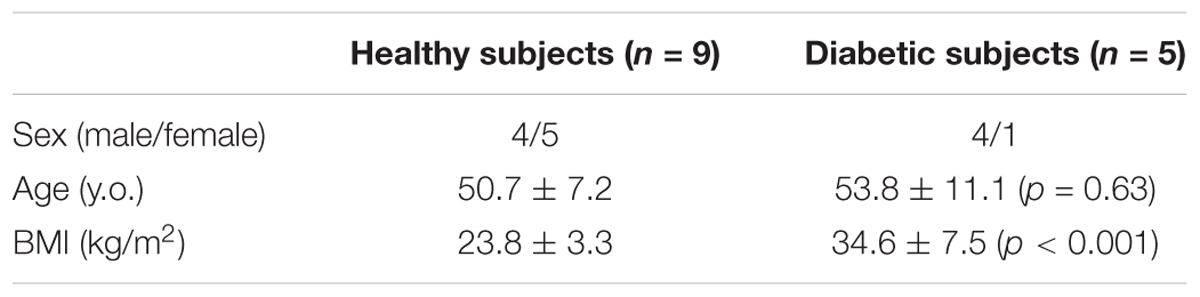
TABLE 1. Demographic characteristics of healthy and diabetic subjects (p-values for differences in age and BMI are given) included in the study (Ref. ClinicalTrials.gov no. NCT02098447).
Each of the healthy and diabetic subjects underwent four sessions of pVNS mediated via four needle electrodes, with one acting as the reference electrode, in vagally innervated regions of the right auricle (Kampusch et al., 2013, 2015a,b; Kaniusas et al., 2015). Each session consisted of five consecutive phases: B- baseline measurement (10 min), S1- first pVNS (22 min), P1- baseline measurement after the first pVNS (20 min), S2- second pVNS (22 min), P2- baseline measurement after the second pVNS (10 min). All measurements were performed at comparable daytimes.
Eleven out of 56 RR time series were excluded because of significant artifacts. The artifacts were caused by a low quality of the raw data (7 time series) or presence of cardiac arrhythmia in the signal (4 time series). Therefore, further analysis was performed on 45 RR time series (28 for healthy and 17 for diabetics).
In order to standardize the length of the series, every RR record was linearly resampled with 1 Hz. Low frequency of resampling was used to preserve the original characteristics of the signal. Higher sampling frequencies would change the shape of the original RR curve by introducing additional samples and extending the total length of the signal, subsequently affecting the estimation of real HFD values by introduction of low frequencies.
Higuchi Fractal Dimension Algorithm
Calculations were performed by means of an in-house implementation of the HFD algorithm in MATLAB R2016b (The Mathworks Inc., Natick, MA, United States; Academic License, IBBE PAS). HRV signals were analyzed within windows of 100 data points displaced by a 50 consecutive samples across the signal, which resulted in 99 HFD values for each of the RR time series. The window of 100 data points reflected approximately 1.5 min windows in RR time series. Consecutively, every phase in each of the time series consisted of the following number of HFD values: B- 11 HFD values; S1- 25 values; P1- 24 values; S2- 25 values; P2- 14 values.
Estimation of the Optimal kmax Parameter
In order to find an optimal kmax parameter, allowing clear differentiation between healthy and diabetic subjects, the HFD was calculated in all of the 45 RR time series, for kmax ranging from 2 to 50 (Figure 1). Calculation for kmax above 50 was not possible due to the window length of 100 samples – maximal distance between compared samples was less than 1/2 of the window length. Optimal kmax was chosen based on a clear separation of the mean of the aggregated HFD values for healthy and diabetic subjects, and on the minimization of the two-sided Wilcoxon ranksum test p-value for comparison of medians of the HFD values. Subsequent analyses were performed for HFDs calculated with the chosen parameter kmax = 5. (cf. 3.1, Figure 1)
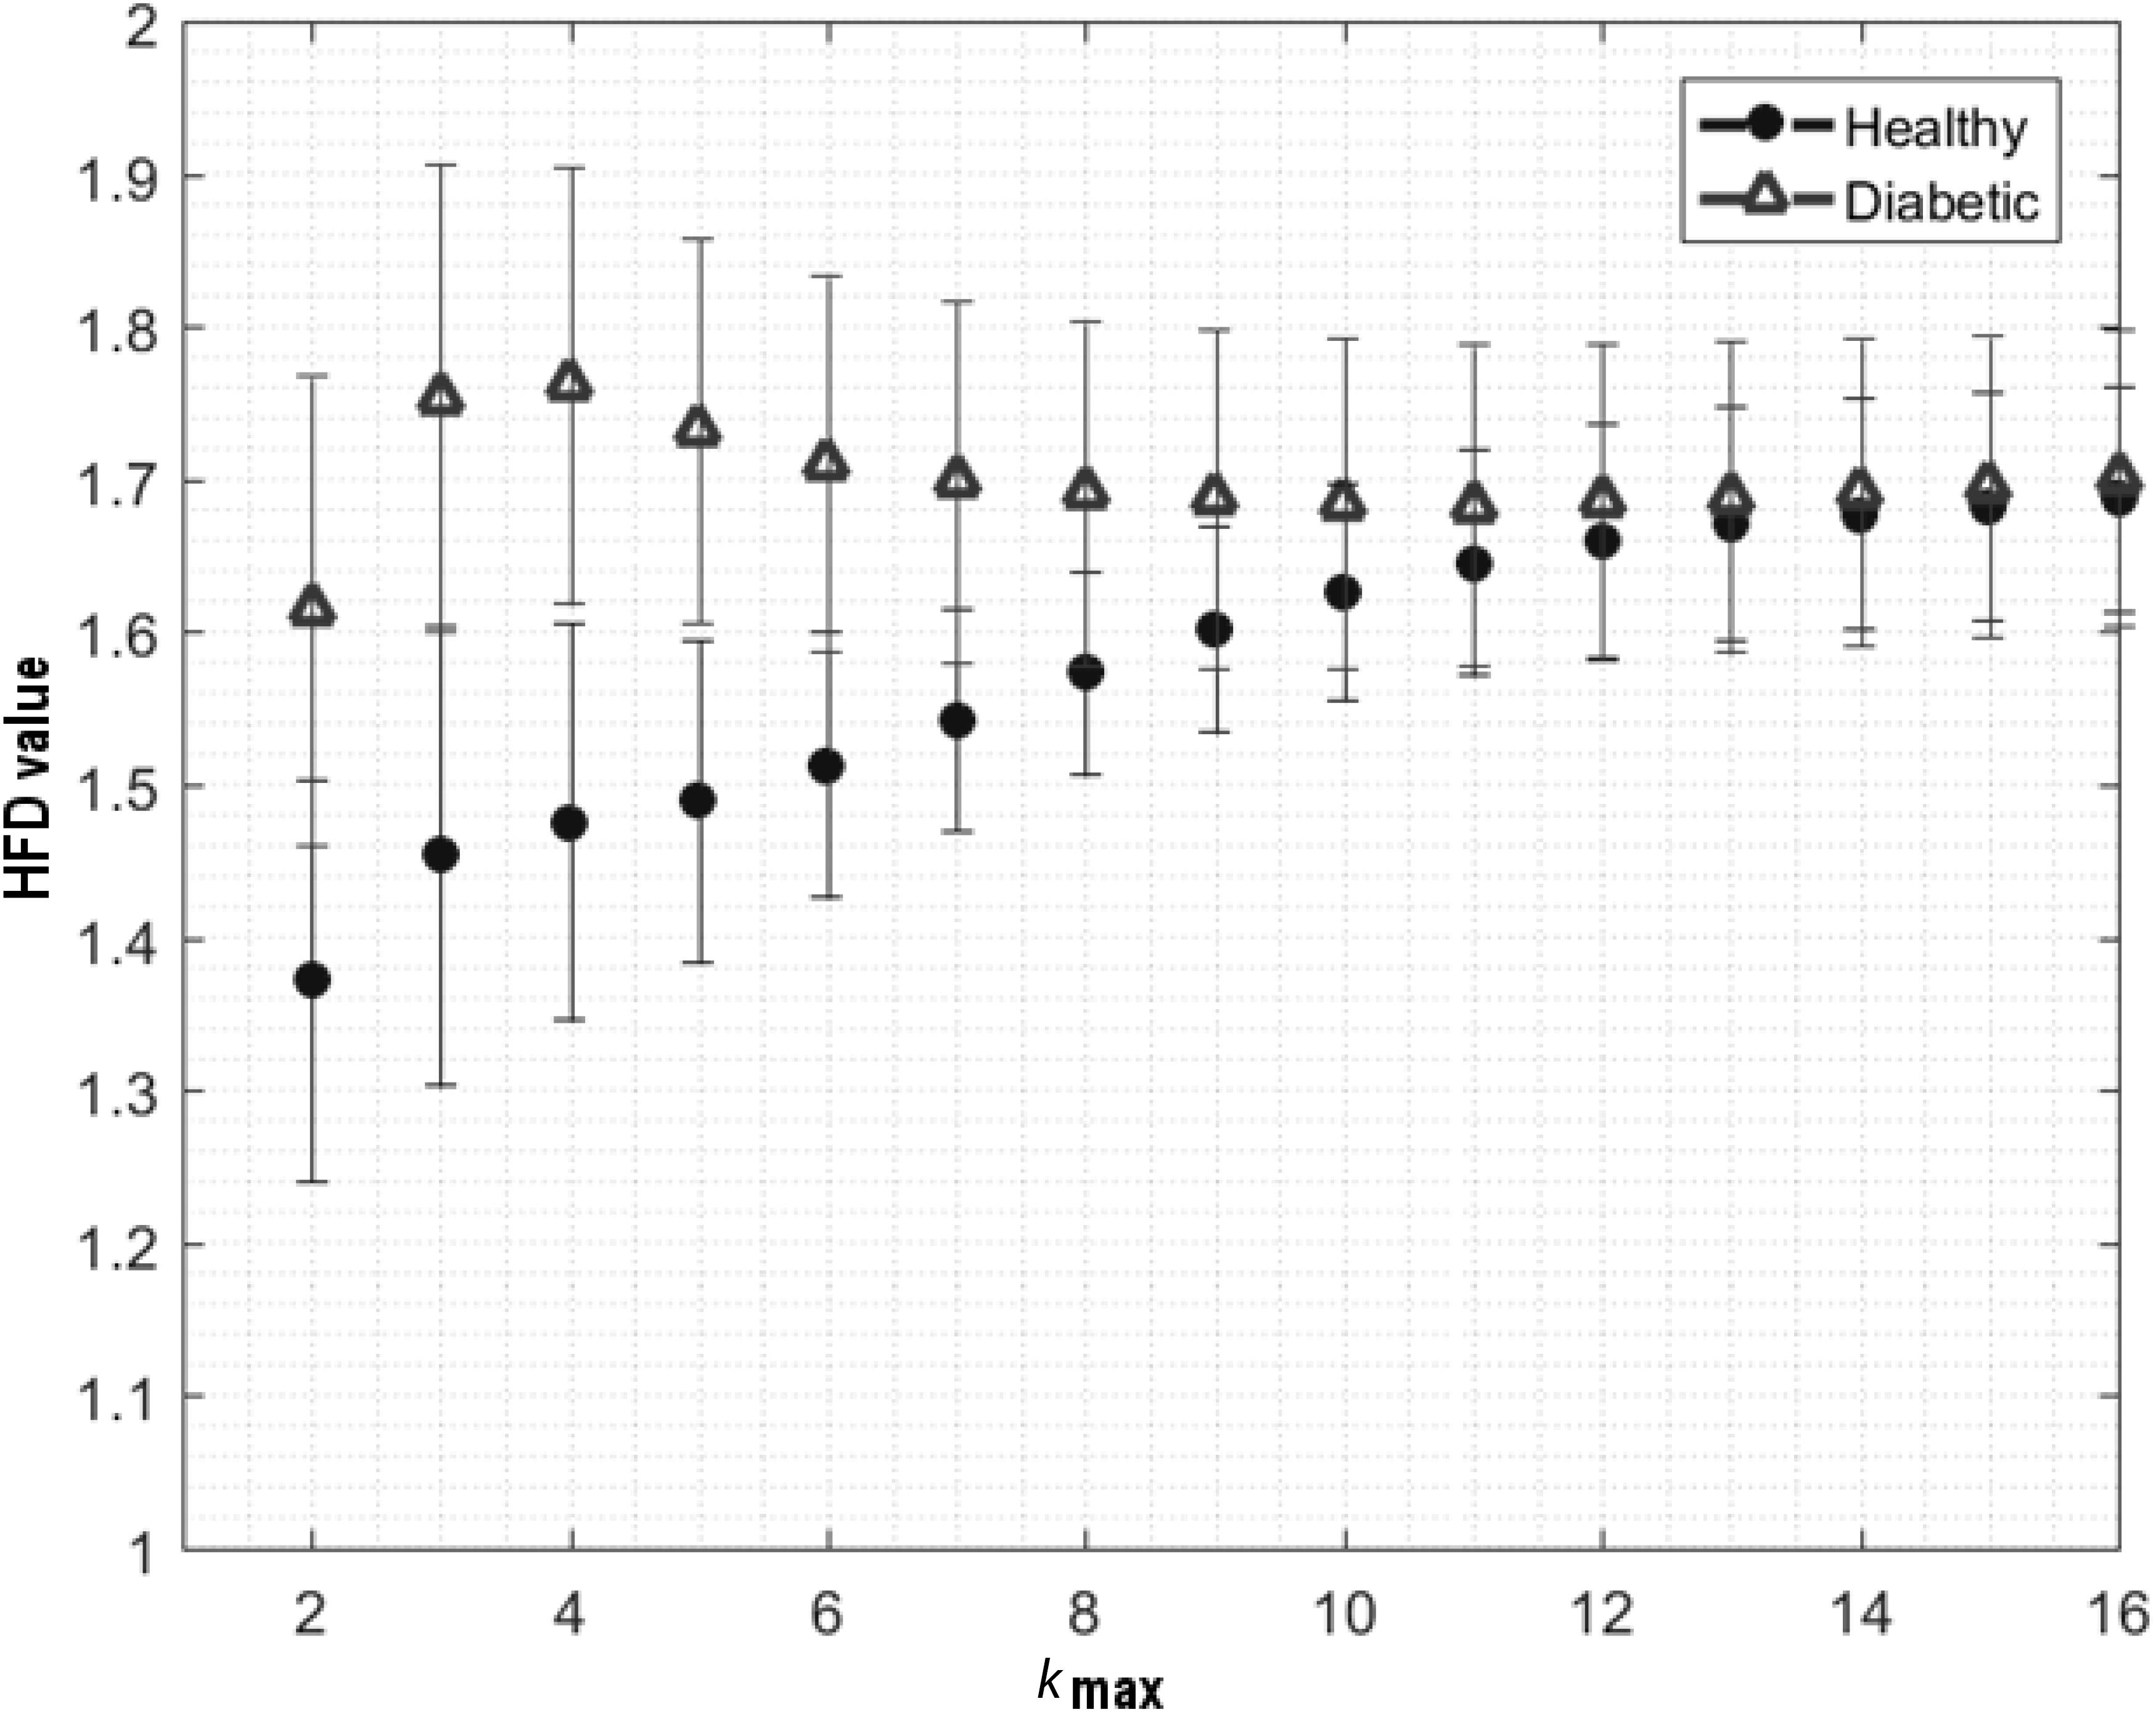
FIGURE 1. Fluctuation of aggregated average ± SD of HFD values for healthy and diabetic subjects, calculated for kmax parameter from 1 to 16. Clear differentiation between subjects obtained for kmax = 5, by means of two-sided Wilcoxon ranksum test (p < 7.97e–25).
Aggregated Distributions of HFD Values – Overall
In each of the RR time series, 99 HFD values were calculated. HFDs aggregated from the time series were tested by Shapiro–Wilk normality test, to confirm non-normal distribution of the values. Afterwards, the aggregated HFD distributions were computed in healthy and diabetics from 2,772 and 1,683 HFD values, respectively. Fifth, 25th, 75th, and 95th percentiles, means, medians, SDs, skewness, and kurtosis were calculated separately in both HFD distributions, for subsequent comparison.
Average HFD Values Across the Time Series
Mean representative vectors of HFDs were calculated in respect to time (t) in healthy and diabetics, for comparison by means of Wilcoxon matched-pairs signed rank test. For visual presentation of the results, the average ±95% confidence intervals of the aggregated HFD values from healthy and diabetics were plotted in function of time. Pearson’s linear correlation coefficient was calculated between the average HFDs(t) and the time course of the experiment in both groups. Results were considered significant if correlation exceeded 50% with a p-significance value <0.05.
Average HFD Values Within the Experimental Phases
To assess whether the HFDs for healthy and diabetics are changing overtime between B, S1, P1, S2, and P2 phases, average ± SD of aggregated HFD values were calculated for each phase of the time series in each of the subjects separately. As a result, each of the subjects was represented by 5 average ± SD HFD values. Afterward, two-way analysis of variance (ANOVA) was applied to reveal significant differences between the average HFDs in healthy and diabetic groups, in respect to the phase of experiment. Bonferroni’s multiple comparison test was used in search of differences between specific phases of the time series. Whiskers-box plots of the aggregated HFDs within the phases were generated for visual representation of the results.
Aggregated Distributions of HFD Within the Experimental Phases
To check whether pVNS changes the shape of HFD distribution overtime, 5th, 25th, 75th, and 95th percentiles, means, medians, SDs, skewness and kurtosis were calculated for the HFD aggregated distributions from B, S1, P1, S2, and P2 phases separately, for subsequent comparison. Afterwards, 10 bins-wide histograms of the aggregated HFD distributions were computed within the phases, for healthy and diabetic subjects separately. To objectively assess the magnitude of the changes caused by pVNS, contrast histograms were calculated as a ratio of difference to sum of bins heights between previously computed histograms for S1 and B; P1 and S1, S2 and P1, P2 and S2, and P2 and B phases in both groups.
Statistical Analysis
All calculations and statistical analyses were performed by means of MATLAB R2016b.
Results
Estimation of the Optimal kmax Parameter
The aggregated HFD values for healthy and diabetics were found as the most statistically different for kmax = 5, by means of a two-sided Wilcoxon ranksum test (p < 0.001). Hence, the optimal kmax parameter, allowing clear differentiation between the healthy and diabetes group, was chosen as 5.
Aggregated Distributions of HFD Values – Overall
Shapiro–Wilk normality test revealed that HFD values, aggregated jointly from healthy and diabetic subjects, do not form a normal distribution (W = 0.9745, p < 0.05). Characteristics of HFD aggregated distributions (i.e., 5th, 25th, 75th, and 95th percentiles, means, medians, SDs, skewness, and kurtosis) are presented in Table 2.
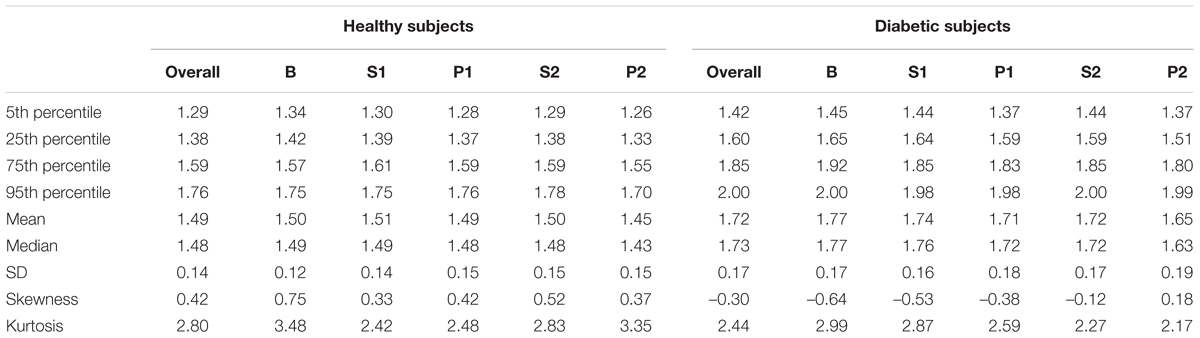
TABLE 2. Numerical characteristics of HFD aggregated distributions for experimental phases B, S1, P1, S2, P2 in healthy and diabetic subjects.
Average HFD Values Across the Time Series
Wilcoxon matched-pairs signed rank test revealed statistical differences between the average HFD(t) values in healthy and diabetics (W = 4,950, 99 pairs, p < 0.0001). The mean(median) difference between the groups was 0.226(0.230). Absolute Pearson’s linear correlation coefficient between the average HFD(t) values and the time course of experiment was larger in diabetics (r = –0.56, p < 0.0001), than in healthy (r = –0.44, p = 0.0002; Figure 2).
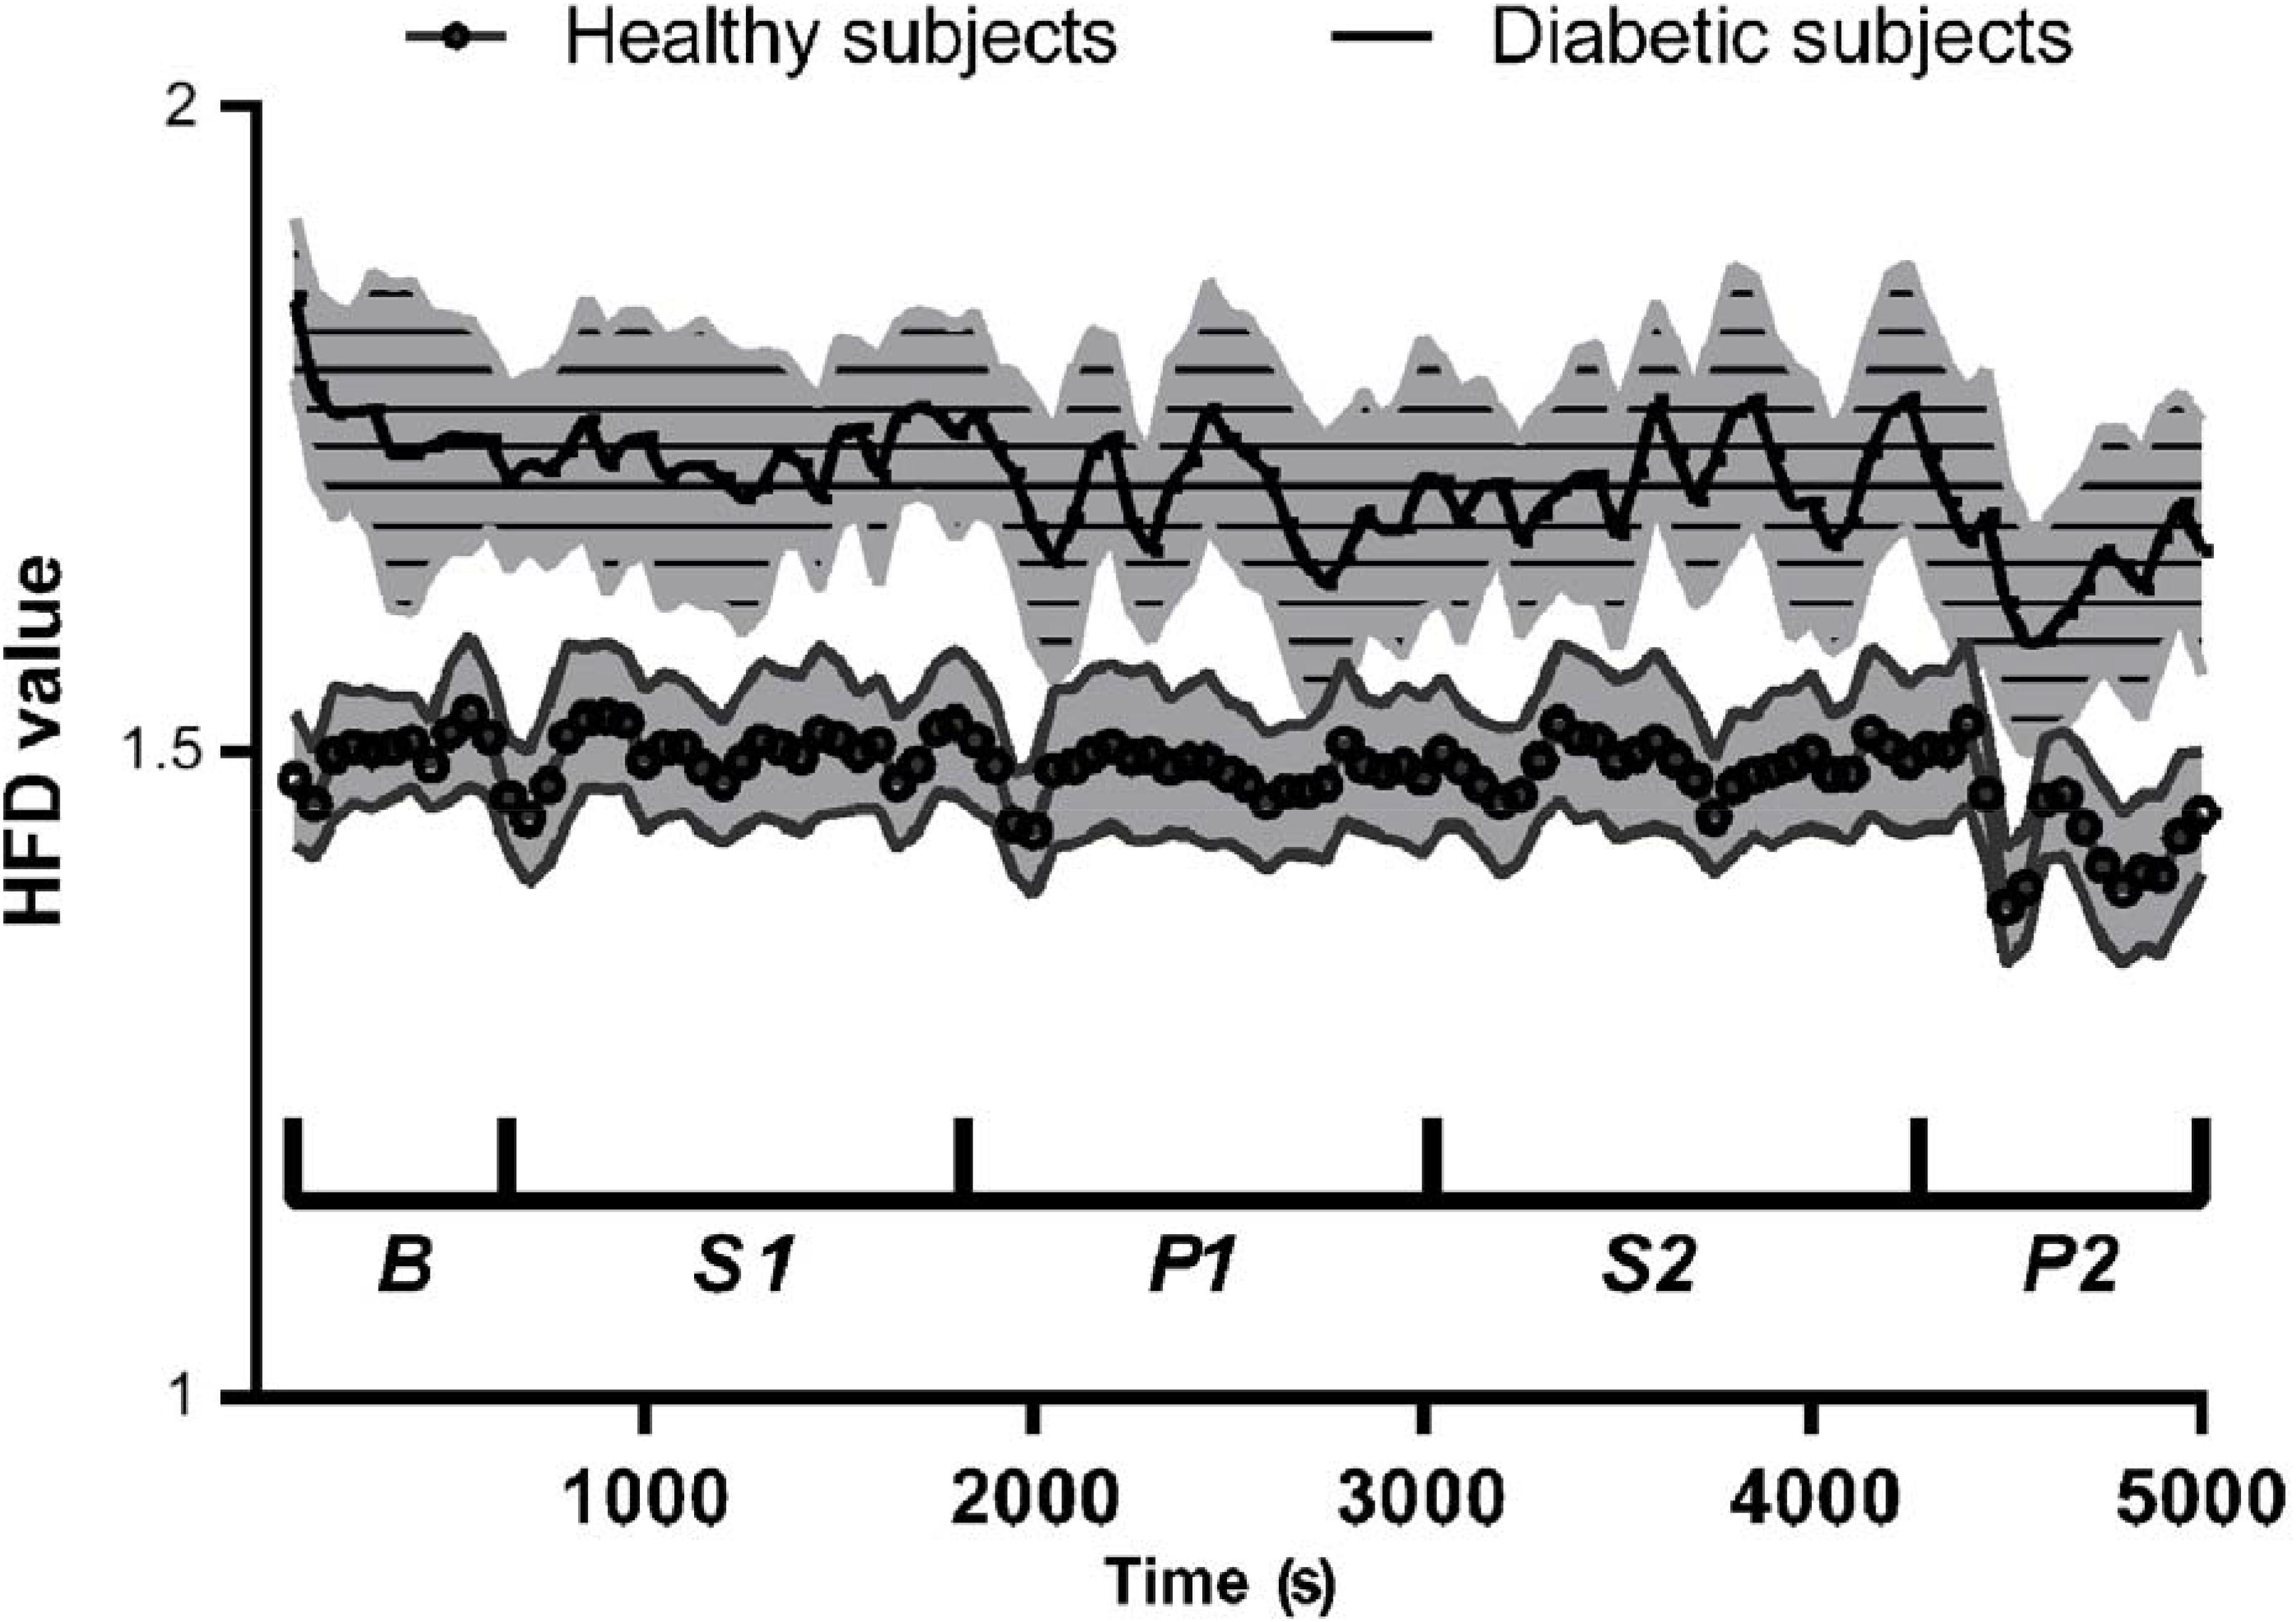
FIGURE 2. Mean ± 95% confidence intervals of HFD values during the course of experiment, for healthy and diabetic subjects separately.
Average HFD Values Within the Experimental Phases
Two-way ANOVA showed significant differences between the average HFD’s from different experimental phases, in healthy and diabetic subjects. The differences were visible between the healthy and diabetic group [F(1,43) = 60.79, p < 0.0001], and due to the experimental phases [F(4,172) = 10.80, p < 0.0001]. Bonferroni’s multiple comparisons test showed significant differences in mean HFD values between B and P2, S1 and P2, and S2 and P2 phases both in healthy (p < 0.05, p < 0.01, and p < 0.05, respectively) and diabetics (p < 0.001, p < 0.01, and p < 0.05, respectively). The mean HFD values were significantly different between healthy and diabetics in all phases (largest p < 0.05) except P2 in diabetic subjects, which was not different from B, S1, and P2 in healthy (Figure 3).
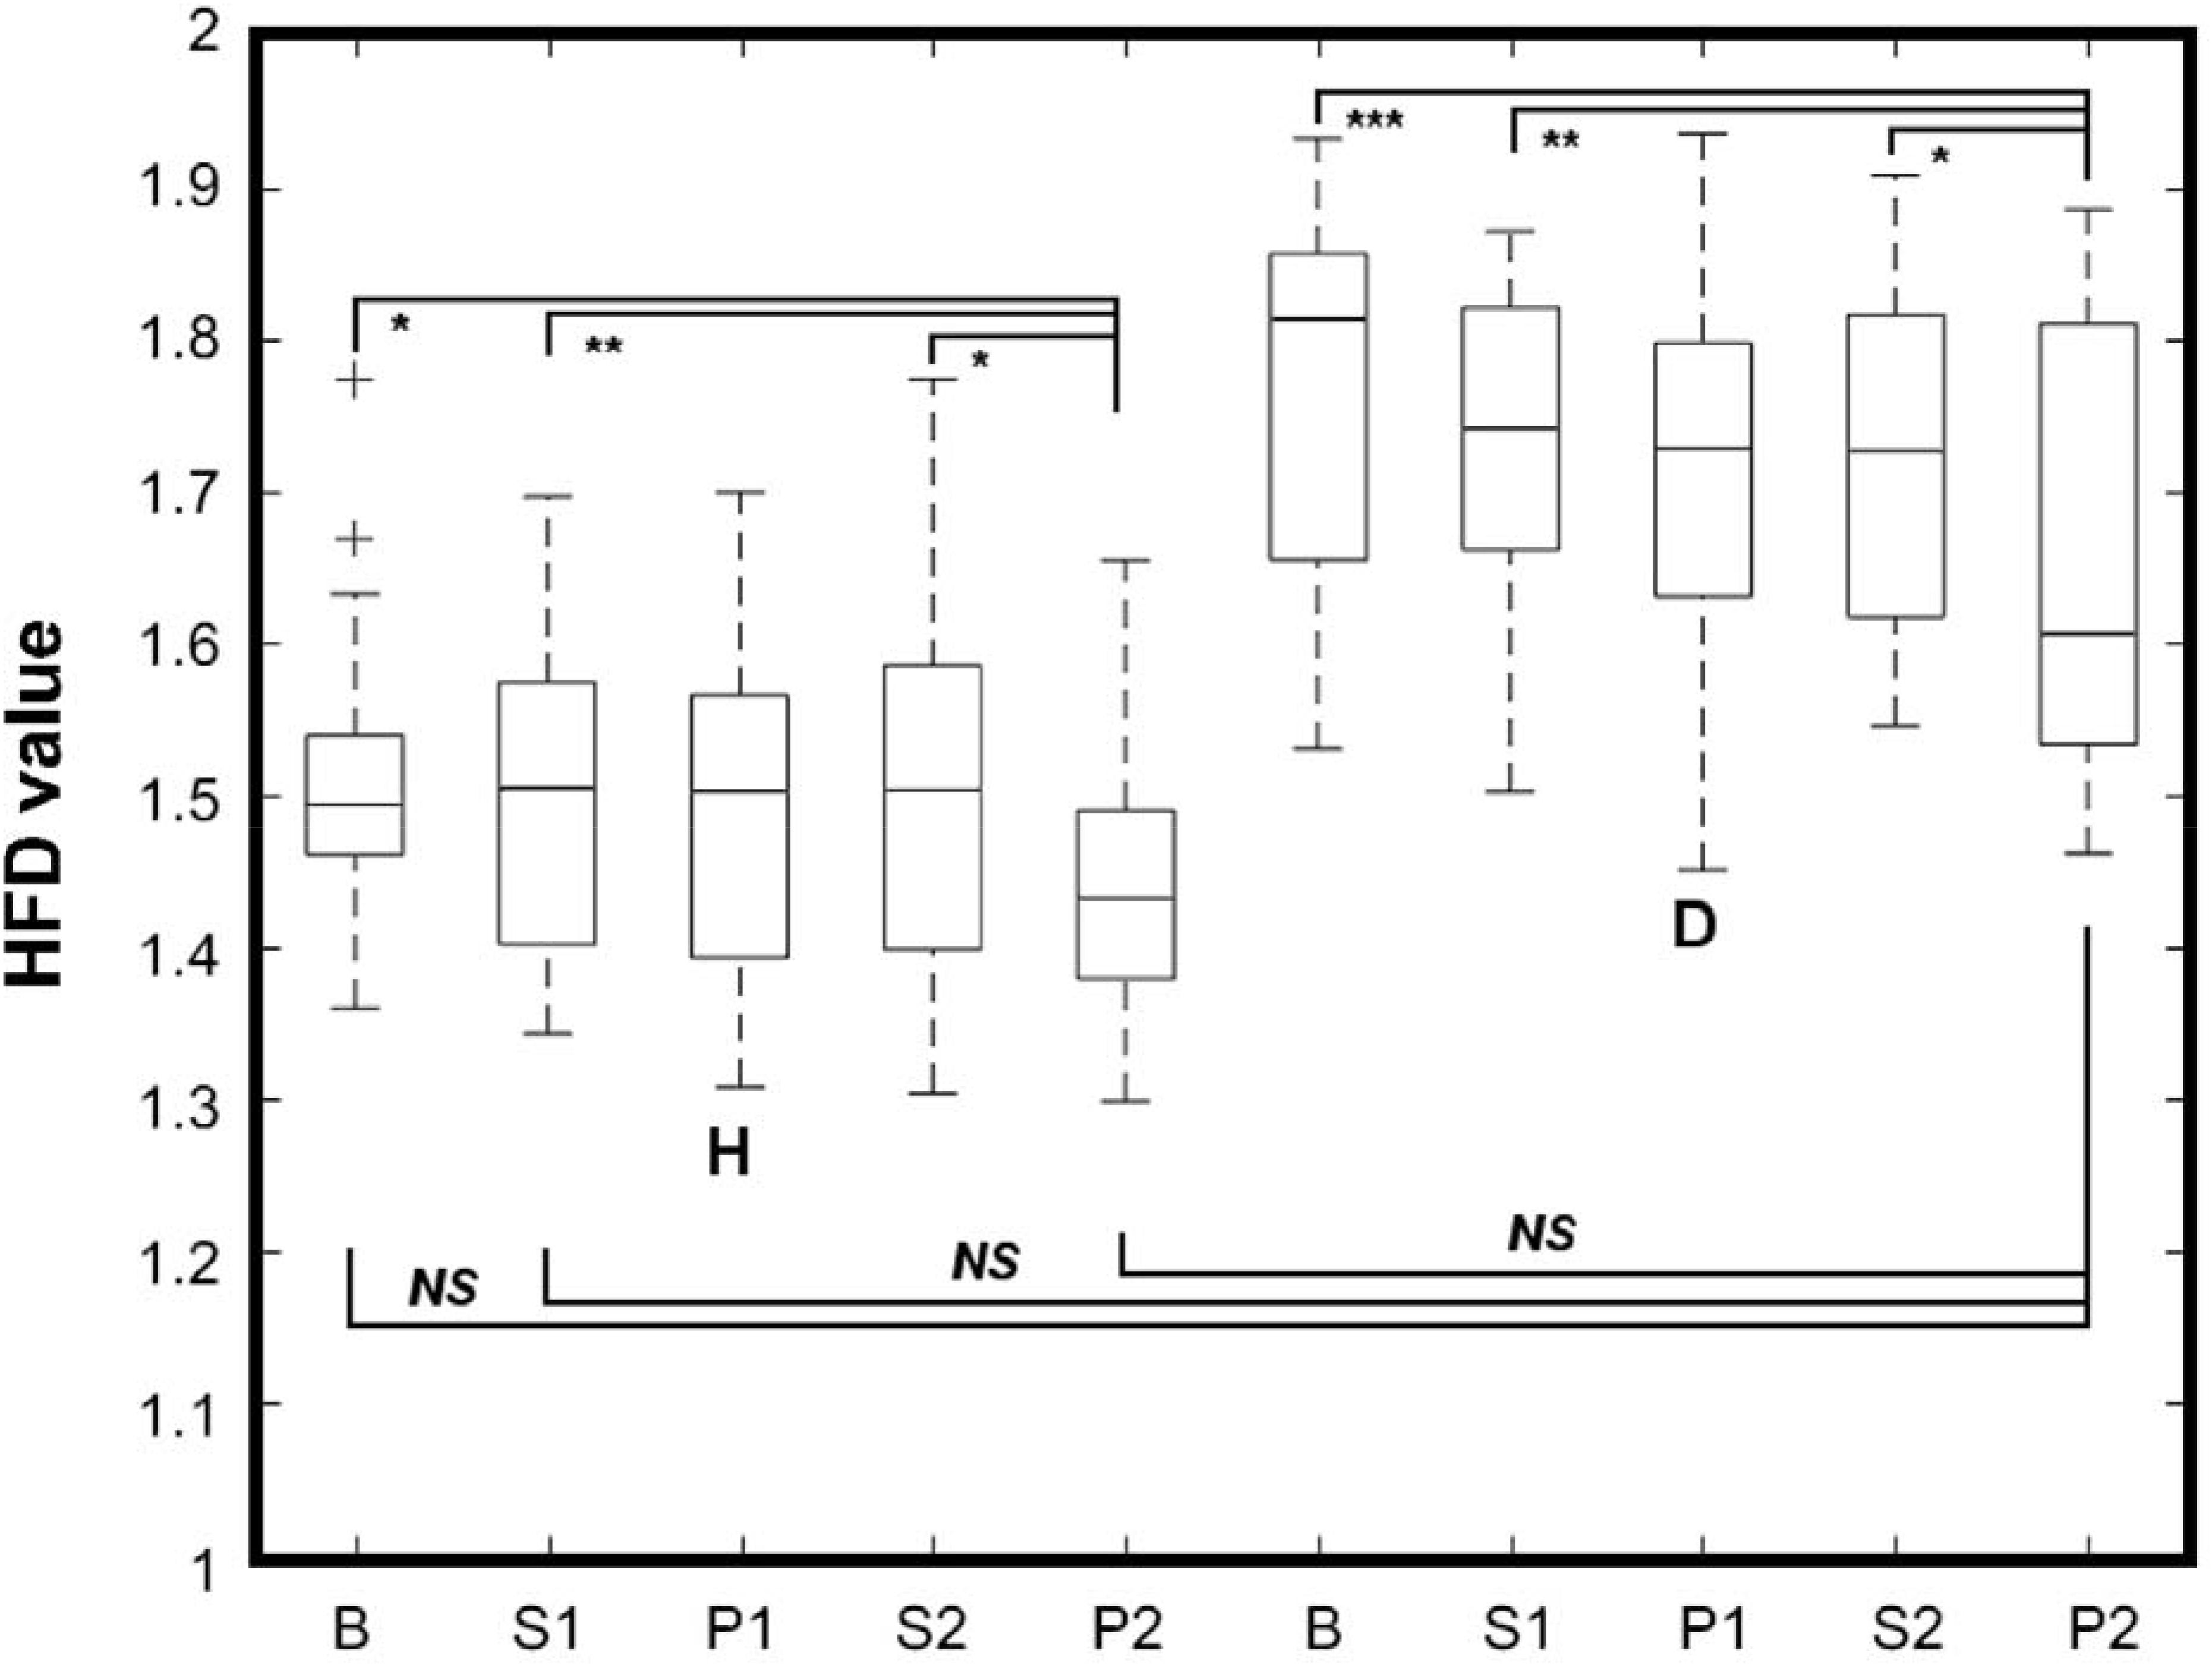
FIGURE 3. Whiskers-box plot for HFD values aggregated in respect to the phase of experiment, for healthy (H) and diabetic (D) subjects separately. Whiskers represent the range of min-max HFD values. B, S1, P1, S2, P2 – phases of the experiment. ∗p < 0.05; ∗∗p < 0.01; ∗∗∗p < 0.001.
Aggregated Distributions of HFD Within the Experiment Phases
Table 2 presents numerical characteristics of HFD aggregated distributions for experimental phases B, S1, P1, S2, P2 (5th, 25th, 75th, and 95th percentiles, means, medians, SDs, skewness and kurtosis) in healthy and diabetic subjects. Figure 4 shows 10 bins-wide histograms of the aggregated HFD distributions for the phases and Figure 5 shows contrast histograms for comparison of the distributions between S1 and B; P1 and S1, S2 and P1, P2 and S2, and P2 and B phases, for healthy and diabetics. The characteristics and the histograms were calculated in total from 4,455 HFD values. Overall mean(median) ± SD HFD values were found as 1.49(1.48) ± 0.14 and 1.72(1.73) ± 0.17 for healthy and diabetic subjects, respectively. In diabetic subjects, skewness of aggregated HFD distributions was observed to change from negative (–0.64) to positive (0.18) between the experimental phases (Pearson’s correlation coefficient r = 0.98; R2= 0.96, p < 0.01). The opposite, but not monotonic (and not significantly different from zero slope) effect was observable in the healthy group (r = 0.54; R2= 0.29, p = 0.35). Moreover, kurtosis of the distributions was found consistently dropping over the experimental phases only in diabetics.
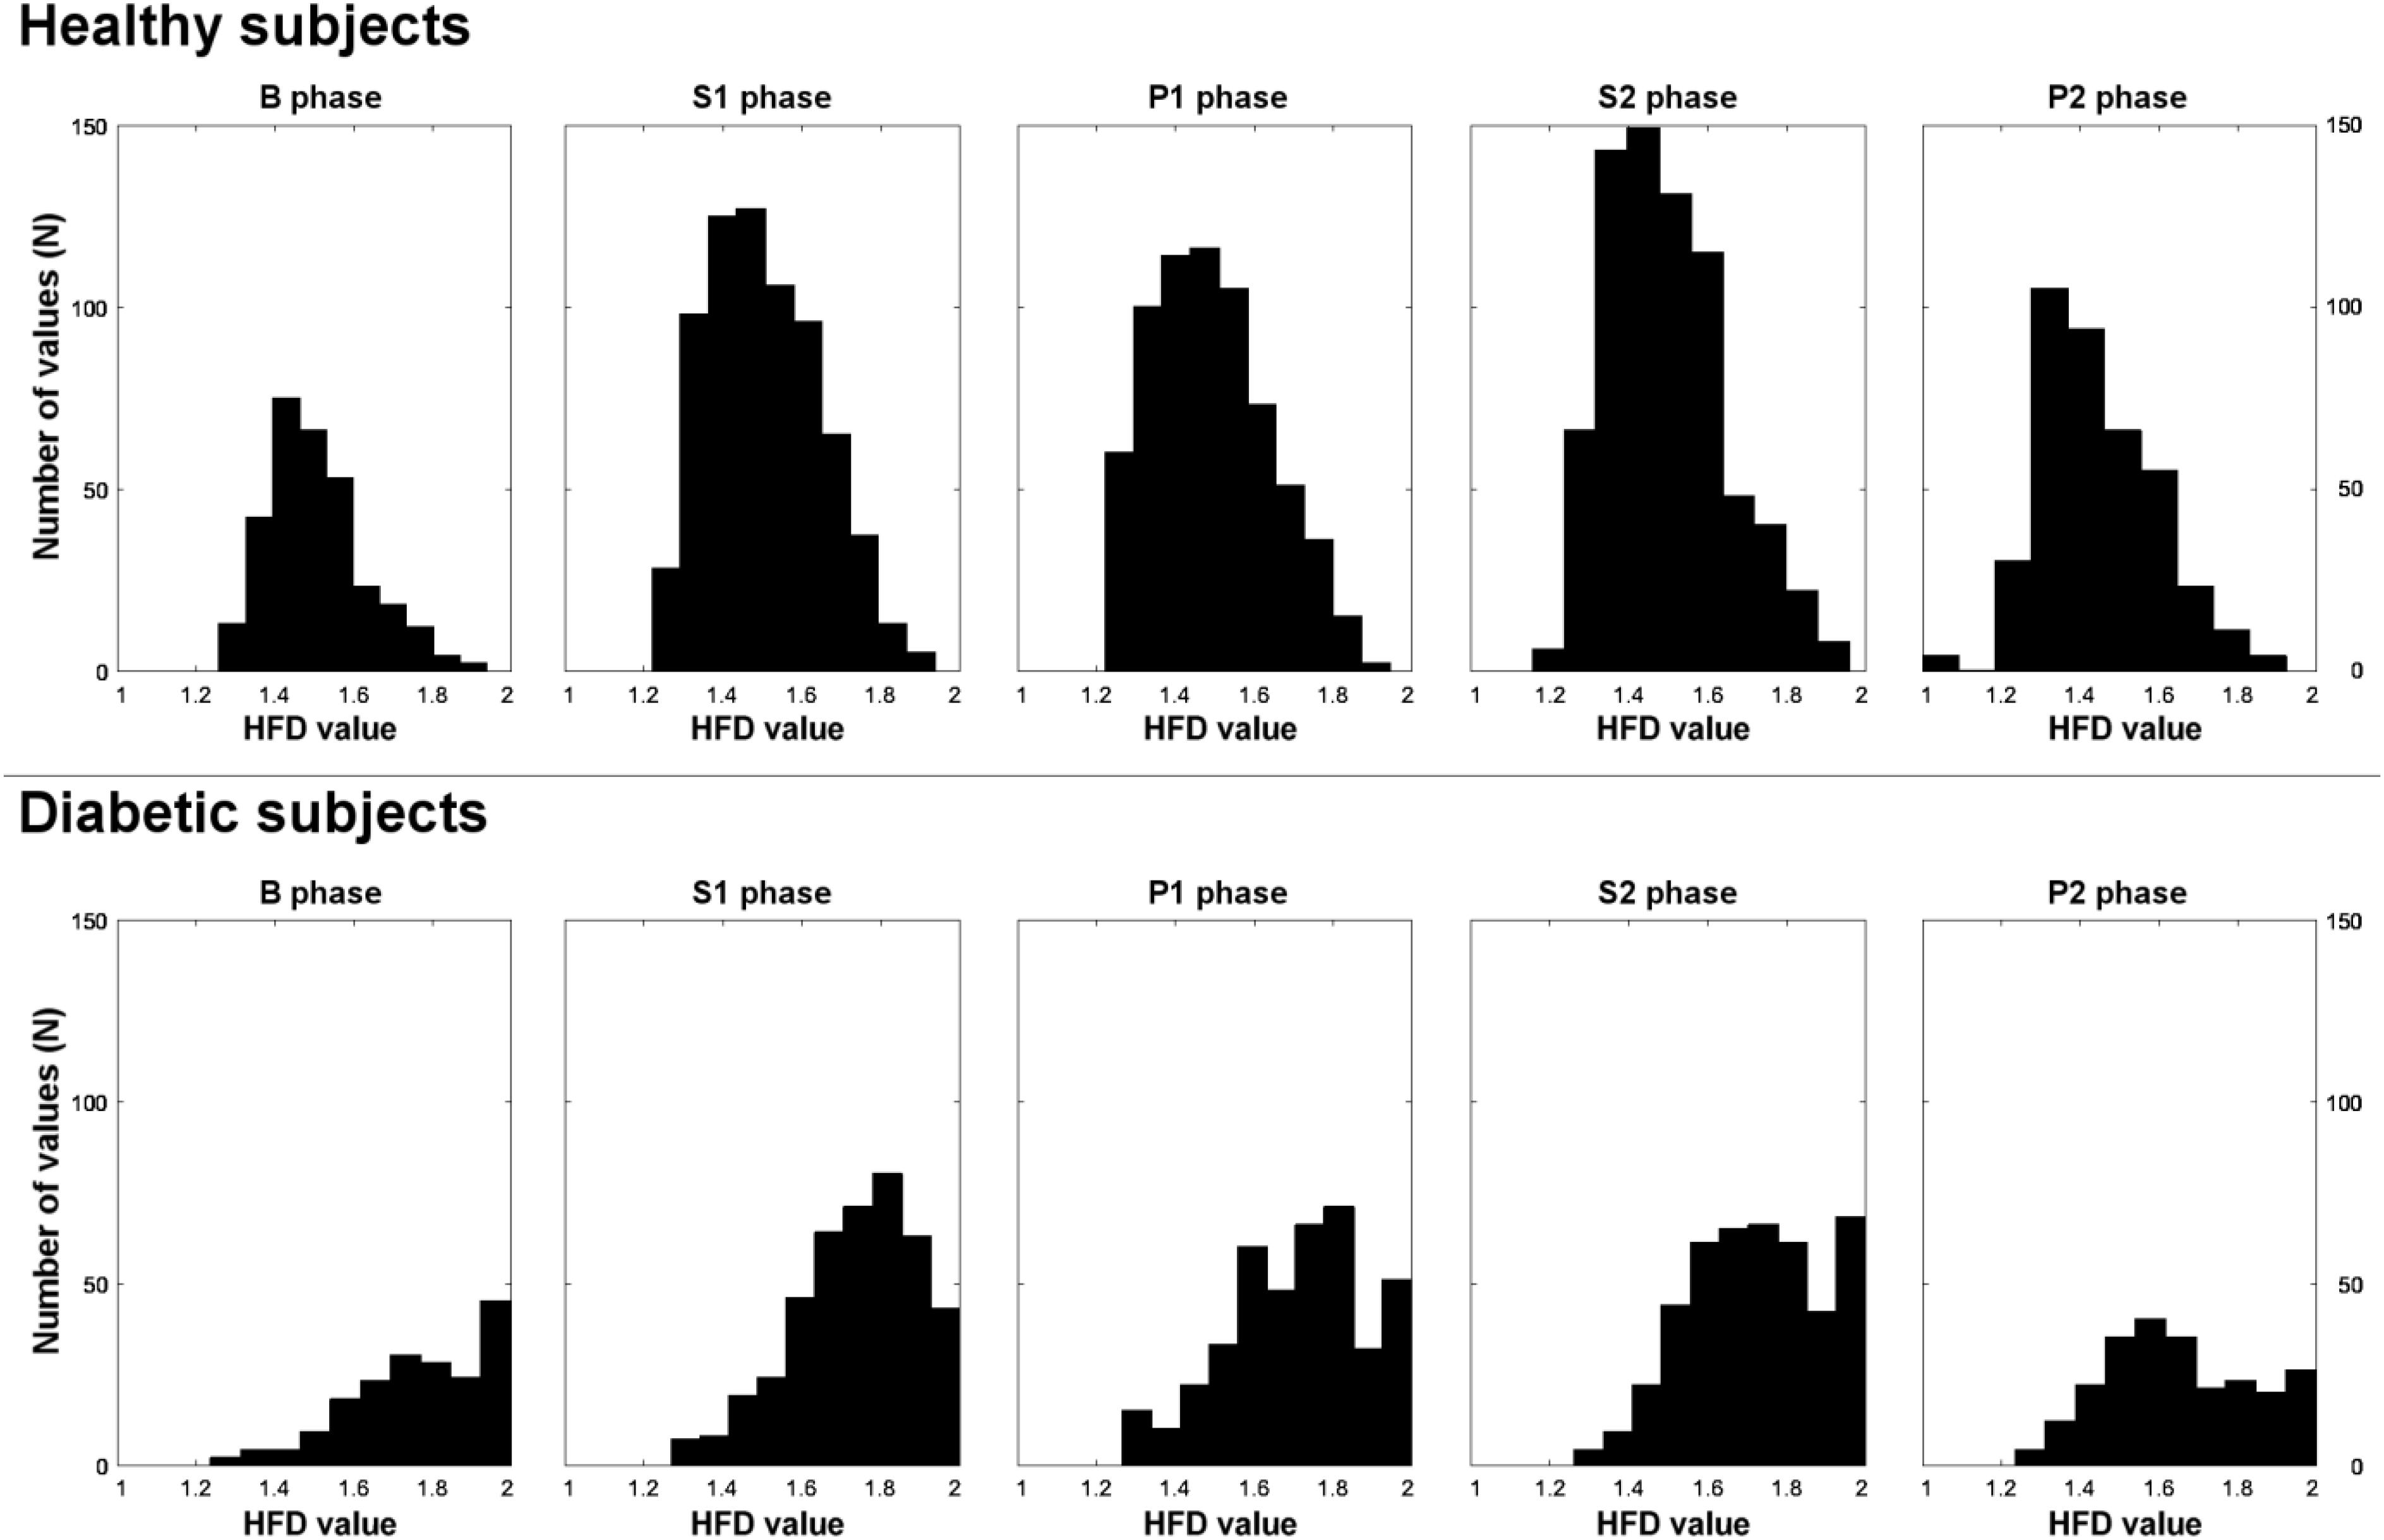
FIGURE 4. Histograms of aggregated HFD distributions from B, S1, P1, S2, P2 experimental phases, for healthy and diabetic subjects separately.
Discussion
This study advances knowledge in HRV analysis in healthy and diabetic subjects. By means of our implementation of Higuchi’s method, overall mean ± SD of aggregated HFD values were found higher for diabetics than for healthy subjects (Figure 1 and Table 2). Significant differences in mean values of HFD aggregated distributions were found between the B, S1, and P2 phases in both groups. It is also worth to highlight that the mean HFD from P2 in diabetics was found not different from that in B, S1, and P2 phases in healthy (Figure 3). The results indicate no significant influence of pVNS on mean HFD during or directly after the stimulation in both groups. However, the effect seems to be delayed in time and its overall permanence was more explicit in diabetics than in healthy subjects. Moreover, skewness of the aggregated HFD distributions was rising significantly from negative to positive between the phases in diabetics, while a clear trend was not observable in healthy.
Our findings agree with the changes observed in spectral analysis of the RR time series, like the total power (TP – total variability), high frequency power (HF – parasympathetic activity), low frequency (LF – mixed sympathetic and parasympathetic activity) power, and the LF/HF ratio (sympathovagal balance) in the presented subject population (Kampusch et al., 2015b, unpublished data). TP, HF, LF, and LF/HF significantly differ between healthy and diabetic subjects at baseline and converge due to stimulation. Increases in those parameters could be shown due to stimulation in healthy and diabetics, indicating an increased parasympathetic activity and changed sympathovagal balance, like also observed in HFD analysis here. Further studies are required to understand in detail the interrelation of the evaluated HFD parameters with ANS measures. However, our findings are in accordance with previous reports regarding the HFD or detrended fluctuation analysis (Ashkenazy et al., 1999) of the HRV signal in normal conditions, congestive heart failure and heart transplanted patients (Cerutti et al., 2007), single or multiple lesions stroke (D’Addio et al., 2009), in arrhythmia (Pierzchalski et al., 2011), during meditation (Diosdado et al., 2010; Kamath, 2013), guided breathing exercises (Tavares et al., 2016), in children with ADHD hyperactivity disorder (Wajnsztejn et al., 2016), in healthy subjects immediately after physical exercises (Gomes et al., 2017), or in diabetes (Malpas and Maling, 1990).
Our results indicate a slight pVNS-induced shift of HFD values from assembled close to 2 (chaotic signal) to lower values, in diabetics. The shift was observed mostly for the HFDs above the 50th percentile of distribution and was confirmed by the change in the distribution’s skewness and kurtosis (Table 2 and Figure 4). Moreover, a relative increase in HFDs below 1.6 is observable in P2, compared to B in diabetics. The effect is connected with a smaller decrease for HFDs above 1.6 (Figure 5). In contrary, pVNS seems to affect the whole distribution of the HFD values equally in healthy. The shape of the HFD distribution was not changed here substantially over the experiment (Figure 4), however, a slight increase in the higher HFDs associated with a decrease in HFDs of lower range is observable between P2 and B (Figure 5).
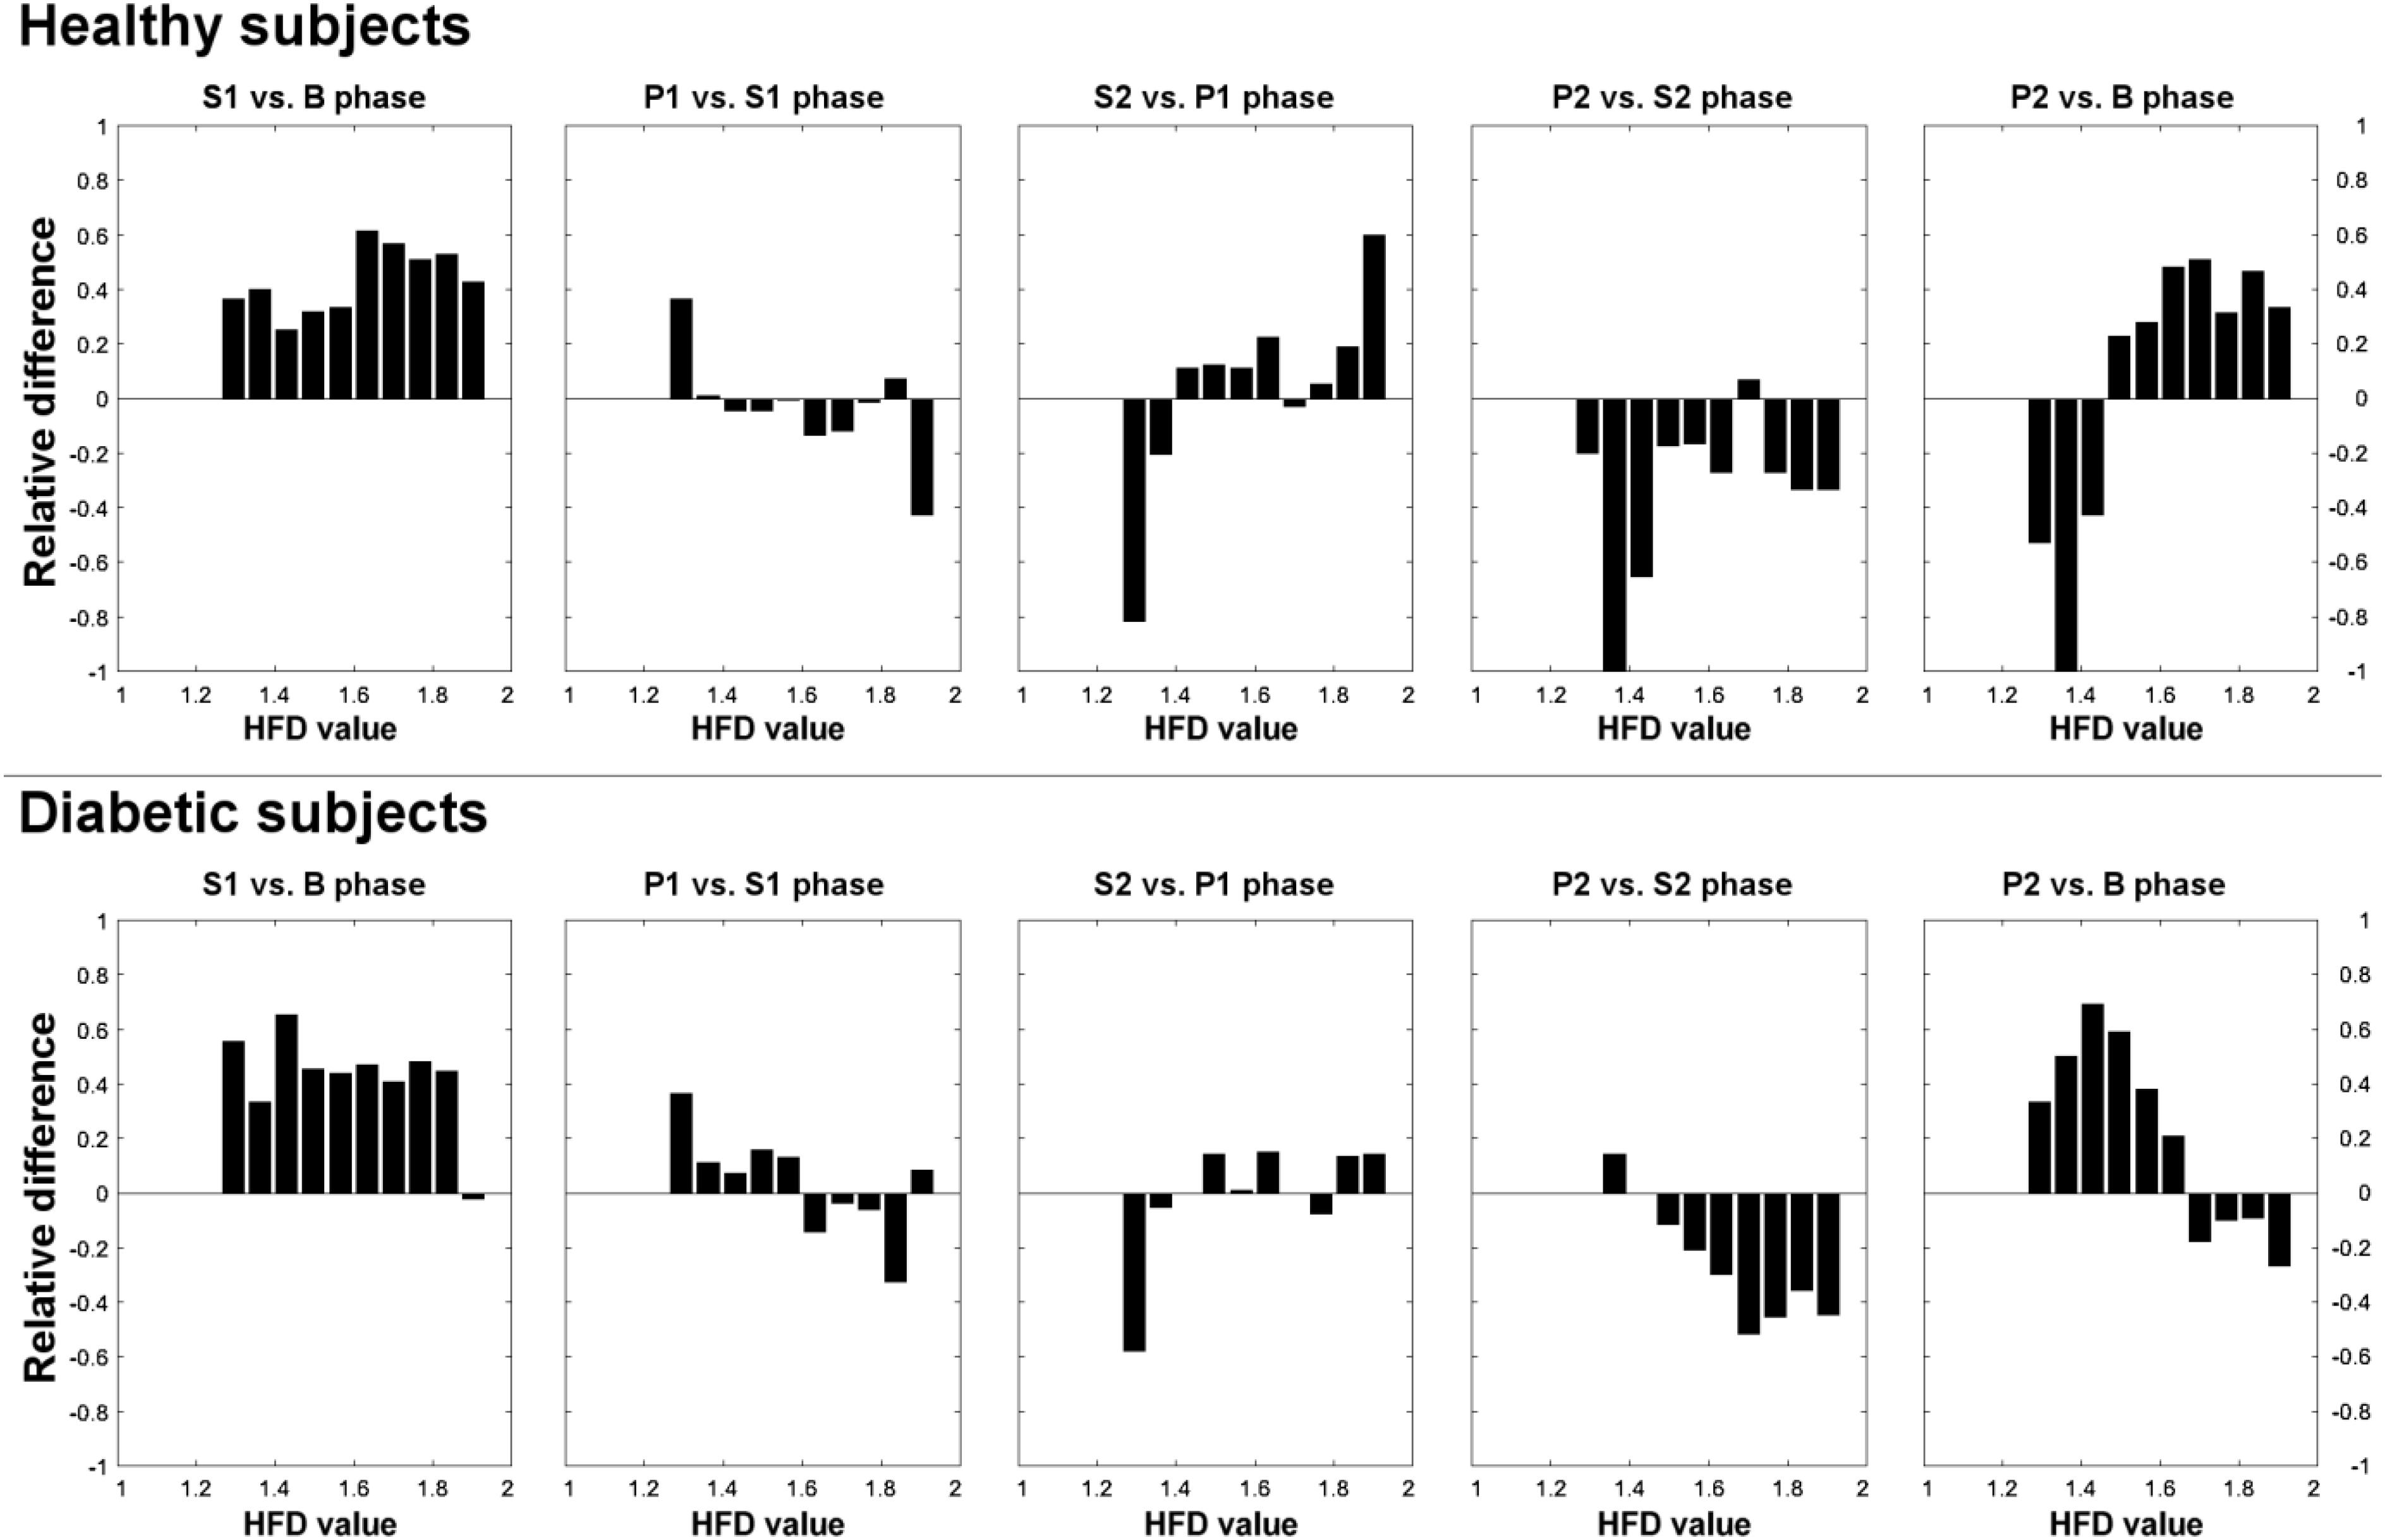
FIGURE 5. Contrast histograms of HFD distributions for comparison of S1 and B; P1 and S1, S2 and P1, P2 and S2, and P2 and B experimental phases, for healthy and diabetic subjects separately.
As higher HFD values correspond to the presence of higher frequencies in the signals Fourier spectrum (Yeragani et al., 1993; Klonowski et al., 2006) our observations would suggest that pVNS may increase the parasympathetic (see above) and decrease the sympathetic activity of ANS in diabetic conditions, which is in line with (Clancy et al., 2014) for healthy subjects. Such observation implies VNS-induced stabilization of ANS balance in diabetic subjects. It is worth to note that due to neuropathy a lower parasympathetic and lower sympathetic activity is generally observed in diabetes, compared to normal conditions (Task Force of the European Society of Cardiology the North American Society of Pacing Electrophysiology, 1996). Moreover, we found diabetic subjects showing larger SD of HFD values in all of the experimental phases (“more chaotic” RR signal), so pVNS seems to have a “fine-tuning” effect on ANS activity. The effect in healthy is much weaker, since pVNS seems to alter their ANS activity within the range of auto regulation capabilities.
Limitations of our study include the necessary predefinition of the input parameter kmax, in advance. Herein, we have experimentally set kmax to 5. Higher kmax values would provide underestimation, while lower provide overestimation of HFD (HFD close to 1 or to 2, respectively). In both situations the distinction between the healthy and diabetic group might be not possible (Figure 1). Further, with respect to the included subject groups, a significant difference in BMI of healthy and diabetic subjects (Table 1) needs to be considered as a potential co-founding factor when analyzing ANS function. We have performed analysis of HRV time series recalculated from original ECG signals. It was previously shown that HFD may provide similar results when applied to raw data (Pierzchalski et al., 2011). Hence, it would be worth to compare HFD analysis with spectral analysis performed on the same HRV time series, or to apply both analyses to the original ECG signals from diabetic and healthy subjects. Additionally, physical activity and medication were not documented during the study for diabetic subjects.
Hence, our results indicate that HFD provides high resolution insight into ANS activity during pVNS based on HRV time series analysis. Simplicity of HFD makes the assessment of ANS activity prospectively possible in on-line systems and may bring accuracy (Figure 6) to both diagnostic systems and therapeutic closed-loop pVNS systems.
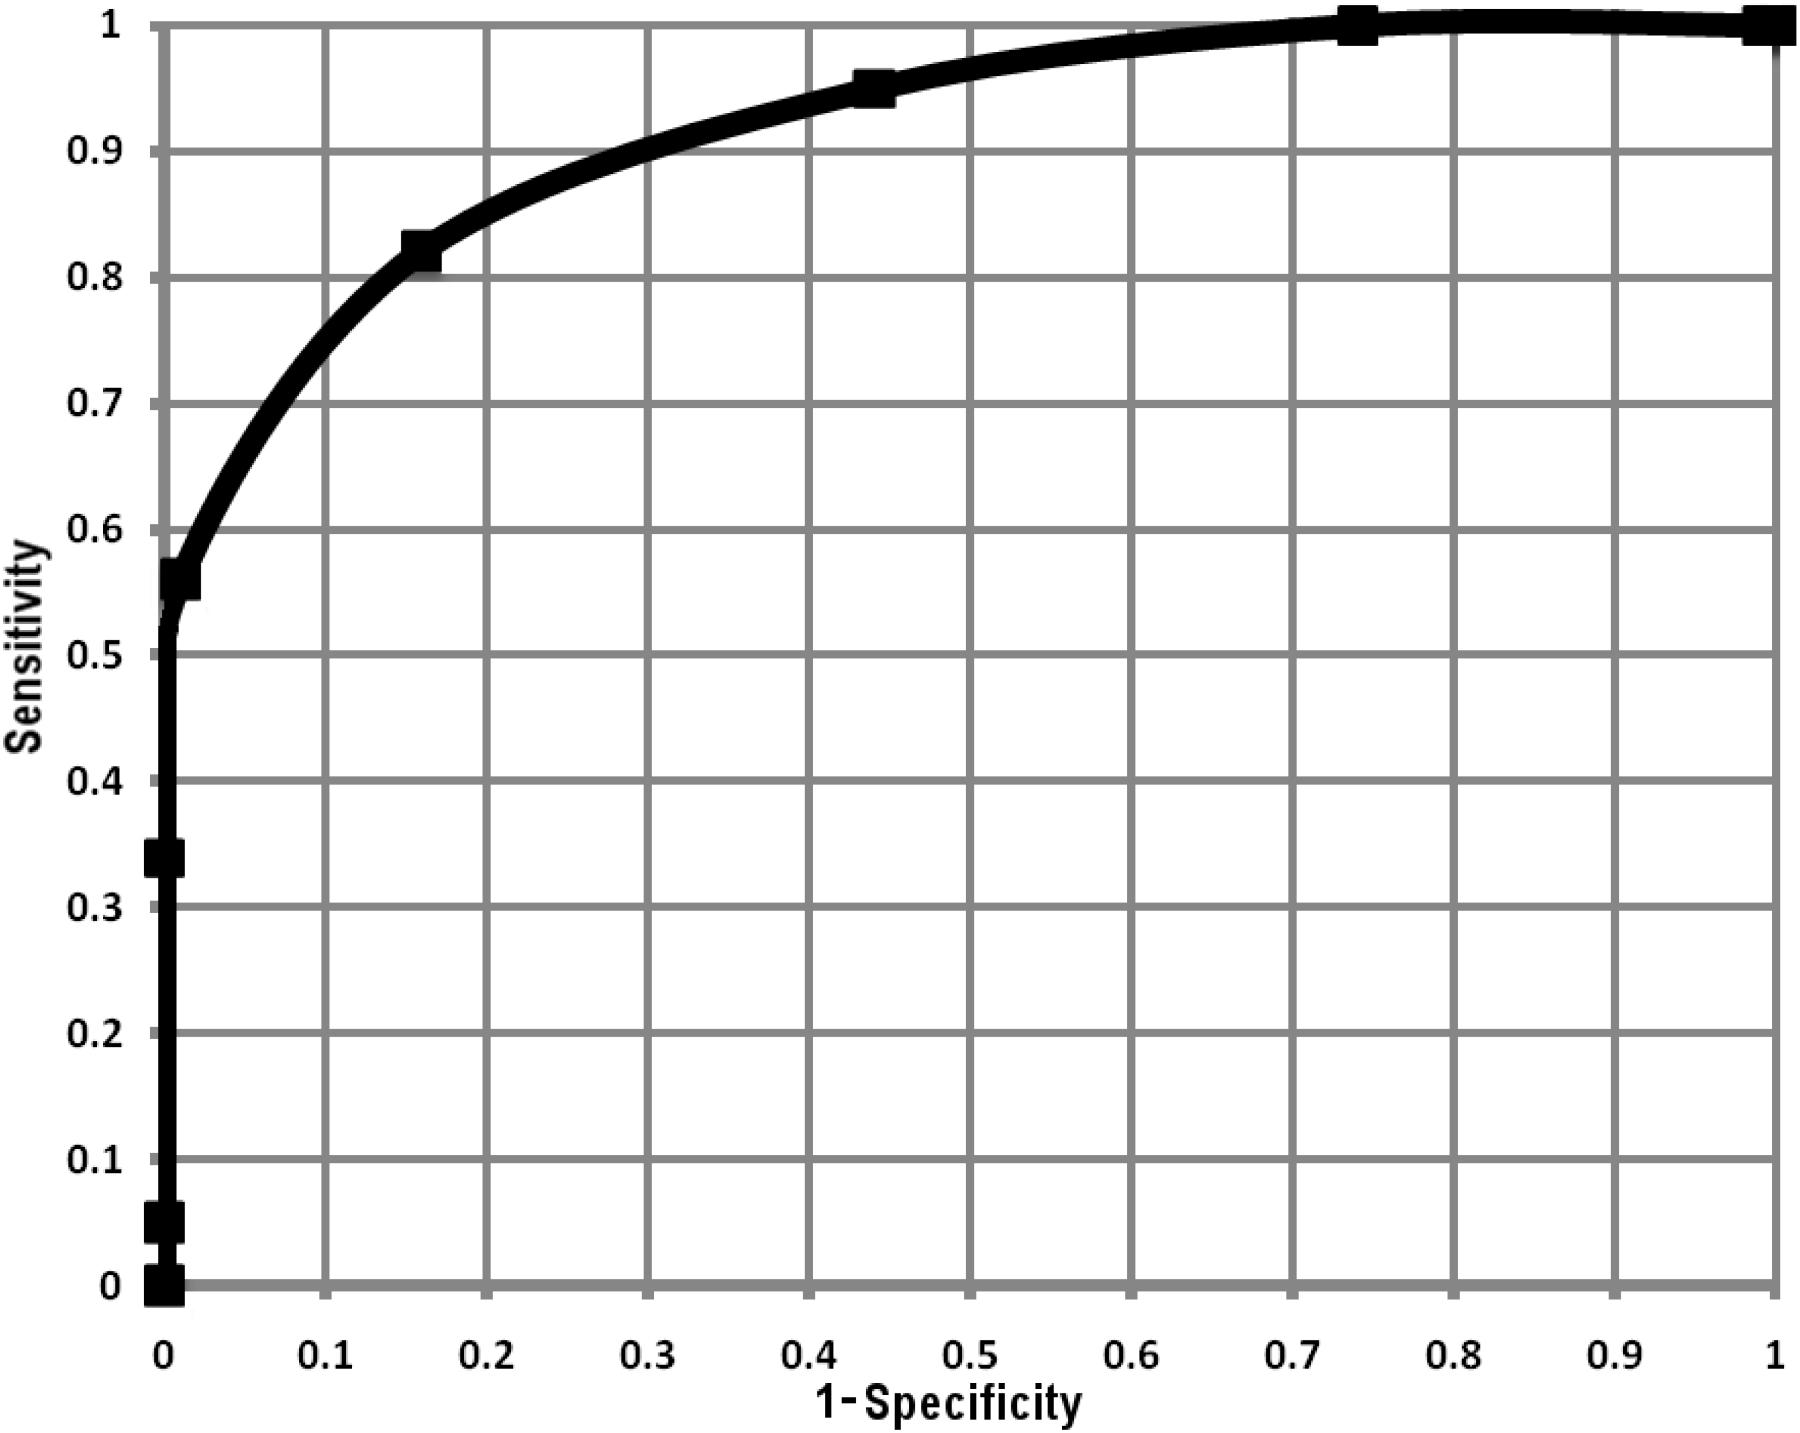
FIGURE 6. Receiver operating curve calculated from average HFD values within the experimental phases, for each healthy and diabetic subject (in total 140 HFD values for healthy and 85 for diabetic subjects).
Conclusion
We have shown that the HFD assesses the ANS activity and differentiates healthy from diabetic subjects, based on HRV signals. Moreover, HFD provides fast and robust distinction between action of parasympathetic and sympathetic ANS activity. Because of its simplicity, HFD may be easily used in pVNS systems to provide direct stimulation feedback for on-line regulation of therapy. Hence, our results have potential implication for patients’ care and technological advancement of pVNS therapy.
Author Contributions
RG performed the data analysis and wrote the manuscript. SK and FT performed the data analysis and reviewed the manuscript. EK supervised the data analysis and reviewed the manuscript. JS supplied the data and reviewed the manuscript. WK designed the conception of the work, supervised the data analysis, and reviewed the manuscript.
Funding
This research was partially funded by EU COST Action BM1309 “EMF-MED,” through “Short Term Scientific Mission” (STSM) grant for RG. SK and EK were funded by the Austrian Research Promotion Agency (Grant No. 853701).
Conflict of Interest Statement
JS, EK, and SK own shares and receive honoraria from SzeleSTIM GmbH.
The remaining authors declare that the research was conducted in the absence of any commercial or financial relationships that could be construed as a potential conflict of interest.
The handling Editor declared a past co-authorship with one of the authors, WK.
Acknowledgments
RG and WK acknowledge support by Nalecz Institute of Biocybernetics and Biomedical Engineering, Polish Academy of Sciences through its statutory activity and covering publication costs.
Abbreviations
ANS, autonomic nervous system; HFD, Higuchi fractal dimension; HRV, heart rate variability; pVNS, percutaneous auricular vagus nerve stimulation; SD, standard deviation.
References
Ashkenazy, Y., Lewkowicz, M., and Levitan, J. (1999). Discrimination between healthy and sick cardiac autonomic nervous system by detrended heart rate variability analysis. Fractals 07, 85–91. doi: 10.1142/S0218348X99000104
Bian, C., Qin, C., Ma, Q. D., and Shen, Q. (2012). Modified permutation-entropy analysis of heartbeat dynamics. Phys. Rev. E Stat. Nonlin. Soft Matter Phys. 85(2 Pt 1):021906. doi: 10.1103/PhysRevE.85.021906
Cerutti, S., Esposti, F., Ferrario, M., Sassi, R., and Signorini, M. G. (2007). Long-term invariant parameters obtained from 24-h holter recordings: a comparison between different analysis techniques. Chaos 17:15108. doi: 10.1063/1.2437155
Clancy, J. A., Mary, D. A., Witte, K. K., Greenwood, J. P., Deuchars, S. A., and Deuchars, J. (2014). Non-invasive vagus nerve stimulation in healthy humans reduces sympathetic nerve activity. Brain Stimul. 7, 871–877. doi: 10.1016/j.brs.2014.07.031
D’Addio, G., Corbi, G., Accardo, A., Russo, G., Ferrara, N., Mazzoleni, M. C., et al. (2009). Fractal behaviour of heart rate variability reflects severity in stroke patients. Stud. Health Technol. Inform. 150, 794–798. doi: 10.3233/978-1-60750-044-5-794
Di Ieva, A., Esteban, F. J., and Grizzi, F. (2015). Fractals in the Neurosciences, Part II. Neuroscientist 21, 30–43. doi: 10.1177/1073858413513928
Diosdado, A. M., Coyt, G. G., and Uribe, B. M. P. (2010). “Oscillations in the evaluation of fractal dimension of RR intervals time series,” in Proceedings of the 2010 Annual International Conference of the IEEE Engineering in Medicine and Biology (Piscataway, NJ: IEEE), 4570–4573.
Gomes, R. L., Vanderlei, L. C. M., and Garner, D. M. (2017). Higuchi fractal analysis of heart rate variability is sensitive during recovery from exercise in physically active men. Med. Express 4, 1–8. doi: 10.5935/MedicalExpress.2017.03.02
Higuchi, T. (1988). Approach to an irregular time series on the basis of the fractal theory. Physica D 31, 277–283. doi: 10.1016/0167-2789(88)90081-4
Jiang, S., Bian, C., Ning, X., and Ma, Q. D. (2013). Visibility graph analysis on heartbeat dynamics of meditation training. Appl. Phys. Lett. 102, 253–702. doi: 10.1063/1.4812645
Kamath, C. (2013). Analysis of heart rate variability signal during meditation using deterministic-chaotic quantifiers. J. Med. Eng. Technol. 37, 436–448. doi: 10.3109/03091902.2013.828106
Kampusch, S., Kaniusas, E., and Szeles, J. C. (2013). “New approaches in multi-punctual percutaneous stimulation of the auricular vagus nerve,” in Proceedings of the Sixth Annnual International Conference on IEEE/EMBS Neural Engineering, San Diego, CA.
Kampusch, S., Kaniusas, E., and Széles, J. C. (2015a). Modulation of muscle tone and sympathovagal balance in cervical dystonia using percutaneous stimulation of the auricular vagus nerve. Artif. Organs 39, E202–E212. doi: 10.1111/aor.12621
Kampusch, S., Thürk, F., Kaniusas, E., and Széles, J. C. (2015b). “Autonomous nervous system modulation by percutaneous auricular vagus nerve stimulation,” in Proceedings of the 2015 IEEE Sensors Applications Symposium, Zadar, 79–84.
Kaniusas, E., Kampusch, S., and Széles, J. C. (2015). “Depth profiles of the peripheral blood oxygenation in diabetics and healthy subjects in response to auricular electrical stimulation,” in Proceedings of the 2015 IEEE Sensors Applications Symposium, Zadar, 11–16.
Kesić, S., and Spasić, S. Z. (2016). Application of higuchi’s fractal dimension from basic to clinical neurophysiology: a review. Comput. Methods Programs 133, 55–70. doi: 10.1016/j.cmpb.2016.05.014
Klonowski, W. (2007). From conformons to human brains: an informal overview of nonlinear dynamics and its applications in biomedicine. Nonlinear Biomed. Phys. 1:5. doi: 10.1186/1753-4631-1-5
Klonowski, W. (2011). Personalized neurological diagnostics from biomedical physicist’s point of view and application of new non-linear dynamics methods in biosignal analysis. Int. J. Biol. Biomed. Eng. 5, 190–200.
Klonowski, W., Olejarczyk, E., Stepien, R., et al. (2006). “Monitoring the depth of anaesthesia using fractal complexity method,” in Complexus Mundi, ed. M. Novak Miroslav (Singapore: World Scientific), 333–342.
La Marca R, Nedeljkovic, M., Yuan, L., Maercker, A., and Elhert, U. (2010). Effects of auricular electrical stimulation on vagal activity in healthy men: evidence from a three-armed randomized trial. Clin. Sci. 118, 537–546. doi: 10.1042/CS20090264
Malpas, S. C., and Maling, T. J. (1990). Heart-rate variability and cardiac autonomic function in diabetes. Diabetes Metab. Res. Rev. 39, 1177–1181. doi: 10.2337/diabetes.39.10.1177
Murray, A. R., Atkinson, L., Mahadi, M. K., Deuchars, S. A., and Deuchars, J. (2016). The strange case of the ear and the heart: the auricular vagus nerve and its influence on cardiac control. Auton. Neurosci. 199, 48–53. doi: 10.1016/j.autneu.2016.06.004
Pierzchalski, M., Stepien, R. A., and Stepien, P. (2011). New nonlinear methods of heart rate variability analysis in diagnostics of atrial fibrillation. Int. J. Biol. Biomed. Eng. 5, 201–208.
Sassi, R., Cerutti, S., Lombardi, F., Malik, M., Huikuri, H. V., Peng, C. K., et al. (2015). Advances in heart rate variability signal analysis: joint position statement by the e-cardiology ESC working group and the european heart rhythm association co-endorsed by the asia pacific heart rhythm society. Europace 17, 1341–1353. doi: 10.1093/europace/euv015
Shaffer, F., and Ginsberg, J. P. (2017). An overview of heart rate variability metrics and norms. Front. Public Health 5:258. doi: 10.3389/fpubh.2017.00258
Sharma, V. (2009). Deterministic chaos and fractal complexity in the dynamics of cardiovascular behavior: perspectives on a new frontier. Open Cardiovasc. Med. J. 3, 110–123. doi: 10.2174/1874192400903010110
Skinner, J., Molnar, M., Vybiral, T., and Mitra, M. (1992). Application of chaos theory to biology and medicine.itle. Integr. Physiol. Behav. Sci. 27, 39–53. doi: 10.1007/BF02691091
Task Force of the European Society of Cardiology the North American Society of Pacing Electrophysiology (1996). Heart rate variability: standards of measurement, physiological interpretation, and clinical use. Circulation 93, 1043–1065. doi: 10.1161/01.CIR.93.5.1043-1065
Tavares, B. S., de, Paula Vidigal G, Garner, D. M., Raimundo, R. D., de, Abreu LC, and Valenti, V. E. (2016). Effects of guided breath exercise on complex behaviour of heart rate dynamics. Clin. Physiol. Funct. Imaging 37, 1–8. doi: 10.1111/cpf.12347
Wagner, C., and Persson, P. (1998). Chaos in the cardiovascular system: an update. Cardiovasc. Res. 40, 257–264. doi: 10.1016/S0008-6363(98)00251-X
Wajnsztejn, R., Carvalho, T. D., De, and Garner, D. M. (2016). Higuchi fractal dimension applied to RR intervals in children with attention deficit hyperactivity disorder. J. Hum. Growth Dev. 26, 147–153. doi: 10.7322/jhgd.119256
West, B. J. (2010). Fractal physiology and the fractional calculus: a perspective. Front. Physiol. 1:12. doi: 10.3389/fphys.2010.00012
Keywords: Higuchi fractal dimension, heart rate variability, autonomic nervous system, vagus nerve stimulation, diabetes
Citation: Gomolka RS, Kampusch S, Kaniusas E, Thürk F, Széles JC and Klonowski W (2018) Higuchi Fractal Dimension of Heart Rate Variability During Percutaneous Auricular Vagus Nerve Stimulation in Healthy and Diabetic Subjects. Front. Physiol. 9:1162. doi: 10.3389/fphys.2018.01162
Received: 14 March 2018; Accepted: 03 August 2018;
Published: 21 August 2018.
Edited by:
Sladjana Z. Spasić, University of Belgrade, SerbiaReviewed by:
Tatiana Dias de Carvalho, National University of La Matanza, ArgentinaChunhua Bian, Nanjing University, China
Copyright © 2018 Gomolka, Kampusch, Kaniusas, Thürk, Széles and Klonowski. This is an open-access article distributed under the terms of the Creative Commons Attribution License (CC BY). The use, distribution or reproduction in other forums is permitted, provided the original author(s) and the copyright owner(s) are credited and that the original publication in this journal is cited, in accordance with accepted academic practice. No use, distribution or reproduction is permitted which does not comply with these terms.
*Correspondence: Wlodzimierz Klonowski, wklon@ibib.waw.pl; wklonowski@gmail.com