 Daniel Link
 Marcus Weber
 Daniel Linke
 Martin Lames
- Department of Exercise Science and Sports Informatics, Technical University Munich, Munich, Germany
This study explores whether positioning systems are a viable alternative to timing gates when it comes to measuring sprint times in ice hockey. We compared the results of a single-beam timing gate (Brower Timing) with the results of the Iceberg optical positioning system (Optical) and two radio-based positioning systems provided by InMotio (Radio 1) and Kinexon (Radio 2). The testing protocol consisted of two 40 m linear sprints, where we measured sprint times for a 11 m subsection (Linear Sprint 11), and a shuttle run (Shuttle Total), including five 14 m sprints. The exercises were performed by six top-level U19 field players in regular ice hockey equipment on ice. We quantified the difference between measured sprint times e.g., by Mean Absolute Error (MAE) (s) and Intra Class Correlation (ICC). The usefulness of positioning systems was evaluated by using a Coefficient of Usefulness (CU), which was defined as the quotient of the Smallest Worthwhile Change (SWC) divided by the Typical Error (both in s). Results showed that radio-based systems had a higher accuracy compared to the optical system. This concerned Linear Sprint 11 (MAEOptical = 0.16, MAERadio1 = 0.01, MAERadio2 = 0.01, ICCOptical = 0.38, ICCRadio1 = 0.98, ICCRadio2 = 0.99) as well as Shuttle Total (MAEOptical = 0.07, MAERadio1 = 0.02, MAERadio2 = 0.02, ICCOptical = 0.99; ICCRadio1 = 1.0, ICCRadio2 = 1.0). In Shuttle Total, all systems were able to measure a SWC of 0.10 s with a probability of >99% in a single trial (CUOptical = 4.6, CURadio1 = 6.5, CURadio2 = 5.1). In Linear Sprint 11 an SWC of 0.01 s might have been masked or erroneously detected where there were none due to measurement noise (CUOptical = 0.6, CURadio1 = 1.0, CURadio2 = 1.0). Similar results were found for the turning subsection of the shuttle run (CUOptical = 0.6, CURadio1 = 0.5, CURadio2 = 0.5). All systems were able to detect an SWC higher than 0.04 s with a probability of at least 75%. We conclude that the tested positioning systems may in fact offer a workable alternative to timing gates for measuring sprints times in ice hockey over long distances like shuttle runs. Limitations occur when testing changes/differences in performance over very short distances like an 11 m sprint, or when intermediate times are taken immediately after considerable changes of direction or speed.
Introduction
Performance tests are an important component of training (Wisloff, 2004; Krustrup et al., 2005). They can be used to identify strengths and weaknesses of athletes and to draw conclusions for training and competition (Geithner et al., 2006; Gabbett et al., 2008; Karcher and Buchheit, 2014; Massuca et al., 2015; Suarez-Arrones et al., 2015; La Monica et al., 2016). In ice hockey, sprinting speed is – besides strength and endurance – an important component of physical performance (Bracko, 2001; Roczniok et al., 2016). To measure the individual sprinting performances of athletes, teams mainly use so-called off-ice tests (Leone et al., 2007; Burr et al., 2008; Janot et al., 2015). A well-known example is the Entry Draft Combine (Gledhill and Jamnik, 2007; National Hockey League, 2015), which is used by the National Hockey League (NHL) in order to determine the abilities of youth players. The results of the different strength, endurance, coordination and speed tests (e.g., bench press, squat-jumps, Wingate test, balance board, and 40-yd sprint) are used to predict their prospects for a professional career.
Off-ice tests have the advantages of being performable with little organizational effort, that they are easy to standardize, and that there is also a great deal of comparable data available from other team sports (Durandt et al., 2007; Vaz et al., 2014; Slimani and Nikolaidis, 2017). The most critical point is the transferability of results to a specific sport. In terms of sprinting performance, it is questionable whether a 40-yd sprint on turf (Burr et al., 2008) is a good indicator of sprinting performance on ice. The scientific literature does not provide a homogenous picture on this issue. Some studies claim high external validity for off-ice tests (Roczniok et al., 2012; Janot et al., 2015; Henriksson et al., 2016), while other publications doubt the predictive power of such tests for performance on ice (Vescovi et al., 2006; Farlinger et al., 2007; Durocher et al., 2010; Buchheit et al., 2011; Nightingale et al., 2013; Allisse et al., 2017). Certainly, on-ice tests are a more valid way to predict sprinting ability of ice hockey players in the match situation.
As in many other sports, sprint times in ice hockey are usually measured by using timing gates or laser radar (LIDAR) (Türk-Noak, 1994). A comparatively new option is the use of radio-based or optical positioning systems, which have become popular in many sports (Carling et al., 2008; Aughey, 2011; Leser et al., 2011). Nowadays, these systems are often permanently installed in ice hockey venues and are used for collecting physical and tactical performance parameters in training and competition. Whereas the use of timing gates and LIDAR generates additional effort for system set up, this is not the case for positioning systems once they have been installed. Another potential advantage is that tests can be performed on the entire ice surface without a rearrangement of measuring devices. They can also measure speed in non-linear movements and provide high-frequency information about acceleration, which is very important in ice hockey (Buckeridge et al., 2015). GPS-based positioning systems, which are used in many outdoor sports, are not suitable for ice hockey, since the roof at ice-rinks blocks communication with the geostationary satellites.
Against this background, the question arises whether positioning systems offer a viable alternative for timing gates in on-ice speed tests. In particular, when talking about sprints or split times over short distances, there are exacting reliability requirements in order to allay the possibility that small changes or differences in performance are masked by inaccuracies produced by the measurement device (Hopkins, 2004; Haugen and Buchheit, 2016). The scientific literature comprises many studies that evaluate the accuracy of radio-based (Frencken et al., 2010; Ogris et al., 2012; Buchheit et al., 2014; Stevens et al., 2014) and optical positioning systems (Di Salvo et al., 2006; Redwood-Brown et al., 2012; Buchheit et al., 2014; Mara et al., 2017). Parameters under inspection include coordinates on the pitch (Ogris et al., 2012; Siegle et al., 2013; Linke et al., 2018) as well as derived performance indicators, such as running distance, speed, acceleration or time/distances in speed sectors (Di Salvo et al., 2006, 2007; Frencken et al., 2010; Ogris et al., 2012; Buchheit et al., 2014; Castellano et al., 2014; Stevens et al., 2014; Linke et al., 2018).
Some of these studies compare positioning systems with timing gates for average speed (Di Salvo et al., 2006; Frencken et al., 2010; Redwood-Brown et al., 2012; Siegle et al., 2013), but they do not discuss their application as a timing device. To date, there is only one study which deals with the reliability of sprint time measurement using positioning systems (Buchheit et al., 2014). However, this issue is only a marginal consideration in that study. Thus, the question of the extent to which positioning systems are able to substitute timing gates remains unanswered. To our knowledge, all evaluation studies for positioning systems hitherto have used settings with movements on stable ground – movements on ice have never been investigated. This must be considered a deficit since the manufacturers of positioning systems have not optimized the data processing algorithms for gliding movements. Bond et al. (2017b) recently studied the reliability of two timing gates for short sprints in ice hockey, but without considering positioning systems.
The aim of this study was to explore the agreement between sprint times measured by a timing gate with one optical and two radio-based positioning systems in on-ice tests. We questioned here whether these positioning systems are sufficient to determine worthwhile performance changes/differences in typical test settings. As mentioned above, the reliability of sprint time measurement using the first radio system has only been tested in a marginal way (Buchheit et al., 2014). For the second radio system, there is only one study on mechanical sprint properties, e.g., acceleration time, velocity, power output (Hoppe et al., 2018). There is no validation study available for the optical system. The results of this study should therefore contribute to the evaluation of possibilities and limitations of all the above-mentioned systems for their use in ice hockey performance testing.
Materials and Methods
Equipment
To answer our research question, we applied an experimental approach. The experiment took place at the Ice Arena in Salzburg, Austria. Positional data was simultaneously collected by three so-called Electronic Performance and Training Systems (EPTS): the Iceberg optical system (Iceberg Hockey Analytics Corp., Toronto, Canada) (Optical), which was specially developed for ice hockey, and the two radio-based systems manufactured by InMotio (Inmotiotec GmbH, Regau, Austria) (Radio 1) and Kinexon (Kinexon GmbH, Munich, Germany) (Radio 2). Firmware versions and application software versions corresponded to the latest releases on the testing date (January 2017). All systems were installed and operated by the manufacturers. Reference sprint times were measured by single-beam timing gates (Brower Timing Systems, IRD-T175), which were located at the face-off spots in the neutral zone. Their precise position was determined using a tachymeter (Leica Geosystems, Viva-TS11). The distance between the timing gates was 11.23 m. The transmitter was located 1.20 m above the ground.
Exercises
Our testing protocol comprised a linear sprint and a shuttle run. For the linear sprint, the face-off spots in the end zones were used as start and ending points, so that the total sprint distance was about 40 m. The shuttle run included five shuttle sprints and four shuttle turns. For these, the blue lines were used as start and ending points, which resulted in a one-way sprint distance of about 15.5 m. Players had to pass the blue lines with both skates before they change running direction. All players used a standardized standing start position. Between the trials, the players had more than 5 min to recover completely.
Sample
Six U19 field players from the Ice Hockey Club Red Bull Salzburg, wearing regular ice hockey equipment, executed the test runs. Each player performed two linear sprints and one shuttle run. The protocol was approved by the ethics committee of Technical University Munich. All subjects gave written informed consent in accordance with the Declaration of Helsinki.
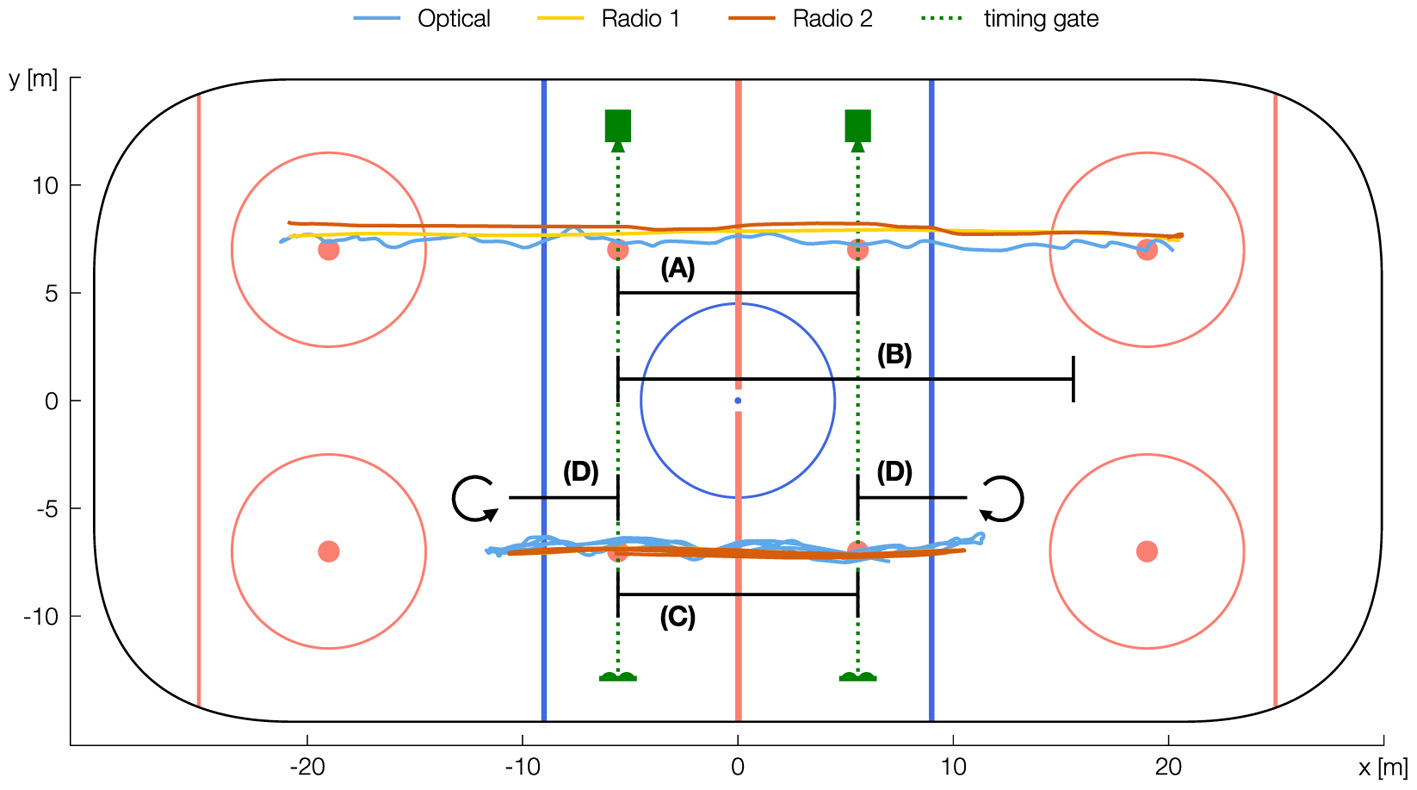
Figure 1. Visualization of test setting and segments Linear Sprint 11 (A), Linear Sprint 21 (B), Shuttle Sprint (C), and Shuttle Turn (D). Shuttle Run Total is given as the concatenation of all Shuttle Sprints and Shuttle Turns. The Figure shows the original trajectory of one athlete measured simultaneously by each EPTS.
Variables
In each exercise, we collected sprint times in the segments (RUN) Linear Sprint 11 (between two face-off spots), Linear Sprint 21 (between the first face-off spot and the rear face-off circle), Shuttle Turn (between face-off spot, turn and same face-off spot), Shuttle Sprint (between the two face-off spots) and Shuttle Total (entire exercise) (Figure 1). Before calculating sprint times from positional data (SPRINT TIME EPTS), the different sampling rates (Optical: 10 Hz, Radio 1: 100 Hz, Radio 2: 15 Hz) were aligned to 100 Hz using cubic spline interpolation. SPRINT TIME EPTS was determined based on the temporal distance of the data points Start and End. These are the timestamps of data frames, in which the x-coordinate was closest to the measurement line of the timing gate. Reference time (SPRINT TIME) was measured using the timing gates, except for Linear Sprint 21. Here, we calculated SPRINT TIME using the mean of Radio 1 and Radio 2. The measurement error (E) was calculated by the difference of SPRINT TIME and SPRINT TIME EPTS. All sprint times were rounded up to within two decimal places.
To assess the usefulness of the positioning systems, we followed Hopkins (2004) approach. This involves setting the Typical Error (TP), which represents the measurement noise, in relation to the so-called Smallest Worthwhile Change (SWC) and the Change in Performance (CP) measured by the system. The quotient of SWC and TE, which we refer to as Coefficient of Usefulness (CU), was used to derive the probabilities of the CP (which could be affected by measurement noise) being substantial. As per Hopkins, we used the following scale to describe the probability of a substantial change in performance: 25–75% (possible), 75–95% (likely), 95–99% (very likely), and >99% (almost certain). Details and examples of this approach are also given by Haugen and Buchheit (2016). The SWC for Shuttle Total (=0.10 s) and for Linear Sprint 21 (=0.02 s) was set to 20% of the between-subject SD of SPRINT TIME (Hopkins et al., 2009); for all other categories of RUN we used an SWC of 0.01 s. For all RUNs except Linear Sprint 21, TE was calculated as the SD of E divided by √2 (Bond et al., 2017a). The TE of Linear Sprint 21 was set to the value of TE for Linear Sprint 11.
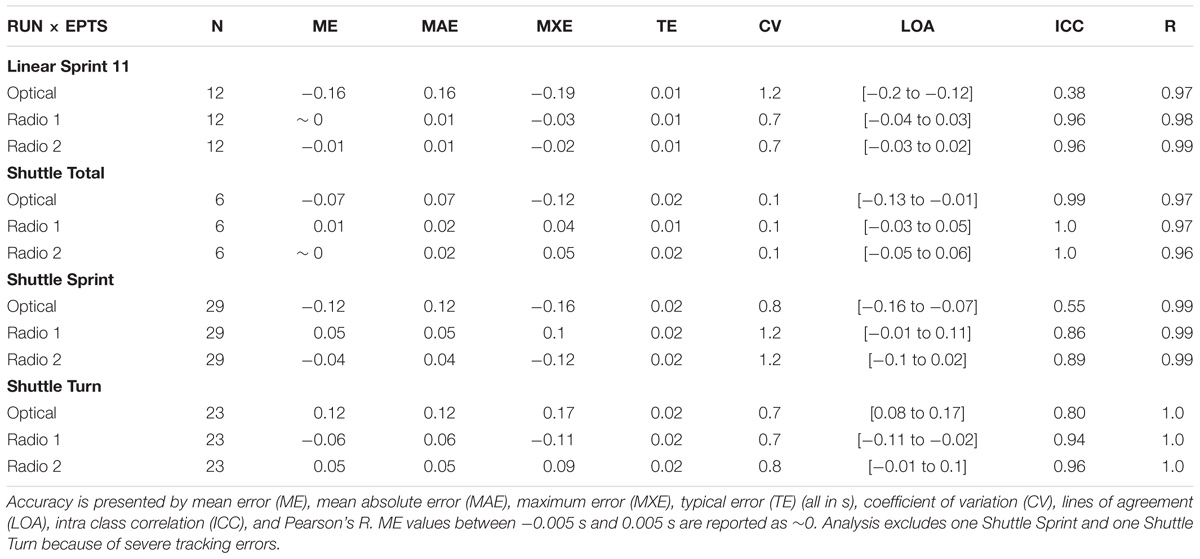
Table 1. Results of accuracy testing for each RUN and EPTS.
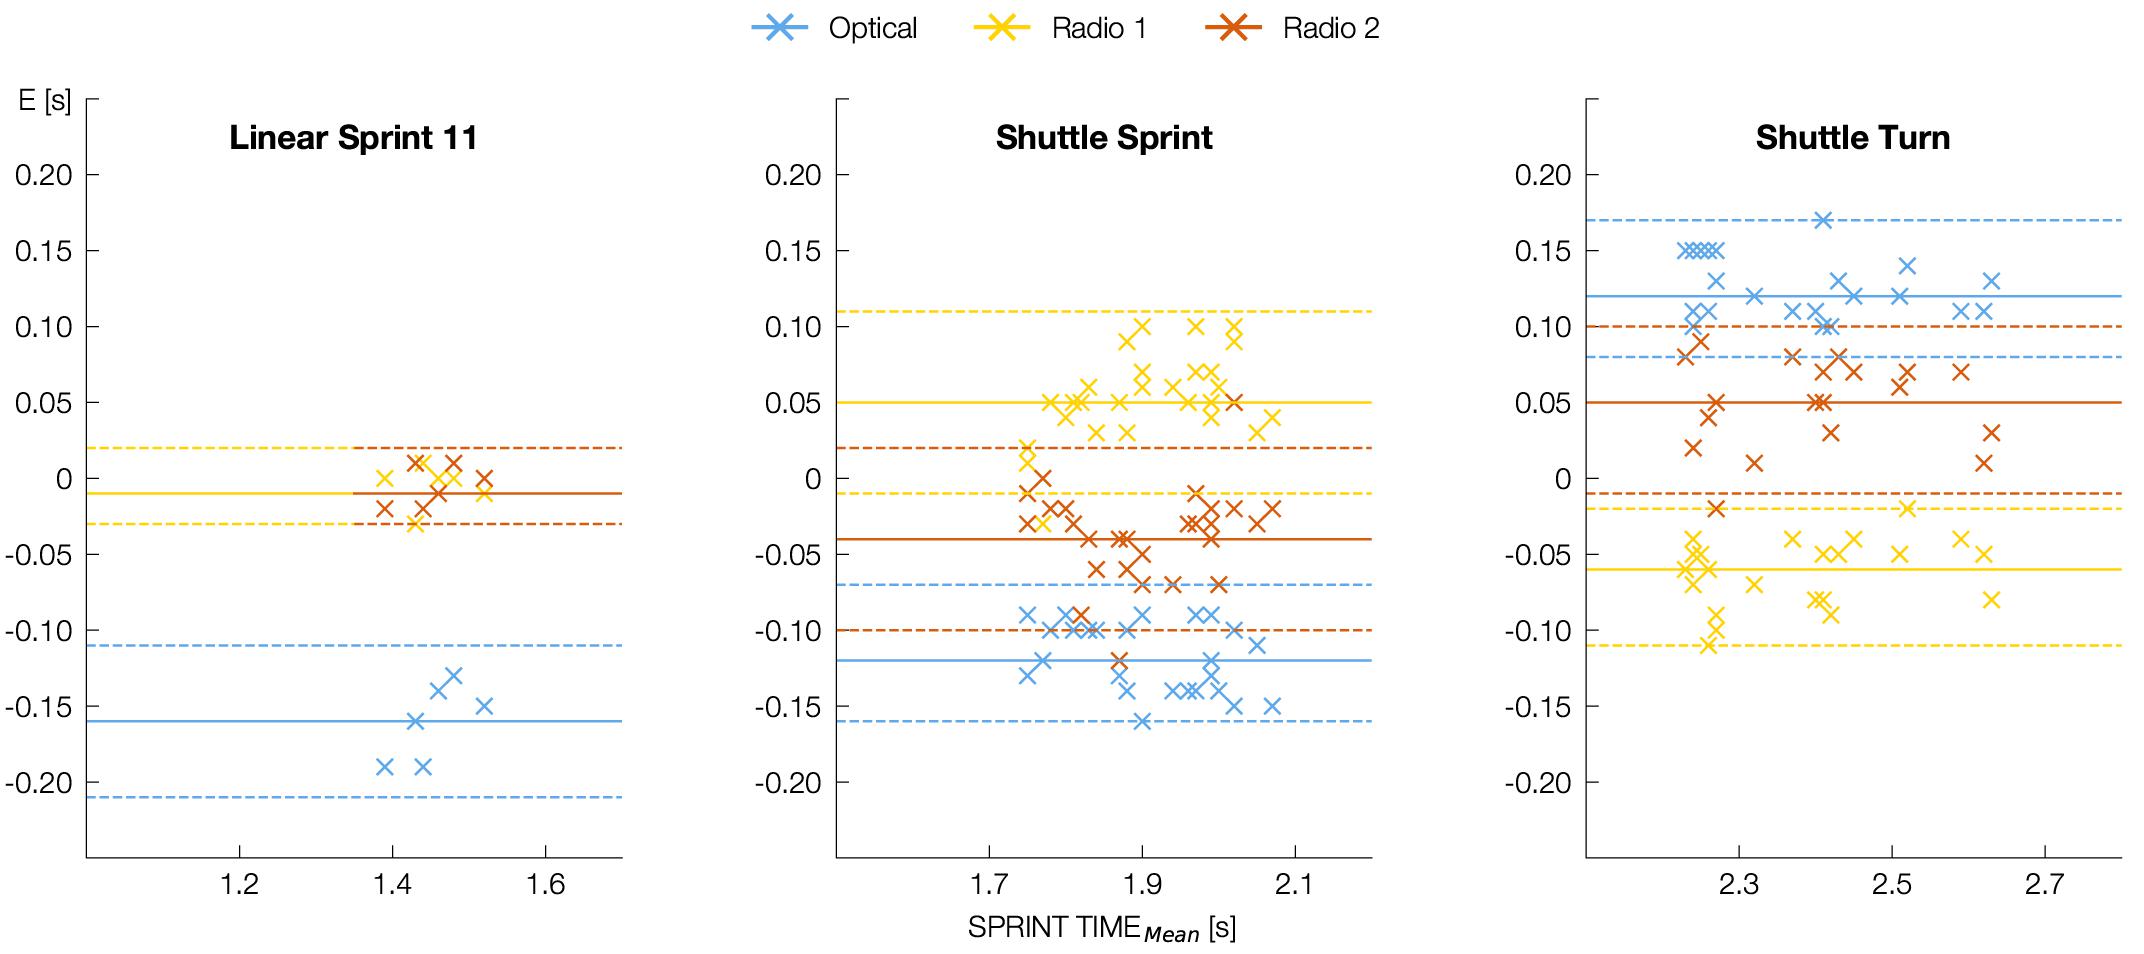
Figure 2. Visualization of accuracy for each trial and each EPTS according to Bland-Altman. The plots show Measurement Error (E) over SPRINT TIMEMean (mean of sprint time measured by EPTS and timing gate) as well as Mean Error (ME, solid colored line) and Lines of Agreement (LOA, dashed colored line) (all in s). Negative values indicate shorter EPTS sprint times compared to the timing gate.
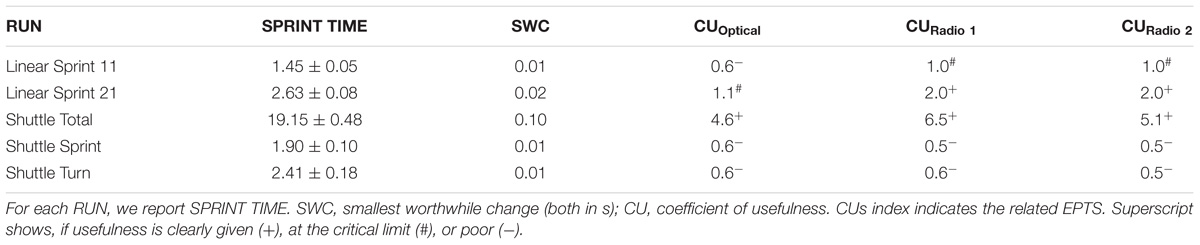
Table 2. Indicators for evaluating the usefulness of tested EPTS.
Statistical Analysis
Analysis of accuracy used the Measurement Error of one trial of one player of one RUN and of one EPTS as a statistical unit (n = 220). Data is presented in the categories of EPTS × RUN (except for Linear Sprint 21) by reporting Mean Error (ME), Mean Absolute Error (MAE), Maximum Error (MXE), TE (all in s), Coefficient of Variation (CV) (ratio of mean sprint time per run and TE), Intra Class Correlation (ICC) (two way mixed, single measurement model) and Pearson’s R (Table 1). Bland-Altman-Plots (Bland and Altman, 1986) were used for visualization (Figure 2). The effect of EPTS on MAE was tested by a one-factorial ANOVA. For testing differences between two systems, we used post-hoc analysis (Tukey’s test). Before using parametric statistical test procedures, we verified the assumption of normality. The α-level was set to 0.05. All statistical analyses were performed using R (v3.5). Variables for evaluating the usefulness of the systems are presented in the categories of RUN (Table 2). For each EPTS we report SPRINT TIME as the mean ± standard deviation, SWC (both in s) and CU. Graphic analysis of movement trajectory uses the course of x-coordinate over time (Figure 3). The data frame at which the player was closest to the measurement line of the timing gates was used as a trigger point for temporal synchronization of positional data.
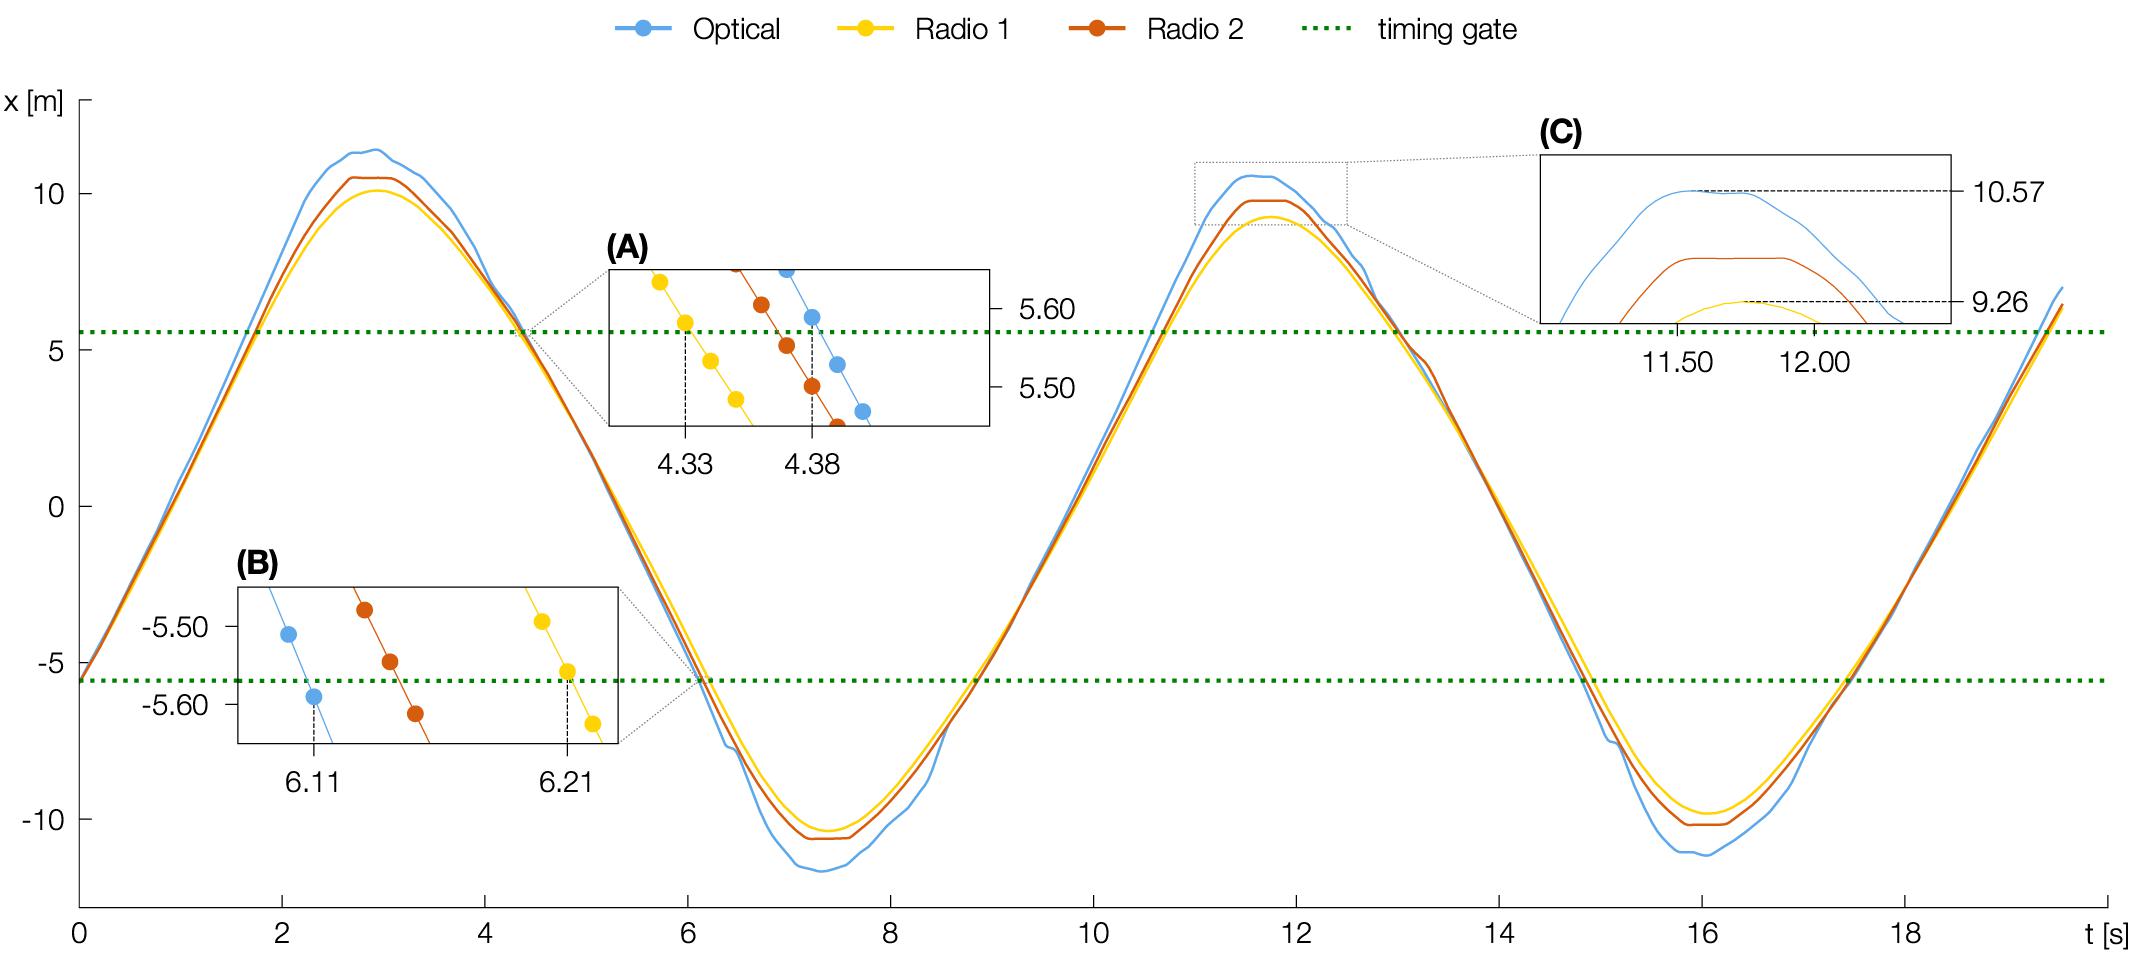
Figure 3. Course of players x-coordinate (in m) over time (in s) during Shuttle Run measured simultaneously by each EPTS. The enlarged segments show when the player passes the measurement line of the timing gates at the end of the Shuttle Turn (A), the end of the Shuttle Sprint (B), and when reaching the turnover moment in the third Shuttle Turn (C). Total SPRINT TIME for this Shuttle Run measured by the timing gates was 19.41 s (SPRINT TIME Optical = 19.30 s, SPRINT TIME Radio 1 = 19.43 s, SPRINT TIME Radio 2 = 19.37 s).
Results
In Linear Sprint 11 (F = 416.23, p < 0.001), Shuttle Total (F = 9.7, p < 0.05), Shuttle Sprint (F = 74.94, p < 0.001) and Shuttle Turn (F = 71.07, p < 0.001), the MAE was significantly higher for the optical system compared to the radio-based systems (Table 1). In addition, the ICC was smaller for the optical system in all RUNs. It is striking that there was only a moderate correlation between the optical system and the timing gates for Linear Sprint 11 and Shuttle Sprint. Pearson’s R shows almost perfect agreements between timing gates and all EPTS. There were no significant differences in the MAE between the two radio-based systems in any setting, and the difference regarding ICC was quite small (maximum 0.03).
In Shuttle Sprint and Shuttle Turn, all three systems displayed slight characteristic variations (Figure 2). In Shuttle Sprint, we measured shorter sprint times with Optical and Radio 2 compared to the timing gates, in Shuttle Turn, sprint times were longer. As an example, Figure 3 shows a part of one athlete’s Shuttle Run with almost identical x-coordinates in the middle of the Shuttle Sprint as measured by the different systems. In Shuttle Turn, there was a difference of up to 1.31 m between the x-coordinates in the turning point (Figure 3C). The optical system detected the passing of the first Shuttle Turns endpoint, which is also the starting point of the second Shuttle Sprint – 0.05 s later as compared to Radio 1 (Figure 3A) – whereas the second endpoint was detected 0.10 s early (Figure 3B). This characteristic variation was evident for all Shuttle Sprints and Shuttle Turns for all athletes.
The CU tended to be smaller in Linear Sprint 11, Shuttle Sprint and Shuttle Turn compared to the longer distances Linear Sprint 21 and Shuttle Total (Table 2). The optical system showed a general tendency to smaller CUs compared to the radio-based systems. Exceptions were found only for Shuttle Sprint and Shuttle Turn, where all systems showed similar values.
Discussion
Discussion of Methods
The study aimed to evaluate three positioning systems with respect to their validity and usefulness for measuring sprint times in ice hockey. We therefore used the sprint times measured by timing gates as the ground truth. These results are limited by the fact that timing gates have an inherent error. According to the International Association of Athletics Federations (IAAF, 2017), the end of a sprint is defined as the moment at which one part of the torso passes the vertical plane above the finish line. For flying starts, this definition can also be applied to the start line. One of the drawbacks of timing gates is that they can be triggered by swinging arms and legs. The size of their measurement error depends on the way the body passes the measurement line and is influenced by starting technique, running speed and posture, height of the photocells and the type of the timing gate (Cronin and Templeton, 2008; Haugen et al., 2012; Haugen et al., 2014; Altmann et al., 2017; Bond et al., 2017a). For the single-beam timing gate used in this study, Bond et al. (2017a) reported a MAE = 0.02 s and a TE = 0.01 s for 20–30 ft split times compared with high-speed cameras, which is comparable to the situation in Linear Sprint 11. The same study showed measurement errors for 10–20 ft split times, which correspond to Shuttle Sprint and Shuttle Turn, of MAE = 0.03 s and TE = 0.03 s. For ice hockey, we expect equal or less measurement errors, since the sliding movement in ice hockey has observationally a more frontal than sagittal component (e.g., swinging arms and legs in the frontal plane) compared to running. However, this potential error would not affect the direction of our findings.
Another limitation concerns the way sprint times were measured via ETPS. Positioning systems usually work with different internal sampling rates, which are limited, among other things, by the number of registered sensors or the power of the video processing units. In our study, we used the raw data provided by the manufacturers, which were recorded with different sampling rates. In order to derive a sprint time with two digits and to enable comparison of the difference, we up-sampled the data to 100 Hz. Our procedure only provides an estimation of the moment in which the player passes the measurement line – it is not a direct measurement. It is possible that other internal sampling rates or advanced interpolation methods could influence the results.
To assess the usefulness of positioning systems for measuring sprint times, we refer to the SWC-model (Hopkins, 2004), which uses the SWC defined for each specific test. Estimation of the SWC can be based on statistical spread and/or observations of direct benefits for performance (Hopkins et al., 2009). Following Hopkins’ recommendation, we used 0.2 × SD of the performance variable for Shuttle Run and Linear Sprint 21 (SWCShuttleTotal = 0.10 s, SWCLinearSprint21 = 0.02 s). This value is influenced by the group homogeneity, but is widely accepted as a standard in the scientific community. The purpose of Linear Sprint 21 in this study was to introduce an additional performance variable, which allows evaluation of the usefulness of a setting, where the SWC is between Linear Sprint 11 and Shuttle Total. Therefore, it was not necessary to use timing gates for this segment.
Whereas Shuttle Run and Linear Sprint 21 are primarily used in test settings, short sprints play an important role in ice hockey, particularly when players are dueling for the puck. For this reason, we argue for performance benefits over statistical considerations when choosing an SWC of 0.01 s for Linear Sprint 11, Shuttle Sprint and Shuttle Turn. Following Haugen et al. (2014) for soccer, we assume that the minimal distance needed to win the puck is around its diameter (7.62 cm). This distance corresponds to a time difference of 0.01 s at the end of a 10 m sprint. Duthie et al. (2006) also use this value for 10 m sprints in rugby.
The SWC-model also requires determining the TE, which represents the measurement noise of a performance test. Research in this field usually uses the mean value of the within-subject variation of the performance variable for this (Hopkins, 2004; Darrall-Jones et al., 2016; Bond et al., 2017b). In this study, we applied an alternative option and took the random part the measurement error of positioning systems as TE (Bond et al., 2017a). Consequently, our assessment of usefulness asks, whether the technical noise is low enough to detect the SWC and not, whether the noise of the performance variable (including also biological fluctuation) is low enough to detect the SWC. Although this is a limitation, because reference is made only the technical properties of the test, this approach is adequate for technology-centered evaluations.
The results of the study might be limited by the quite small number of participants. This affects the reliability of the SWC estimation, especially for Shuttle Total. Nevertheless, a moderate change of SWC would not affect our findings significantly, since CUs for Shuttle Total are quite high. In addition, TE could differ on the individual level due to variability of movement techniques and anthropometric factors. However, we find no traces of such effects in our data.
Discussion of Results
The results show that agreement between sprint times measured by the timing gate and the positioning systems (i) depends on the positioning system and (ii) is influenced by the exercise in question. The radio-based systems we tested showed better agreement compared to the optical system, which is in line with previous studies (Siegle et al., 2013; Linke et al., 2018). One explanation for this could be that radio-based systems use differences between the reception times of a sensor signal at different receiving stations (Stelzer et al., 2004), whereas optical systems rely on color, contour and movement information in video footage (Xu et al., 2004; Link, 2014). In video, position is determined by a blob of pixels, which allows only a rough estimation of the center of gravity. In any case, this finding is just a snapshot of current state of technology available and things could change with the next generation of optical systems (e.g., by using higher optical resolutions).
We can explain the different trajectories in Shuttle Run (Figure 3), which have a direct impact on the measurement error, by different post-processing procedures. Positioning systems usually do not provide the system-internal raw data as output but as a processed value resulting from the application of various filter and smoothing operations. One of these is the Kalman filter (Kalman, 1960), which estimates the position based on current measured coordinates, and direction and speed of preceding moments. In this way, noise and outlier values can be eliminated. Kalman filters also have the disadvantage that rapid changes in speed and direction are reproduced with time delay and less acuity. As a consequence, output data show a system-specific characteristic according to the filter parameters used, which also leads to differences in derived performance indicators, line running distances, or time spent in speed intervals (Frencken et al., 2010; Ogris et al., 2012; Siegle et al., 2013; Linke et al., 2018).
For positioning systems, various studies have shown that reliability declines with less running distance, higher speed, and an increasing number of direction changes (Coutts and Duffield, 2010; Jennings et al., 2010; Portas et al., 2010; Rawstorn et al., 2014; Linke et al., 2018). These findings are also supported by our data. We can explain the a) smaller ICC of the optical system when it comes to higher speed (Linear Sprint 11, Shuttle Sprint), b) the higher MAE in Linear Sprint 11 and c) the stronger amplitude of the trajectory during a Shuttle Turn by a higher measurement error and larger time windows for filtering. The radio-based systems also had problems reproducing changes of direction and speed during the Shuttle Run. Here, the signal showed a “delay” (Figure 3), which was caused by the Kalman filter and led to higher deviations from the timing gates compared to Linear Sprint 11. It might be worth adopting the approach taken by Buchheit et al. (2014) and find correction factors and filter parameters for each system, which reduce measurement errors for one specific test setting. For Linear Sprint 11, the correlation between the radio-based systems and the timing gates are high and the measurement errors are very small – without a clear tendency to overestimation or underestimation. These results seem to be compatible with the ones reported by Buchheit et al. (2014) for Radio 1, although their procedures remain somewhat vague.
According to the SWC-model, a system is ‘useful’ for a test if the CU is greater than 1.0. If this is granted, we can use the CU values showed in Table 2 to assign all categories of EPTS x RUN to one of three groups: a group U+, where the system is clearly useful, a group U# where usefulness is at the critical limit, and a group U− in which usefulness is poor in terms of detecting the SWC. In Shuttle Total, the probability of a measured change of CP = 0.10 s being true is >99% and can be classified as almost certain. A change of CP = 0.02 s measured by the radio-based systems in Linear Sprint 21 is substantial with a probability of >75% (likely). The same probability can be assumed for the optical system when CP = 0.04 s. All these combinations belong to group U+. In contrast to this, the chance of all systems reliably detecting an SWC of 0.01 s in Shuttle Sprint or Shuttle Turn and for Optical in Linear Sprint 11 is marginal, since such small changes of performance could be masked or falsely recorded on account of measurement errors. It is important to understand that this applies only if an SWC of 0.01 s is used – an SWC of 0.04 s, for example, could be detected with a probability of more than 75%.
All these interpretations underlie the condition of accepting timing gates as a ground truth. In the light of their limitations (Duthie et al., 2006; Haugen et al., 2014; Bond et al., 2017a), other studies conclude that timing gates are only of marginal use for measuring SWC for sprints over ∼10 m (Duthie et al., 2006; Darrall-Jones et al., 2016). Because of the high agreement between timing gates and the radio-based systems in Linear Sprint 11, we adhere to this argumentation and recommend interpreting time changes of ≤0.02 s measured by positioning systems – as well as measured from timing gates – with a certain degree of caution. Further investigations might also consider the noise of the performance variable in order to get a different perspective on the usefulness of positioning systems.
Nevertheless, our results provide a good argument for accepting these systems as an alternative to timing gates for measuring sprint time in linear sprints. We can also speculate as to which system class is better suited here. An argument for radio-based systems would be that they obviate the swinging legs or arms problem, as the sensor is located between the shoulders. On the other hand, their underlying measurement principle is much more complex than detecting a light beam interruption. Previous studies on Radio 1 report an average spatial error of 0.23 m (Ogris et al., 2012; Linke et al., 2018), which would lead to a measurement error of around 0.03 s in detecting the crossing of the measurement line in Linear Sprint 11. Since the error compared with the timing gates is much smaller in this study, one could argue that positional errors are compensated for as long as they are systematic and the movement between start and finish line is linear. In the end, both system classes have different advantages and disadvantages for measuring sprint times.
Conclusion
The positioning systems we tested may be a viable alternative for using timing gates for measuring sprint time in ice hockey. Compared to timing gates, they have several advantages since they are also able to measure accelerations and provide performance indicators in non-linear movement tests. In addition, the application of positioning systems requires far fewer resources once they have been installed. The validity and usefulness of the positioning systems tested depends on the test exercise. All systems were able to detect an SWC higher 0.04 s with a probability of at least 75%. They are therefore useful for measuring sprint performance in exercises over longer distances like a Shuttle Run. Limitations occur when testing changes/differences in performance over very short distances (e.g., an 11 m sprint), or when intermediate times are taken right after considerable changes of direction or speed. In linear sprints, the radio-based systems are more useful than the optical system, but these systems also demonstrate – thus as with timing gates – only a marginal chance of detecting a worthwhile change of around 0.01 s.
Compliance With Ethical Standards
Board approval for their research and appropriate consent has been obtained pursuant to law.
Author Contributions
DLk contributed to the conception and design of the study and wrote the manuscript. MW performed the statistical analysis and data visualization. DLe worked on data visualization. All authors contributed to manuscript revision, read, and approved it for publication.
Funding
The publication of the study was supported by the German Research Foundation (DFG, www.dfg.de) and the Technical University of Munich (TUM, www.tum.de) in the framework of the Open Access Publishing Program.
Conflict of Interest Statement
The authors declare that the research was conducted in the absence of any commercial or financial relationships that could be construed as a potential conflict of interest.
Acknowledgments
Michael Obermair and the Junior Team of EC Red Bull Salzburg for participation in this study. Iceberg Corp., Inmotio Corp., and Kinexon Corp., for providing the data. These persons and institutions had no role in study design, data collection and analysis, decision to publish, or preparation of the manuscript.
References
Allisse, M., Sercia, P., Comtois, A.-S., and Leone, M. (2017). Morphological, physiological and skating performance profiles of male age-group elite ice hockey players. J. Hum. Kinet. 58, 87–97. doi: 10.1515/hukin-2017-0085
Altmann, S., Spielmann, M., Engel, F. A., Neumann, R., Ringhof, S., Oriwol, D., et al. (2017). Validity of single-beam timing lights at different heights. J. Strength Cond. Res. 31, 1994–1999. doi: 10.1519/JSC.0000000000001889
Aughey, R. J. (2011). Applications of GPS technologies to field sports. Int. J. Sports Physiol. Perform. 6, 295–310. doi: 10.1123/ijspp.6.3.295
Bland, J. M., and Altman, D. G. (1986). Statistical methods for assessing agreement between two methods of clinical measurement. Lancet 1, 307–310. doi: 10.1016/S0140-6736(86)90837-8
Bond, C. W., Willaert, E. M., and Noonan, B. C. (2017a). Comparison of three timing systems: reliability and best practice recommendations in timing short-duration sprints. J. Strength Cond. Res. 31, 1062–1071. doi: 10.1519/JSC.0000000000001566
Bond, C. W., Willaert, E. M., Rudningen, K. E., and Noonan, B. C. (2017b). Reliability of three timing systems used to time short on ice-skating sprints in ice hockey players. J. Strength Cond. Res. 31, 3279–3286. doi: 10.1519/JSC.0000000000002218
Bracko, M. R. (2001). On-ice performance characteristics of elite and non-elite women’s ice hockey players. J. Strength Cond. Res. 15, 42–47. doi: 10.1519/1533-4287(2001)015<0042:OIPCOE>2.0.CO;2
Buchheit, M., Allen, A., Poon, T. K., Modonutti, M., Gregson, W., and Di Salvo, V. (2014). Integrating different tracking systems in football: multiple camera semi-automatic system, local position measurement and GPS technologies. J. Sports Sci. 32, 1844–1857. doi: 10.1080/02640414.2014.942687
Buchheit, M., Lefebvre, B., Laursen, P. B., and Ahmaidi, S. (2011). Reliability, usefulness, and validity of the 30-15 Intermittent Ice Test in young elite ice hockey players. J. Strength Cond. Res. 25, 1457–1464. doi: 10.1519/JSC.0b013e3181d686b7
Buckeridge, E., LeVangie, M. C., Stetter, B., Nigg, S. R., and Nigg, B. M. (2015). An on-ice measurement approach to analyse the biomechanics of ice hockey skating. PLoS One 10:e0127324. doi: 10.1371/journal.pone.0127324
Burr, J. F., Jamnik, R. K., Baker, J., Macpherson, A., Gledhill, N., and McGuire, E. J. (2008). Relationship of physical fitness test results and hockey playing potential in elite-level ice hockey players. J. Strength Cond. Res. 22, 1535–1543. doi: 10.1519/JSC.0b013e318181ac20
Carling, C., Bloomfield, J., Nelsen, L., and Reilly, T. (2008). The role of motion analysis in elite soccer. Sports Med. 38, 839–862. doi: 10.2165/00007256-200838100-00004
Castellano, J., Alvarez-Pastor, D., and Bradley, P. S. (2014). Evaluation of research using computerised tracking systems (Amisco and Prozone) to analyse physical performance in elite soccer: a systematic review. Sports Med. 44, 701–712. doi: 10.1007/s40279-014-0144-3
Coutts, A. J., and Duffield, R. (2010). Validity and reliability of GPS devices for measuring movement demands of team sports. J. Sci. Med. Sport 13, 133–135. doi: 10.1016/j.jsams.2008.09.015
Cronin, J. B., and Templeton, R. L. (2008). Timing light height affects sprint times. J. Strength Cond. Res. 22, 318–320. doi: 10.1519/JSC.0b013e31815fa3d3
Darrall-Jones, J., Jones, B., Roe, G., and Till, K. (2016). Reliability and usefulness of linear sprint testing in adolescent rugby union and league players. J. Strength Cond. Res. 30, 1359–1364. doi: 10.1519/JSC.0000000000001233
Di Salvo, V., Adam, C., Barry, M., and Marco, C. (2006). Validation of prozone® : a new video-based performance analysis system. Int. J. Perform. Anal. Sport 6, 108–119. doi: 10.1080/24748668.2006.11868359
Di Salvo, V., Baron, R., Tschan, H., Calderon Montero, F. J., Bachl, N., and Pigozzi, F. (2007). Performance characteristics according to playing position in elite soccer. Int. J. Sports Med. 28, 222–227. doi: 10.1055/s-2006-924294
Durandt, J. J., Evans, J. P., Revington, P., Temple-Jones, A., and Lamberts, R. P. (2007). Physical profiles of elite male field hockey and soccerplayers - application to sport-specific tests. S. Afr. J. 19:74. doi: 10.17159/2413-3108/2007/v19i3a257
Durocher, J. J., Guisfredi, A. J., Leetun, D. T., and Carter, J. R. (2010). Comparison of on-ice and off-ice graded exercise testing in collegiate hockey players. Appl. Physiol. Nutr. Metab. 35, 35–39. doi: 10.1139/H09-129
Duthie, G. M., Pyne, D. B., Ross, A. A., Livingstone, S. G., and Hooper, S. L. (2006). The reliability of ten-meter sprint time using different starting techniques. J. Strength Cond. Res. 20, 246–251. doi: 10.1519/R-17084.1
Farlinger, C. M., Kruisselbrink, L. D., and Fowles, J. R. (2007). Relationships to skating performance in competitive hockey players. J. Strength Cond. Res. 21, 915–922. doi: 10.1519/R-19155.1
Frencken, W. G. P., Lemmink, K. A. P. M., and Delleman, N. J. (2010). Soccer-specific accuracy and validity of the local position measurement (LPM) system. J. Sci. Med. Sport 13, 641–645. doi: 10.1016/j.jsams.2010.04.003
Gabbett, T., Kelly, J., and Pezet, T. (2008). A comparison of fitness and skill among playing positions in sub-elite rugby league players. J. Sci. Med. Sport 11, 585–592. doi: 10.1016/j.jsams.2007.07.004
Geithner, C. A., Lee, A. M., and Bracko, M. R. (2006). Physical and performance differences among forwards, defensemen, and goalies in elite woman ice hockey. J. Strength Cond. Res. 20, 500–505. doi: 10.1519/00124278-200608000-00007
Gledhill, N., and Jamnik, V. (2007). Detailed Assessment Protocols For NHL Entry Draft Players. Toronto: York University.
Haugen, T., and Buchheit, M. (2016). Sprint running performance monitoring: methodological and practical considerations. Sports Med. 46, 641–656. doi: 10.1007/s40279-015-0446-0
Haugen, T., Tønnessen, E., and Seiler, S. K. (2012). The difference is in the start: impact of timing and start procedure on sprint running performance. J. Strength Cond. Res. 26, 473–479. doi: 10.1519/JSC.0b013e318226030b
Haugen, T., Tønnessen, E., Svendsen, I. S., and Seiler, S. (2014). Sprint time differences between single- and dual-beam timing systems. J. Strength Cond. Res. 28, 2376–2379. doi: 10.1519/JSC.0000000000000415
Henriksson, T., Vescovi, J. D., Fjellman-Wiklund, A., and Gilenstam, K. (2016). Laboratory- and field-based testing as predictors of skating performance in competitive-level female ice hockey. Open Access J. Sports Med. 7, 81–88. doi: 10.2147/OAJSM.S109124
Hopkins, W. G. (2004). How to interpret changes in an athletic performance test. Sportscience 8, 1–7.
Hopkins, W. G., Batterham, A. M., Marshall, S. W., and Hanin, J. (2009). Progressive statistics. Sportscience 13, 55–70.
Hoppe, M. W., Baumgart, C., Polglaze, T., and Freiwald, J. (2018). Validity and reliability of GPS and LPS for measuring distances covered and sprint mechanical properties in team sports. PLoS One 13:e0192708. doi: 10.1371/journal.pone.0192708
IAAF (2017). International Association of Athletics Federations. Competition Rules 2018-2019. Monaco: International Association of Athletics Federations.
Janot, J. M., Beltz, N. M., and Dalleck, L. D. (2015). Multiple off-ice performance variables predict on-ice skating performance in male and female division iii ice hockey players. J. Sports Sci. Med. 14, 522–529.
Jennings, D., Cormack, S., Coutts, A. J., Boyd, L., and Aughey, R. J. (2010). The validity and reliability of gps units for measuring distance in team sport specific running patterns. Int. J. Sports Physiol. Perform. 5, 328–341. doi: 10.1123/ijspp.5.3.328
Kalman, R. E. (1960). A new approach to linear filtering and prediction problems. J. Basic Eng. 82, 35–45. doi: 10.1115/1.3662552
Karcher, C., and Buchheit, M. (2014). On-court demands of elite handball, with special reference to playing positions. Sports Med. 44, 797–814. doi: 10.1007/s40279-014-0164-z
Krustrup, P., Mohr, M., Ellingsgaard, H., and Bangsbo, J. (2005). Physical demands during an elite female soccer game: importance of training status. Med. Sci. Sports Exerc. 37, 1242–1248. doi: 10.1249/01.mss.0000170062.73981.94
La Monica, M. B., Fukuda, D. H., Miramonti, A. A., Beyer, K. S., Hoffman, M. W., Boone, C. H., et al. (2016). Physical differences between forwards and backs in american collegiate rugby players. J. Strength Cond. Res. 30, 2382–2391. doi: 10.1519/JSC.0000000000001388
Leone, M., Léger, L. A., Larivière, G., and Comtois, A. S. (2007). An on-ice aerobic maximal multistage shuttle skate test for elite adolescent hockey players. Int. J. Sports Med. 28, 823–828. doi: 10.1055/s-2007-964986
Leser, R., Baca, A., and Ogris, G. (2011). Local positioning systems in (game) sports. Sensors 11, 9778–9797. doi: 10.3390/s111009778
Link, D. (2014). A toolset for beach volleyball game analysis based on object tracking. Int. J. Comput. Sci. Sport 13, 24–35.
Linke, D., Link, D., and Lames, M. (2018). Validation of electronic performance and tracking systems (EPTS) under field conditions. PLoS One 13:e0199519. doi: 10.1371/journal.pone.0199519
Mara, J., Morgan, S., Pumpa, K., and Thompson, K. (2017). The accuracy and reliability of a new optical player tracking system for measuring displacement of soccer players. Int. J. Comput. Sci. Sport 16, 175–184. doi: 10.1515/ijcss-2017-0013
Massuca, L., Branco, B., Miarka, B., and Fragoso, I. (2015). Physical fitness attributes of team-handball players are related to playing position and performance level. Asian J. Sports Med. 6:e24712. doi: 10.5812/asjsm.24712
National Hockey League (2015). 2015 NHL Scouting Combine Fitness Testing Summary. Available at: http://www.nhl.com
Nightingale, S. C., Miller, S., and Turner, A. (2013). The usefulness and reliability of fitness testing protocols for ice hockey players: a literature review. J. Strength Cond. Res. 27, 1742–1748. doi: 10.1519/JSC.0b013e3182736948
Ogris, G., Leser, R., Horsak, B., Kornfeind, P., Heller, M., and Baca, A. (2012). Accuracy of the LPM tracking system considering dynamic position changes. J. Sports Sci. 30, 1503–1511. doi: 10.1080/02640414.2012.712712
Portas, M. D., Harley, J. A., Barnes, C. A., and Rush, C. J. (2010). The validity and reliability of 1-HZ and 5-HZ global positioning systems for linear, multidirectional, and soccer-specific activities. Int. J. Sports Physiol. Perform. 5, 448–458. doi: 10.1123/ijspp.5.4.448
Rawstorn, J. C., Maddison, R., Ali, A., Foskett, A., and Gant, N. (2014). Rapid directional change degrades GPS distance measurement validity during intermittent intensity running. PLoS One 9:e93693. doi: 10.1371/journal.pone.0093693
Redwood-Brown, A., Cranton, W., and Sunderland, C. (2012). Validation of a real-time video analysis system for soccer. Int. J. Sports Med. 33, 635–640. doi: 10.1055/s-0032-1306326
Roczniok, R., Maszczyk, A., Czuba, M., Stanula, A., Pietraszewski, P., and Gabryś, T. (2012). The predictive value of on-ice special tests in relation to various indexes of aerobic and anaerobic capacity in ice hockey players. Hum. Mov. 13, 28–32. doi: 10.2478/v10038-012-0001-x
Roczniok, R., Stanula, A., Maszczyk, A., Mostowik, A., Kowalczyk, M., Fidos-Czuba, O., et al. (2016). Physiological, physical and on-ice performance criteria for selection of elite ice hockey teams. Biol. Sport 33, 43–48. doi: 10.5604/20831862.1180175
Siegle, M., Stevens, T., and Lames, M. (2013). Design of an accuracy study for position detection in football. J. Sports Sci. 31, 166–172. doi: 10.1080/02640414.2012.723131
Slimani, M., and Nikolaidis, P. T. (2017). Anthropometric and physiological characteristics of male soccer players according to their competitive level, playing position and age group: a systematic review. J. Sports Med. Phys. Fit. doi: 10.23736/S0022-4707.17.07950-6 [Epub ahead of print].
Stelzer, A., Pourvoyeur, K., and Fischer, A. (2004). Concept and application of LPM—a novel 3-D local position measurement system. IEEE Trans. Microw. Theory Technol. 52, 2664–2669. doi: 10.1109/TMTT.2004.838281
Stevens, T., de Ruiter, C., van Niel, C., van de Rhee, R., Beek, P., and Savelsbergh, G. (2014). Measuring acceleration and deceleration in soccer-specific movements using a local position measurement (LPM) system. Int. J. Sports Physiol. Perform. 9, 446–456. doi: 10.1123/ijspp.2013-0340
Suarez-Arrones, L., Torreño, N., Requena, B., Sáez De Villarreal, E., Casamichana, D., Barbero-Alvarez, J. C., et al. (2015). Match-play activity profile in professional soccer players during official games and the relationship between external and internal load. J. Sports Med. Phys. Fit. 55,1417–1422.
Türk-Noak, U. (1994). “Field trial of the laveg laser diode system for kinematic analysis in various kinds of sports,” in Proceedings of the 12th International Symposium on Biomechanics in Sports, Hungary, Budapest.
Vaz, L., Morais, T., Rocha, H., and James, N. (2014). Fitness profiles of elite portuguese rugby union players. J. Hum. Kinet. 41, 235–244. doi: 10.2478/hukin-2014-0051
Vescovi, J. D., Murray, T. M., Fiala, K. A., and VanHeest, J. L. (2006). Off-ice performance and draft status of elite ice hockey players. Int. J. Sports Physiol. Perform. 1, 207–221. doi: 10.1123/ijspp.1.3.207
Wisloff, U. (2004). Strong correlation of maximal squat strength with sprint performance and vertical jump height in elite soccer players. Br. J. Sports Med. 38, 285–288. doi: 10.1136/bjsm.2002.002071
Keywords: sports analytics, performance analysis, positioning systems, timing gates, validation, on-ice test, smallest worthwhile change
Citation: Link D, Weber M, Linke D and Lames M (2019) Can Positioning Systems Replace Timing Gates for Measuring Sprint Time in Ice Hockey?. Front. Physiol. 9:1882. doi: 10.3389/fphys.2018.01882
Received: 17 August 2018; Accepted: 12 December 2018;
Published: 18 January 2019.
Edited by:
Luca Paolo Ardigò, University of Verona, ItalyReviewed by:
Stefan Altmann, Karlsruhe Institute of Technology (KIT), GermanySean Scantlebury, Leeds Beckett University, United Kingdom
Copyright © 2019 Link, Weber, Linke and Lames. This is an open-access article distributed under the terms of the Creative Commons Attribution License (CC BY). The use, distribution or reproduction in other forums is permitted, provided the original author(s) and the copyright owner(s) are credited and that the original publication in this journal is cited, in accordance with accepted academic practice. No use, distribution or reproduction is permitted which does not comply with these terms.
*Correspondence: Daniel Link, ZGFuaWVsLmxpbmtAdHVtLmRl