 Ammar Šarić
 Ivan Lovrić
- 1Faculty of Civil Engineering, Department of Roads and Transportation, University of Sarajevo, Sarajevo, Bosnia and Herzegovina
- 2Faculty of Civil Engineering, University of Mostar, Mostar, Bosnia and Herzegovina
Although two-lane roundabouts theoretically exhibit excellent operating performance, in practice, safety problems arise because of inappropriate driving behavior. Turbo roundabouts, which are characterized by a much higher level of safety, are alternatives to classic two-lane roundabouts, but the capacity-related benefits derived from such roundabouts remain an open issue. Accordingly, this study uses an equilibrium traffic flow allocation approach to evaluate multi-lane roundabout capacity based on gap acceptance theory. Capacity levels are calculated and compared for different gap acceptance parameters, including local parameters, and different traffic flow scenarios. It is found that the capacity of minor approaches on turbo roundabouts is always higher than on two-lane roundabouts, but that the main approaches on two-lane roundabouts exhibit better performance in terms of fully equilibrium traffic allocation. This state, however, cannot be achieved for every demand scenario. The results depend strongly on traffic movements and gap acceptance parameters indicating the need for local calibration processes.
Introduction
Roundabouts have been operating for over 100 years worldwide, but there is still debate about which is the best type in terms of capacity, safety, environmental issues, and geometric features, among other aspects. These intersections continue to evolving, resulting in new variants, such as turbo, flower, dog-bone, and turbo-square roundabouts. The design elements and operating performance of these new designs differ greatly from those of conventional single- or two-lane roundabouts, which suffer from several disadvantages related to capacity or traffic safety (Tollazzi and Renčelj, 2014).
Single-lane roundabouts are a logical choice when safety and capacity must be increased at conventional unsignalized intersections. However, in cases where these roundabouts cannot satisfy traffic or geometric conditions, it is necessary to adopt a two-lane or alternative design. In recent years, the most common alternative design has been the turbo roundabout. Although two-lane roundabouts theoretically exhibit excellent operating performance in terms of capacity and delay, in practice, safety problems occur because of inappropriate driving behavior. The geometric layout of two-lane roundabouts enables drivers to change between circular lanes, regardless of lane markings. This means that vehicles go through at excessively high speeds as they use both circular lanes and aggressively cut through traffic flow on the outer lane when exiting from the inner one. The accidents that arise from these situations are not as severe as those occurring at standard at-grade intersections, but they may still significantly decrease overall performance (Silva et al., 2013). The need for a solution to these safety issues prompted the development of turbo roundabouts.
Turbo roundabouts, invented in the Netherlands, are a modification of two-lane roundabouts. Their defining characteristic is the installation of physical barriers between circular lanes, separating traffic flows within the roundabout from entry to exit. Drivers choose an entry lane as they approach the roundabout, helped by special lane markings. Owing to the physical barriers dividing the circular lanes, drivers must follow curved trajectories and reduce their driving speed. These barriers and the behaviors that they motivate overcome the driving-related problems encountered on two-lane roundabouts. The number of conflict points on turbo roundabouts is also substantially lower than on two-lane roundabouts (Silva et al., 2013). The latter have 24 conflict points, whereas the former have only 14 (4 crossing, 4 diverging, and 6 merging conflict points), thereby considerably reducing the risk of traffic accidents.
The turbo roundabout concept has been adopted in several other European countries, including Slovenia, Germany, Denmark, and Poland. Today, over 400 turbo roundabouts have been constructed globally (see http://www.dirkdebaan.nl/), but no unique guidelines for their design or for analysis of their performance have been established (Tollazzi and Renčelj, 2014).
Several researchers have examined the safety benefits presented by turbo roundabouts. Mauro and Cattani (2010) found that accidents occur 40–50% less frequently on turbo roundabouts than on their two-lane counterparts. These authors also reported a reduction of 20–30% in the number of accidents resulting in injuries on turbo roundabouts. Similar findings were obtained by a Dutch study (Fortuijn, 2009a), which indicated a reduction in potential accidents by 80%.
Despite the insights provided by these studies, however, it has yet to be confirmed that turbo roundabouts have a more effective operating performance than standard two-lane roundabouts. The primary obstacle to a definitive determination is the use of inappropriate methodologies that do not consider the specific characteristics of traffic flows on turbo roundabouts (Vasconcelos et al., 2014a). In addition, there is a lack of studies based on turbo roundabouts that are already in use. The first capacity methodology applicable only to turbo roundabouts, called the “quick-scan model” was developed in the Netherlands. The model showed that turbo roundabouts have 25–35% higher capacity than two-lane roundabouts. The results depend on traffic movements, roundabouts designs, and certain driver-related factors (Engelsman and Uken, 2007).
Other studies, employing simplified approaches, also showed turbo roundabouts to have a higher capacity than standard two-lane roundabouts (Fortuijn, 2007; Corriere and Guerrieri, 2012).
More complex capacity evaluation approaches were used in two separate analyses carried out in Italy and Portugal. These methods represented a huge improvement over those used in similar studies. In Italy, Mauro and Branco (2010) comprehensively investigated capacity based on gap acceptance theory. Using several traffic flow scenarios, they concluded that turbo roundabouts have a better operating performance than two-lane roundabouts, although capacity may differ on major and minor approaches (Vasconcelos et al., 2014a). According to Mauro and Branco, minor approaches on turbo roundabouts have a higher capacity than those on two-lane roundabouts in cases where most vehicles use the inner circulatory lanes. At the same time, the capacity of major approaches on two-lane roundabouts is always higher than on turbo roundabouts (Tollazzi and Renčelj, 2014).
In Portugal, Vasconcelos et al. (2014a) conducted a detailed comparative analysis of capacity for two-lane and turbo roundabouts. Their results differ significantly from those of Mauro and Branco (2010). Based on numerous combinations of demand levels and traffic load, Vasconcelos et al. (2014a) concluded that the capacity of a turbo roundabout is substantially lower than that of a two-lane roundabout of equivalent dimensions and in similar traffic demand scenarios. They stated that the findings were expected because “the turbo roundabout is a more inflexible solution than the normal roundabout.” Their application of gap acceptance methodology represents a breakthrough in the examination of turbo roundabouts. It is a widely accepted approach that will be discussed in more detail in the following sections.
The abovementioned evaluation of turbo roundabouts as inflexible, contrasts with the assessment of previously published studies, which highlighted the benefits gained from these intersections (e.g., Fortuijn, 2009a); these advantages generate high capacity given that traffic flow is much better distributed on circular lanes. In a similar vein, Mauro and Branco (2010) pointed out that the merits of turbo roundabouts stem from the equal use of both circular lanes within the roundabout.
This literature review has reflected the limited number of analyses devoted to turbo roundabout capacity, the different methodologies used to determine that capacity, and even the contradictory results presented by some studies. Moreover, in only a few studies have results been confirmed using field data (Vasconcelos et al., 2014b).
Models for Roundabout Capacity
Given the long history of roundabout operation worldwide, a wide variety methods for evaluating roundabout capacity have been developed. Some are specific to a single country, whereas others are universally applicable calculation procedures. However, only a few capacity models have been established for turbo roundabouts. Existing capacity methodologies for two-way-stop-controlled intersections, where vehicles from minor approaches seek a time gap in the major flow to enter, may constitute the basis for capacity determination of turbo roundabouts (Giuffrè et al., 2012a). However, the main debate regarding capacity models for roundabouts, and unsignalized intersections in general, still concerns the use of gap acceptance theory versus empirical regression models (Brilon et al., 1999). Empirical regression models are established on the basis of field data, employing which information that correlates capacity with delays and geometric features. Developing a reliable regression model requires a large set of data on saturated conditions (Giuffrè et al., 2016b). This task is often time consuming, and the resulting model represents traffic conditions only in the specific area where research is conducted. These properties make regression models unreliable (or even useless) when adopted for evaluating sites located beyond the scope of a given research effort.
The first capacity model for turbo roundabouts and the only empirical regression model in use at present, is that proposed by Fortuijn and Harte (1997). This model is based on a modified Bovy linear regression model with parameters that take account of the effects of exiting vehicles and traffic split between inner and outer circular lanes (Fortuijn, 2009a,b). The drawbacks of this approach are that it does not provide a correct description of the true nature of traffic flow at unsignalized intersections and that it cannot be used or calibrated for the specific circumstances of different countries. For these reasons, all recently developed models have been based on gap acceptance theory, which has become a globally adopted technique for the analysis of roundabout performance.
Gap Acceptance-Based Models
The application of gap acceptance theory requires two main parameters, namely, the critical gap and the follow-up headway. The distribution of headways in major streams determines the value and number of usable time gaps for minor streams (Giuffrè et al., 2012b). A critical gap therefore plays an essential role in implementing the theory in capacity evaluation.
Brilon (2016) defined a critical gap “as that distance in time between two successive major street vehicles that is just long enough to allow-on average-one vehicle from the minor street to cross the path of the prioritized movement.” Often, the term “headway” is used, as in the US Highway Capacity Manual (HCM) (Transportation Research Board, 2010), because some researchers regard “gap” as the time interval that spans only two successive vehicles (i.e., the rear of the first car and the front of the next) (Giuffrè et al., 2012b). The “critical gap” used in this paper encompasses the full length of a leading vehicle and the gap between two successive vehicles. Further, the follow-up headway is defined as the time difference between two successive vehicles in the same lane entering the roundabout and using the same gap.
Compared with empirical regression models, analytical models based on gap acceptance theory can be established on the basis of uncongested conditions. Gap acceptance theory assumes that drivers are consistent and homogeneous (Brilon and Troutbeck, 2016), because practical application requires only one pair of values of the critical gap and the follow-up time for a single conflict flow; that is, these values are constant. An important issue for consideration, however, is that the critical gap and follow-up values depend on traffic conditions, the type and dimensions of intersections, and traffic flow structures. Thus, the assumptions are unrealistic: drivers do not behave in the same manner each time and often accept a smaller gap than expected (Giuffrè et al., 2016b). Nevertheless, simplifying the true nature of driving behavior has no significant influence on the final capacity results.
On roundabouts, traffic flow in circular lanes is prioritized over that on entryways. Waiting vehicles can enter only when the time interval between two successive vehicles in a roundabout is “equal to (or greater than) the critical gap” (Tanner, 1962). The distribution of these intervals is reliably represented by a probability distribution functions, such as the semi-Poisson, the hyper-Erlang, the double-displaced negative exponential, and the considerably simpler negative exponential distribution (Luttinen, 1996). However, instead of these models, a more appropriate model for roundabout analysis is Cowan’s (1975) family of distributions, especially the M3 model. In this model, headways are divided between free and platoon (or bunched) vehicles. Bunched vehicles are represented by one headway Δ (the minimum headway), while unbunched vehicles are represented by free vehicles with randomly distributed headways greater than Δ. In Cowan’s M3 distribution, free vehicles follow a shifted exponential distribution (Giuffrè et al., 2012b). The cumulative density function of this distribution is given by the following equation:
where α is a parameter that represents the proportion of free vehicles and λ is an exponential arrival headway distribution model parameter (Giuffrè et al., 2012b). These parameters can be derived using several methods (e.g., the method of moments, the least squares method, or simultaneous numerical estimation) each exhibiting a different level of accuracy (Giuffrè et al., 2012b).
A variety of proposed bunching models, with estimates of the parameter α, are presented in Table 1 (Giuffrè et al., 2012b). According to Tanner (1962), the parameter λ can be assumed to be equal to the circulating flow. A more complex expression for this parameter will be given later.
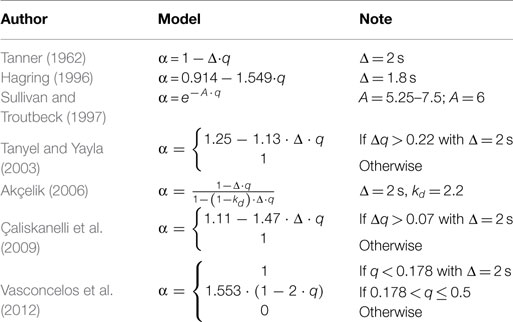
Table 1. Different bunching models.
Mauro and Branco (2010) used a lane-based capacity calculation, using a formula developed by Wu (2001). Vasconcelos et al. (2014a) commented on this approach as follows: “Wu’s generic capacity model is used with the same simplifications that were assumed for its integration in HBS 2001 (the German equivalent of the US Highway Capacity Manual). These simplifications consist of making the model insensitive to the traffic flow allocation to the different circulatory lanes in front of each entry (thus depending only of the total opposing flow) and using a simple linear bunching expression to describe the headway distribution in the opposing flow.” However, drivers have the following choices: first, between the left and right entry lane, at major approaches on the turbo roundabout, and on a two-lane roundabout for through movement; second, at minor approaches on a turbo roundabout for a right turn. In actual situations, this choice cannot be a fixed one, as recommended by most capacity evaluation methods, including Wu’s formula. Entry lane selection should instead be treated as being based on traffic conditions, estimated waiting time, or driver characteristics (Vasconcelos et al., 2014a).
Although Mauro and Branco’s (2010) method represents a huge improvement over previously adopted empirical regression formulations, more precise models are necessary. For this purpose, a number of researchers (Giuffrè et al., 2012a; Vasconcelos et al., 2014a; Fortuijn and Hoogendoorn, 2015) suggested the gap acceptance approach put forward by Hagring (1998). Hagring developed a universal capacity model that can be used on every multi-lane intersection. Each entry lane is characterized by conflict with one or more circular lanes, thereby resulting in the generation of several gap acceptance parameters that represent different driver behaviors. Assuming that all major traffic streams have Cowan’s M3 headway distribution, the capacity can be calculated as follow (Giuffrè et al., 2012b):
where C denotes the entry lane capacity (veh/h), α represents the proportion of free vehicles, tc,i is the critical gap for each entry lane (s), tf,i is the follow-up time for each entry lane (s), Δ is the minimum headway of circulating vehicles (s), λi is Cowan’s M3 parameter, k is the minor flow index, and Ik is the set of major flows i that conflict with minor flow k.
The lane-by-lane approach that underlies Hagring’s formula makes it highly appropriate for application to capacity evaluation of turbo roundabout (Giuffrè et al., 2012a). It is a completely theoretical and probability-based model that reliably describes major traffic flows and the expected reactions of vehicles waiting at entryways. On standard turbo roundabouts (Figure 1), two conflict situations must be considered separately: one opposing major flow at major approaches and on the right lane at minor approaches, and two opposing major flows on the left lane at minor approaches. The capacity can then be calculated as follows (Hagring, 1998):
in the first case and
in the second. The first relation between parameters in Cowan’s M3 distribution (α, λ, Δ) relates to a bunching model (Table 1), whereas the second can be expressed as follows:
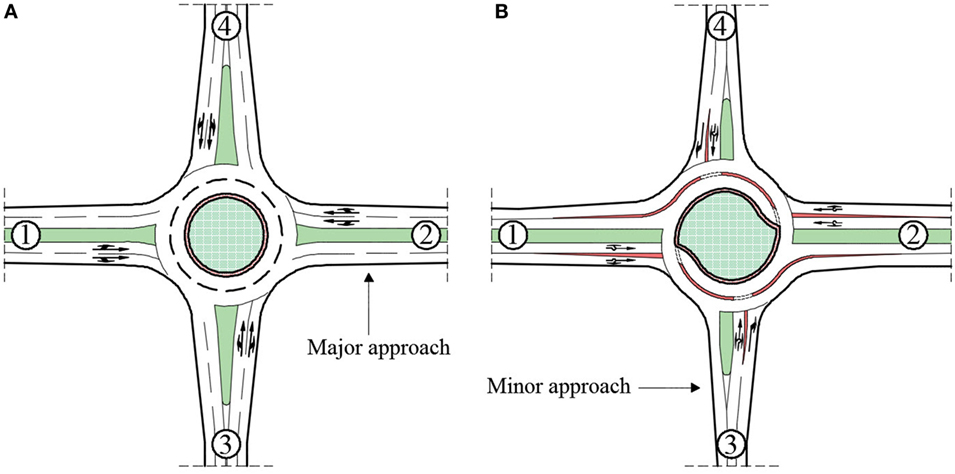
Figure 1. Conventional two-lane roundabout (A), and standard turbo roundabout (B) (Vasconcelos et al., 2014a).
The development and correct calibration of a bunching model for the needs of a specific country is not a trivial procedure (see, e.g., Tanyel and Yayla, 2003; Vasconcelos et al., 2012) and to date has not been done for Bosnia and Herzegovina; therefore, we adopt here the bilinear model (Table 1) proposed by Vasconcelos et al. (2012). This model, combined with Hagring’s formula, has already been used in a few comprehensive studies (see Vasconcelos et al., 2012, 2014a).
Vasconcelos et al. (2014a) calibrated the bunching formula assumpting an inter-platoon headway parameter of Δ = 2s, which “predicts null capacity when one or more opposing lanes have flows above 1/Δ(0.5 veh/s or 1,800 veh/h).” A sensitivity analysis of this model (see Vasconcelos et al., 2012) showed low or no sensitivity of roundabout capacity to the platoon headway parameter Δ for main stream flows below 500 veh/h. For much higher flow values (1,200–1,500 veh/h), capacity is insensitive to Δ in the range Δ = 1.8–2.1 s. These values are in accordance with those suggested by other researchers, such as Hagring (1998) and Giuffrè et al. (2012a).
Capacity Calculation
The first goal of this study was to conduct extensive research on previously proposed capacity models for turbo roundabouts and, thereby to adopt the most reliable model. This goal has been discussed in the preceding two sections, where Hagring’s formula, with supporting Eqs 2–5, was proposed for capacity calculation. The adopted model is suitable for all multi-lane unsignalized intersections, including all variations of two-lane roundabouts. The second goal was the practical application of the model to compare the capacities of a standard two-lane roundabout and a turbo roundabout. The layouts of the roundabouts examined are illustrated in Figure 1. The major approaches or legs on both roundabouts are sections 1 and 2, whereas the minor legs are sections 3 and 4.
Vasconcelos et al. (2014a) noted that there are some important geometric differences between standard two-lane and turbo roundabouts that affect capacity. On a two-lane roundabout, vehicles from minor approaches (3 and 4) can use both circular lanes to drive straight, while on a turbo roundabout, all vehicles are in the outer lane ahead of major approaches. Also, at minor approaches on a turbo roundabout, the right lane is used only for right turns; in these sections, traffic conflict is reduced because of raised dividers at the exit. On a two-lane roundabout, all movements from major and minor approaches are affected in the same way (Hagring et al., 2003; Rodegerdts et al., 2007). This can lead to so-called pseudoconflict, which arises when a driver does not indicate that he or she is about to leave the roundabout (i.e., the right-turn signal is off) and thereby compels a driver waiting at the next approach to stay longer at the entry. This is a typical situation for all types of standard roundabouts. The physical barriers on turbo roundabouts reduce the effect of pseudoconflict on main approaches. The problem, however, is that few studies have been carried out on pseudoconflict at roundabouts and its actual effects. Zheng et al. (2011) analyzed critical gaps in Wisconsin (USA) and estimated their values with and without the effect of pseudoconflict. They reported that critical gaps are always longer when pseudoconflict is taken into account. Fortuijn and Hoogendoorn (2015) proposed a novel procedure that incorporates pseudoconflict directly into Hagring’s formula. However, this approach requires further investigation given that it is a relatively new method based on only a few real-world cases.
Finally, vehicles that turn right on a two-lane roundabout almost always use the right entry lane. By contrast, turbo roundabouts afford drivers the use of both right and left entry lanes on minor approaches with no conflict point at the exit (Vasconcelos et al., 2014a). However, the results presented here show that this is rarely an advantage and is able to increase the capacity of turbo roundabouts only in special, unrealistic, cases.
To evaluate the capacity of two-lane and turbo roundabout, we formulated demand scenarios represented by eight origin/destination matrices (Figure 2). The elements in the matrices are the percentages of traffic flow between approaches. In all the scenarios, three constant traffic levels on major legs were assumed: q1 = q2 = 1,000, 1,200, and 1,500 veh/h. On minor approaches, traffic flow was progressively increased until a critical level of saturation (v/c = 1) or a maximum of 1,000 veh/h on one roundabout entry was reached.
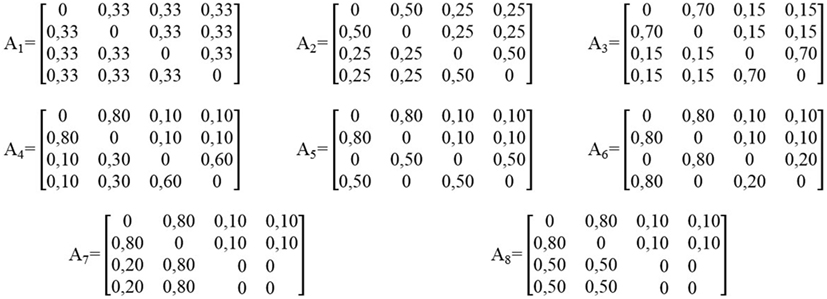
Figure 2. Traffic demand scenarios.
In most scenarios, the major approaches are characterized by similar traffic load distributions; that is, through movement is dominant (50–80%), whereas left and right turns are less common. This situation is very similar to actual traffic conditions on busy roundabouts. For the minor approaches, we established scenarios with different dominant movements (e.g., A3 is characterized by dominant through movement and A6 by dominant right movement, whereas A8 has equal percentages of left and right movements).
Traffic Flow Allocation
One of the most important advantages of the capacity model presented in this work is its lane-based approach, which involves traffic flow allocation. Instead of assuming a fixed proportion of vehicles in the inner or outer circular lane (i.e., the left or right entry lane), a more realistic supposition is that drivers will choose a lane based on lower delay (i.e., the lane with fewer vehicles). This situation is often observed on urban roundabouts during the busiest hours and where most drivers are familiar with the geometry of intersections and traffic conditions. This familiarity enables drivers to find the shortest route through a roundabout. Such behavior leads to an equilibrium state, with the same v/c ratio on both entry lanes (Vasconcelos et al., 2014a).
Given the geometric features of the roundabouts analyzed in this study, drivers can use inner and outer circular lanes for through movement from all directions on two-lane roundabouts but only from major legs on turbo roundabouts. Also, for right turns from minor legs on turbo roundabouts, drivers can use both entry lanes. In all these cases, an equilibrium state can be achieved with appropriate traffic flow allocation.
The number of vehicles that use the inner lane for through movement can be calculated using the following equation:
and the number of right-turning vehicles that use the left entry lane on minor approaches at turbo roundabouts can be calculated using (Vasconcelos et al., 2014a) the following equation:
where C1 and C0 are the capacities of the left and right entry lanes, respectively, and q1, q2, and q3 are the left, through, and right traffic movements, respectively.
This allocation method requires an iterative process with initial default p1 values to enable the computation of the initial capacity. Each iteration generates new lane usage factors, which replace the previous values. The process converges rapidly, and no more than two or three iterations are required to achieve a fully equilibrium state. This method is more precise and realistic than the highly simplified HCM 2010 methodology.
Nonetheless, expecting a fully equilibrium state in every situation is unrealistic. Because of safety issues, the inner lane on two-lane roundabouts is often less frequently used or used in an inappropriate manner (e.g., combined use of inner and outer lanes for through movement at high speed). In Denmark, Greibe and Lund (2010) found that a maximum of 30–40% of drivers use the inner lane on two-lane roundabouts when traffic volumes are high. Our case study on the two-lane roundabout in Sarajevo indicated a similar result, with the maximum utilization of the inner lane being up to 30%.
The case of turbo roundabouts is simpler because drivers choose lanes before entering the roundabout. This property is the main advantage of turbo roundabouts over their standard two-lane counterparts. Based on this advantage, many researchers (e.g., Fortuijn, 2009a,b) have adopted the assumptions of improved inner circular lane usage and improved operational performance in an entire roundabout. Notwithstanding this advantage, however, no explicit analyses of circular lane usage on real-world turbo roundabouts have confirmed claims of improvement.
Accordingly, in the present study, we compared the maximum theoretical capacity of two-lane and turbo roundabouts. We also investigated the case with a lower degree of inner lane utilization at two-lane roundabouts.
Gap Acceptance Parameters
Hagring’s model requires the use of gap acceptance parameters for each entry lane. This model allows the use of different critical gaps and follow-up times in the examination of every conflict flow (Vasconcelos et al., 2014a). We used several sets of gap acceptance parameters employed by different researchers for two-lane roundabouts (Table 2). These sets were chosen because of their relevance to present study in estimating gap acceptance parameters, and because they represent a variety of conditions in different countries. A meta-analysis of gap acceptance parameters for roundabouts can be found in a study by Giuffrè et al. (2016a), who used various sources of critical gap and follow-up values. This analysis provided valuable insight into a wide range of the aforementioned parameters.
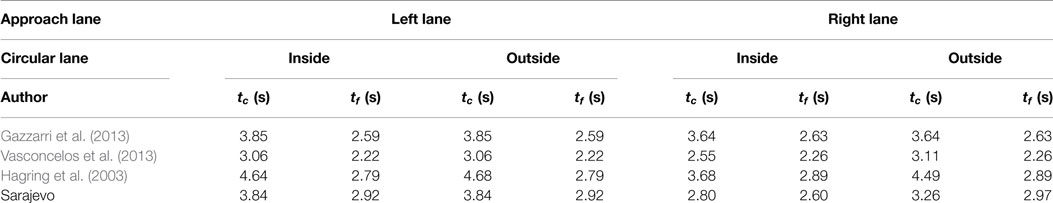
Table 2. Gap acceptance parameters by different authors.
As previously indicated, research on gap acceptance parameters for roundabouts has not been conducted in Bosnia and Herzegovina. To address this deficiency, we examined only one two-lane roundabout to allow convenient comparison of the capacity procedure with those implemented in other countries. Although a single sample may not provide sufficiently reliable data, it can indicate a trend. The layout of the roundabout examined with the proposed analysis approach is shown in Figure 3. Some of the traffic and geometric features of this roundabout affect the final results. First, only two approaches (1 and 2) could be analyzed, because the capacity calculation was performed on a roundabout with all of its entries having two lanes (see Figure 1). The gap acceptance parameters for a one-lane entry, such as entry 3 on the examined roundabout, can differ significantly from those obtained for two-lane entries, especially with regard to the inner circular lane. Second, only one opposing dominant movement (left from approach 3) exists, so only approach 2 is characterized by a sufficient number of conflict situations for analysis. Third, the examined roundabout has three legs, which affect the gap acceptance parameters for approach 2. This issue is explained in more detail below.
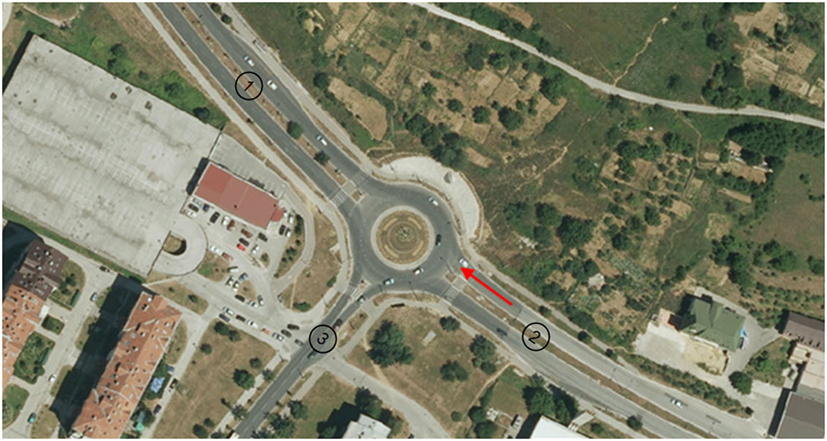
Figure 3. Layout of analyzed two-lane roundabout in Sarajevo, Bosnia and Herzegovina.
Several studies have concluded that the maximum likelihood method (MLM) is the most appropriate approach for critical gap estimation (e.g., Troutbeck, 1992, Tian et al., 1999, 2000, Tanyel and Yayla, 2003). Brilon et al. (1999) found that “this method is the only reliable and easily handled procedure for an empirical estimation of critical gaps. Reliable in this context means that 1. The method for the estimation of tc reproduces the exact values precisely, and 2. The result does not depend on traffic volumes, either on minor streets or major streets” (Brilon, 2016). This method and other approaches are comprehensively described in Vasconcelos et al. (2012, 2013) and Brilon et al. (1999). Using recorded data and the MLM method on a limited sample, we obtained gap acceptance parameters for the two-lane roundabout in Sarajevo.
Table 2 indicates significant differences between the results of previous studies and those obtained in this study. First, the values obtained in Portugal by Vasconcelos et al. (2013) are substantially lower than those obtained for other countries. Second, the critical gap value found by Gazzarri et al. (2013) for the right entry lane and the inner circular lane is the same as that for the outer lane. Other studies found this value to be the smallest among all the critical gap values that were obtained. According to Vasconcelos et al. (2013), “it reflects the fact that many right-turning drivers disregard the corresponding opposing traffic, particularly when they realise that those drivers will continue circulating to take a different exit.”
The same holds for the Sarajevo roundabout, where driver disregard of opposing traffic is even more evident because a fourth entry is missing. These findings indicate that this critical gap must be smaller than others. Third, the three values (tc and tf for the right entry lane and the inner circular lane, and tc for the right entry lane and the outer circular lane) derived for the Sarajevo roundabout were obtained based on a small sample and do not fully represent actual site conditions. This applies particularly to the small critical gaps for the right entry lane and the outer circular lane, where follow-up time is very similar to the critical gap. The follow-up time is also small for the right entry lane and the inner circular lane because of the geometric features of the roundabout; that is, vehicles that drive straight from the right lane encounter practically no opposing traffic because most vehicles coming from a previous entry turn left and use the inner lane (Figure 3).
In the absence of local data on turbo roundabouts, the gap acceptance parameters used in this work are based on the values found for turbo roundabouts in the Netherlands (see Fortuijn and Hoogendoorn, 2015). Similar values can also be found in Fortuijn (2009b). The parameters used for the turbo roundabout examined in the present study are listed in Table 3.
Table 3. Dutch values for gap acceptance parameters on turbo roundabouts.
Results
Presenting the capacity curves for all demand flow scenarios and all variations of major and minor traffic load is difficult. Thus, we focused on the most interesting cases and drew conclusions based on all traffic combinations. First, the maximum theoretical capacity was obtained for the investigated two-lane and turbo roundabouts, with corresponding values of the degree of saturation. The obtained capacity curves represent total capacity, which is the sum of the capacity levels of the right and left entry lanes on major or minor approaches.
The capacity values were obtained using Hagring’s formulas (Eqs 3 and 4) and the gap acceptance parameters from Tables 2 and 3. Subsequently, a calculation assuming a maximum of 30% of vehicles on the inner lane was conducted for the two-lane roundabout to simulate more realistic traffic flow allocation. This calculation was performed only with the parameters of Vasconcelos et al., because they provided the highest capacity values based on the original parameters. In this way, we determined the increase in the v/c ratio in the most optimistic case. This value was compared with the turbo roundabout capacity obtained at full traffic flow allocation, with the assumption of improved utilization of the inner lane.
The results indicated that different gap acceptance parameters considerably influence capacity results. In all cases, the two-lane roundabout for which the parameters of Vasconcelos et al. were used generated the highest capacity values for the major approaches. The differences between these findings and the capacity results derived using the parameters from other studies are significant in all the scenarios. With respect to the minor approaches, the turbo roundabout exhibits the best performance, especially in terms of higher values of major flows. The comparison of the turbo and two-lane roundabouts based on the Sarajevo parameters demonstrated that the former exhibits better performance overall, especially with regard to capacity in the minor directions.
Poorer traffic flow allocation (30% of vehicles on the inner lane) has a minimal influence on the capacity of the two-lane roundabout. Instead, the v/c ratio depends strongly on the proportion of vehicles in the inner lane. In every case, the right entry lane has much higher v/c values in both directions when an equilibrium state is not achieved. These values translate to longer delays for all the vehicles occupying this lane. Note that for minor approaches on turbo roundabouts, an equilibrium state can never be achieved for right-turning vehicles; that is, even with very high volumes of right-turning vehicles, all will use the right entry lane instead of the left.
As we indicated earlier, capacity analysis for all demand scenarios stopped at a maximum 1,000 veh/h on minor approaches or when one approach (major or minor) reached a critical degree of saturation. In almost every combination of demand scenario and major traffic flow, one approach has a higher degree of saturation (i.e., v/c > 1) before the minor flow reaches a maximum. This occurs for specific gap acceptance parameters, demand scenario and/or relatively high traffic load. Because of this, v/c curves on some figures, especially Figure 7, have a tendency to go far beyond the limit.
Because scenarios A2 and A3 are similar, the results for only one scenario are discussed here (Figure 4). Although the turbo roundabout has a higher capacity on the minor approach, the critical v/c value is reached much earlier in comparison with the best curve (the parameters of Vasconcelos et al.) for the two-lane roundabout. This trend occurs for all values of the major flows. Scenarios A1, A2, and A3 are the only situations that require a reasonable proportion of vehicles on the inner lane (around 50%). Therefore, an equilibrium state in the two-lane roundabout can be achieved.
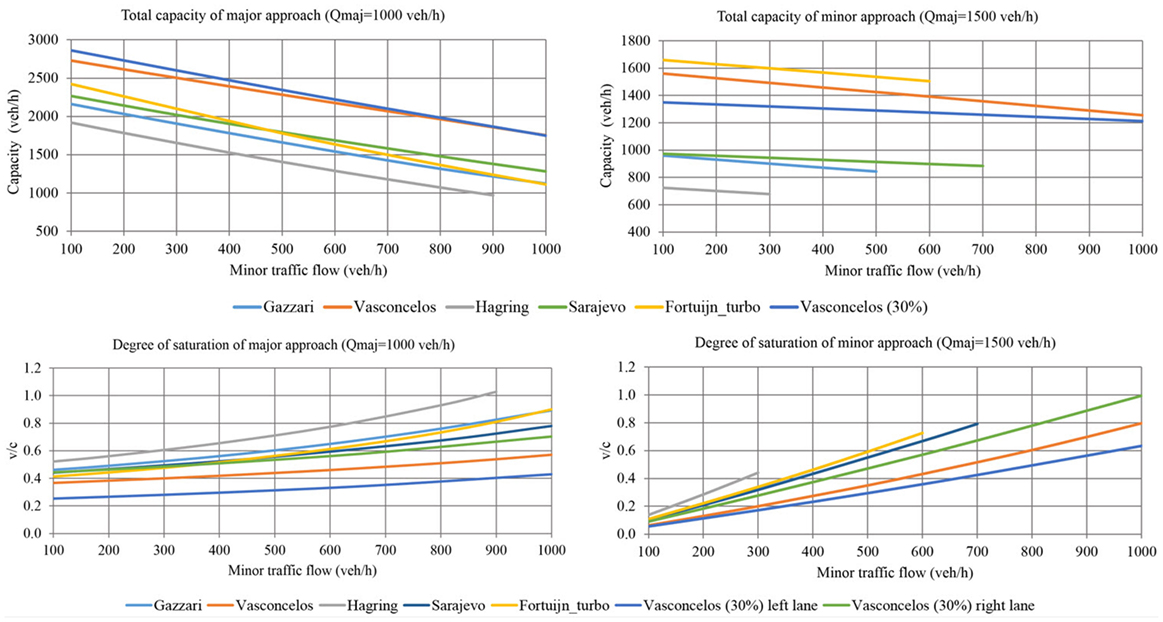
Figure 4. Capacity and v/c curves for scenario A3.
Scenarios A5 and A6 (Figures 5 and 6) are distinct from the others because they feature no left-turning vehicles from minor approaches. In these cases, all the curves for the two-lane roundabout reach the critical v/c ratio at a considerably earlier time than the curves for the turbo roundabout, although the latter has a lower capacity in the major directions. This is especially evident in scenario A6, where 80% of vehicles from minor legs are turning right. The right entry lane for which the parameters of Vasconcelos et al. were used presents the highest v/c ratio among all the investigated sets of parameters, including the values for the turbo roundabout. However, an equilibrium state can be achieved for minor approaches on the two-lane roundabout only with a very high proportion of vehicles on the inner lane (above 95% in A5 and 100% in A6). This condition is unlikely to occur in actual situations. It also explains why the v/c curves in Figure 6 substantially differ between the left and right lanes of minor approaches.
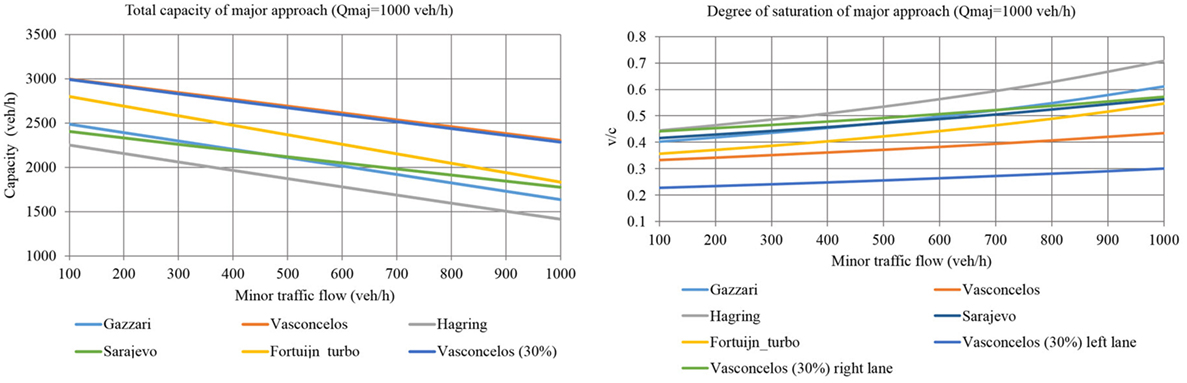
Figure 5. Capacity and v/c curves for scenario A5.
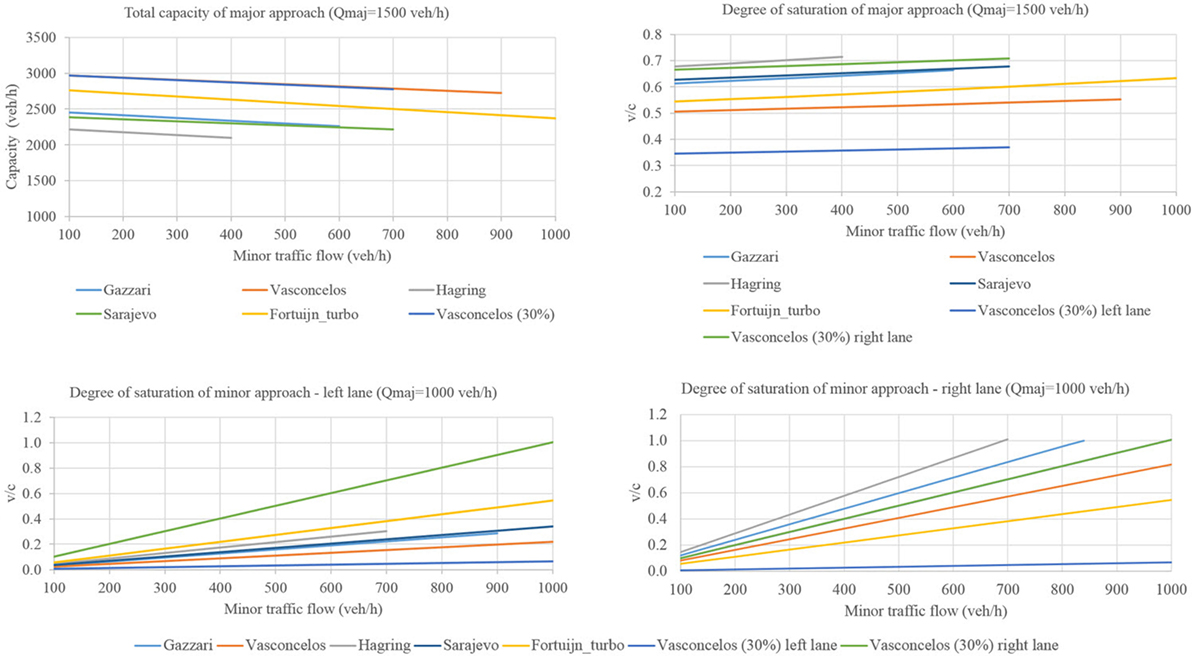
Figure 6. Capacity and v/c curves for scenario A6.
In scenarios A7 and A8 (Figures 7 and 8), no vehicles drive straight from the minor approaches, which is an extreme case of the usual traffic distribution where vehicles from different minor approaches take the same exit to a city center or shopping center. The relationship between the capacity curves in these scenarios is identical for all values of the major flows. The two-lane roundabout for which the parameters of Vasconcelos et al. were used exhibits the highest capacity in the major directions, whereas the turbo roundabout for which the parameters of other researchers were used presents a performance that exceeds that of the two-lane roundabout. On minor approaches, the capacity levels of the best two-lane roundabout (the parameters of Vasconcelos et al.) and the turbo roundabout are almost identical. However, for all values of the major flows, the turbo roundabout reaches the critical v/c value much later than does the two-lane roundabout. Another important consideration is that in these scenarios, an equilibrium state can never be achieved at the minor approaches of a two-lane roundabout, because no vehicles go straight on these approaches, and the proportion of vehicles in the inner lane (or in the left entry lane) is always set to 0. In scenario A7, all the curves indicated that the capacity is the smallest in this simulation and that the critical degree of saturation is reached much earlier than in all the other scenarios. This scenario is therefore the worst-case scenario, in which the turbo roundabout shows the best operating performance overall.
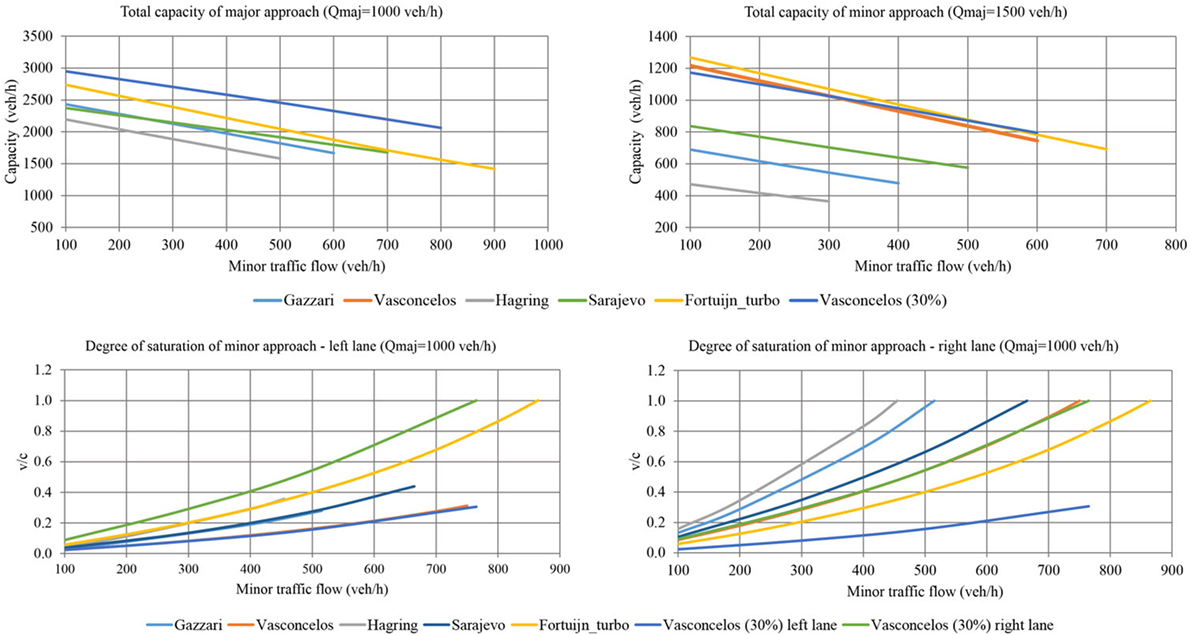
Figure 7. Capacity and v/c curves for scenario A7.
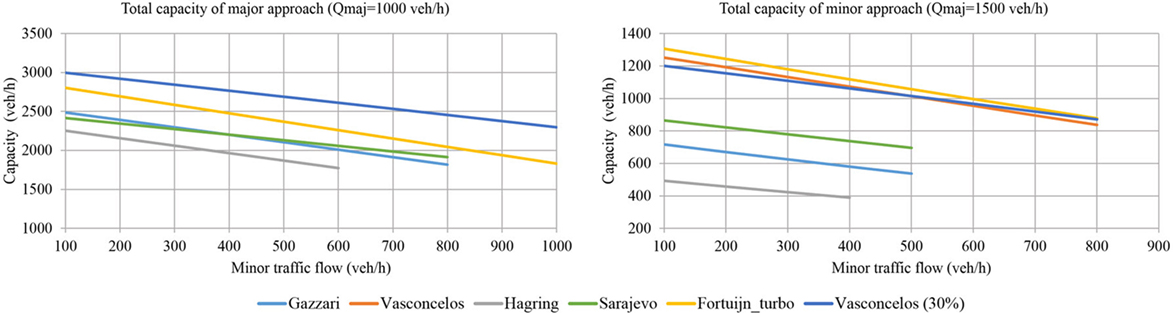
Figure 8. Capacity and v/c curves for scenario A8.
Conclusion
This paper has presented a detailed description of capacity estimation for multi-lane roundabouts, with particular application to two-lane and turbo roundabouts. The capacity levels for these intersections were compared using different gap acceptance parameters. The main conclusions can be summarized as follows:
• Capacity estimation based on gap acceptance theory, with a lane-by-lane approach, generates more accurate results than those obtained with empirical regression methods.
• Gap acceptance parameters critically influence the capacity of multi-lane roundabouts.
• Traffic flow allocation based on an equilibrium proportion of vehicles must be considered when multi-lane roundabouts are analyzed, especially in terms of the v/c ratio.
• An equilibrium state cannot be achieved on two-lane roundabout entries in every demand scenario.
• The possibility that vehicles turning right from minor approaches on turbo roundabouts can use both entry lanes represents only a moderate advantage over two-lane roundabouts. Even with a high volume of such vehicles, most of them will use the right entry lane.
• Turbo roundabouts perform better than two-lane roundabouts based on parameters collected in Sarajevo. This result holds in both directions, especially for minor approaches.
• In scenarios with a lower volume of vehicles turning from minor approaches (up to 30%), the capacity of the two-lane roundabout, for which the Sarajevo’s parameters were used, is similar to that of the turbo roundabout, particularly for high values of vehicles coming from minor directions.
• At minor approaches, the turbo roundabout exhibits a higher capacity than the two-lane roundabout, according to calculations based on the most optimistic gap acceptance parameters (namely, those of Vasconcelos et al.). In some scenarios, however, the v/c ratio of the turbo roundabout increases more rapidly and reaches its limit much earlier than the v/c ratio of the two-lane roundabout under the aforementioned parameters. This situation also occurs at the major approaches in the same scenarios.
• The turbo roundabout with the Dutch gap acceptance parameters consistently exhibits better performance than does the two-lane roundabout with parameters from various countries, except Portugal.
In this research, a high traffic load was assumed, a condition that may not correspond to most real-world situations. Correspondingly, in cases where a choice must be made between a two-lane and a turbo roundabout, safety considerations will prevail over a focus on capacity problems. However, local gap acceptance parameters must be used for capacity evaluation. More studies on real-world turbo roundabouts are necessary to guarantee accurate and reliable capacity evaluation and comparison with other types of intersections.
Author Contributions
Both authors have contributed in this paper and gave final approval for publication. AŠ carried out the theoretical and numerical analysis and field investigation. IL supervised the theoretical analysis.
Conflict of Interest Statement
The authors declare that the research was conducted in the absence of any commercial or financial relationships that could be construed as a potential conflict of interest.
The reviewer, SD, and handling editor declared their shared affiliation, and the handling editor states that the process nevertheless met the standards of a fair and objective review.
References
Akçelik, R. (2006). Speed-flow and bunching models for uninterrupted flows. Presented at the 5th International Symposium on Highway Capacity and Quality of Service Transportation Research Board, Yokohama.
Brilon, W. (2016). Some remarks regarding the estimation of critical gaps. Transp. Res. Rec. J. Transp. Res. Board 2553, 10–19. doi: 10.3141/2553-02
Brilon, W., Koenig, R., and Troutbeck, R. J. (1999). Useful estimation procedures for critical gaps. Transp. Res. Part Policy Pract. 33, 161–186. doi:10.1016/S0965-8564(98)00048-2
Brilon, W., and Troutbeck, R. J. (2016). “Chapter 8 revised monograph on traffic flow theory,” in Unsignalized Intersection Theory (Federal Highway Administration). Available at: https://www.fhwa.dot.gov
Çaliskanelli, P., Özuysal, M., Tanyel, S., and Yayla, N. (2009). Comparison of different capacity models for traffic circles. Transport 24, 257–264. doi:10.3846/1648-4142.2009.24.257-264
Corriere, F., and Guerrieri, M. (2012). Performance analysis of basic turbo-roundabouts in urban context. Procedia Soc. Behav. Sci. 53, 622–632. doi:10.1016/j.sbspro.2012.09.912
Cowan, R. J. (1975). Useful headway models. Transp. Res. 9, 371–375. doi:10.1016/0041-1647(75)90008-8
Engelsman, J. C., and Uken, M. (2007). “Turbo roundabouts as an alternative to two lane roundabouts,” in The Challenges of Implementing Policy? (Pretoria, South Africa: CSIR International Convention Centre, SATC). Available at: http://repository.up.ac.za/handle/2263/5909
Fortuijn, L. (2007). “Turbo-Kreisverkehre – Entwicklungen und Erfahrungen (eng. Turbo-Roundabouts: Development and experiences),” in Seminar “Aktuelle Themen der Strassenplanung”, Vereinigung der Straßenbau- und Verkehrsingenieure in Nordrhein-Westfalen, 25. Januar 2007, Bergisch Gladbach.
Fortuijn, L. (2009a). Turbo roundabouts: design principles and safety performance. Transp. Res. Rec. J. Transp. Res. Board 2096, 16–24. doi:10.3141/2096-03
Fortuijn, L. (2009b). Turbo roundabouts: estimation of capacity. Transp. Res. Rec. J. Transp. Res. Board 2130, 83–92. doi:10.3141/2130-11
Fortuijn, L. G. H., and Harte, V. F. (1997). Multi-Lane Roundabouts: Exploring New Models. Netherlands: CROW, Ede.
Fortuijn, L. G. H., and Hoogendoorn, S. P. (2015). Capacity estimation on turboroundabouts with gap acceptance and flow level methods. Transp. Res. Rec. J. Transp. Res. Board 2517, 71–79. doi:10.3141/2517-08
Gazzarri, A., Michael, T. M., Antonio, P., and Reginald, R. S. (2013). Gap Acceptance Parameters for HCM 2010 Roundabout Capacity Model Applications. Italy: Civil Engineering Faculty Publications. Available at: http://uknowledge.uky.edu/ce_facpub/1
Giuffrè, O., Grana, A., and Marino, S. (2012a). Comparing performances of turbo-roundabouts and double-lane roundabouts. Mod. Appl. Sci. 6, 70–79. doi:10.5539/mas.v6n10p70
Giuffrè, O., Granà, A., and Marino, S. (2012b). Turbo-roundabouts vs roundabouts performance level. Procedia Soc. Behav. Sci. 53, 590–600. doi:10.1016/j.sbspro.2012.09.909
Giuffrè, O., Granà, A., and Tumminello, M. L. (2016a). Gap-acceptance parameters for roundabouts: a systematic review. Eur. Transp. Res. Rev. 8:2. doi:10.1007/s12544-015-0190-4
Giuffrè, O., Granà, A., and Tumminello, M. L. (2016b). Methodological frontier in operational analysis for roundabouts: a review. Front. Built Environ. 2:28. doi:10.3389/fbuil.2016.00028
Greibe, P., and Lund, B. C. (2010). Capacity of 2-Lane Roundabouts. Available at: https://trid.trb.org/view.aspx?id=1099026
Hagring, O. (1996). The use of the Cowan M3 distribution for modelling roundabout flow. Traffic Eng. Control 37. Available at: https://trid.trb.org/view.aspx?id=463394
Hagring, O. (1998). A further generalization of Tanner’s formula. Transp. Res. B Methodol. 32, 423–429. doi:10.1016/S0191-2615(98)00010-1
Hagring, O., Rouphail, N., and Sørensen, H. (2003). Comparison of capacity models for two-lane roundabouts. Transp. Res. Rec. J. Transp. Res. Board 1852, 114–123. doi:10.3141/1852-15
Luttinen, R. T. (1996). Statistical Analysis of Vehicle Time Headways. Helsinki, Finland: Helsinki University of Technology.
Mauro, R., and Branco, F. (2010). Comparative analysis of compact multilane roundabouts and turbo-roundabouts. J. Transp. Eng. 136, 316–322. doi:10.1061/(ASCE)TE.1943-5436.0000106
Mauro, R., and Cattani, M. (2010). “Potential accident rate of turbo-roundabouts,” in Proceedings of 4th International Symposium on Highway Geometric Design (Valencia, Spain: Transportation Research Board).
Rodegerdts, L., Blogg, M., and Wemple, E. (2007). NCHRP 572: Roundabouts in the United States. Washington, DC: Transportation Research Board.
Silva, A. B., Santos, S., and Gaspar, M. (2013). “Turbo-roundabout use and design,” in CITTA 6th Annual Conference on Planning Research Responsive Transports for Smart Mobility, Coimbra, Portugal.
Sullivan, D. P., and Troutbeck, R. J. (1997). An exponential relationship for the proportion of free vehicles on arterial roads. Transp. Res. Part Policy Pract. 31, 21–33. doi:10.1016/S0965-8564(96)00013-4
Tanner, J. C. (1962). A theoretical analysis of delays at an uncontrolled intersection. Biometrika 49, 163. doi:10.2307/2333477
Tanyel, S., and Yayla, N. (2003). A discussion on the parameters of Cowan M3 distribution for Turkey. Transp. Res. Part Policy Pract. 37, 129–143. doi:10.1016/S0965-8564(02)00009-5
Tian, Z., Troutbeck, R. J., Kyte, M., Brilon, W., Vandehey, M., Kittelson, W., et al. (2000). A further investigation on critical gap and follow-up time. Transp. Res. Circ. 397–408.
Tian, Z., Vandehey, M., Robinson, B. W., Kittelson, W., Kyte, M., Troutbeck, R., et al. (1999). Implementing the maximum likelihood methodology to measure a driver’s critical gap. Transp. Res. Part Policy Pract. 33, 187–197. doi:10.1016/S0965-8564(98)00044-5
Tollazzi, T., and Renčelj, M. (2014). Comparative analyse of the two new alternative types of roundabouts – turbo and flower roundabout. Balt. J. Road Bridge Eng. 9. Available at: https://trid.trb.org/view.aspx?id=1328799
Transportation Research Board. (2010). Highway Capacity Manual. Washington, DC: National Research Council.
Troutbeck, R. J. (1992). Estimating the Critical Acceptance Gap from Traffic Movements. Brisbane: Physical Infrastructure Centre, Queensland University of Technology.
Vasconcelos, A. L. P., Maia Seco, ÁJ., and César Bastos Silva, A. M. (2013). Comparison of procedures to estimate critical headways at roundabouts. PROMET Traffic Transp. 25, 43–53. doi:10.7307/ptt.v25i1.1246
Vasconcelos, A. L. P., Silva, A. B., and da Maia Seco, ÁJ. (2014a). Capacity of normal and turbo-roundabouts: comparative analysis. Proc. Inst. Civ. Eng. Transp. 167, 88–99. doi:10.1680/tran.12.00003
Vasconcelos, A. L. P., Silva, A., Seco, Á, Fernandes, P., and Coelho, M. (2014b). Turboroundabouts: multicriterion assessment of intersection capacity, safety, and emissions. Transp. Res. Rec. J. Transp. Res. Board 2402, 28–37. doi:10.3141/2402-04
Vasconcelos, A. L. P., Silva, A. B., Seco, Á, and Silva, J. (2012). Estimating the parameters of Cowan’s M3 headway distribution for roundabout capacity analyses. Balt. J. Road Bridge Eng. 7, 261–268. doi:10.3846/bjrbe.2012.35
Wu, N. (2001). A universal procedure for capacity determination at unsignalized (priority-controlled) intersections. Transp. Res. B Methodol 35. Available at: https://trid.trb.org/view.aspx?id=688623
Keywords: two-lane roundabout, turbo roundabout, capacity, gap acceptance theory, critical gap
Citation: Šarić A and Lovrić I (2017) Multi-lane Roundabout Capacity Evaluation. Front. Built Environ. 3:42. doi: 10.3389/fbuil.2017.00042
Received: 17 April 2017; Accepted: 04 July 2017;
Published: 31 July 2017
Edited by:
Sakdirat Kaewunruen, University of Birmingham, United KingdomReviewed by:
Serdar Dindar, University of Birmingham, United KingdomAmpol Karoonsoontawong, King Mongkut’s University of Technology Thonburi, Thailand
Copyright: © 2017 Šarić and Lovrić. This is an open-access article distributed under the terms of the Creative Commons Attribution License (CC BY). The use, distribution or reproduction in other forums is permitted, provided the original author(s) or licensor are credited and that the original publication in this journal is cited, in accordance with accepted academic practice. No use, distribution or reproduction is permitted which does not comply with these terms.
*Correspondence: Ammar Šarić, YW1tYXIuc2FyaWNAaG90bWFpbC5jb20=