 Stefan Heim1,2,3,4*
 Katrin Amunts1,2,4
 Dan Drai5
 Simon B. Eickhoff1,2,4,6 Sarah Hautvast2 Yosef Grodzinsky2,7,8
- 1 Section Structural-functional Brain Mapping, Department of Psychiatry, Psychotherapy, and Psychosomatics, Medical School, RWTH Aachen University, Aachen, Germany
- 2 Research Centre Jülich, Institute of Neuroscience and Medicine (INM-1 and INM-2), Jülich, Germany
- 3 Section Neurological Cognition Research, Department of Neurology, Medical School, RWTH Aachen University, Aachen, Germany
- 4 Jülich-Aachen Research Alliance – Translational Brain Medicine, Jülich and Aachen, Germany
- 5 School of Communication, Inter Disciplinary Center, Herzylia, Israel
- 6 Institut für Klinische Neurowissenschaften und Medizinische Psychologie, Heinrich-Heine Universität, Düsseldorf, Germany
- 7 Department of Linguistics, McGill University, Montreal, QC, Canada
- 8 Department of Neurology/Neurosurgery, McGill University, Montreal, QC, Canada
The neural bases for numerosity and language are of perennial interest. In monkeys, neural separation of numerical Estimation and numerical Comparison has been demonstrated. As linguistic and numerical knowledge can only be compared in humans, we used a new fMRI paradigm in an attempt to dissociate Estimation from Comparison, and at the same time uncover the neural relation between numerosity and language. We used complex stimuli: images depicting a proportion between quantities of blue and yellow circles were coupled with sentences containing quantifiers that described them (e.g., “most/few of the circles are yellow”). Participants verified sentences against images. Both Estimation and Comparison recruited adjacent, partially overlapping bi-hemispheric fronto-parietal regions. Additional semantic analysis of positive vs. negative quantifiers involving the interpretation of quantity and numerosity specifically recruited left area 45. The anatomical proximity between numerosity regions and those involved in semantic analysis points to subtle links between the number system and language. Results fortify the homology of Estimation and Comparison between humans and monkeys.
Introduction
No species but ours can pride itself in the possession of both mathematical and linguistic abilities. Some primates possess numerical abilities, but only we humans can talk about what we count. Are these two abilities governed by the same principles and supported by the same neural structures? Philosophers from Plato to Frege have pondered the relation between mathematical and natural languages, as these seem to share properties, having alphabets and combinatorial rules, allowing for recursion, as well as ambiguous expressions. Chomsky (1988), for instance, has speculated that “the number faculty developed as a by-product of the language faculty” (p. 169; see Changeux and Connes, 1995, for a recent similar position). In contrast to these speculations, experimental evidence, mostly from double-dissociations observed in brain-damaged patients, has suggested that neurologically, the two capacities are distinct (Dehaene and Cohen, 1997; Cohen and Dehaene, 2000; Brannon, 2005; Gelman and Butterworth, 2005).
We report an fMRI experiment that addressed the language/math question from a new angle, and helped uncover the anatomical loci of linguistic and numerical operations. Our behavioral and imaging data seem to provide a fresh perspective on this perennial debate. Guided by current models of linguistic and mathematical capacity, we separated the neural underpinnings of complex language processes from those of numerosity-related ones. Within the latter, moreover, we were successful in identifying two distinct neural systems (one for quantity estimation, the other, for comparison). This three-way distinction between neurocognitive components emerged as subjects were evaluating linguistic statements about quantity against visual scenarios. Critically, it emanated from analyses of data from a single cross-modal parametric fMRI experiment that concomitantly probed numerical cognition and language.
The current view on numerical cognition and its brain basis is rather refined (Dehaene and Cohen, 1997; Butterworth, 1999; Cantlon and Brannon, 2007), drawing on complex computational models, and on empirical results from humans and monkeys. These models parse basic arithmetical operations into distinct steps – notably estimation (the encoding of numerical size), and comparison (the calculation of numerical distance), driven by Weber’s Law, that states that the ability to perceive a minimal difference between the quantities of two stimuli is invariant across the range of possible stimulus sizes. The consequence of this law in the present context is, roughly, that the organism’s ability to compare two quantities is a function of the proportion, rather than the distance, between them (Meck and Church, 1983; Dehaene and Changeux, 1993; Verguts and Fias, 2004). Experiments on numerosity typically present a sequence of images to participants. The first image depicts a number of objects (the reference numerosity r), and is followed by other images, of which the crucial one contains the comparandum numerosity c. In most instances, r is kept constant across trials, while c is a systematically varied parameter. Typically, this sequence is not accompanied by linguistic material.
The implementation of tasks that require the estimation of r and c, and then r:c comparison, has led to the discovery of neural correlates of these two operations in the macaque brain. There, neurons in lateral intraparietal cortex (LIP) in both hemispheres that respond to a relatively broad range of numerosities were distinguished from anteriorly adjacent (VIP) and frontal neurons that code for numerical distance, namely carry out comparisons (Nieder and Miller, 2003; Piazza et al., 2004; Roitman et al., 2007). Monkeys’ numerical judgment behavior is, moreover, said to be asymmetrical, best described by Gaussian curves on a logarithmically compressed scale, whose variability is fixed across numerosities (Dehaene et al., 2003).
In humans, bilateral parietal and frontal regions modulated by numerical distance have also been identified, and shown to have similar properties: in a seminal study by Piazza et al. (2004), participants viewed a sequence of images that contained a fixed number of objects r, thereby adapting to r; the critical part then presented an image with the same objects, but whose numerosity c was parameterized. Using an fMRI adaptation paradigm (i.e., using the habituation of the fMRI signal as an indicator of repeated involvement of a region in the same kind of cognitive process), they found regions in right angular gyrus, right intraparietal sulcus (IPS), and right superior parietal lobe (SPL) that follow the relation between r and c, indicating involvement in numerical comparison: These regions present an adaptation response pattern to a numerical distance parameter (manipulated in a comparison task) that resembles monkeys’ behavioral and neural patterns.
For language to be directly related to numerical cognition, aspects of language processing that pertain to quantity would be expected to have a role in numerical cognition. Past studies have either investigated linguistic and arithmetical abilities separately Dehaene et al., 2003), or focused on the relation between number words and their denotation (Dehaene and Cohen, 1997; Cohen and Dehaene, 2001; Varley et al., 2005). Investigations into the relation between the processing of sentences about numerical relations and corresponding number-containing scenarios are few and far between (McMillan et al., 2005; Troiani et al., 2009), despite the fact that we as speakers do just this naturally and frequently, as we evaluate statements we hear (or speak) against their real-life contexts. As a result, how exactly the neural substrate for numerical calculation relates to language is not entirely clear. Our project therefore involved a rather natural task, one that required participants to relate linguistic expressions to scenarios whose analysis necessitated numerical Estimation and Comparison: the scenarios contained quantities of objects, whereas the linguistic materials were sentences with quantity denoting expressions, that is, natural language quantifiers like many, few, most, or less-than-half. Successful performance required proper parsing of the visual scenarios, as well as an analysis of sentence meaning. Our contrasts, then, involved quantifiers that differed in meaning from one another.
We probed circuits for linguistic and mathematical processing in healthy participants in an fMRI experiment whose design featured two parameters, one that served as a proxy for numerical estimation, and the other, for comparison. It also featured a linguistic contrast that was orthogonal to numerosity (Polarity, the difference between positive quantifiers like more-than-half and less-than-half), which we used to detect certain aspects of the analysis of linguistic meaning which are orthogonal to numerosity. This design enabled us to measure the BOLD response related to each of these operations separately on the same data set.
A parametric proportion paradigm (PPP henceforth) was introduced: participants were asked to verify auditory sentences about proportion against visual scenarios that contained two quantities of objects, and do so under time pressure. The relevant meaning representations were created through the inclusion of a proportional (or degree) quantifier in each sentence, which was either positive, e.g., many of the circles are blue, or negative, e.g., few of the circles are blue. Each sentence was immediately followed by a visual image with an array of 50 quasi-randomly positioned circles. While the number of circles was fixed at 50 (a numerosity chosen to avoid subitizing), their radii were varied, and they were divided into two contiguous clusters of blue and yellow circles. The truth or falsity of each sentence depended on the meaning of the sentence and its match to the blue/yellow proportion (Figure 1A). To verify the sentence above, for example, participants had to first estimate c, the number of circles in the target color mentioned in the sentence (here blue), and r, the number of circles in the other color (here yellow). Next, they had to compare c to r. They then had to judge the truth-value of the sentence against the representation of the scenario (semantic truth-value judgment, SVJT). A sentence was deemed true just in case if c > r. Alternatively, as r + c = 50 in every case, a comparison of c to 25 = 50/2 would also suffice, as they sentence is true when c > 25. Either way, the successful completion of the task in a limited time window required both estimation and comparison. BOLD response as well as reaction time (RT) were measured.
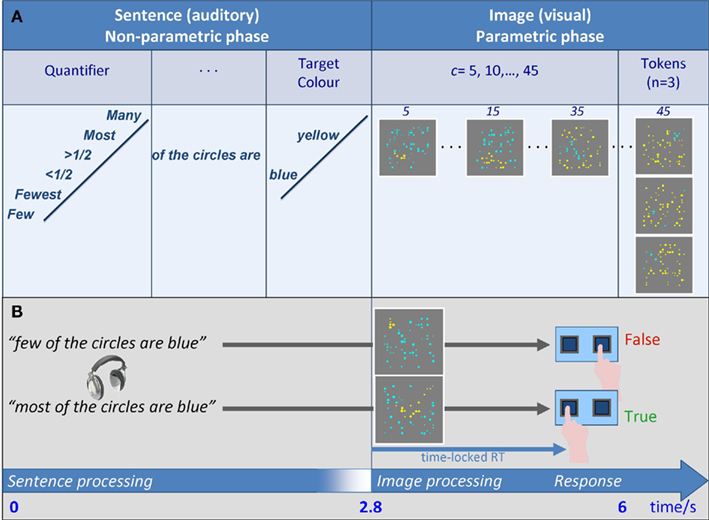
Figure 1. Experimental design. (A) Overall design: Auditory sentence stimuli were of the form “Quantifier of the circles are color,” where Quantifier was one of six proportional quantifiers, and color was blue or yellow. Each of the 12 resulting sentences was followed by a visual array of a fixed numerosity T = 50 blue and yellow circles, in which blue/yellow ratio was varied parametrically: the comparandum numerosity c of circles in the TarCol was a parameter, taking the values 5, 10, …, 45. As T was fixed, the numerosity of circles in the other color r varied accordingly (45, 40, …, 5 out of 50). Three different tokens were generated for each proportion, and combined with the sentences. (B) Time course of a trial: The auditory part was 2.8 s long (sentence duration was ≤2.8 s). Subsequently, an image was presented (1.2 s). Participants were asked to make a truth-value judgment by a button press. RTs were time-locked to the visual phase of the trial, where overall trial duration was 6 s. Speeded responses were mostly <2 s, which enabled a short rest period before the next trial began.
The PPP design systematically varied the proportion between the colors across scenarios. Participants thus judged each sentence against eight different scenarios (created in Mathematica™), each with a different blue/yellow proportion (Figure 1B, Properties of the Images and How They Were Created in Supplementary Material). The manipulation of c (= Target Color, TarCol) modulated RT: a change in c it coupled to a change in r (because c + r = 50), and affects the numerical distance between c and r; this, in turn, affects the difficulty of the comparison component of the task – the closer c is to r (or to 25), the more difficult the task becomes, and RT is elevated relative to trials in which c is distant from r (or from 25). The PPP used sentences conveyed weak statements that are true in multiple scenarios, and so truth-value was kept constant across several values of c. Moreover, they were contrasted along the linguistic dimension of Polarity, as some contained negative quantifiers (few) whereas others were positive (many).
This design allows correlating the BOLD response separately with two parameters, and one contrast:
• The Estimation parameter c (i.e., Number of elements of Target Color): an increase in c forces the estimation of a larger numerosity. Changing c should incrementally tax the process of coding for numerical size, and activate brain regions that support it. Thus c can be used as a proxy to Estimation, and to identify regions involved in numerical estimation.
• The Comparison parameter RT: The closer c gets to r, the more difficult the comparison becomes, affecting RT (Figure 2). RT can therefore be used as an index of numerical comparison. Individual trial RTs were therefore used to identify regions involved in the comparison between c and r (or c and 25).
• The Semantic Polarity contrast: linguistic stimuli were divided along a clear non-numerical axis that related to their meaning – Polarity, characterized by whether or not the meaning representation of the quantifier contained a negation (cf. The Meaning of the Proportional Quantifiers Used in Supplementary Material for details). Half of the quantifiers were positive (many, most, more-than-half), and the other half negative (few, fewest, less-than-half). Contrasting these two types revealed brain regions involved in the linguistic analysis of quantifier meaning during the PPP task. Crucially, this contrast is orthogonal to both Estimation and Comparison, ensuring that numerosity circuits are excluded.
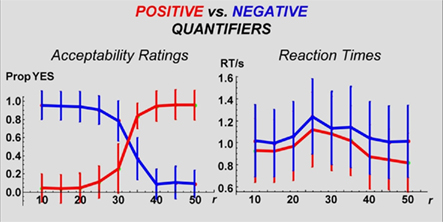
Figure 2. Response accuracy and response time: Accuracy: Probabilities of “YES” responses by TarCol proportion per quantifier. NB: Quantifiers are clustered by Polarity (positive vs. negative). In both cases, a step-function is evident. Moreover, positive and negative quantifiers reveal a mirrored pattern – an image that makes a sentence with a positive quantifier true falsifies its negative counterpart. RT: Mean RTs by TarCol proportion per quantifier. NB: Quantifiers are clustered by Polarity. Negative quantifiers produce longer RTs (for statistical analysis see text). In all cases, a non-monotonic function is evident (see The Mapping Between the Current PPP and Standard Numerosity Experiments in Supplementary Material for mathematical details).
The experimental goal, then, was to obtain a three-way dissociation within the same fMRI data set. This goal was accomplished by identifying voxels responding to the one or the other of the uncorrelated parameters (c the monotonic estimation parameter, and RT, the non-monotonic comparison parameter), or to the semantic contrast.
The present design differs from previous numerosity experiments, and experiments that used linguistic stimuli to study numerical cognition (Cohen and Dehaene, 2001; McMillan et al., 2005; Troiani et al., 2009) by the following major aspects: first, we used two (c, RT) instead of a single parameter; second, a variable comparandum c is typically compared to a fixed reference numerosity r, and so r + c is not constant. As we used scenarios that were suited to express proportion, r and c were related, such that r + c = 50. Our paradigm and the standard one, however, are inter-translatable, and the relationship between them is formally well-defined (see The Mapping Between the Current PPP and Standard Numerosity Experiments in Supplementary Material for a mathematical translation between the two paradigms). Finally, the language materials included six different proportion or degree quantifiers – words like many, most, and few – that (1) denote relations between cardinalities of sets (as opposed to specific numbers), (2) that presuppose both estimation and comparison, and (3) that are weak, in that their truth-value is preserved across multiple scenarios. This last property makes them suitable to parametric designs, because it allows a sentence that contains such a quantifier to keep its truth-value constant across different numerosities (Table 1). We used several quantifiers, distinguished along the Polarity dimension (positive vs. negative), which enabled us to correlate the BOLD signal with a contrast that is purely linguistic, and does not bear on numerosity, even if both sides of this contrast come into contact with numerosity-related scenarios (see Materials and Methods, and The Meaning of the Proportional Quantifiers Used in Supplementary Material for further discussion).
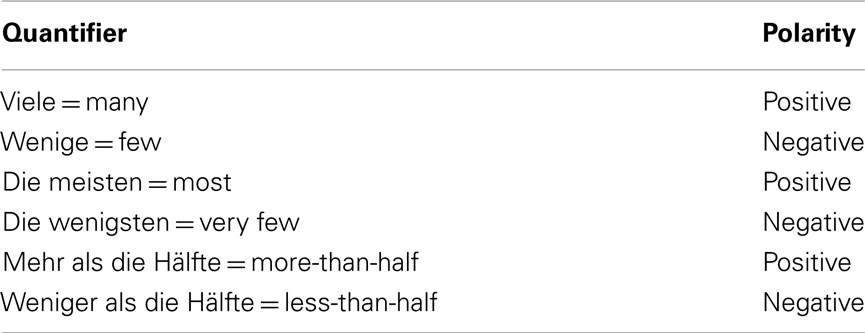
Table 1. German quantifiers (with English translations) used in the study.
Materials and Methods
All procedures were approved by the ethics committee of the Medical School at RWTH Aachen University.
Materials and Task
Participants performed a truth-value judgment task, indicating by pressing the left or right response button whether an auditory sentence with a quantified subject matched a subsequently presented visual array of blue and yellow circles. Each sentence was presented 24 times, with one picture at a time. The 24 repetitions result from systematically combining each sentence with three different pictures for each of the eight different proportions of blue/yellow circles (see below). Stimulus presentation was controlled by a computer placed in the control room using Presentation 11.0 software (Neurobehavioral Systems, Albany, CA, USA), and each participant received a different pseudo-randomization of sentence–picture pairings.
Stimuli were constructed of auditory sentence–visual image pairs (cf. Figure 1). Images depicted a scenario with 50 circles, divided unequally between yellow and blue, with the constraint that each set of colored circles form a cluster. The six experimental conditions contained sentences that were built out of well-defined pieces, all containing a proportional quantifier that composed with a restrictor noun (Kreise = circles, in our case) to form a generalized quantifier. This partitive expression (e.g., Viele der Kreise = many of the circles) was the subject of a copular sentence with a color predicate adjective (blau = blue or gelb = yellow – the Target Color, resulting in sentences such as Viele die Kreise sind gelb = many of the circles are yellow (Milsark, 1977; Diesing, 1992; see The Mapping Between the Current PPP and Standard Numerosity Experiments in Supplementary Material).
The trial schema (Figure 1) involved the presentation of the sound file containing one of the stimulus sentences. Sound files had a duration of below 2.8 s. At a trial time of 2.8 s after the onset of the sound file, the visual scenario containing blue and yellow circles was presented. The subjects’ responses were time-locked to the onset of the visual scenario. Each trial had an overall duration of 6 s, after which time the next trial started.
fMRI Data Acquisition
The fMRI experiment was carried out on a 3-T Trio scanner (Siemens, Erlangen, Germany). A standard birdcage head coil was used with foam paddings to reduce head motion. The functional data were recorded from 40 axial slices using a gradient-echo EPI sequence with echo time (TE) = 30 ms, flip angle = 90°, and repetition time (TR) = 3 s. The field of view (FOV) was 256 mm, with an in-plane resolution of 3 mm × 3 mm. The slice thickness was 3 mm with an inter-slice gap of 1 mm. A time series containing a total of 684 images was recorded, amounting to a total functional scanning time of 34 min.
fMRI Data Analysis
Pre-processing
Data analysis was performed using SPM5 (Wellcome Department of Cognitive Neurology, UK) running on MATLAB 7 (The Mathworks Inc., Natick, MA, USA). Pre-processing involved the standard procedures of realignment to the mean image of the EPI time series, normalization of functional data to the MNI template using the unified segmentation procedure provided in SPM5, spatial smoothing with a Gaussian kernel of 8 mm FWHM, and highpass filtering at 1/128 Hz in order to correct for slow drifts in the BOLD signal.
Statistical analyses
Each of the different processing steps involved in quantification, i.e., Composition, Estimation, and Comparison, was addressed by its own event-related analysis (note that the differential analysis of the auditory phase vs. the visual phase in a trial is enabled by the temporal spacing of the onset times of more than 1 s: Boynton et al., 1996; Dale and Buckner, 1997). Moreover, subsequent analysis of Semantic Structure was performed. Data from individual first level analyses were then entered into random-effects group analyses at the second level using the flexible factorial option for repeated-measures designs in SPM5.
1. In a first analysis for Composition, the set of brain regions was assessed which was activated while listening to the auditory sentence that contained the quantifying expression and building up a semantic representation of the according scenario (data type: beta estimates of BOLD amplitude during the auditory presentation phase).
2. The next, parametric, analysis was run for Estimation, i.e., coding the circles in the TarCol for numerical size (data type: beta estimates of the (monotonically increasing) parametric modulator of the amount of circles of the TarCol during the visual presentation phase).
3. The third, again parametric, analysis was done for Comparison, i.e., coding for numerical distance between |c| and its complement color (data type: beta estimates of the (non-monotonic) RT regressor during the visual presentation phase) and comparing it to the mental representation created during Composition. To this end, we identified voxels which (1) parametrically responded to the RT regressor and (2) were contained in the Composition phase during which the mental representation was first generated. The resulting Comparison effect was thus calculated by a conjunction analysis of second level T-statistic maps obtained from Composition and the RT parameter. Since the effect for Composition was obtained in the auditory domain and that for the RT regressor in the visual domain, the conjunction analysis reveals such areas that are involved in a-modal processing of semantic representations not solely related to the auditory sentence or the visual scenario. This type of analysis is valid despite the different nature of the raw data, since it is calculated on the T-statistic maps which are all at the same (T) scale.
Composition. Composition (i.e., creation of a semantic representation) refers to the first, auditory phase of the trial when subjects listened to a sentence containing a quantifier expression. There were six conditions, i.e., one for each quantifier.
1. At the first level, an event-related general linear model (GLM) analysis was performed. The duration for each condition was set to 2.8 s, beginning with sentence-onset and covering the entire auditory phase. Each condition was convolved with the canonical hemodynamic response function (HRF) and its first temporal derivative. For subsequent ANOVA at the second level, the beta weights for the six Composition conditions were contrasted against the implicit resting baseline by calculating contrasts of the type ‘1 0 0 0 0 0’.
2. At the second (group) level, the random-effects repeated-measures 1 × 6 ANOVA was calculated in order to obtain an T-statistic map of the main effect for Composition as contrast of type ‘1 1 1 1 1 1’, reported at an uncorrected threshold of P < 0.001. Since activation during listening was not contrasted against some high-level baseline, but only against rest, this analysis is the most permissive, including all regions potentially (but not necessarily) involved in building up a semantic expectation of the upcoming visual array.
Estimation. Estimation refers to the visual phase in a trial when the display containing yellow and blue circles was presented after the subject listened to the sentence in the auditory Composition phase. In particular, the Estimation effect is operationalized as linear increase in BOLD signal with linear increase of the number of circles of the TarCol.
1. At the first level, the parametric increase of the BOLD signal with increasing number of circles of the respective color-of-mention was assessed separately for each quantifier on a trial-by-trial basis. The event-related GLM analysis for individual data sets involved 12 (2 × 6) orthogonal conditions, one for each color-of-mention (2) and quantifier (6). For each condition, a stick function (i.e., duration = 0, onset time = trial onset) was convolved with a canonical HRF and its first temporal derivative. Stick functions with duration = 0 were chosen in order to analyze the initial matching of the visual scenario with the mental representation generated in the auditory Composition phase before, and to address this process in the GLM independently of the actual duration of this matching process (this latter aspect relates to processing difficulty and is addressed with the analysis described next).
2. In order to model the parametric BOLD increase as a function of the number of circles (i.e., the data relevant for subsequent analysis), the percentage of circles in the TarCol was entered as monotonic, continuous regressor of interest into the model on a trial-by-trial basis separately for each condition. For subsequent ANOVA at the second level, we were interested in the parametric BOLD increase for each quantifier independent of the actual color (blue, yellow). Therefore, the beta weights for the two regressors (blue, yellow) for the same quantifier were collapsed pair-wise over colors, resulting in one average beta estimate per quantifier and subject. This was achieved using contrast vectors of the type ‘1 1 0 0 0 0 0 0 0 0 0 0’ at the first level.
3. At the second level, these individual contrast images were submitted to a random-effects analysis, realized as a repeated-measures 1 × 6 ANOVA. In order to assess which brain regions uniformly responded with increasing activation to increasing numerosity, the T-statistic map for main contrast for Estimation was calculated as contrast of type ‘1 1 1 1 1 1’, reported at a threshold of P < 0.001 (uncorrected).
Comparison. Comparison is a process that calculates the numerical distance between the number of TarCol circles obtained during Estimation and its complement (the non-TarCol color). The matching between the outcome of the Comparison process and the meaning of the sentence will dictate the decision (e.g., 1/2 in the case of “more-than-half of the circles are blue”) created during Composition on the other hand. As outlined in the Results section above, the processing of this numerical distance becomes the more difficult, the smaller this distance is. The difficulty, in turn, is represented in the RTs, with high RTs indicating high difficulty of Comparison1.
Thus, the Comparison effects mainly reflect regions parametrically responding to increasing RT. Technically, identification of the Comparison was achieved as follows.
1. At the first level, a stick function (duration = 0) for each of the six conditions (one for each quantifier), was convolved with a canonical HRF and its first temporal derivative.
2. Additionally, for each trial, the RT for the STVJ task was entered as regressor of interest for the corresponding condition on a trial-by-trial basis. These regressors represent the parametric, non-monotonic increase of the BOLD response reflecting increase of processing difficulty. For subsequent ANOVA at the second level, the beta weights for each of the six parametric regressors of processing difficulty were contrasted against the implicit resting baseline in order to obtain T-statistic maps by calculating contrasts of the type ‘1 0 0 0 0 0’.
3. At the second level, these individual contrast images were submitted to a random-effects analysis, realized again as a repeated-measures 1 × 6 ANOVA. The T-statistic map for the main effect of the parametric RT regressor was computed as a contrast of type ‘1 1 1 1 1 1’, reported at an uncorrected threshold of P < 0.001.
4. In order to identify those voxels that were commonly involved in semantic Composition and responded to semantic processing difficulty (RT regressor), the T-statistic maps (at P < 0.001 uncorrected) obtained for the main effects for (auditory) Composition and (visual) Comparison part were submitted to a conjunction analysis in order to identify brain regions involved in a-modal semantic processing of quantities. We will henceforth refer to this conjunction analysis as the effect of Comparison.
Semantic structure. We used a set of quantifiers for the present study that we classified along the semantic dimension of Polarity, the absence or presence of linguistic negation. Negation is absent in positive quantifiers (many, most, more-than-half), but present in negative ones (few, fewest, less-than-half) quantifiers.
Effects of Semantic Structure – Polarity – can be examined in all three sets of parameters, i.e., Composition (the auditory sentence conditions), Estimation (the monotonic parameter of numerosity), and Comparison (the non-monotonic parameter of RTs). Reliability and robustness of effects of Semantic Polarity can thus be assumed if they are present in a given voxel not only for one but for all three parameter sets. Accordingly, the same contrast for Polarity was computed in each of the three parameter sets. Subsequently, the three T-statistic maps for Polarity effects (each at P < 0.05, k = 100 voxels) were submitted to a conjunction analysis revealing those voxels surviving this statistical threshold in all three contrasts. This conjunction analysis thus effects a conservative significance threshold of P < 0.000125.
Localization of effects with cytoarchitectonic probability maps
For the anatomical localization of the activations we used cytoarchitectonic probability maps, which are based on an observer-independent analysis of the cytoarchitecture in a sample of 10 post-mortem brains (Zilles et al., 2002; Schleicher et al., 2005). They provide information about the location and variability of cortical regions in standard MNI reference space. For the assignment of MNI coordinates to the cytoarchitectonically defined regions we used the SPM Anatomy Toolbox (Eickhoff et al., 2005) available with all published cytoarchitectonic probability maps and references from http://www.fz-juelich.de/inm/inm-1/spm_anatomy_toolbox
Results
Behavioral Data
The following behavioral results were found: First, participants’ responses (truth-value judgments) presented a step-function along the “yes–no” axis (where “yes” indicates a sentence-scenario match, Figure 2), indicating high overall performance. For all six quantifier conditions, the Estimation parameter c (the number of circles in the Target Color) was highly correlated with mean response type (yes/no; |r| > 0.8, P < 0.001 in every instance, with quantifiers’ polarity determining sign; Table 4). Second, mean RTs, when plotted against c in the images, formed non-monotonic functions, with maxima around the middle (n = 25, Figure 2). The correlation between the c and mean RT was low (not significant for four quantifier conditions, and significant but low (i.e., r < 0.30) for more-than-half and many; Table 4). Third, mean response type (yes/no) and RT were uncorrelated for three quantifier conditions; correlation for the other three conditions was significant, but low in every instance (Table 4).
Brain Regions Activated in Estimation as Compared to Comparison
Brain regions responsive to Estimation were identified via the monotonic parameter c, which varied incrementally (c = 5, 10,…40, 45) and was correlated with the BOLD fMRI signal. Effects of this parametric analysis (at Puncorr < 0.001) were observed in both hemispheres, mainly in parietal and frontal regions including bilateral inferior parietal lobule (IPL), bilateral IPS, left SPL, left inferior frontal and right middle frontal gyrus (IFG; MFG), and the supplementary motor area (SMA; Figure 3, Table 2 for a full list). The cytoarchitectonic probabilistic brain atlas (Amunts et al., 2004) implemented in the SPM Anatomy toolbox (Eickhoff et al., 2005) revealed that parietal effects overlapped with areas hIP1-3 of the IPS (Choi et al., 2006; Scheperjans et al., 2008), and areas PGa, PFm, PF of the IPL (Caspers et al., 2006). Frontal effects extended to Broca’s region (areas 44 and 45; Amunts et al., 1999) and area 47 (Talairach daemon: http://www.nitrc.org/projects/tal-daemon; see also Amunts et al., 2010) in the IFG as well as premotor area 6 in the precentral gyrus (Geyer, 2003).
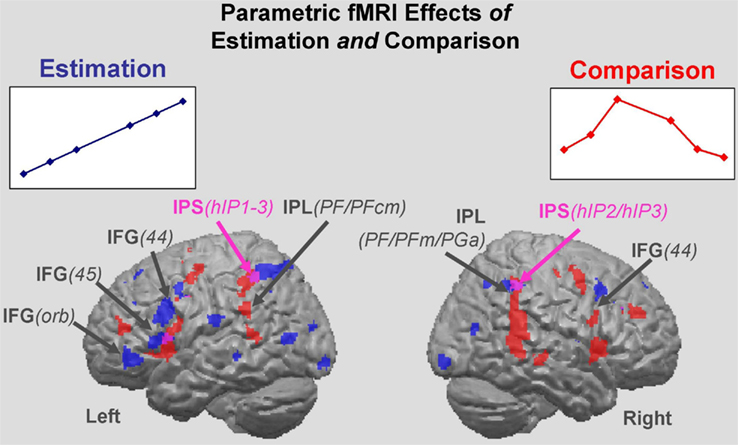
Figure 3. Estimation and Comparison regions. Parametric effects for the Estimation of the numerosity of circles in target color (blue areas), and for the Comparison as manifest through RT (red areas). All effects are main effects over the six quantifiers. Estimation clusters: brain regions in which the BOLD signal intensity co-varies with the linearly increasing number of circles in target color (F-test). Comparison clusters: brain regions in which the BOLD signal intensity co-varies with RT – a reflection of processing difficulty. Regions commonly tapped by the Estimation and Comparison parameters are shown in purple (red plus blue). IPS, intraparietal sulcus; IFG, inferior frontal gyrus; IFG/orb, pars orbitalis of the IFG.
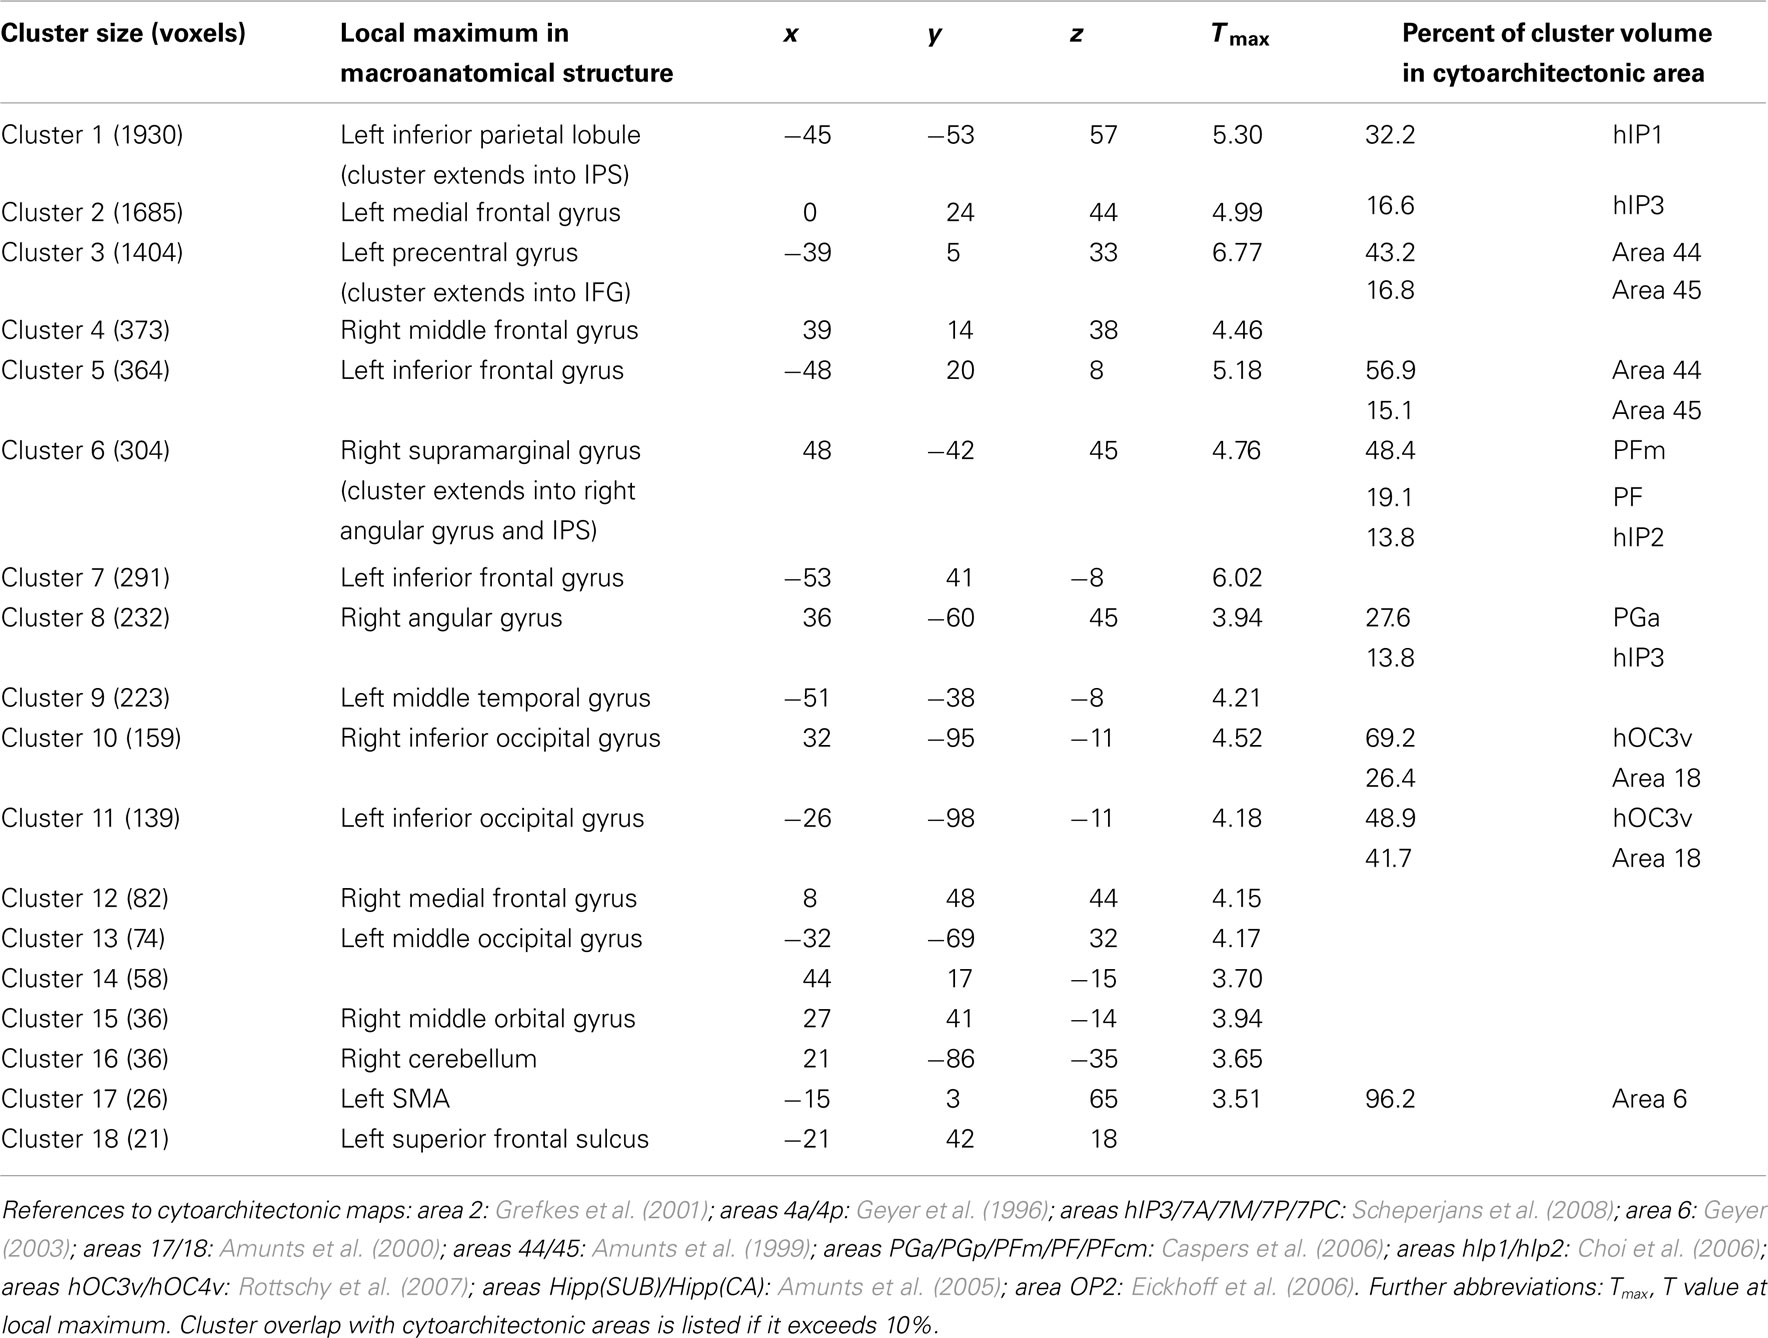
Table 2. Main clusters in which signal increased as a function of parametric increase of stimation (number of circles of the mentioned color), with their cytoarchitectonic reference.
Regions responsive to Comparison were identified via the RT parameter. It varied non-monotonically and was made a regressor for the BOLD fMRI response Responses to Comparison also involved a bilateral fronto-parietal set of regions. Parietal effects included bilateral IPL, bilateral IPS, and left SPL. Frontal regions comprised bilateral IFG and SMA. In addition, the putamen was activated (Figure 3; Table 3 for a full list). Cytoarchitectonic probability maps revealed the involvement of frontal areas 44, 6, and 4a, and parietal areas hIP1-3 and PF, PFm, and PFcm.
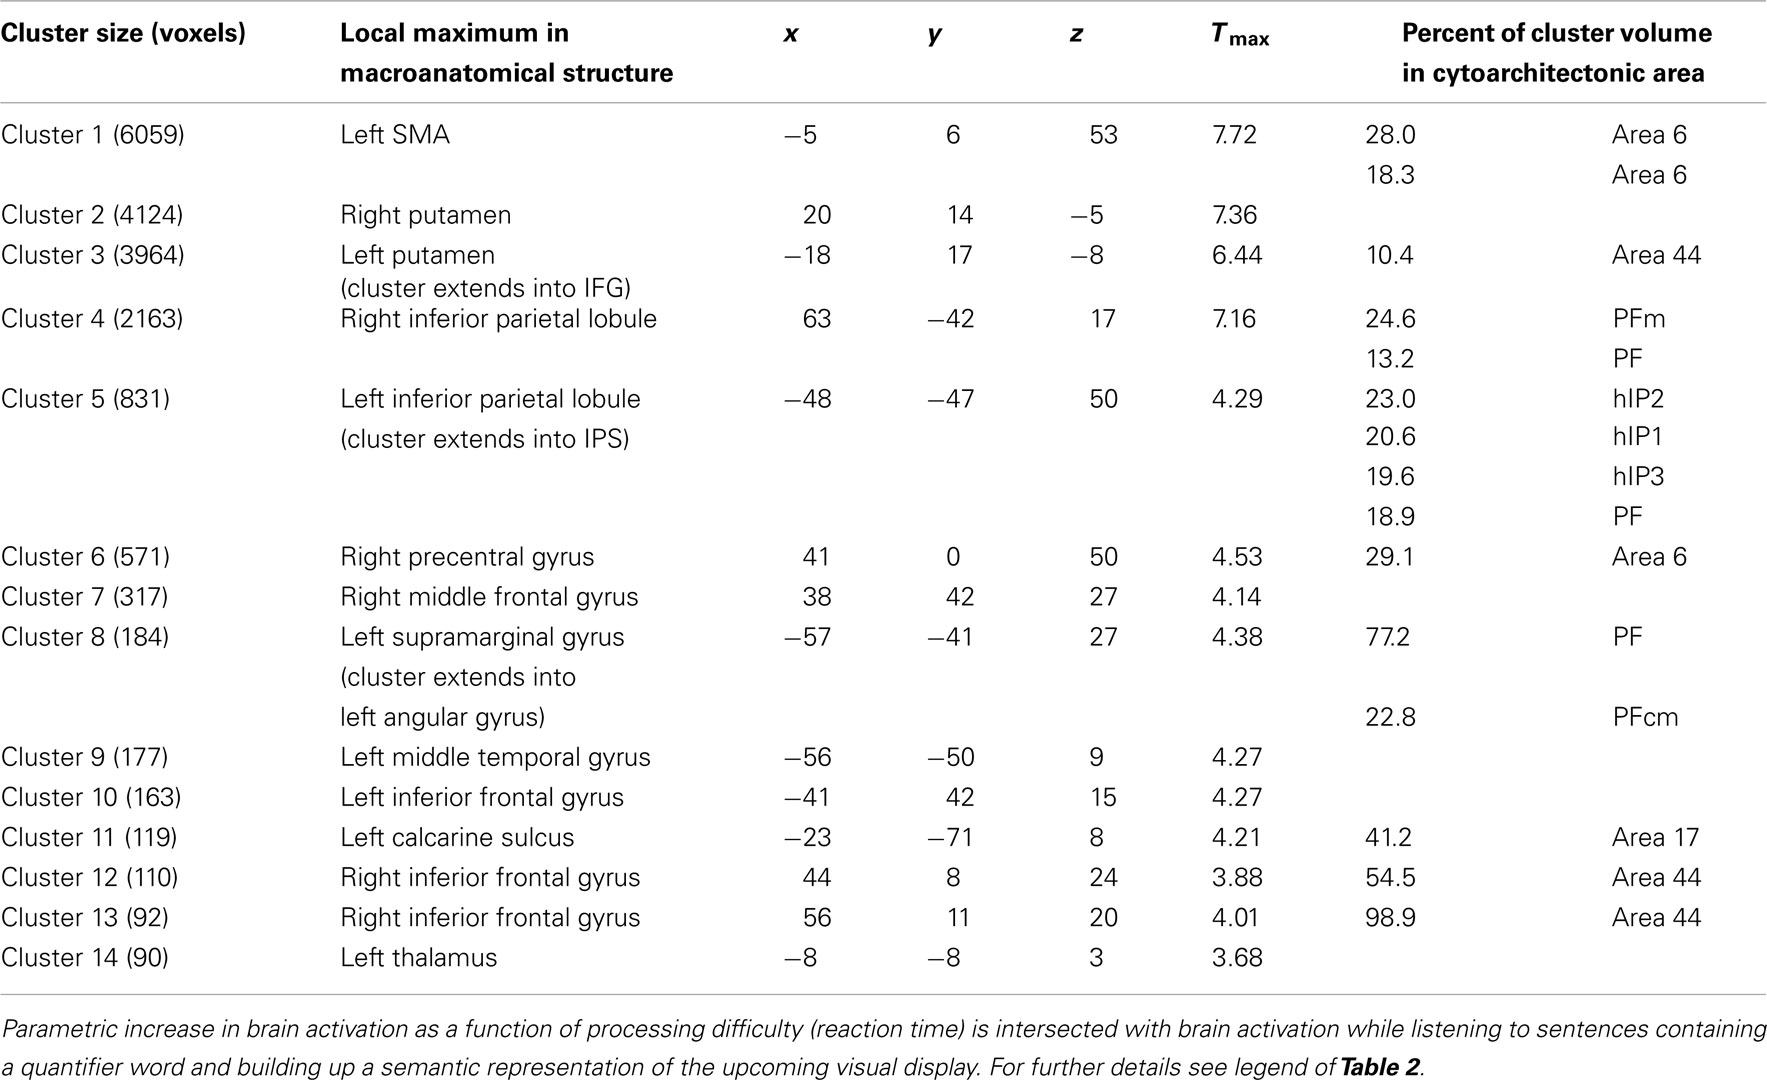
Table 3. Conjunction analysis representing brain areas involved in comparison (abstract representation of numerosity).
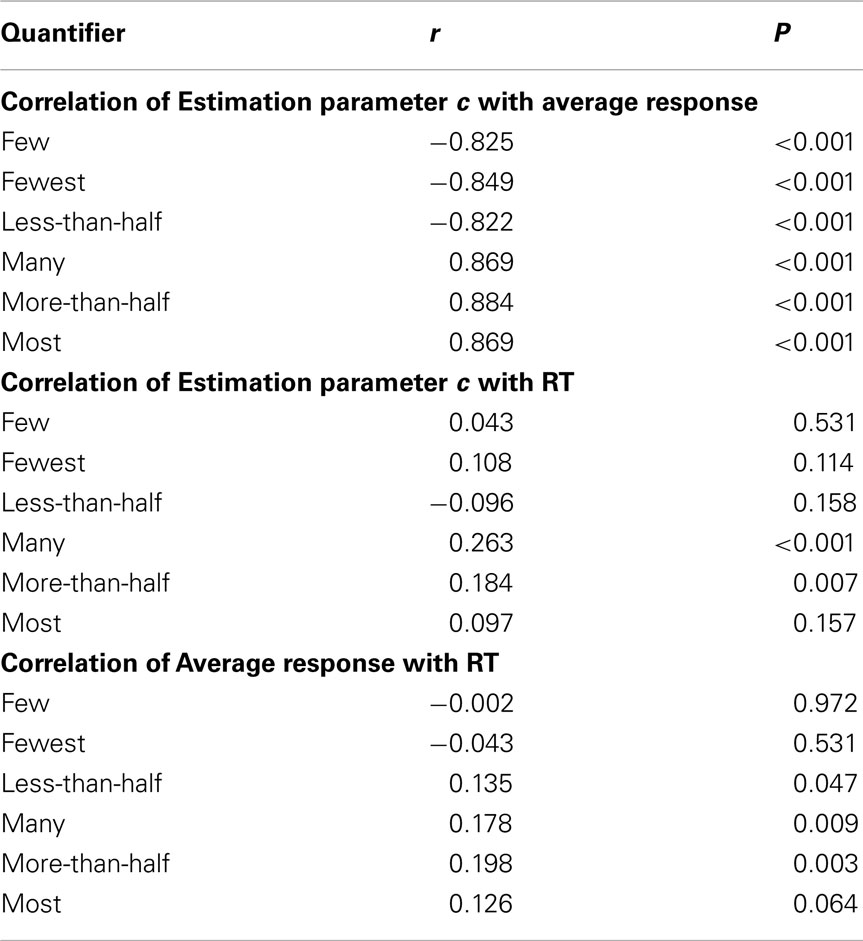
Table 4. Correlations between the Estimation parameter c, average response rate in the STVJ task, and corresponding RT for each quantifier.
Although both the Estimation effect and the Comparison effect recruited fronto-parietal regions, they overlapped only in part having centroids that were separate in each region (Figure 3). In the inferior parietal lobule, the Comparison effect was located anterior–inferior to the Estimation effect. Both effects involved areas in the IPS (hIP1-3) and inferior parietal lobule (PFm, PF). However, whereas Comparison uniquely involved area PFcm, Estimation recruited inferior parietal area PGa as well as superior parietal areas 7A and 7PC, allowing the cytoarchitectonic distinction between Estimation and Comparison regions within the parietal cortex. In the frontal cortex, a similar pattern of effects was observed with Estimation recruiting more anterior (and slightly inferior) aspects of the IFG, precentral gyrus, and SMA than Comparison. These were mostly distinct from the more posterior Comparison effects at the pre-defined significance threshold. Again, Estimation and Comparison conjointly recruited only some areas (i.e., 44 and 6). Interestingly, however, the Comparison effect also extended more posteriorly, covering parts of motor area 4a, whereas the Estimation effect reached more anteriorly into area 45.
Semantic Polarity Contrast
We compared the fMRI effect of Polarity (negative > positive quantifiers) in all three sets of parameters, i.e., for the non-monotonic Comparison parameter, for the monotonic Estimation parameter, and also for the BOLD signal in the auditory phase of the trial when the quantifier sentence was presented. Consistency of a Polarity effect in all three parameter sets was tested with a conjunction analysis revealing only voxels responding (at P < 0.05; extent k = 100 voxels) likewise in all three parameter sets (i.e., an overall significance level of P < 0.000125; see Supplementary Material for details). The most prominent effect was in the left inferior frontal gyrus (cytoarchitectonic area 45; Figure 4).
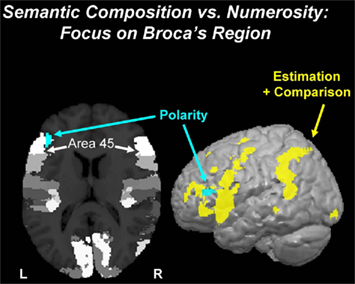
Figure 4. Semantics of quantification: polarity. The effect of Polarity (negative vs. positive quantifiers; turquoise blob) was observed in Broca’s region in the left inferior frontal gyrus. The effect, which is clearly non-numeric but semantic in nature, overlaps with cytoarchitectonic area 45 (white). The surface rendering shows that this Polarity effect is predominant in the left inferior frontal cortex, whereas the numerosity network (yellow) comprising both areas for Estimation and Comparison (from Figure 3) taps widely into a fronto-parietal network.
Discussion
The separation between semantic Polarity, numerical Estimation, and numerical Comparison was achieved via decisions that participants made on visual scenarios in which numerosity (and subsequently proportion) was parameterized. These scenarios were presented in contrasting linguistic contexts. Though embedded in a tightly controlled design, the PPP was implemented in a rather naturalistic verification task: we verify sentences daily, in communicative acts that require us to answer a yes/no question. These can range from the most mundane topics (Are you wearing a clean shirt?) to complex ones that contain quantifiers (Is every man in the room wearing a tie?). We also engage in verification when we evaluate statements, just like in the PPP task (Most of the paintings in this gallery are by Lucian Freud). The choice of proportional quantifiers, whose calculation requires both Estimation and Comparison, helped in keeping the probing method constant while systematically varying both the numerosities and task difficulty so as to allow for the bi-parametric analysis through the PPP.
There are two novel aspects here: First, these data were obtained for the first time from the same set of subjects in a single study, instead of merging together disparate studies of different scopes and quality. Second, and most importantly, it is the spatial relation of the semantic Polarity regions to the arithmetical parts, exposed through the parametric analyses of the PPP’s Proportion and RT parameters that served as proxies for Estimation and Comparison, respectively. Not only were these two neurocognitive components successfully separated in humans for the first time on the same data set (and in keeping with earlier findings – Piazza et al., 2004; Cohen Kadosh et al., 2005 – and sketches – Dehaene et al., 2003), but also, their spatial relation to activations during semantic analysis was demonstrated: Bilateral parietal regions were shown to be entrusted with numerical Estimation (via the c parameter), and adjacent regions on the opposite side of the IPS that support numerical Comparison (via the RT parameter, uncorrelated with the previous one). A new picture of a processing sequence along the “dorsal stream” seems to be emerging. The original notion of the dorsal stream was that of “where” pathway in visual perception, relevant for localizing objects in space. The concept of a functional processing pathway connecting occipito-temporal brain regions to the frontal cortex via the parietal lobe was supported by an anatomical connectivity study (Caspers et al., 2011). In this study, analogies between white matter tracts in humans and different kinds of monkeys were established. Interestingly, though, the existence of such anatomical connectivity does not imply information about the role of the dorsal stream in cognitive processing. A recent hypothesis (Friederici et al., 2012) relates the maturation of the dorsal stream to linguistic, and in particular syntactic, development from childhood to adulthood. Parallel to that notion, research in the field of numerosity processing (Dehaene et al., 2003) suggested a functional parcelation within the parietal aspect of the dorsal stream: (1) The angular gyrus is regarded as a region for manipulation of verbal number representations. (2) The horizontal aspect of the IPS is thought to house the mental number line. (3) The superior parietal cortex, finally, might relate to attentional processing when orientation along the mental number line is concerned.
Our study relates to the hypothesis by Dehaene et al. (2003) in that it provides an empirical basis for a bi- (or even tri-)partition of the parietal aspect of the dorsal stream, which was obtained with the same set of participants in the same experimental session. Regions for numerical Estimation and Comparison were found, which anatomically correspond to the angular and SPL regions referred to by Dehaene et al. (2003) and which are indeed separated by the IPS. Moreover, while the present numerosity results are consistent with similar ones from the macaque (Nieder and Miller, 2003; Roitman et al., 2007; Piazza and Izard, 2009; Caspers et al., 2011), our data, obtained from humans instead of animals, for the first time establish a clear connection to linguistic analysis of quantity, which builds upon and extends previous findings: Whereas a fronto-parietal network emerges for Estimation and Comparison, linguistic–semantic analysis is most prominent in the left inferior frontal cortex. Taken together, our data characterize processing along the dorsal stream from inferior parietal to inferior frontal regions when numerical processing is linked to linguistic–semantic processing. With respect to the hypothesis by Friederici et al. (2012), the present study may suggest that the dorsal stream is indeed involved in linguistic processing. However, over and above its supposed role for the emergence of syntactic abilities, our data suggest its additional importance for the transformation from visual percepts of numerosities into cognitive and linguistic formats. Interestingly, this account parallels the syntax hypothesis in so far as it stresses the difference between monkey and man with respect to linguistic abilities.
We thus found a potential human/monkey homology for successive steps of numerosity assessment, but moreover, established a direct connection to language. At the same time, we provided evidence for the neural modularity of language and arithmetic, revealed through a task that matches linguistic representations with numerical ones. Such matching has been used before to distinguish numbers from numerosities (Cohen and Dehaene, 2001), and in the context of previous work on quantification (McMillan et al., 2005; Troiani et al., 2009). Our contribution, supporting the modularity of language and arithmetic, stems from the fact that the task we used recruits not only lexical or sentential, but also complex compositional, resources, thereby better approximating the much discussed Chomsky’s “mental organ for language.” Whereas parietal regions were involved only in arithmetical but not semantic analysis, frontal regions, by contrast, appear to be involved in both. This pattern suggests that the left inferior frontal cortex contributes to the evaluation of the numerical representations provided in the parietal regions. This is consistent with the fact that in the macaque brain, number-selective neurons (Estimation) in inferior frontal cortex respond later than number-sensitive (Comparison) parietal neurons (Piazza and Izard, 2009). This temporal delay suggests an order, whereby frontal modules evaluate the output from parietal modules. In humans, this frontal contribution relates to semantic structure and may thus additionally be linked to linguistic processing.
Interestingly, functional division between Estimation and Comparison similar to that in parietal cortex was also found in both frontal lobes. Likewise, the semantic Polarity analysis was prominent in the left frontal lobe in area 45. Evidence for frontal involvement in numerical cognition has been available (Piazza et al., 2007), but the present results are surprising, as they seem to suggest commonalities in the functional organization between the inferior frontal cortex and the peri-IPS regions. McMillan et al. (2005), who studied the relation between natural language quantifiers and numerosity, have argued for a functional distinction, such that frontal regions house working memory, and parietal ones are entrusted with knowledge of numbers. The present study demonstrated the involvement of both frontal and parietal cortex areas likewise in response to Estimation and Comparison, even thought these processes may require working memory resources to different extents. Thus, the present data provide no evidence in support of the hypothesis by McMillan et al. (2005). Moreover, their distinction that was made with respect to the underlying anatomy, however, is possibly not fine-grained enough. Given the significant architectonic difference between areas 44 and 45 (involved in the Comparison network) on the one hand, and Brodmann’s area 47 (involved in the Estimation network) on the other hand (Amunts et al., 2010), it seems difficult to maintain that all frontal clusters uniformly support the same function, be it working memory or other, during numeric cognition. Certainly, there is a wealth of evidence for structural and functional connectivity between anterior IPS areas and ventral–posterior inferior frontal cortex (Uddin et al., 2010; Caspers et al., 2011; Mars et al., 2011). But whether these really involve working memory loops (Vigneau et al., 2011), or rather a house a sequential evaluation algorithm for the evaluation of previously estimated numerosities, as proposed here on the basis of a well-controlled experiment, will be the objectives of future research of the underlying structural and functional connectivity. The significance of this work, then, is in exposing a rich array of regions that provide a rare window into the intriguingly complex neural system that handles the flow of information between neural substrates for linguistic and numerical cognition.
Conflict of Interest Statement
The authors declare that the research was conducted in the absence of any commercial or financial relationships that could be construed as a potential conflict of interest.
Acknowledgments
We are grateful to Danny Fox, Israel Nelken, Yonatan Loewenstein, Lew Shapiro, and Michael Wagner for their incisive and helpful comments. Furthermore, we wish to thank Peter Pieperhoff, Berhard Schwarz, and Andrea Santi for advice on methodology. Partial support for this project was provided by an Alexander von Humboldt Foundation Research Award (Yosef Grodzinsky) and by NIH (grant #00094), as well as SSHRC (standard grant #410-2009-0431) and Canada Research Chairs (Yosef Grodzinsky).
Supplementary Material
The Supplementary Material for this article can be found online at http://www.frontiersin.org/Evolutionary_Neuroscience/10.3389/fnevo.2012.00004/abstract
Supplement S1. Properties of the images and how they were created.
Supplement S2. The mapping between the current PPP and standard numerosity experiments.
Supplement S3. The meaning of the proportional quantifiers used.
Supplement S4. Correlations between the proportion parameter c, average response rate in the STVJ task, and corresponding RT for each quantifier.
Footnote
- ^In order to fully appreciate the effects of the monotonic regressor for Estimation and the non-monotonic RT regressor for Comparison, these two effects were assessed in two separate GLM analyses for each subject at the first level. Effects due to shared variance of the two regressors, if present, are identified as overlaps of the resulting T-statistic maps at the second level analyses (i.e., technically, as logical conjunctions).
References
Amunts, K., Kedo, O., Kindler, M., Pieperhoff, P., Mohlberg, H., Shah, N. J., Habel, U., Schneider, F., and Zilles, K. (2005). Cytoarchitectonic mapping of the human amygdala, hippocampal region and entorhinal cortex: intersubject variability and probability maps. Anat. Embryol. 210, 343–352.
Amunts, K., Lenzen, M., Friederici, A. D., Schleicher, A., Morosan, P., Palomero-Gallagher, N., and Zilles, K. (2010). Broca’s region: novel organizational principles and multiple receptor mapping. PLoS Biol. 8, e1000489. doi:10.1371/journal.pbio.1000489
Amunts, K., Malikovic, A., Mohlberg, H., Schormann, T., and Zilles, K. (2000). Brodmann’s areas 17 and 18 brought into stereotaxic space-where and how variable? Neuroimage 11, 66–84.
Amunts, K., Schleicher, A., Burgel, U., Mohlberg, H., Uylings, H. B. M., and Zilles, K. (1999). Broca’s region revisited: cytoarchitecture and intersubject variability. J. Comp. Neurol. 412, 319–341.
Amunts, K., Weiss, P. H., Mohlberg, H., Pieperhoff, P., Eickhoff, S., Gurd, J. M., Marshall, J. C., Shah, N. J., Fink, G. R., and Zilles, K. (2004). Analysis of neural mechanisms underlying verbal fluency in cytoarchitectonically defined stereotaxic space – The roles of Brodmann areas 44 and 45. Neuroimage 22, 42–56.
Boynton, G. M., Engel, S. A., Glover, G. H., and Heeger, D. J. (1996). Linear systems analysis of functional magnetic resonance imaging in human V1. J. Neurosci. 16, 4207–4221.
Brannon, E. M. (2005). The independence of language and mathematical reasoning. Proc. Natl. Acad. Sci. U.S.A. 109, 3177–3178.
Cantlon, J. F., and Brannon, E. M. (2007). Basic math in monkeys and college students. PLoS Biol. 5, e328. doi:10.1371/journal.pbio.0050328
Caspers, S., Eickhoff, S. B., Rick, T., von Kapri, A., Kuhlen, T., Huang, R., Shah, N. J., and Zilles, K. (2011). Probabilistic fibre tract analysis of cytoarchitectonically defined human inferior parietal lobule areas reveals similarities to macaques. Neuroimage 58, 362–380.
Caspers, S., Geyer, S., Schleicher, A., Mohlberg, H., Amunts, K., and Zilles, K. (2006). The human inferior parietal cortex: cytoarchtectonic parcellation and interindividual. Neuroimage 33, 430–448.
Changeux, J. P., and Connes, A. (1995). Conversations on Mind, Matter, and Mathematics. Princeton, NJ: Princeton University Press.
Choi, H. J., Zilles, K., Mohlberg, H., Schleicher, A., Fink, G. R., Armstrong, E., and Amunts, K. (2006). Cytoarchitectonic identification and probabilistic mapping of two distinct areas within the anterior ventral bank of the human intraparietal sulcus. J. Comp. Neurol. 495, 53–69.
Chomsky, N. (1988). Language and Problems of Knowledge: The Managua Lectures. Cambridge, MA: MIT Press.
Cohen, L., and Dehaene, S. (2000). Calculating without reading: unsuspected residual abilities in pure alexia. Cogn. Neuropsychol. 17, 563–583.
Cohen, L., and Dehaene, S. (2001). Occam’s razor is not a swiss-army knife: a reply to pillon and pesenti. Cogn. Neuropsychol. 18, 285–288.
Cohen Kadosh, R., Henik, A., Rubinsten, O., Mohr, H., Dori, H., van de Ven, V., Zorzi, M., Hendler, T., Goebel, R., and Linden, D. E. (2005). Are numbers special? The comparison systems of the human brain investigated by fMRI. Neuropsychologia 43, 1238–1248.
Dale, A. M., and Buckner, R. L. (1997). Selective averaging of rapidly presented individual trials using fMRI. Hum. Brain Mapp. 5, 329–340.
Dehaene, S., and Changeux, J. P. (1993). Development of elementary numerical abilities: a neuronal model. J. Cogn. Neurosci. 5, 390–407.
Dehaene, S., and Cohen, L. (1997). Cerebral pathways for calculation: double dissociation between rote verbal and quantitative knowledge of arithmetic. Cortex 33, 219–250.
Dehaene, S., Piazza, M., Pinel, P., and Cohen, L. (2003). Three parietal circuits for number processing. Cogn. Neuropsychol. 20, 487–506.
Eickhoff, S. B., Amunts, K., Mohlberg, H., and Zilles, K. (2006). The human parietal operculum. II. stereotaxic maps and correlation with functional imaging results. Cereb. Cortex 16, 268–279.
Eickhoff, S. B., Stephan, K. E., Mohlberg, H., Grefkes, C., Fink, G. R., Amunts, K., and Zilles, K. (2005). A new SPM toolbox for combining probabilistic cytoarchitectonic maps and functional imaging data. Neuroimage 25, 1325–1335.
Friederici, A. D., Oberecker, R., and Brauer, J. (2012). Neurophysiological preconditions of syntax acquisition. Psychol. Res. 76, 204–211.
Gelman, R., and Butterworth, B. (2005). Number and language: how are they related? Trends Cogn. Sci. 9, 6–10.
Geyer, S. (2003). The Microstructural Border Between the Motor and the Cognitive Domain in the Human Cerebral Cortex. Wien: Springer.
Geyer, S., Ledberg, A., Schleicher, A., Kinomura, S., Schormann, T., Bürgel, U., Klingberg, T., Larsson, J., Zilles, K., and Roland, P. E. (1996). Two different areas within the primary motor cortex of man. Nature 382, 805–807.
Grefkes, C., Geyer, S., Schormann, T., Roland, P., and Zilles, K. (2001). Human somatosensory area 2: observer-independent cytoarchitectonic mapping, interindividual variability, and population map. Neuroimage 14, 617–631.
Mars, R. B., Jbabdi, S., Sallet, J., O’Reilly, J. X., Croxson, P. L., Olivier, E., Noonan, M. P., Bergmann, C., Mitchell, A. S., Baxter, M. G., Behrens, T. E., Johansen-Berg, H., Tomassini, V., Miller, K. L., and Rushworth, M. F. (2011). Diffusion-weighted imaging tractography-based parcellation of the human parietal cortex and comparison with human and macaque resting-state functional connectivity. J. Neurosci. 31, 4087–4100.
McMillan, C. T., Clark, R., Moore, P., Devita, C., and Grossman, M. (2005). Neural basis for generalized quantifier comprehension. Neuropsychologia 43, 1729–1737.
Meck, W. H., and Church, R. M. (1983). A mode control model of counting and timing processes. J. Exp. Psychol. Anim. Behav. Process 9, 320–334.
Milsark, G. (1977). Toward an explanation of certain peculiarities of the existential construction in english. Ling. Analysis 3, 1–29.
Nieder, A., and Miller, E. K. (2003). Coding of cognitive magnitude: compressed scaling of numerical information in the primate prefrontal cortex. Neuron 37, 149–157.
Piazza, M., and Izard, V. (2009). How humans count: numerosity and the parietal cortex. Neuroscientist 15, 261–273.
Piazza, M., Izard, V., Pinel, P., Le Bihan, D., and Dehaene, S. (2004). Tuning curves for approximate numerosity in the human intraparietal sulcus. Neuron 44, 547–555.
Piazza, M., Pinel, P., Le Bihan, D., and Dehaene, S. (2007). A magnitude code common to numerosities and number symbols in human intraparietal cortex. Neuron 53, 293–305.
Roitman, J. D., Brannon, E. M., and Platt, M. L. (2007). Monotonic coding of numerosity in macaque lateral intraparietal area. PLoS Biol. 5, e208. doi:10.1371/journal.pbio.0050208
Rottschy, C., Eickhoff, S. B., Schleicher, A., Mohlberg, H., Kujovic, M., Zilles, K., and Amunts, K. (2007). Ventral visual cortex in humans: cytoarchitectonic mapping of two extrastriate areas. Hum. Brain Mapp. 28, 1045–1059.
Scheperjans, F., Eickhoff, S. B., Hömke, L., Mohlberg, H., Hermann, K., Amunts, K., and Zilles, K. (2008). Probabilistic maps, morphometry and variability of cytoarchitectonic areas in the human superior parietal cortex. Cereb. Cortex 18, 2141–2157.
Schleicher, A., Palomero-Gallagher, N., Morosan, P., Eickhoff, S. B., Kowalski, T., de Vos, K., Amunts, K., and Zilles, K. (2005). Quantitative architectural analysis: a new approach to cortical mapping. Anat. Embryol. 210, 373–386.
Troiani, V., Peelle, J. E., Clark, R., and Grossman, M. (2009). Is it logical to count on quantifiers? Dissociable neural networks underlying numerical and logical quantifiers. Neuropsychologia 47, 104–111.
Uddin, L. Q., Supekar, K., Amin, H., Rykhlevskaia, E., Nguyen, D. A., Greicius, M. D., and Menon, V. (2010). Dissociable connectivity within human angular gyrus and intraparietal sulcus: evidence from functional and structural connectivity. Cereb. Cortex 20, 2636–2646.
Varley, R. A., Klessinger, N. J., Romanowski, C. A., and Siegal, M. (2005). Agrammatic but numerate. Proc. Natl. Acad. Sci. U.S.A. 102, 3519–3524.
Verguts, T., and Fias, W. (2004). Representation of number in animals and humans: a neural model. J. Cogn. Neurosci. 16, 1493–1504.
Keywords: intraparietal sulcus, numerosity, semantics, fMRI, Broca’s area, BA 45, estimation
Citation: Heim S, Amunts K, Drai D, Eickhoff SB, Hautvast S and Grodzinsky Y (2012) The language–number interface in the brain: a complex parametric study of quantifiers and quantities. Front. Evol. Neurosci. 4:4. doi: 10.3389/fnevo.2012.00004
Received: 23 November 2011; Paper pending published: 29 December 2011;
Accepted: 05 March 2012; Published online: 21 March 2012.
Edited by:
Angela Dorkas Friederici, Max Planck Institute for Human Cognitive and Brain Sciences, GermanyReviewed by:
Angela Dorkas Friederici, Max Planck Institute for Human Cognitive and Brain Sciences, GermanyPaul Summers, University of Modena, Italy
Copyright: © 2012 Heim, Amunts, Drai, Eickhoff, Hautvast and Grodzinsky. This is an open-access article distributed under the terms of the Creative Commons Attribution Non Commercial License, which permits non-commercial use, distribution, and reproduction in other forums, provided the original authors and source are credited.
*Correspondence: Stefan Heim, Department of Psychiatry, Psychotherapy, and Psychosomatics, Medical School, RWTH Aachen University, Pauwelsstraße 30, 52074 Aachen, Germany. e-mail:c2hlaW1AdWthYWNoZW4uZGU=