 Johan Haumann1†
 Amadou K. S. Camara1,2,3,4Ashish K. Gadicherla1†Christopher D. Navarro1Age D. Boelens1†Christoph A. Blomeyer1†
 Ranjan K. Dash5Michael R. Boswell1Wai-Meng Kwok1,3,4,6
 David F. Stowe1,2,3,5,7*
- 1Department of Anesthesiology, Medical College of Wisconsin, Milwaukee, WI, United States
- 2Department of Physiology, Medical College of Wisconsin, Milwaukee, WI, United States
- 3Cardiovascular Center, Medical College of Wisconsin, Milwaukee, WI, United States
- 4Cancer Center, Medical College of Wisconsin, Milwaukee, WI, United States
- 5Department of Biomedical Engineering, Medical College of Wisconsin and Marquette University, Milwaukee, WI, United States
- 6Department of Pharmacology and Toxicology, Medical College of Wisconsin, Milwaukee, WI, United States
- 7Research Service, Veterans Affairs Medical Center, Milwaukee, WI, United States
Mitochondrial (m) Ca2+ influx is largely dependent on membrane potential (ΔΨm), whereas mCa2+ efflux occurs primarily via Ca2+ ion exchangers. We probed the kinetics of Ca2+/H+ exchange (CHEm) in guinea pig cardiac muscle mitochondria. We tested if net mCa2+ flux is altered during a matrix inward H+ leak that is dependent on matrix H+ pumping by ATPm hydrolysis at complex V (FOF1-ATPase). We measured [Ca2+]m, extra-mitochondrial (e) [Ca2+]e, ΔΨm, pHm, pHe, NADH, respiration, ADP/ATP ratios, and total [ATP]m in the presence or absence of protonophore dinitrophenol (DNP), mitochondrial uniporter (MCU) blocker Ru360, and complex V blocker oligomycin (OMN). We proposed that net slow influx/efflux of Ca2+ after adding DNP and CaCl2 is dependent on whether the ΔpHm gradient is/is not maintained by reciprocal outward H+ pumping by complex V. We found that adding CaCl2 enhanced DNP-induced increases in respiration and decreases in ΔΨm while [ATP]m decreased, ΔpHm gradient was maintained, and [Ca2+]m continued to increase slowly, indicating net mCa2+ influx via MCU. In contrast, with complex V blocked by OMN, adding DNP and CaCl2 caused larger declines in ΔΨm as well as a slow fall in pHm to near pHe while [Ca2+]m continued to decrease slowly, indicating net mCa2+ efflux in exchange for H+ influx (CHEm) until the ΔpHm gradient was abolished. The kinetics of slow mCa2+ efflux with slow H+ influx via CHEm was also observed at pHe 6.9 vs. 7.6 by the slow fall in pHm until ΔpHm was abolished; if Ca2+ reuptake via the MCU was also blocked, mCa2+ efflux via CHEm became more evident. Of the two components of the proton electrochemical gradient, our results indicate that CHEm activity is driven largely by the ΔpHm chemical gradient with H+ leak, while mCa2+ entry via MCU depends largely on the charge gradient ΔΨm. A fall in ΔΨm with excess mCa2+ loading can occur during cardiac cell stress. Cardiac cell injury due to mCa2+ overload may be reduced by temporarily inhibiting FOF1-ATPase from pumping H+ due to ΔΨm depolarization. This action would prevent additional slow mCa2+ loading via MCU and permit activation of CHEm to mediate efflux of mCa2+.
HIGHLIGHTS
- We examined how slow mitochondrial (m) Ca2+ efflux via Ca2+/H+ exchange (CHEm) is triggered by matrix acidity after a rapid increase in [Ca2+]m by adding CaCl2 in the presence of dinitrophenol (DNP) to permit H+ influx, and oligomycin (OMN) to block H+ pumping via FOF1-ATP synthase/ase (complex V).
- Declines in ΔΨm and pHm after DNP and added CaCl2 were larger when complex V was blocked.
- [Ca2+]m slowly increased despite a fall in ΔΨm but maintained pHm when H+ pumping by complex V was permitted.
- [Ca2+]m slowly decreased and external [Ca2+]e increased with declines in both ΔΨm and pHm when complex V was blocked.
- ATPm hydrolysis supports a falling pHm and redox state and promotes a slow increase in [Ca2+]m.
- After rapid Ca2+ influx due to a bolus of CaCl2, slow mCa2+ efflux by CHEm occurs directly if pHe is low.
Introduction
Mitochondrial (m) Ca2+ overload is a damaging consequence of cardiac ischemia-reperfusion (IR) injury and hence is an important subject for potential therapy (Brookes et al., 2004; O’Rourke et al., 2005; Stowe and Camara, 2009; Camara et al., 2010). During IR, mitochondria can consume rather than generate ATP (Chinopoulos and Adam-Vizi, 2010; Chinopoulos et al., 2010), which consequently can augment mCa2+ overload (Riess et al., 2002) sufficient to induce cell apoptosis and necrosis (Murphy and Steenbergen, 2008). [Ca2+]m is regulated in part by electrochemical dependent cation flux via Ca2+ transporters and by cation exchangers within the inner mitochondrial membrane (IMM) (Gunter and Pfeiffer, 1990; Gunter et al., 1994; Bernardi, 1999; Brookes et al., 2004). The major route for mCa2+ uptake is via the ruthenium red (RR) sensitive mitochondrial Ca2+ uniporter (MCU), now considered a macromolecular complex composed of two pore components, MCU and MCUb, and MCU regulators MCU1, 2, 3, and EMRE (essential MCU regulator), and other components (De Stefani et al., 2015). Ca2+ influx via the MCU is reduced by competition with cytosolic Mg2+ (Boelens et al., 2013; Tewari et al., 2014). Additional modes of mCa2+ uptake are proposed to occur via a ryanodine type channel (RTC) in the IMM (Ryu et al., 2011; O-Uchi et al., 2013; Tewari et al., 2014) and at the sarcoplasmic reticular-MCU interface where functional Ca2+ signaling between the cytoplasmic and mitochondrial compartments is believed to occur (Csordas et al., 2010).
A primary mCa2+ efflux pathway is the Na+/Ca2+ exchanger (NCEm) (Boyman et al., 2013). In unicellular organisms and in some non-cardiac tissues there is firm evidence (Azzone et al., 1977; Pozzan et al., 1977; Wingrove et al., 1984; Brand, 1985; Rottenberg and Marbach, 1990; Gunter et al., 1991, 1994; Bernardi, 1999; Demaurex et al., 2009; Nishizawa et al., 2013) for slow homeostatic mCa2+ efflux through a Na+-independent Ca2+ exchanger (NICE), i.e., a non-electrogenic Ca2+/H+ exchanger (CHE) that might be activated when the ΔpHm gradient across the IMM is altered. The amount of free (ionized) [Ca2+]m available for exchange depends on the extent of dynamic mCa2+ buffering (Bazil et al., 2013; Blomeyer et al., 2013; Tewari et al., 2014). mCa2+ influx via the MCU and efflux via the NCEm are largely voltage (ΔΨm) dependent, whereas Ca2+ transport via the CHEm, while pH-dependent, may be electrogenic (1 H+ for 1 Ca2+) or non-electrogenic (2 H+ for 1 Ca2+). However, CHEm can be indirectly dependent on the full IMM electrochemical gradient if there is a decrease in the IMM ΔpHm gradient (Rottenberg and Marbach, 1990; Dash and Beard, 2008; Dash et al., 2009).
There is a well-known direct correlation between ΔΨm and mCa2+ uptake based on the Nernst equation; a more polarized ΔΨm permits greater mCa2+ uptake (Wingrove et al., 1984; Gunter et al., 1994). mCa2+ uptake via the MCU depends both on the electrical (charge) gradient, ΔΨm, and on the concentration gradient for [Ca2+] across the IMM. ATPm hydrolysis with H+ pumping can occur at complex V (FOF1-ATPsynthase/ase) during cardiac ischemia (Jennings et al., 1991) in an attempt to maintain the ΔpHm gradient, and along with the ΔΨm gradient (Chinopoulos and Adam-Vizi, 2010; Chinopoulos, 2011), equals the proton motive force, pmf. However, it is not known how the magnitude, rate, and route of mCa2+ uptake or release in cardiac muscle cell mitochondria is affected by manipulating the IMM Δ[H+]m gradient by allowing mATP hydrolysis, which would result in H+ pumping and better maintain the Δ[H+] gradient when ΔΨm is low, vs. blocking mATP hydrolysis (no H+ pumping with collapsing Δ[H+]) and lower ΔΨm.
Exposure of mitochondria to external (e) CaCl2 when the IMM is fully charged (high ΔΨm), defined here by the presence of substrate in state 2 conditions without an induced inward H+ leak, promotes rapid voltage-dependent mCa2+ uptake via MCU (Hoppe, 2010). In contrast, decreased net mCa2+ uptake might be expected during a protonophore-induced inward H+ leak if H+ influx leads to Ca2+ efflux. However, an inward H+ flux that slowly decreases ΔΨm can still result in a slow, continued uptake of mCa2+ via the MCU if there remains sufficient ΔΨm and Ca2+ chemical gradient ([Ca2+]e > [Ca2+]m) across the IMM. mCa2+ influx via the MCU can partially depolarize ΔΨm (Delcamp et al., 1998; Di Lisa and Bernardi, 1998) due to the influx of positive charges without an effect on the Δ[H+]m, and more so with a fall in Δ[H+]m gradient from the added influx of H+ in the presence of a protonophore.
Our aim was to mechanistically examine the slow mode kinetics of mCa2+ influx/efflux in cardiac cell mitochondria. The conditions under which CHEm may occur in cardiac mitochondria are unknown. We proposed that an induced, net influx of H+ is coupled to net mCa2+ efflux by activation of CHEm in the face of continued mCa2+ uptake via the MCU in partially depolarized ΔΨm mitochondria. In addition, if the extra-mitochondrial milieu is acidic, pHm would slowly decrease as mH+ entry by mCHEm is exchanged for mCa2+ efflux in Ca2+ overloaded mitochondria. We postulated that CHEm is activated under conditions of slow a H+ influx and a high m[Ca2+], and especially when H+ pumping by complex V, stimulated by the lowered ΔΨm, is prevented. To carry out our aim, we examined the time dependent changes in ΔΨm, [Ca2+]m and pHm, and extra-mitochondrial [Ca2+]e and pHe, after a bolus of CaCl2 either by inducing an inward H+ leak that causes an outward pumping of H+ by complex V, or by altering the extra-mitochondrial pHe.
In one set of experiments, we challenged isolated energized mitochondria with a bolus of CaCl2 in the absence or presence of increasing concentrations of the protonophore 2,4-dinitrophenol (DNP) in the absence or presence of the complex V inhibitor oligomycin (OMN) to block ATP hydrolysis-induced H+ pumping, and or Ru360 to block the reuptake of Ca2+ via the MCU. To understand how DNP, OMN, and Ru360 dynamically alter [Ca2+]m or [Ca2+]e after a bolus of CaCl2, we considered it crucial to also dynamically measure ΔΨm, pHm, and NADH, as well as mitochondrial respiration (extent of uncoupling), total [ATP]m, and ATPm/ADPm ratio. In another set of isolated mitochondrial experiments, we directly induced mCa2+ efflux via CHEm after CaCl2 loading by altering the Na+-free medium from a control pHe of 7.15 to either pH 7.6 or 6.9. We show that secondary Ca2+ influx vs. efflux is Δ[H+]m dependent.
Materials and Methods
Isolated Mitochondrial Experiments
All experiments conformed to the Guide for the Care and Use of Laboratory Animal and were approved by the Medical College of Wisconsin Biomedical Resource Center animal studies committee. Detailed methods for mitochondrial isolation and measurements of ΔΨm, [Ca2+]m, NADH redox state, pHm, [ATP]m, ADPm/ATPm ratio, respiration, and the number of animals per group, are furnished (see section “Supplementary Materials S.1.1–S.1.12”). Briefly, mitochondria were isolated from guinea pig heart ventricles in iced buffer and were suspended in experimental buffer containing in mM: KCl 130, K2HPO4 5, MOPS 20, bovine serum albumin 0.016 and EGTA ∼0.036–0.040 at pH 7.15 (adjusted with KOH) at room temperature (21°C). The experimental buffer had a final protein concentration of 0.5 mg/mL. Specific fluorescent probes and spectrophotometry (Qm-8, Photon Technology International, Birmingham, NJ, United States) were used to measure [Ca2+]m (indo-1AM) and buffer [Ca2+]e (indo-1 or Fura 4 F penta-K+ salt), NADH, an indicator of mitochondrial redox state (autofluorescence), pHm (BCECF-AM), and mitochondrial membrane potential (ΔΨm) assessed by rodamine-123 or TMRM (Heinen et al., 2007; Huang et al., 2007; Aldakkak et al., 2010; Haumann et al., 2010) (all fluorescence probes from InvitrogenTM – Thermo Fisher Scientific). Respiration (Clark electrode) and ATPm (bioluminescence) and ATPm/ADPm ratio (HPLC, luminometry) were also measured. The experimental buffer, mitochondrial substrates, and drugs were Na+-free to prevent activation of NCEm by extra-mitochondrial Na+. The inactivity of the NCE was verified by comparing data from these experiments to data from experiments with added CGP-37157, a known mitochondrial NCEm inhibitor (data not shown).
Experimental Protocols
Medium pHe-Induced Changes in pHm
The experimental buffer was identical to that described above except that in addition to the pH 7.15 buffer, buffers at pH 6.9 and 7.6 were prepared by titration with HCl and KOH, respectively. The residual EGTA carried over from the isolation buffer to the experimental buffer resulted in an ionized extra-mitochondrial [Ca2+]e of <200 nM (Figure 1). To measure changes in [Ca2+]e after adding a bolus of 40 μM CaCl2, each pH buffer contained Fura 4 F penta-K+ salt. The KD’s for Ca2+ were calculated and corrected for each buffer pH because pH affects the binding of Ca2+ to the fluorescence dye (see section “Supplementary Materials S.1.4, S.1.8”). In other experiments, pHm and ΔΨm were measured using BCECF-AM and TMRM fluorescent dyes, respectively. Experiments were initiated at t = 30 s when mitochondria were added to the buffer; at t = 90 s pyruvic acid (PA, 0.5 mM) was added, followed by a bolus of 40 μM CaCl2 at t = 210 s to initiate rapid mCa2+ uptake via MCU. Note that in guinea pig cardiac mitochondria, the respiratory control index (RCI) is higher in the presence of pyruvate alone (Heinen et al., 2007; Blomeyer et al., 2013; Boelens et al., 2013) than with pyruvate plus malate (Riess et al., 2008). For some experiments, 1 μM Ru360 (or vehicle, 0.1% DMSO) was added at t = 300 s shortly after adding CaCl2 to block Ca2+ reuptake into mitochondria via MCU after the Ca2+ was extruded from mitochondria. At the end (1700 s) of each experiment, the potent protonophore, carbonyl cyanide m-chlorophenyl hydrazone (CCCP, 4 μM) was given to completely abolish the ΔpH gradient and depolarize ΔΨm. Data for each pH group were collected in mitochondrial suspensions from the same heart; approximately 8–10 hearts were used for each fluorescent probe. At pH 7.15, adding 40 μM CaCl2, which increased extra-mitochondrial [Ca2+]e into the 1 μM range and increased the initial [Ca2+]m to approximately 500 nM (Figures 1, 2), is unlikely to induce membrane permeability transition pore (mPTP) opening. However, to test the possibility of mPTP opening, 500 nM cyclosporine A (CsA), a modulator of cyclophilin D required to open mPTP, was given before adding CaCl2 in several experiments at pHe 6.9 and 7.15.
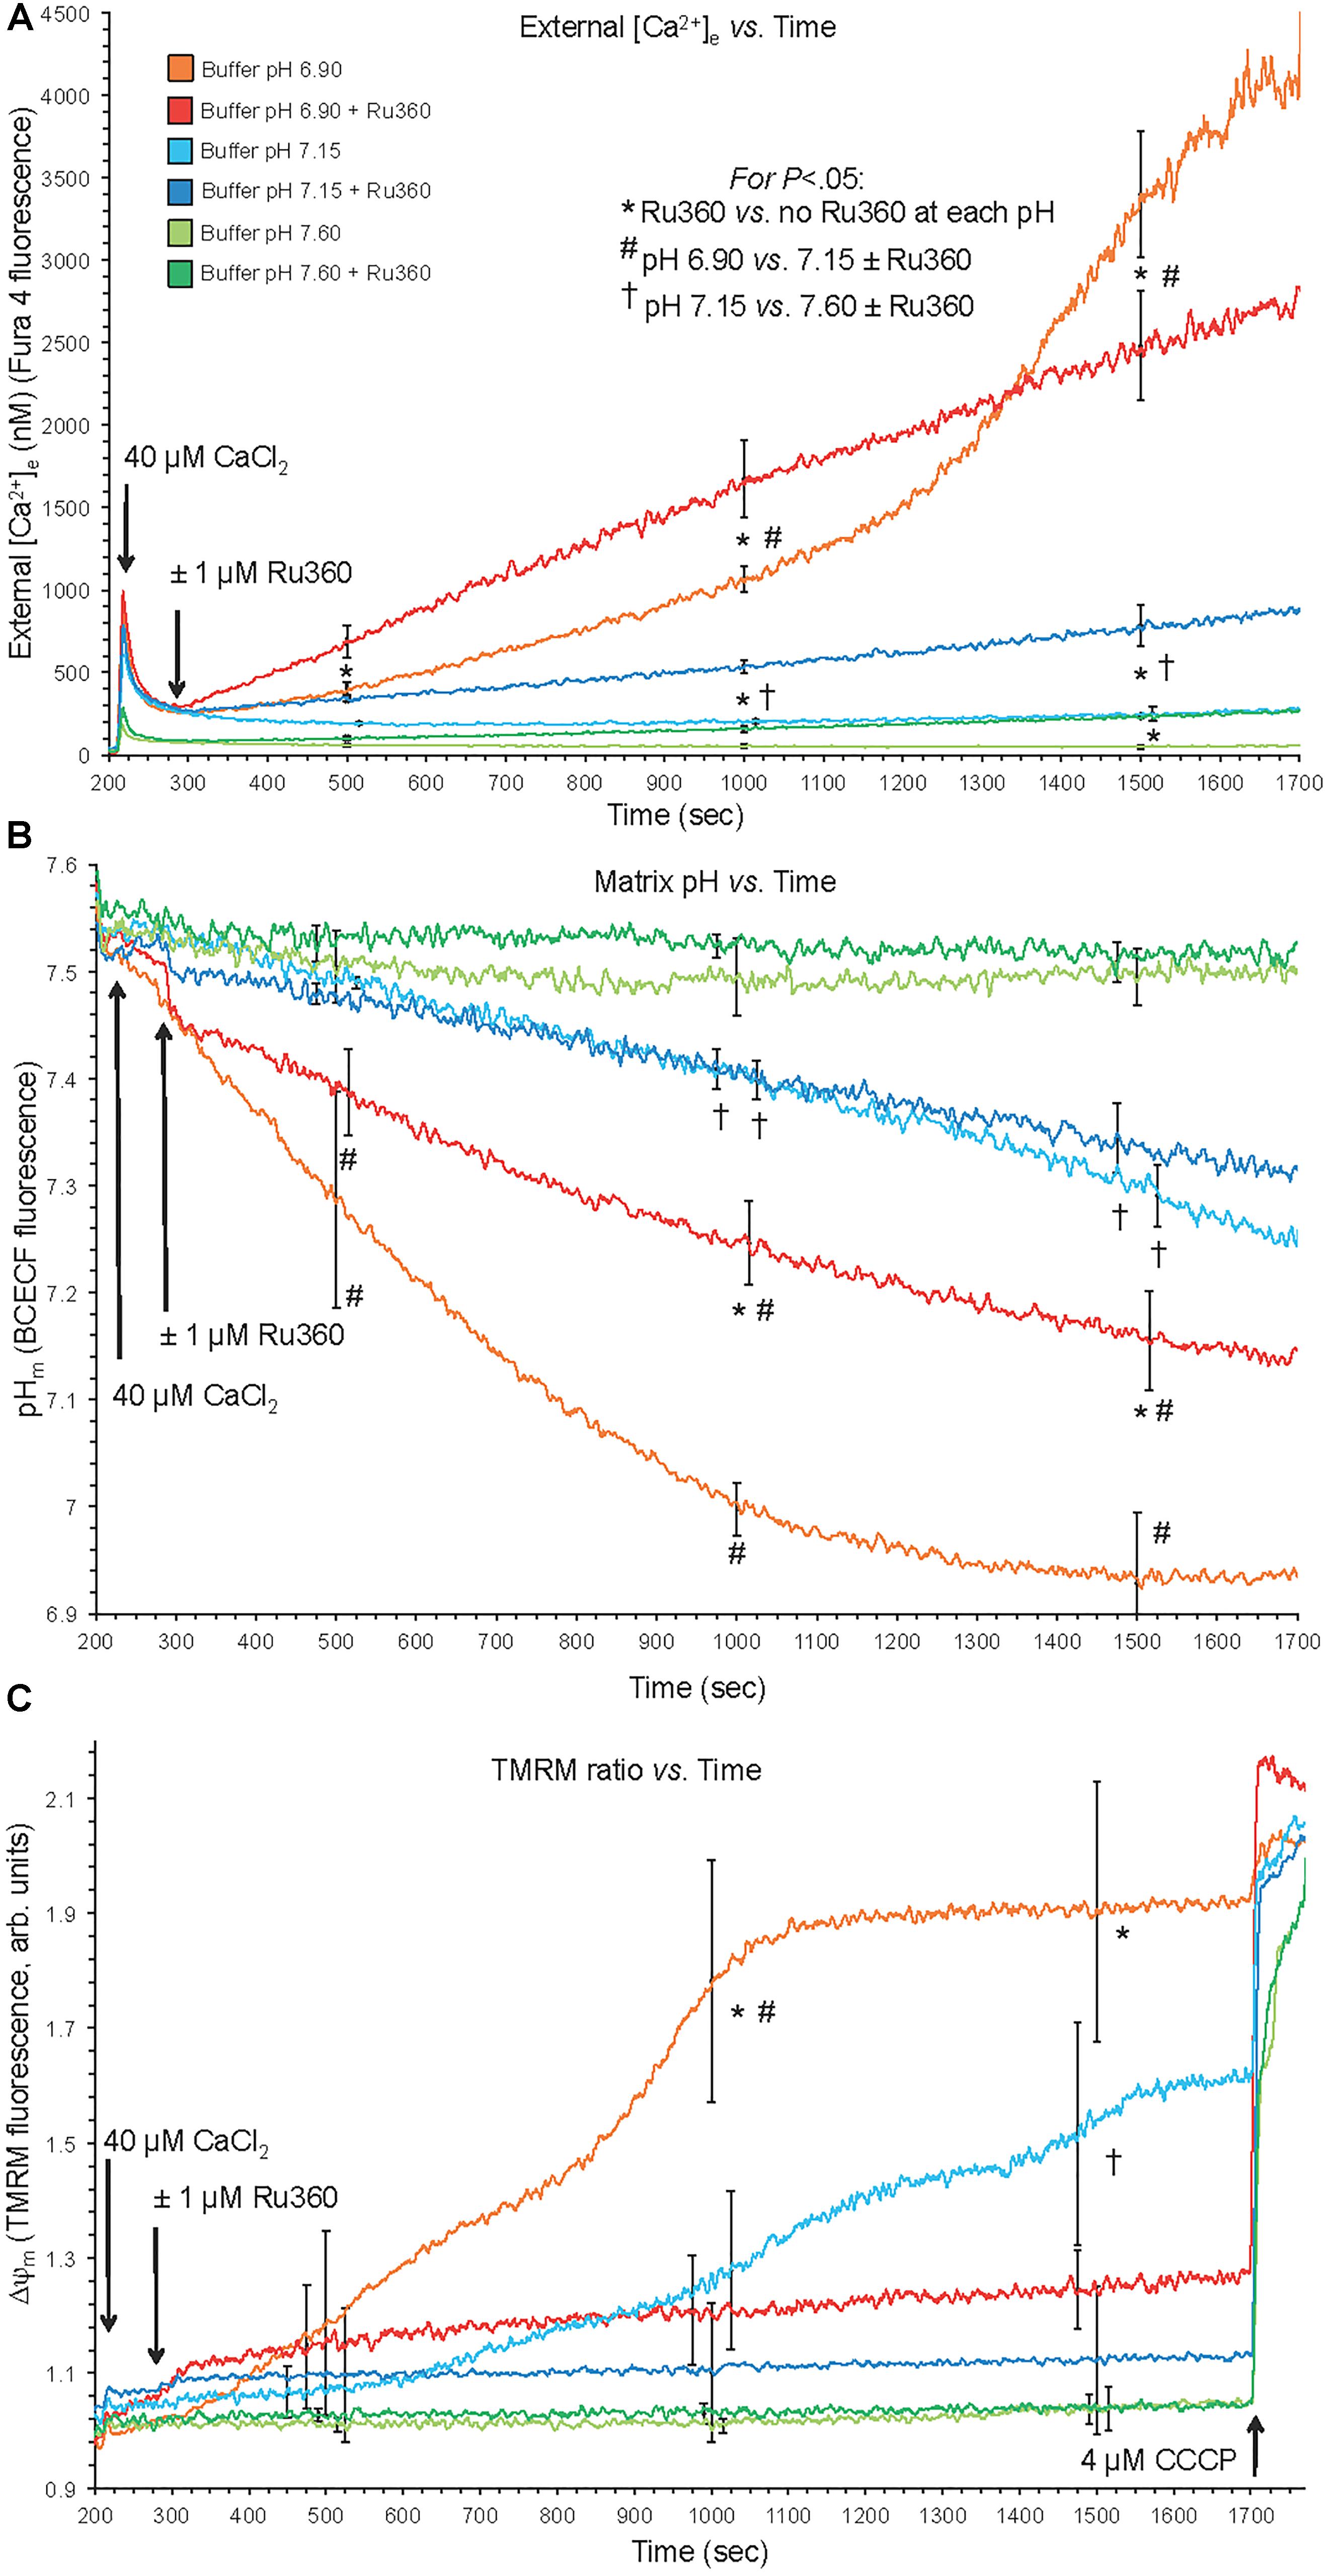
Figure 1. Changes in buffer [Ca2+]e (A), matrix pHm (B), and ΔΨm (C) over time after adding 40 μM CaCl2 (210 s) at extra-mitochondrial pHe 7.6, 7.15, and 6.9 with or without 1 μM Ru360 (300 s) to inhibit additional mCa2+ uptake via MCU. Note the rapid fall in [Ca2+]e due to fast mCa2+ uptake via the MCU and the following slow rise in [Ca2+]e (Ca2+ efflux) (A), slow decline in pHm (B), and slow depolarization of ΔΨm (C) at pH 6.9 (each line = mean of 3–4 replicates from 12 guinea pig hearts for each fluorescence measurement). Note in the pH 6.9 medium the faster rate of mCa2+ efflux (A) over time when MCU was blocked, and the faster declines in pHm (B) and ΔΨm (C) over time when MCU was not blocked.
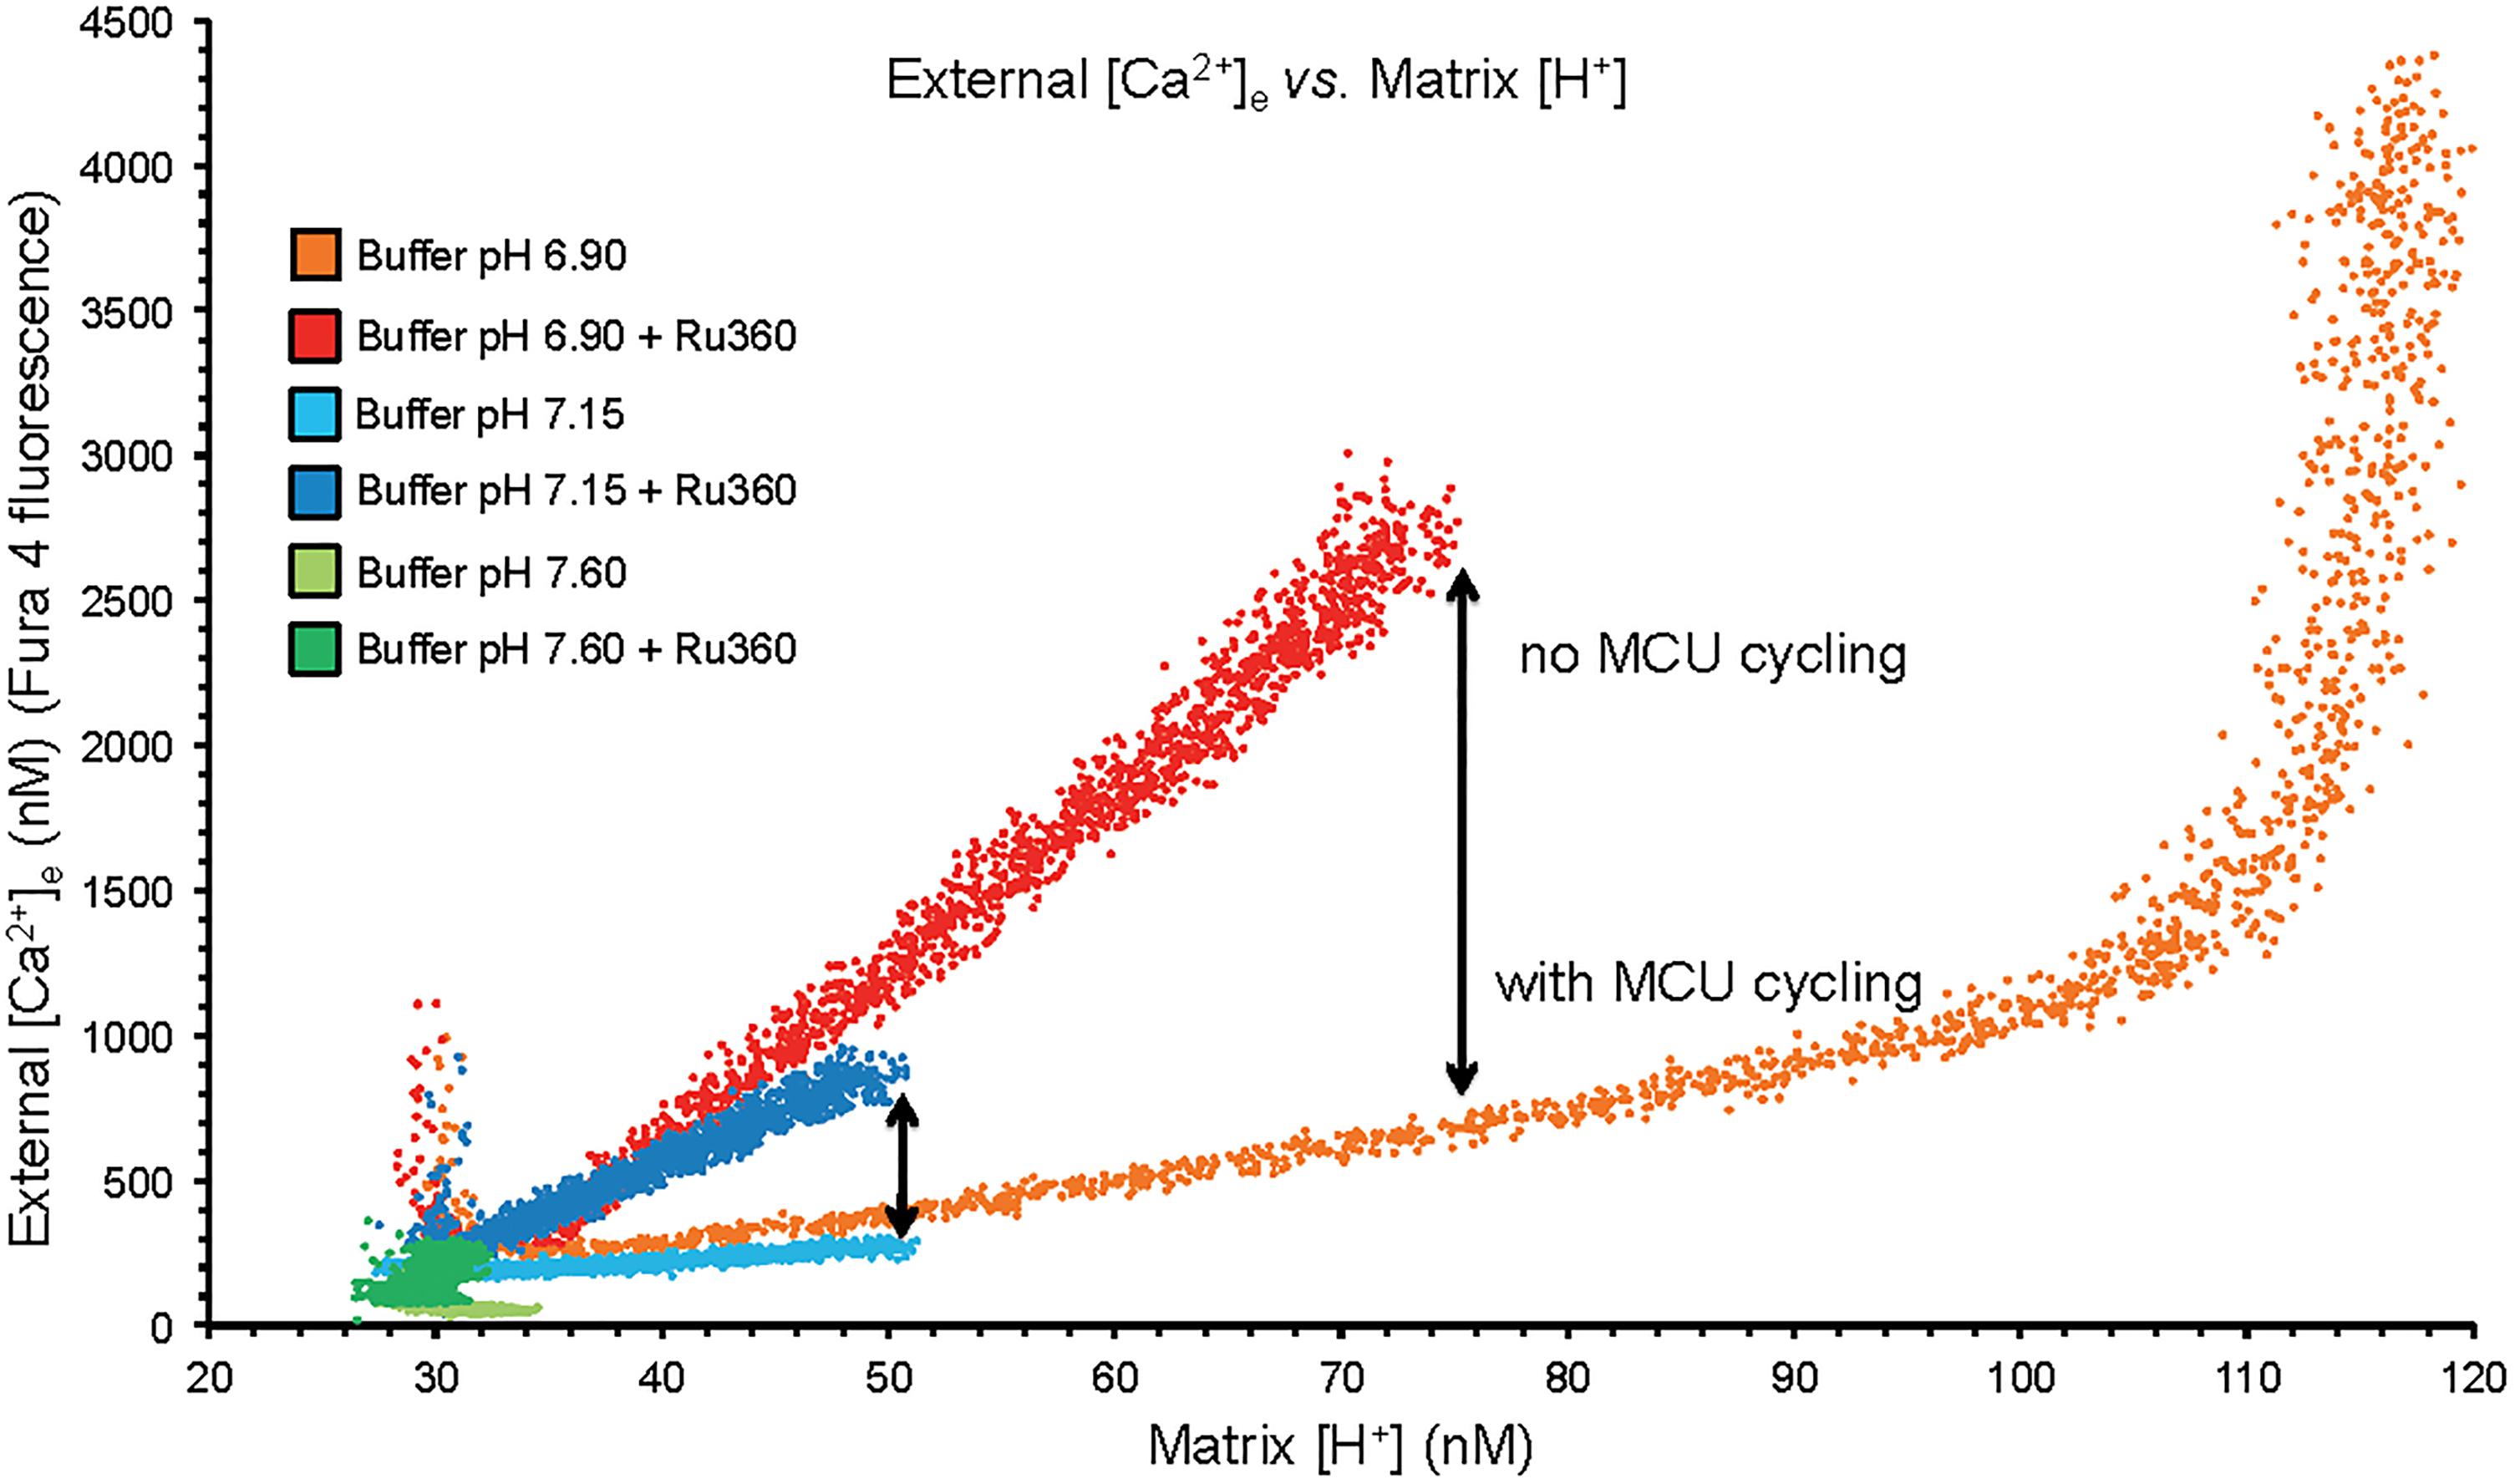
Figure 2. Plots of extra-mitochondrial [Ca2+]e as a function of [H+]m from the mean data of Figures 1A,B. Arrows denote the difference in net mCa2+ efflux at a given [H+]m when MCU was or was not blocked with Ru360 given 90 s after the CaCl2 bolus. While mCa2+ was extruded by CHEm, much of it re-entered via the MCU when it was not blocked. At trans-membrane pH equilibrium (pH 6.9) Ca2+ uptake via MCU stopped as the ΔΨm was nearly depolarized having resulted in a large net extrusion of Ca2+.
Protonophore-Induced Changes in pHm
Experiments were initiated at t = -120 s; at t = -90 s, mitochondria were added to the experimental buffer (time line, Figure 3); external pHe was 7.15. At t = 0 s, pyruvic acid (PA, 0.5 mM) was added to the mitochondria suspended in the experimental buffer, followed by 0, 10, 20, 30, or 100 μM DNP, a mild protonophore, at t = 90 s, followed by the addition of de-ionized H2O, 10, or 25 μM CaCl2 at t = 225 s. The 90 s period allowed for full ΔΨm polarization and stabilization of pHm and NADH. In some experiments (see section “Supplementary Results S.2.4” and Supplementary Figure S.6), 100 nM Ru360 was added at t = 300 s, after the addition of CaCl2, to block any reuptake of mCa2+ by the MCU that was extruded by CHEm. For the OMN treated groups, 10 μM OMN was added to the experimental buffer at the start of the experimental protocol (Figure 3). At the end of each experiment CCCP was added at t = 760 s to maximally depolarize ΔΨm. DNP, Ru360, OMN, and CCCP were each dissolved initially in DMSO and then in buffer to yield a final buffer concentration for DMSO of 0.1 to 0.4% (wt/vol). Each drug or DMSO alone was added to a final volume of 10 μL. To test for mPTP opening, CsA was given before adding 20 or 30 μM DNP and 25 μM CaCl2 in several experiments conducted at pHe 7.15.
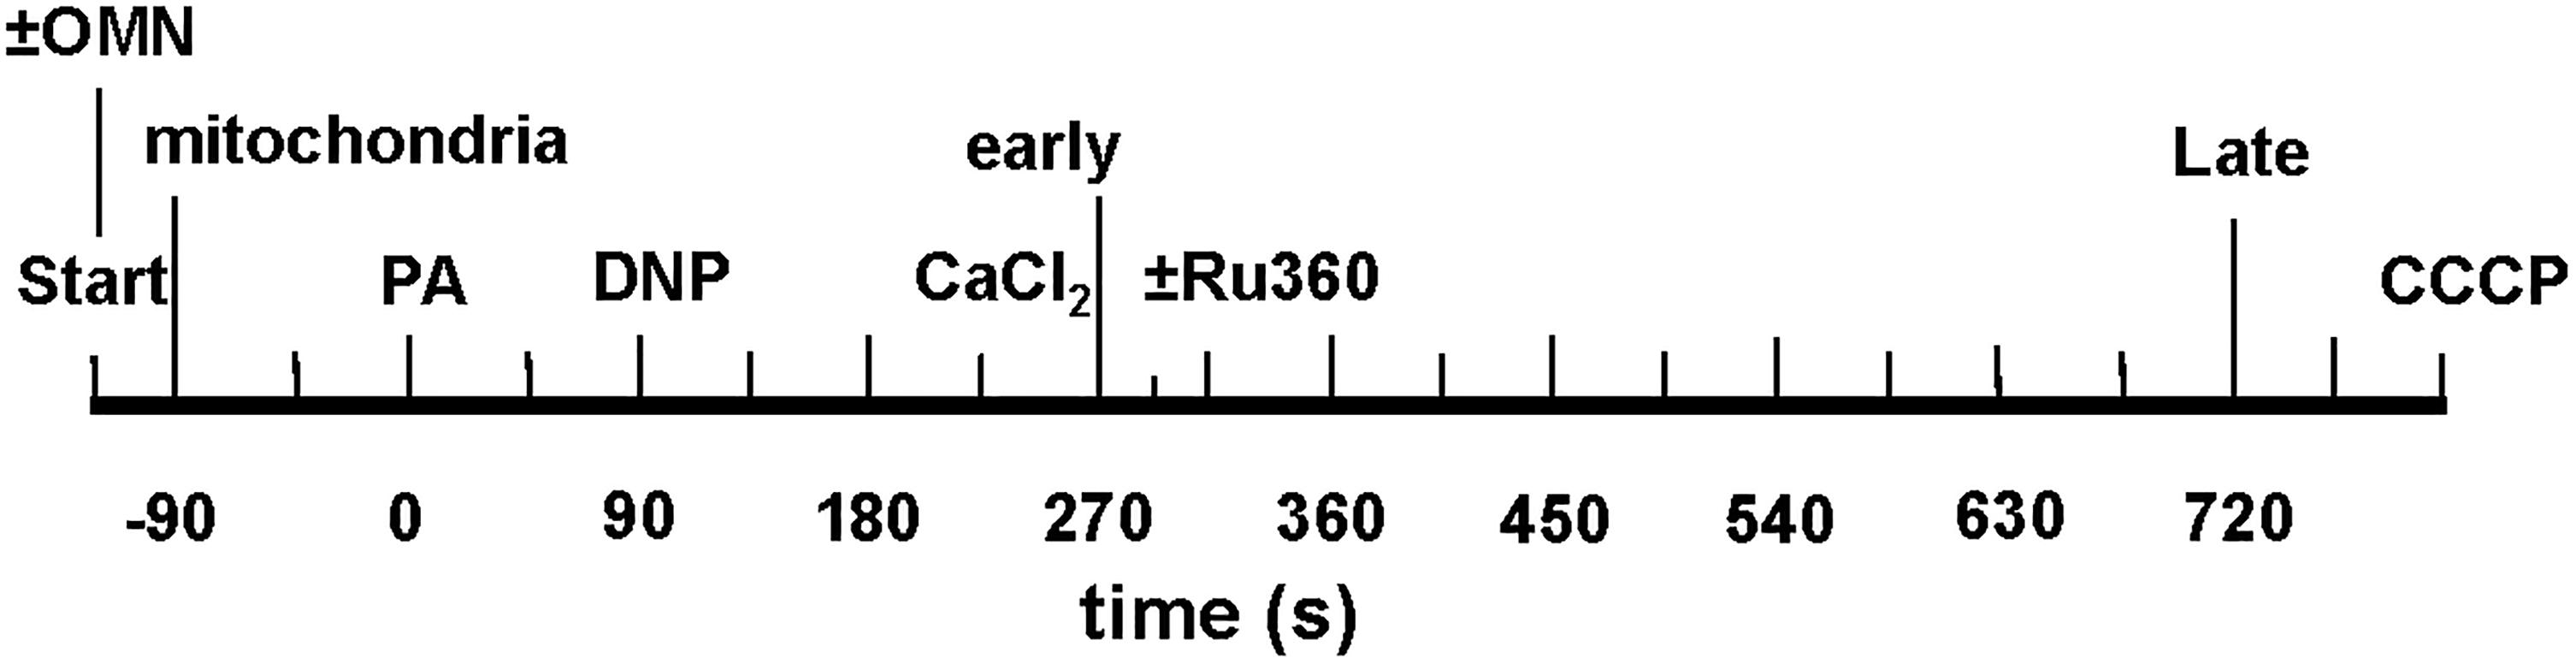
Figure 3. Time line of protonophore-induced experimental protocol: addition of mitochondria, ±oligomycin (OMN), pyruvic acid (PA), dinitrophenol (DNP), CaCl2, and CCCP to respiratory buffer. Early and late plots refer to time points where means of several variables are plotted to summarize their interrelationships. In Supplementary Experiments, Ru360 (100 nM) was given to block the MCU (see section “Supplementary Results S.2.4” and Supplementary Figures S.6A,B).
Statistical Analyses
Data were summarized at 500, 1000, and 1500 s (for Figures 1, 2) for external buffer-induced changes in pHm on [Ca2+]e. Data were summarized for protonophore-induced changes in pHm on [Ca2+]m at 80 s (after adding PA), 215 s (after adding DNP), 275 s (early after adding CaCl2), and 700 s (late after adding CaCl2) (e.g., Figure 4). All data points were presented and expressed as average ± SEM. Repeated measure ANOVAs followed by a post hoc analyses using Student-Newman-Keuls’ test was performed to determine statistically significant differences among groups. A P-value < 0.05 (two-tailed) was considered significant. See Figure legends for statistical notations.
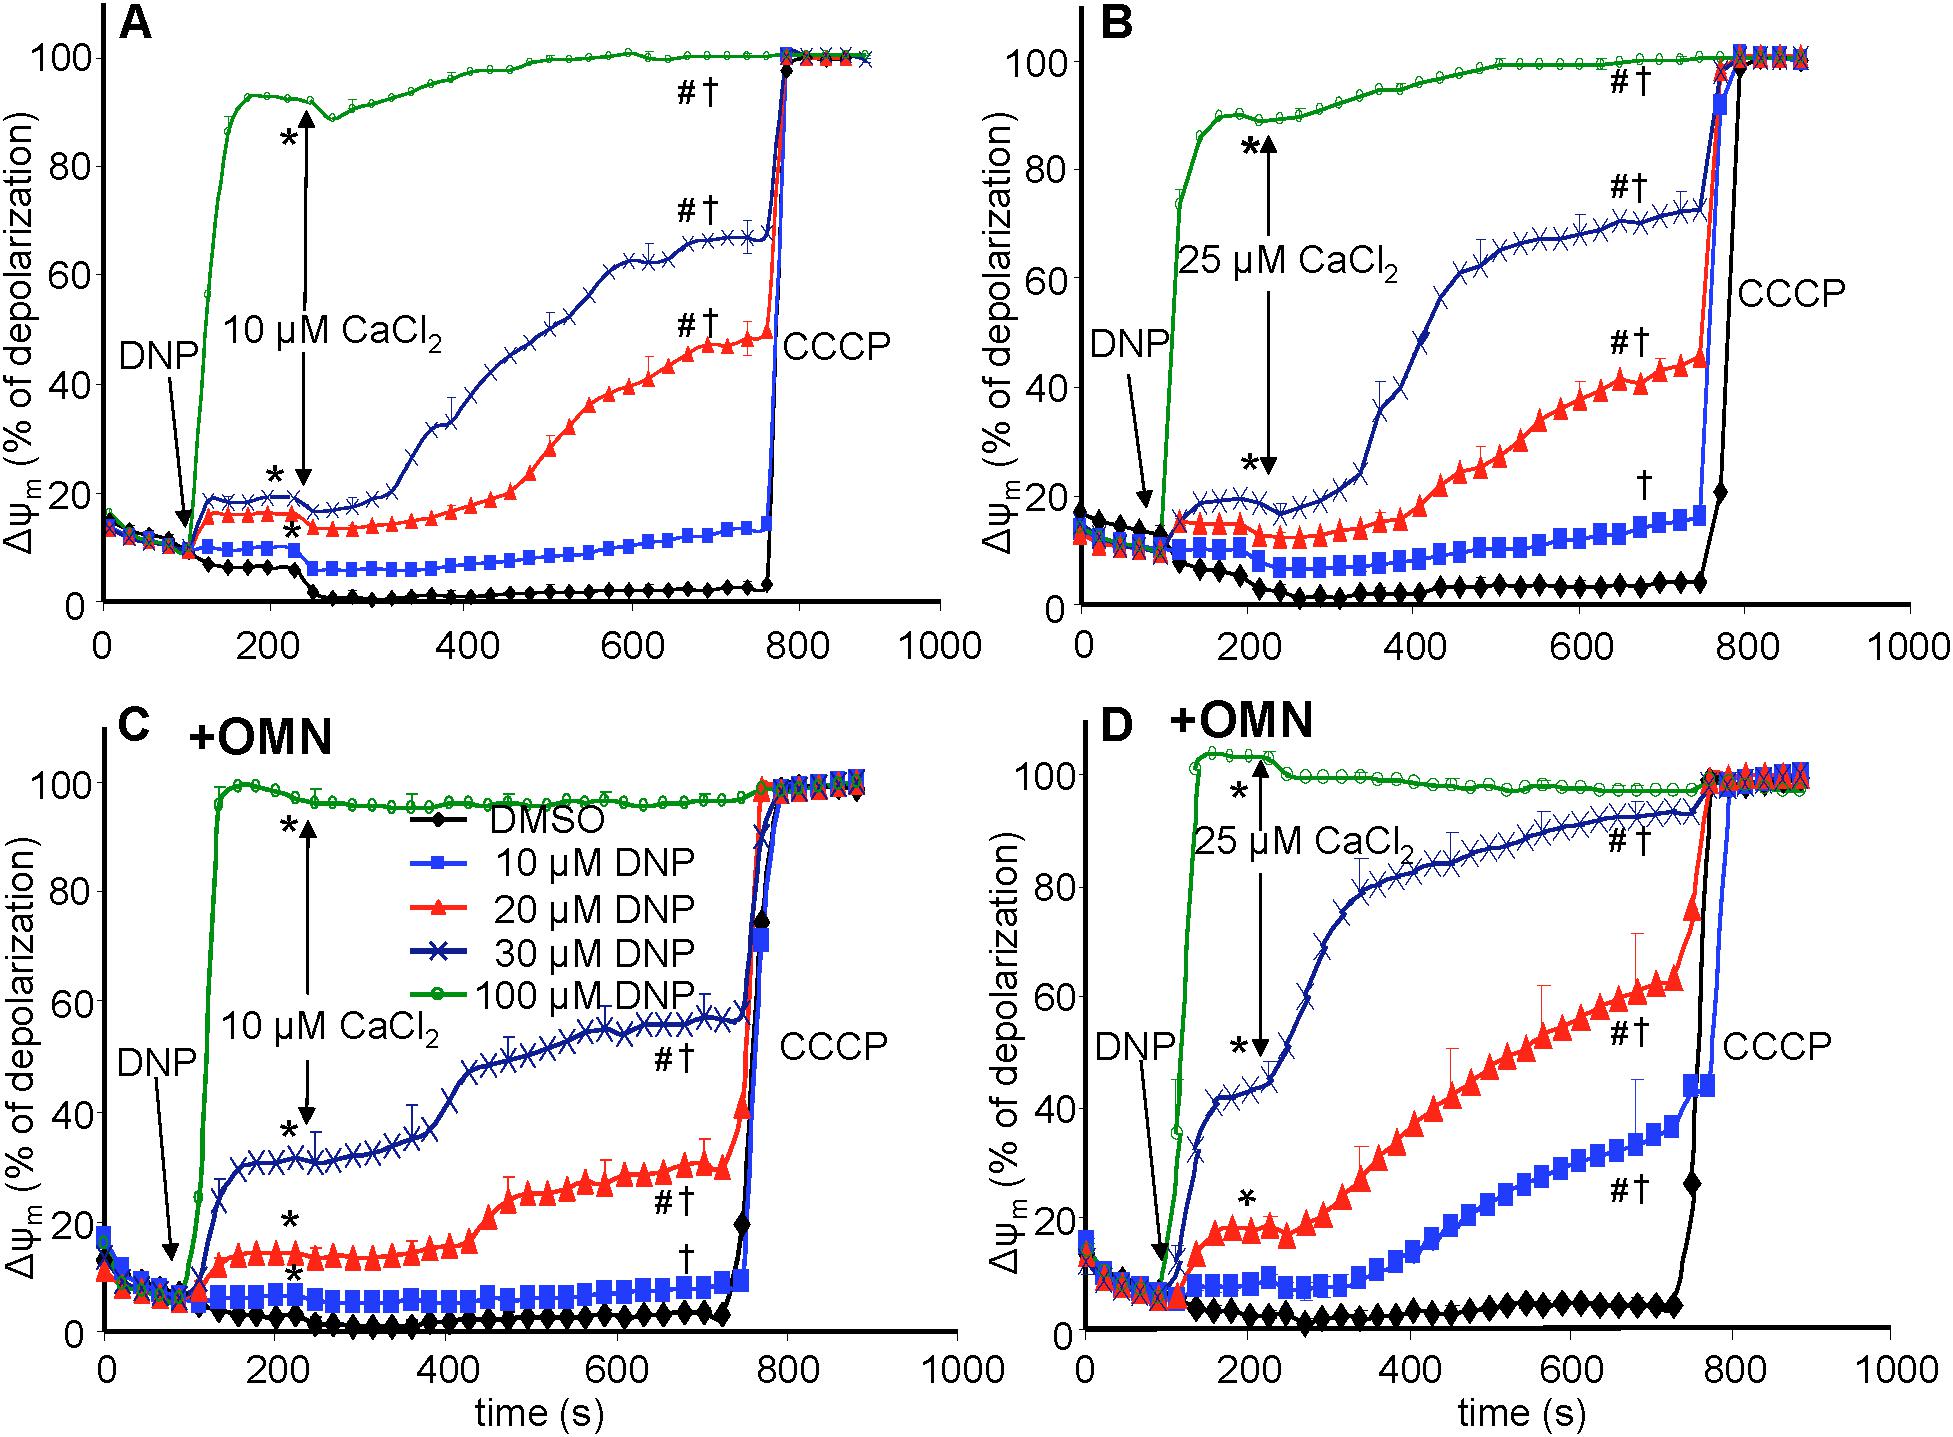
Figure 4. Change in mitochondrial membrane potential (ΔΨm), assessed with rhodamine-123 as % of maximal depolarization, as a function of time after adding dinitrophenol (DNP) and CaCl2 in the absence (A,B) and presence (C,D) of oligomycin (OMN). Note that adding DNP caused a concentration-dependent fall in ΔΨm that was more pronounced in the presence of OMN. Adding CaCl2 caused a small polarization, while increasing depolarization occurred over time. Adding 25 μM CaCl2 (B,D) resulted in a more pronounced fall in ΔΨm compared to 10 μM CaCl2 (A,C). Buffer pH = 7.15. Data obtained from 10 hearts with 4–5 replicates per heart. For P < 0.05: ∗after DNP vs. before DNP; #after CaCl2 vs. before CaCl2; †late (700 s) vs. early (215 s) after CaCl2.
Results
CHEm Activation Was Exposed by Efflux of Ca2+ With Influx of H+ and Was Greater If MCU Was Inhibited
Direct evidence for CHEm activation was observed by acidifying the extra-mitochondrial buffer (low pHe), which subsequently decreased the matrix pHm slowly over time (Figure 1). With NCEm and Na+/H+ (NHEm) inactivated by using Na+-free solutions and substrates, fast mCa2+ influx via the MCU, induced after adding 40 μM CaCl2 at pH 6.9, was followed by a slow mCa2+ efflux over time ∼(300–1700 s) as shown by the increase in extra-mitochondrial [Ca2+]e from <200 nM to nearly 4500 nM in the absence of Ru360 (Figure 1A). When Ru360 was added 90 s after adding CaCl2, [Ca2+]e rose even more over the first 1000 s, indicating blockade of Ca2+ recycling via the MCU and revealing the total mCa2+ effluxed via CHEm. In the pH 6.9 plus Ru360 group the mean rate (slope) of increase in [Ca2+]e (mCa2+ efflux) over time (300–1700 s) was 1.5 ± 0.1 nM/s, ΔpH 0.4 units). This was greater than in the pH 6.9 minus Ru360 group (1.0 ± 0.2 nM/s over 300–1000 s), suggesting that approximately 1/3 of the mCa2+ extruded was retaken up across the IMM via the MCU. In contrast, mCa2+ efflux was not observed in the pH 7.6 medium without Ru360, and minimally at 1500 s at pH 7.6 with Ru360. There was less mCa2+ efflux at pH 7.15 ± Ru360 compared to pH 6.9 ± Ru360. However, even at pH 7.15 ± Ru360, there were similar steady declines in pHe while net slow Ca2+ efflux was noted only in the plus Ru360 groups, indicating Ca2+ re-uptake via MCU. Therefore, in the acidic extra-mitochondrial medium, slow decreases in pHm (H+ influx) were accompanied by slow increases in mCa2+ efflux, indicating CHEm activity. Eventually, matrix acidification was more pronounced in the pH 6.9 medium (ΔpH 0.62 units) in the absence of Ru360 than in all other groups so that over time as H+ influx was exchanged for Ca2+ efflux the IMM ΔpH gradient was eventually obliterated, halting Ca2+ efflux (Figure 1B). Eventually, because of mCa2+ influx, near complete depolarization of ΔΨm occurred in the pH 6.9 medium (Figure 1C), as shown by little change after adding CCCP, and by the complete depolarization of ΔΨm when Ca2+ recycling via the MCU was permitted (minus Ru360 group). Although adding CaCl2 at an external pHe of 6.9 led eventually to near complete dissipation of ΔΨm, when CsA was first added to the buffer, CsA prevented the gradual, slow extrusion of mCa2+ and declines in pHm and ΔΨm induced by adding CaCl2 at pHe 6.9 indicating a complete lack of CHEm activity (see section “Supplementary Results S.2.1” and Supplementary Figures S.1A–C).
Increasing Matrix Acidification Led to Ca2+ Efflux Until Loss of the ΔpHm Gradient and a Lack of Ca2+ Re-uptake via MCU on Full Depolarization of ΔΨm
A plot of extra-mitochondrial [Ca2+]e as a function of matrix [H+]m at each extra-mitochondrial pH (Figure 2) indicates maximal mCa2+ efflux occurred in the pHe 6.9 medium (largest IMM (ΔH+] gradient), much less so in the pH 7.15 medium, and not at all in the pH 7.6 medium. Ca2+ efflux was accentuated in the presence of Ru360 given just after the added CaCl2 bolus (Figure 2). The difference (arrow) between the absence and presence of Ru360 indicates the rapid reuptake (recycling) of Ca2+ via MCU on extrusion via CHEm. Thus total Ca2+ efflux was greater in the pH 6.9 group when MCU was not blocked because [H+]m rose higher than when MCU was blocked. The steep, vertical increase in mCa2+ efflux at the highest [H+]m in the pH 6.9 group resulted from cessation of mCa2+ reuptake via MCU due to depolarization of ΔΨm (Figure 1C). The net amount of H+ entering mitochondria per Ca2+ exiting mitochondria may be indeterminate because much of the H+ entering is pumped out via the respiratory enzyme complexes.
Mitochondrial Membrane Potential (ΔΨm) Was Depressed by DNP After Adding CaCl2
In the protonophore series of experiments (time line, Figure 3), DNP alone decreased ΔΨm slightly as assessed by rodamine-123 (R123) (Huang et al., 2007) (Figure 4), in a concentration-dependent manner, except at 100 μM DNP, which alone fully (+OMN) or nearly (-OMN) depolarized ΔΨm. ΔΨm was estimated as % of maximal depolarization, where the baseline after adding substrate with OMN signifies full polarization (0%) and addition of CCCP denotes complete depolarization (100%). Adding 10 μL of 0.1% DMSO (DNP vehicle) or 10 μM DNP had no significant effect when given before CaCl2, whereas adding 20, 30, or 100 μM DNP before 10 μM CaCl2 reduced the R123 ΔΨm signals by 12.7, 18.7, and 92.4% vs. DMSO (Figure 4A), respectively. In the presence of OMN (Figure 4C), adding 20, 30, or 100 μM DNP before 10 μM CaCl2 increased the fluorescence signal intensities (i.e., depolarized ΔΨm) by 16.2, 33.0, and 99.0%, respectively, vs. DMSO (0%). Overall, before adding either 10 or 25 μM CaCl2, 20 and 30 μM DNP moderately decreased ΔΨm in the absence of OMN but greatly decreased ΔΨm in the presence of OMN, suggesting blocked proton pumping from complex V (Figures 4C,D vs. Figures 4A,B). If no CaCl2 was given after DNP, the moderate decrease in ΔΨm, which was unaffected by CsA, persisted for up to 25 min (see section “Supplementary Results S.2.5” and Supplementary Figure S.7A). After adding 10 and 30 μM DNP, and then CaCl2, there were large decreases in ΔΨm resulting from entry of Ca2+. Although ΔΨm depolarization by DNP alone was unaffected by CsA, the subsequent slow ΔΨm depolarization induced by 25 μM CaCl2 was delayed by CsA (Supplementary Figure S.7B). Supplementary Results S.2.3 and Supplementary Figures S.3A–D shows statistics on mean ± SEM data for ΔΨm replotted from Figure 4 at time points 215, 275, and 700 s.
Matrix Free [Ca2+]m Rose or Fell Slowly Depending on Block of Complex V
Adding 10 μM CaCl2 without DNP (ΔΨm fully polarized) caused [Ca2+]m to increase rapidly from 80 nM (no added CaCl2) initially to 235 nM at 300 s, whereas after adding 25 μM CaCl2, [Ca2+]m rose more rapidly to 450 nM (Figures 5A,B); [Ca2+]m remained unchanged over time (300–750 s) after adding 10 μM CaCl2 but fell slightly and gradually (non-significantly) over time after adding 25 μM CaCl2 (DMSO group, Figures 5A,B). After adding 10–30 μM DNP, adding 10 μM CaCl2 promoted a slow, secondary rise in [Ca2+]m (Figure 5A). The secondary, slow increase in [Ca2+]m beginning 300 s after adding 10 μM CaCl2 plus DNP was accompanied by a slow decrease in extra-mitochondrial [Ca2+]e (see Supplementary Figure S.6A). When ΔΨm was nearly or totally depolarized by 100 μM DNP in the absence of OMN, and after adding 10 μM CaCl2, there was no change in [Ca2+]m over 300–750 s and thus no mCa2+ uptake over time (Figure 5A). [Ca2+]m slowly increased over 300–750 s after first adding 10 and 20 μM DNP and then 25 μM CaCl2 (Figure 5B), which caused the slow declines in ΔΨm (Figure 4B). In the 100 μM DNP group [Ca2+]m increased moderately immediately after adding 25 μM CaCl2, but did not change further over time. Supplementary Results S.2.6 and Supplementary Figures S.4A,B display statistics on mean ± SEM data for [Ca2+]m replotted from Figure 5 (-OMN) at time points 215, 275, and 700 s.

Figure 5. Change in [Ca2+]m as a function of time (A,B) after adding DNP and CaCl2 in the absence of OMN. Adding DNP did not alter [Ca2+]m, per se, but did affect [Ca2+]m depending on [DNP] and the amount of CaCl2 added in the absence of OMN. Adding 10 μM CaCl2 (A) caused a smaller increase in [Ca2+]m than 25 μM CaCl2 (B). In the absence of OMN the effect of DNP on [Ca2+]m was less concentration-dependent and [Ca2+]m continued to increase over time. Initial, rapid rates (averaged over 7 s) of increases in [Ca2+]m (nM/s) as a function of [DNP] (C,D) just after adding CaCl2 in the absence of OMN. The rate of increase in [Ca2+]m decreased as the degree of ΔΨm depolarization increased with increasing [DNP]. Note different Y-axis scales for 10 and 25 μM CaCl2. See Figure 4 for statistical notation for (A–D) plots. Much slower rates of increase in [Ca2+]m (pM/s) occurred over time (slopes of data between 300 and 750 s) after the initial CaCl2 bolus (E,F); the additional slow mCa2+ uptake was also dependent on ΔΨm. Buffer pH = 7.15. Data obtained from seven hearts with 3–4 replicates per heart. For plots (E,F), P < 0.05: ∗DNP vs. DMSO.
In marked contrast, when complex V was blocked by OMN, adding 10 μM CaCl2 (Figure 6A) after adding10–30 μM DNP caused a marked decrease in [Ca2+]m over time (300–750 s); after adding 25 μM CaCl2 in the absence of DNP (Figure 6B), [Ca2+]m rose higher initially, whereas 10–30 μM DNP caused a slow decrease in [Ca2+]m over this period, indicating net mCa2+ efflux. Supplementary Results S.2.6 and Supplementary Figures S.4C,D shows statistics on mean ± SEM data for [Ca2+]m replotted from Figure 6 (+OMN) at time points 215, 275, and 700 s. The secondary, slow decrease in [Ca2+]m after adding 20 μM DNP plus 25 μM CaCl2 was accompanied by an increase in extra-mitochondrial [Ca2+]e (see Supplementary Figure S.6B). Note that additional mCa2+ uptake after giving 25 μM CaCl2 was halted after adding Ru360, 90 s later (at t = 325 s) and converted to mCa2+ efflux in the presence of OMN as shown by the increase in [Ca2+]e (see Supplementary Figures S.6B vs. S.6A).
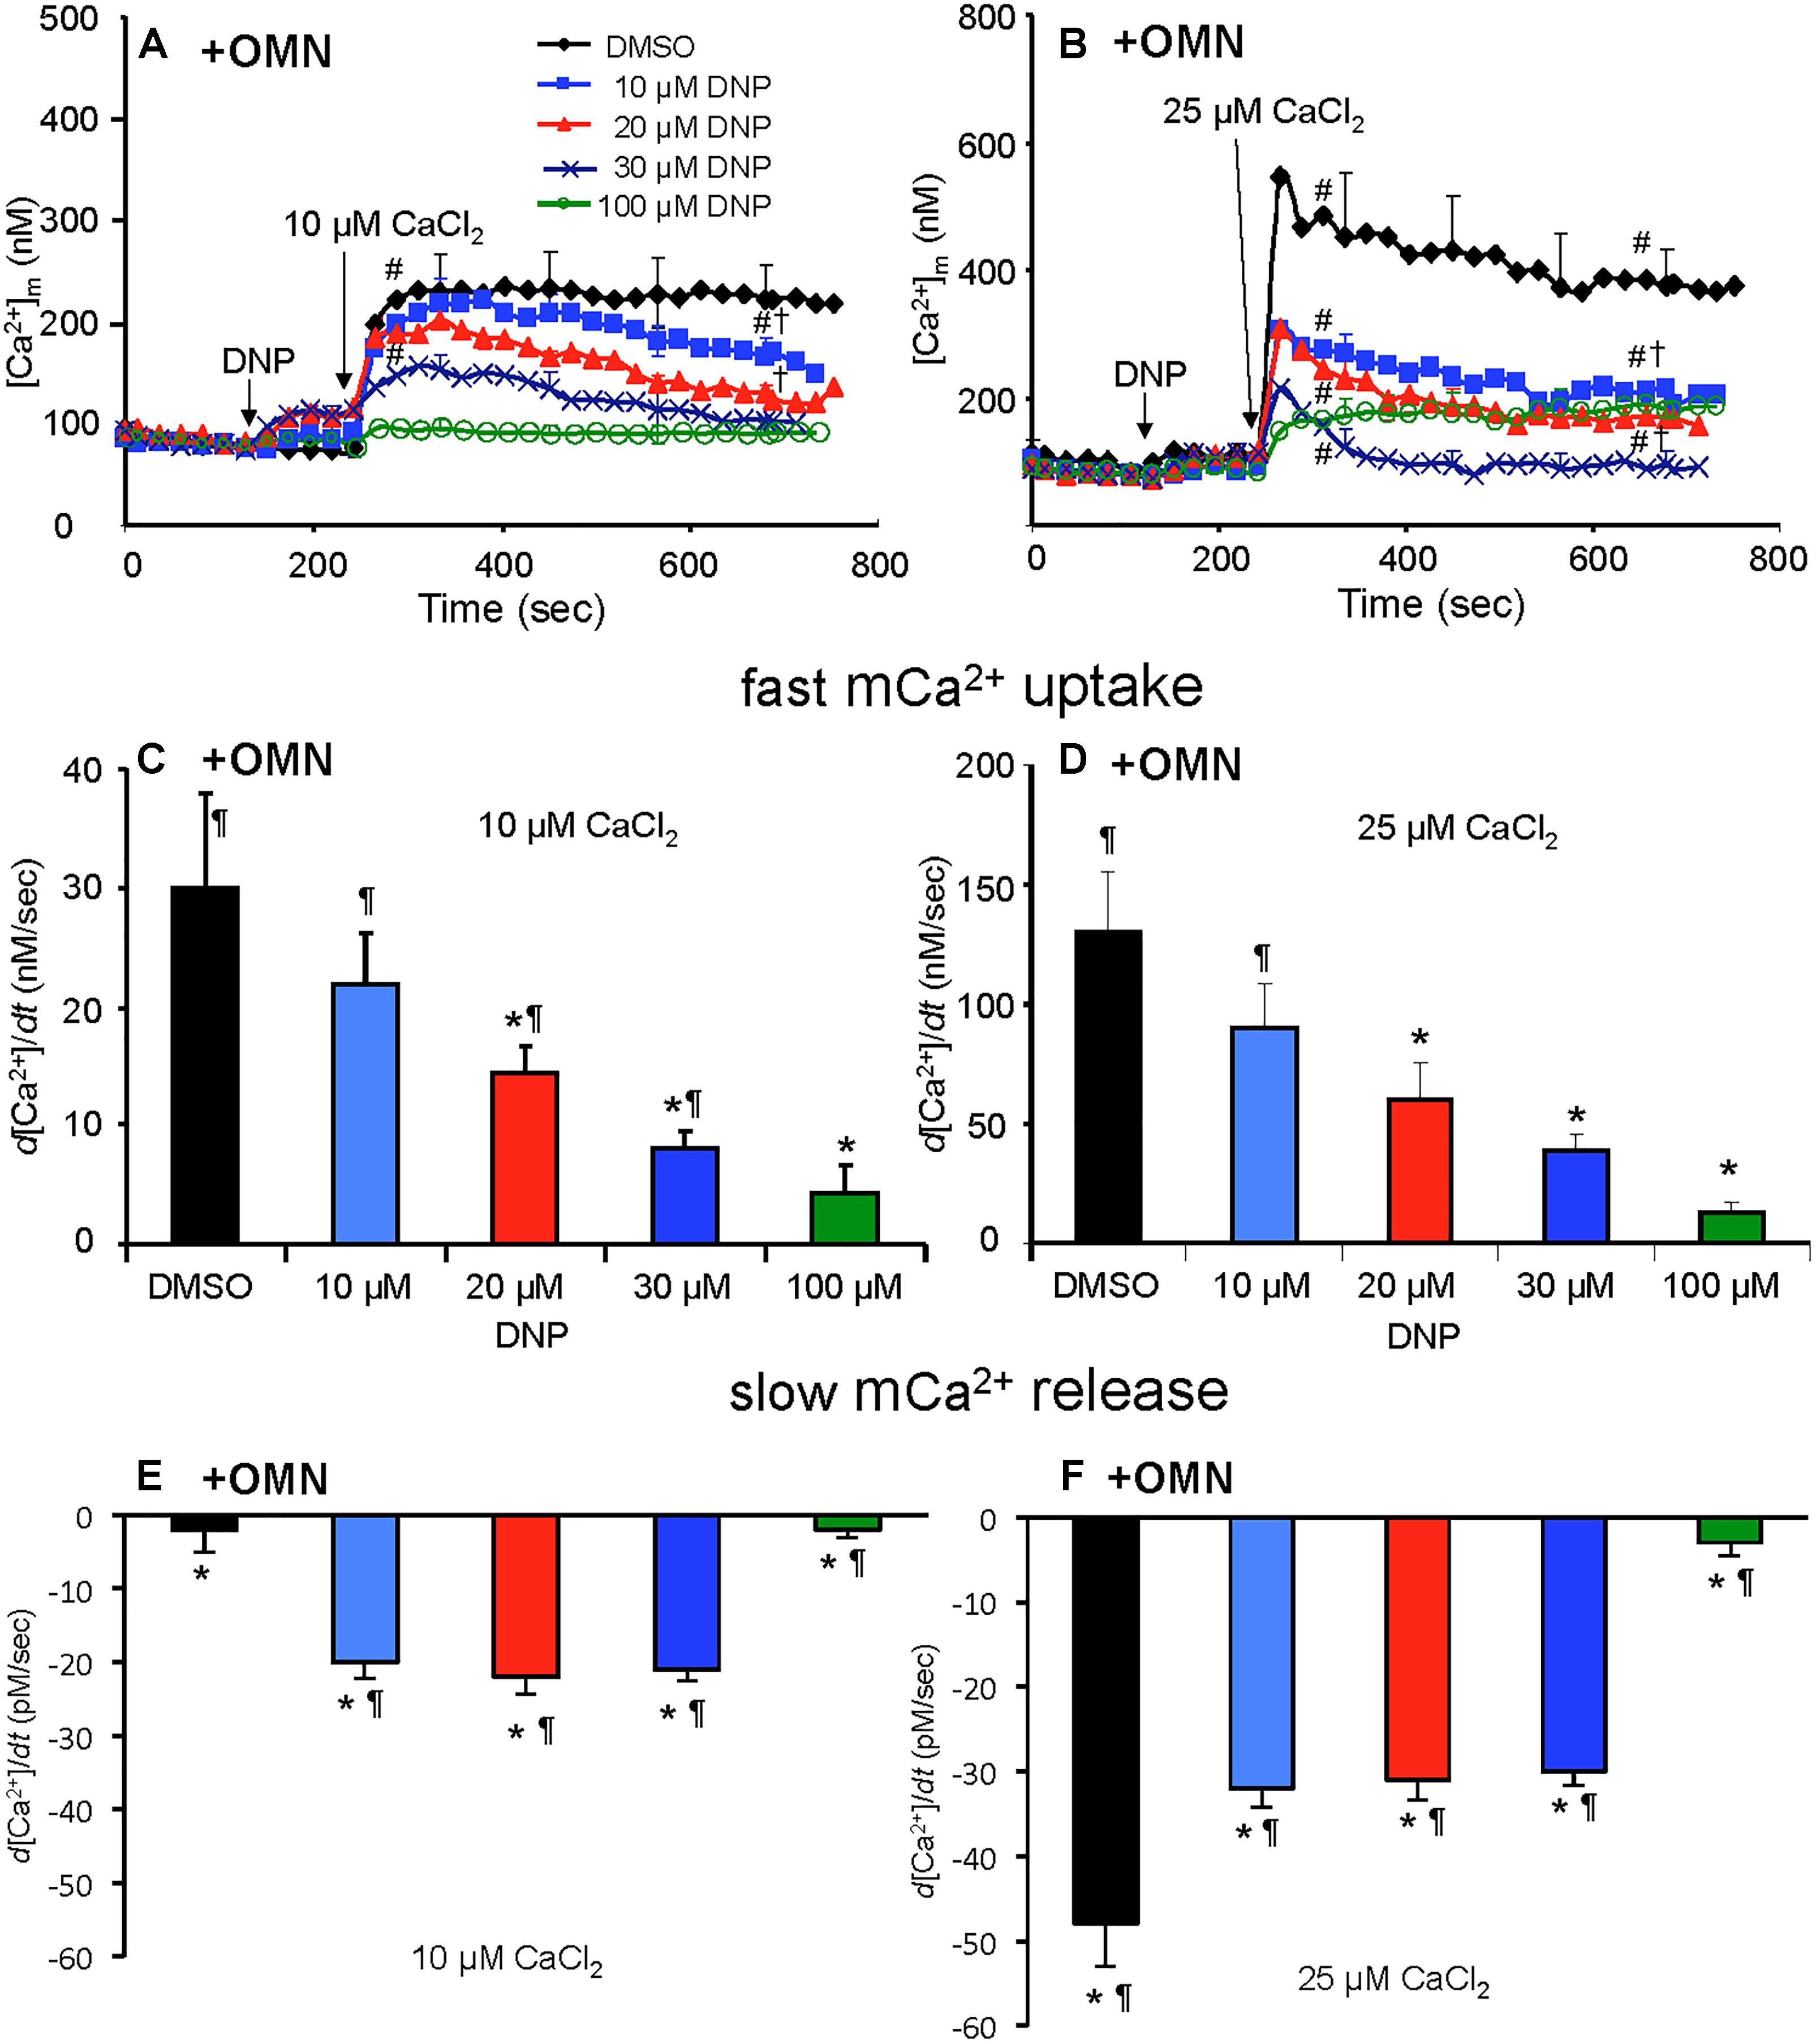
Figure 6. Change in [Ca2+]m as a function of time (A,B) after adding DNP and CaCl2 in the presence of OMN. Adding DNP did not alter [Ca2+]m, per se, but did affect [Ca2+]m depending on [DNP], the amount of CaCl2 added, and the presence of OMN. Adding 10 μM CaCl2 (A) caused a smaller increase in [Ca2+]m than 25 μM CaCl2 (B). In the presence of OMN, DNP caused concentration-dependent decreases in [Ca2+]m over time. Initial, rapid rates (averaged over 7 s) of increase in [Ca2+]m (nM/s) as a function of [DNP] (C,D) just after adding CaCl2 in the presence of OMN. The rate of increases in [Ca2+]m decreased as the degree of ΔΨm depolarization increased with increasing [DNP]. See Figure 4 for statistical notation for (A–D) plots. A slow rate of decrease in [Ca2+]m (pM/s) occurred over time (slopes of data between 300 and 750 s) after the initial CaCl2 bolus (E,F); the slow mCa2+ efflux was dependent on slow mCa2+ influx (hidden by OMN treatment) (see Figure 6 vs. Figure 5) and a slow fall in matrix pH and ΔΨm. Note different Y-axis scales for 10 and 25 μM CaCl2. Buffer pH = 7.15. Data obtained from seven hearts with 3–4 replicates per heart. For plots (E,F), P < 0.05: ∗DNP vs. DMSO. ¶+OMN vs. —OMN (Figure 5) for same [DNP].
A summary of slope data collected over the first 7 s (1 sample/s) after adding 10 or 25 μM CaCl2 in the absence (Figures 5C,D) or presence (Figures 6C,D) of OMN shows that the average initial, rapid increase in [Ca2+]m via the MCU was much faster after adding 25 μM CaCl2 than after 10 μM CaCl2 in the ± OMN groups; this initial rate of mCa2+ uptake decreased as ΔΨm fell with added DNP. The initial rate of increase in [Ca2+]m during the first 7 s after adding 10 μM CaCl2 (Figure 5C) decreased from 8 to 2 nM/s (DNP 0–100 μM). After adding 25 μM CaCl2 (Figure 5D), the rate decreased from 88 to 20 nM/s. In the presence of OMN (Figures 6C,D), the initial increases in [Ca2+]m in fully coupled mitochondria (no DNP) were larger than those in the absence of OMN (Figures 6C,D vs. Figures 5C,D). With OMN present, the initial increases in [Ca2+]m decreased from 30 to 4 nM/s after adding 10 μM CaCl2 and from 130 to 13 nM/s after adding 25 μM CaCl2, Thus the initial rates of increase in [Ca2+]m with 10 μM CaCl2 were consistently faster in the presence of OMN (Figure 6C vs. Figure 5C), and at 25 μM CaCl2, with or without 10 μM DNP (Figure 6D vs. Figure 5D).
A summary of slope data collected between 300 and 750 s, i.e., after the initial, rapid increase in [Ca2+]m via the MCU with added 10 μM CaCl2, demonstrates a much slower and smaller (pM/s) gradual increase in [Ca2+]m over time in the absence of OMN with a threefold greater slope after 30 μM DNP vs. DMSO (Figure 5E). After adding 25 μM CaCl2, the slow increase in [Ca2+]m was about fourfold higher after 20 μM DNP vs. DMSO (Figure 5F). The secondary slow rise in [Ca2+]m was about 1000 times slower than the initial fast phase and roughly dependent on both the amount of mCa2+ that was taken up initially just after adding CaCl2 and the extent of ΔΨm depolarization. In contrast, in the presence of OMN under the same conditions of added CaCl2 and DNP, the slope data showed slow and small declines (rather than increases) in [Ca2+]m over time (Figures 6E,F). The slow rate of extrusion of mCa2+ by CHEm when complex V was blocked with OMN (Figures 6E,F) became greater when mCa2+ entry via the MCU was greater (Figures 6 A,B).
Matrix pH Remained Steady Without OMN but Fell With OMN-Induced Block of Complex V
Baseline matrix pHm was approximately 7.55 in each group after adding PA and before adding DNP (Figures 7A–D). In the absence of OMN, adding 10–30 μM DNP did not result in a significant net decrease in pHm; however, 100 μM DNP markedly decreased pHm (Figures 7A,B). This effect to collapse the ΔpHm gradient was proportional to the collapse of the ΔΨm gradient (Figure 4). In the absence of OMN, adding CaCl2 had no appreciable effect on pHm (ΔΨm partially depolarized) even in the presence of DNP, except for 100 μM DNP, when pHm fell markedly (ΔΨm fully depolarized) (Figures 7A,B). In the absence of OMN, H+ influx was matched by H+ pumping as pHm did not change appreciably. In contrast, in the presence of OMN there was a strong DNP concentration-dependent fall in matrix pHm (Figures 7C,D) after adding CaCl2. This fall in pHm was likely due to blocked H+ pumping by complex V in the presence of OMN (see below). Supplementary Figures S.5A–D shows statistics on mean ± SEM data on pHm replotted from Figure 7 (main text) at time points 215, 275, and 700 s. Supplementary Figure S.8 displays plots of pHm as a function of [Ca2+]m at 700 s after adding DNP and CaCl2; these correlations show how [Ca2+]m decreases while pHm decreases in the presence, but not in the absence of OMN.
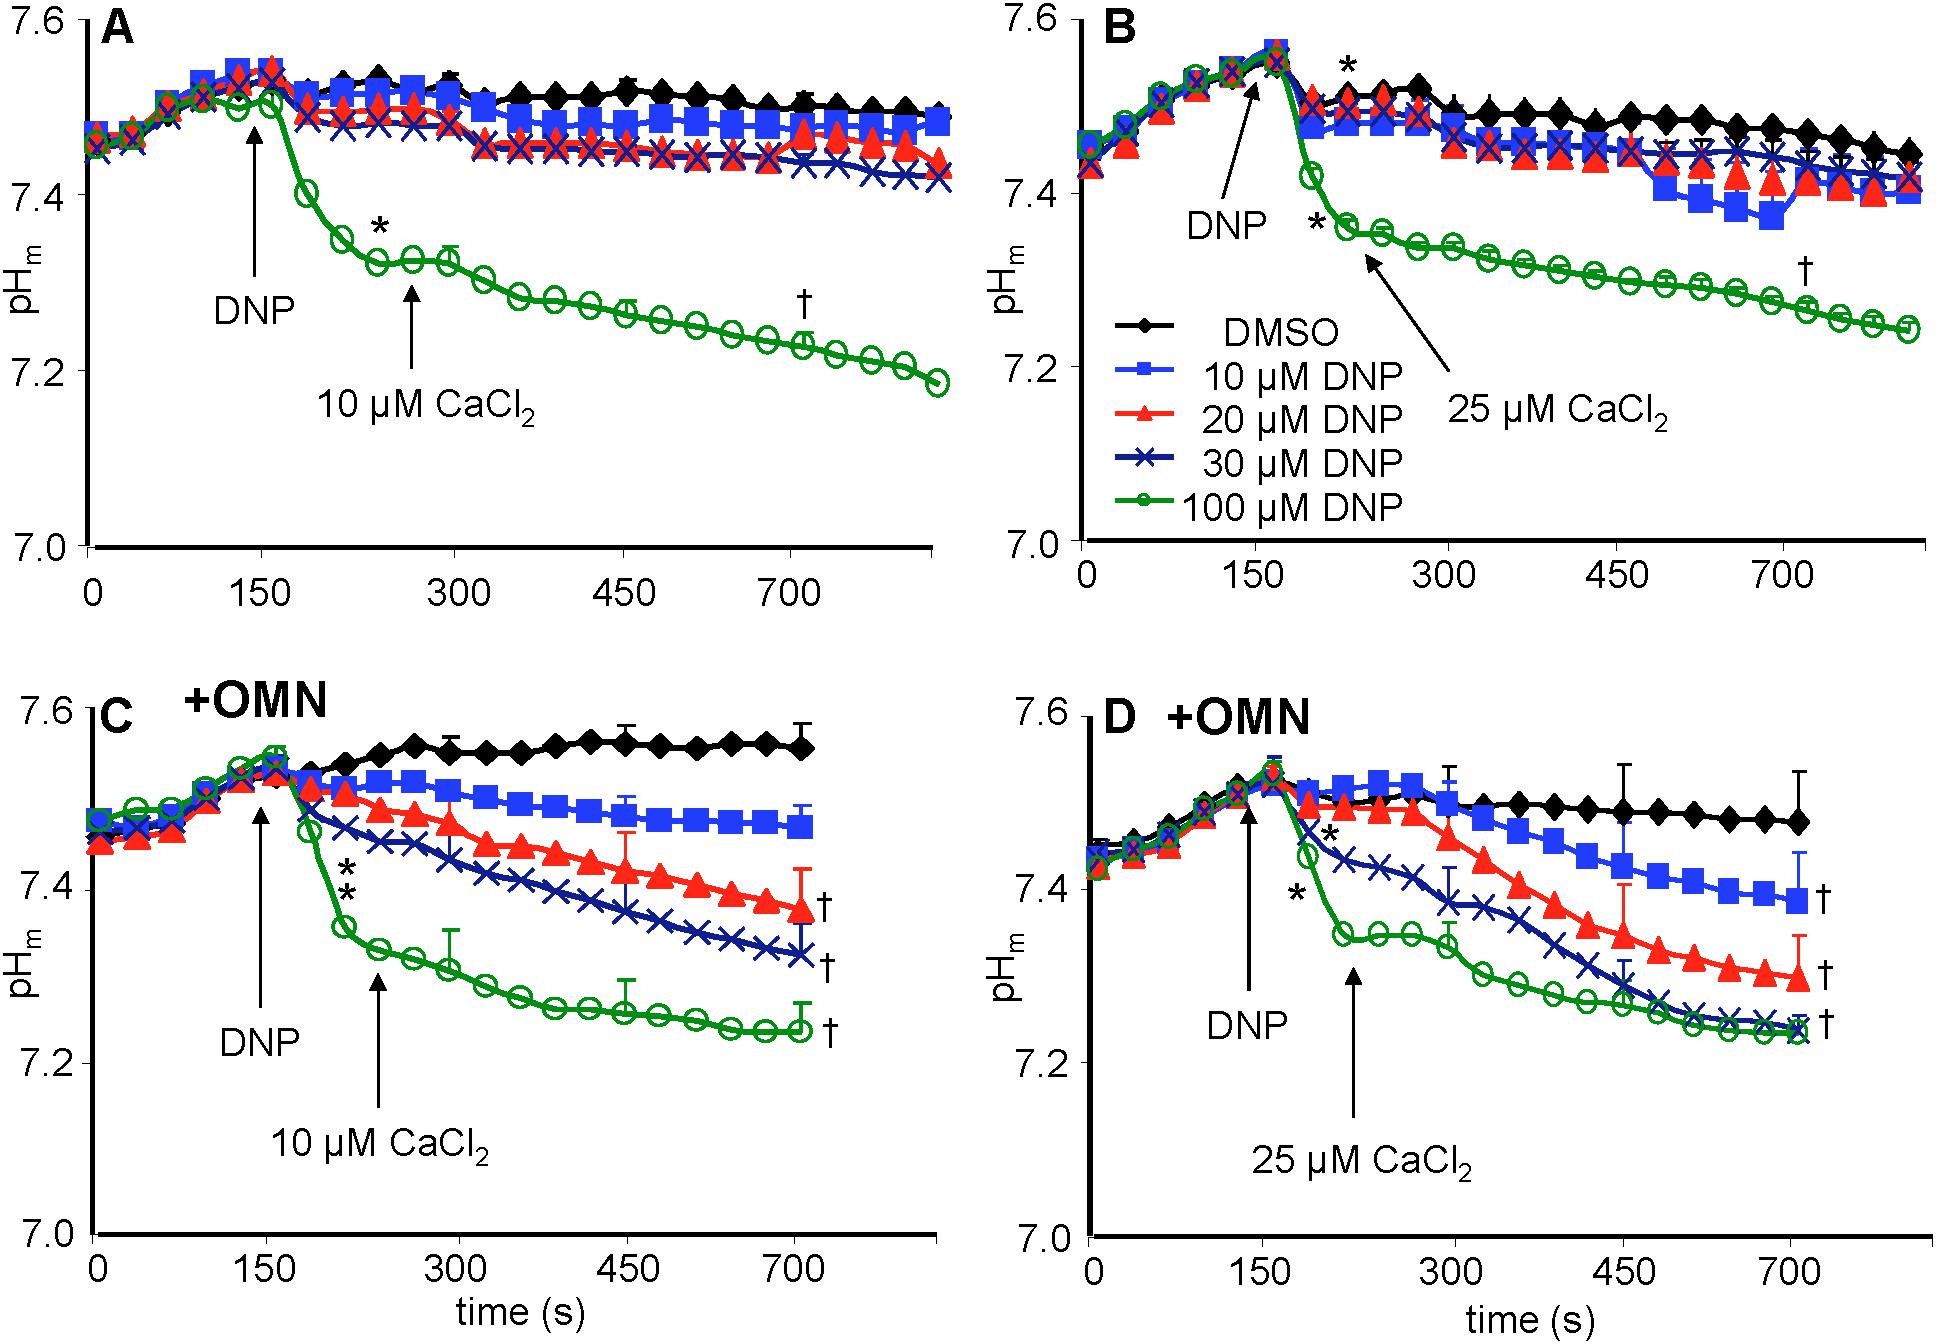
Figure 7. Change in pHm, measured with BCECF, as a function of time after adding DNP and CaCl2 in the absence (A,B) or presence (C,D) of OMN. Note that except for 100 μM DNP, neither DNP nor added CaCl2 altered pHm in the absence of OMN (A,B). However, in the presence of OMN (C,D) graded decreases of ΔΨm by DNP caused a graded increase in matrix acidity that was further increased in the presence of added CaCl2 (C,D). Buffer pH = 7.15. Data obtained from 10 hearts with 3–4 replicates per heart. For P < 0.05: ∗after DNP vs. before DNP; †late (700 s) vs. early (215 s) after adding CaCl2.
Mitochondrial Redox State Remained Steady Without OMN but Fell With OMN-Induced Block of Complex V
A reduced redox state is associated with maintenance of pHm. Adding the substrate PA increased the redox state (more reduced) as determined by high NADH autofluorescence (Figure 8). In the absence of OMN, adding 10 to 30 μM DNP ± 10 or 25 μM CaCl2 (Figures 8A,B) did not cause a significant change in NADH. NADH was unchanged despite up to 60% decrease in ΔΨm fluorescence (Figures 4A,B) after adding DNP and CaCl2. However, when complex V was blocked by OMN (Figures 8C,D), there was significant oxidation (low NADH) by DNP in a concentration dependent manner. In contrast to the condition without OMN, with OMN present as little as a 20% fall in ΔΨm fluorescence (Figures 4C,D) led to a more oxidized NADH state. Moreover, NADH was fully oxidized at 20 μM DNP with OMN present (Figures 8C,D), and the oxidized state was not altered significantly by adding CaCl2 after DNP. In the absence or presence of CaCl2, NADH was completely oxidized after adding 100 μM DNP (data not shown).
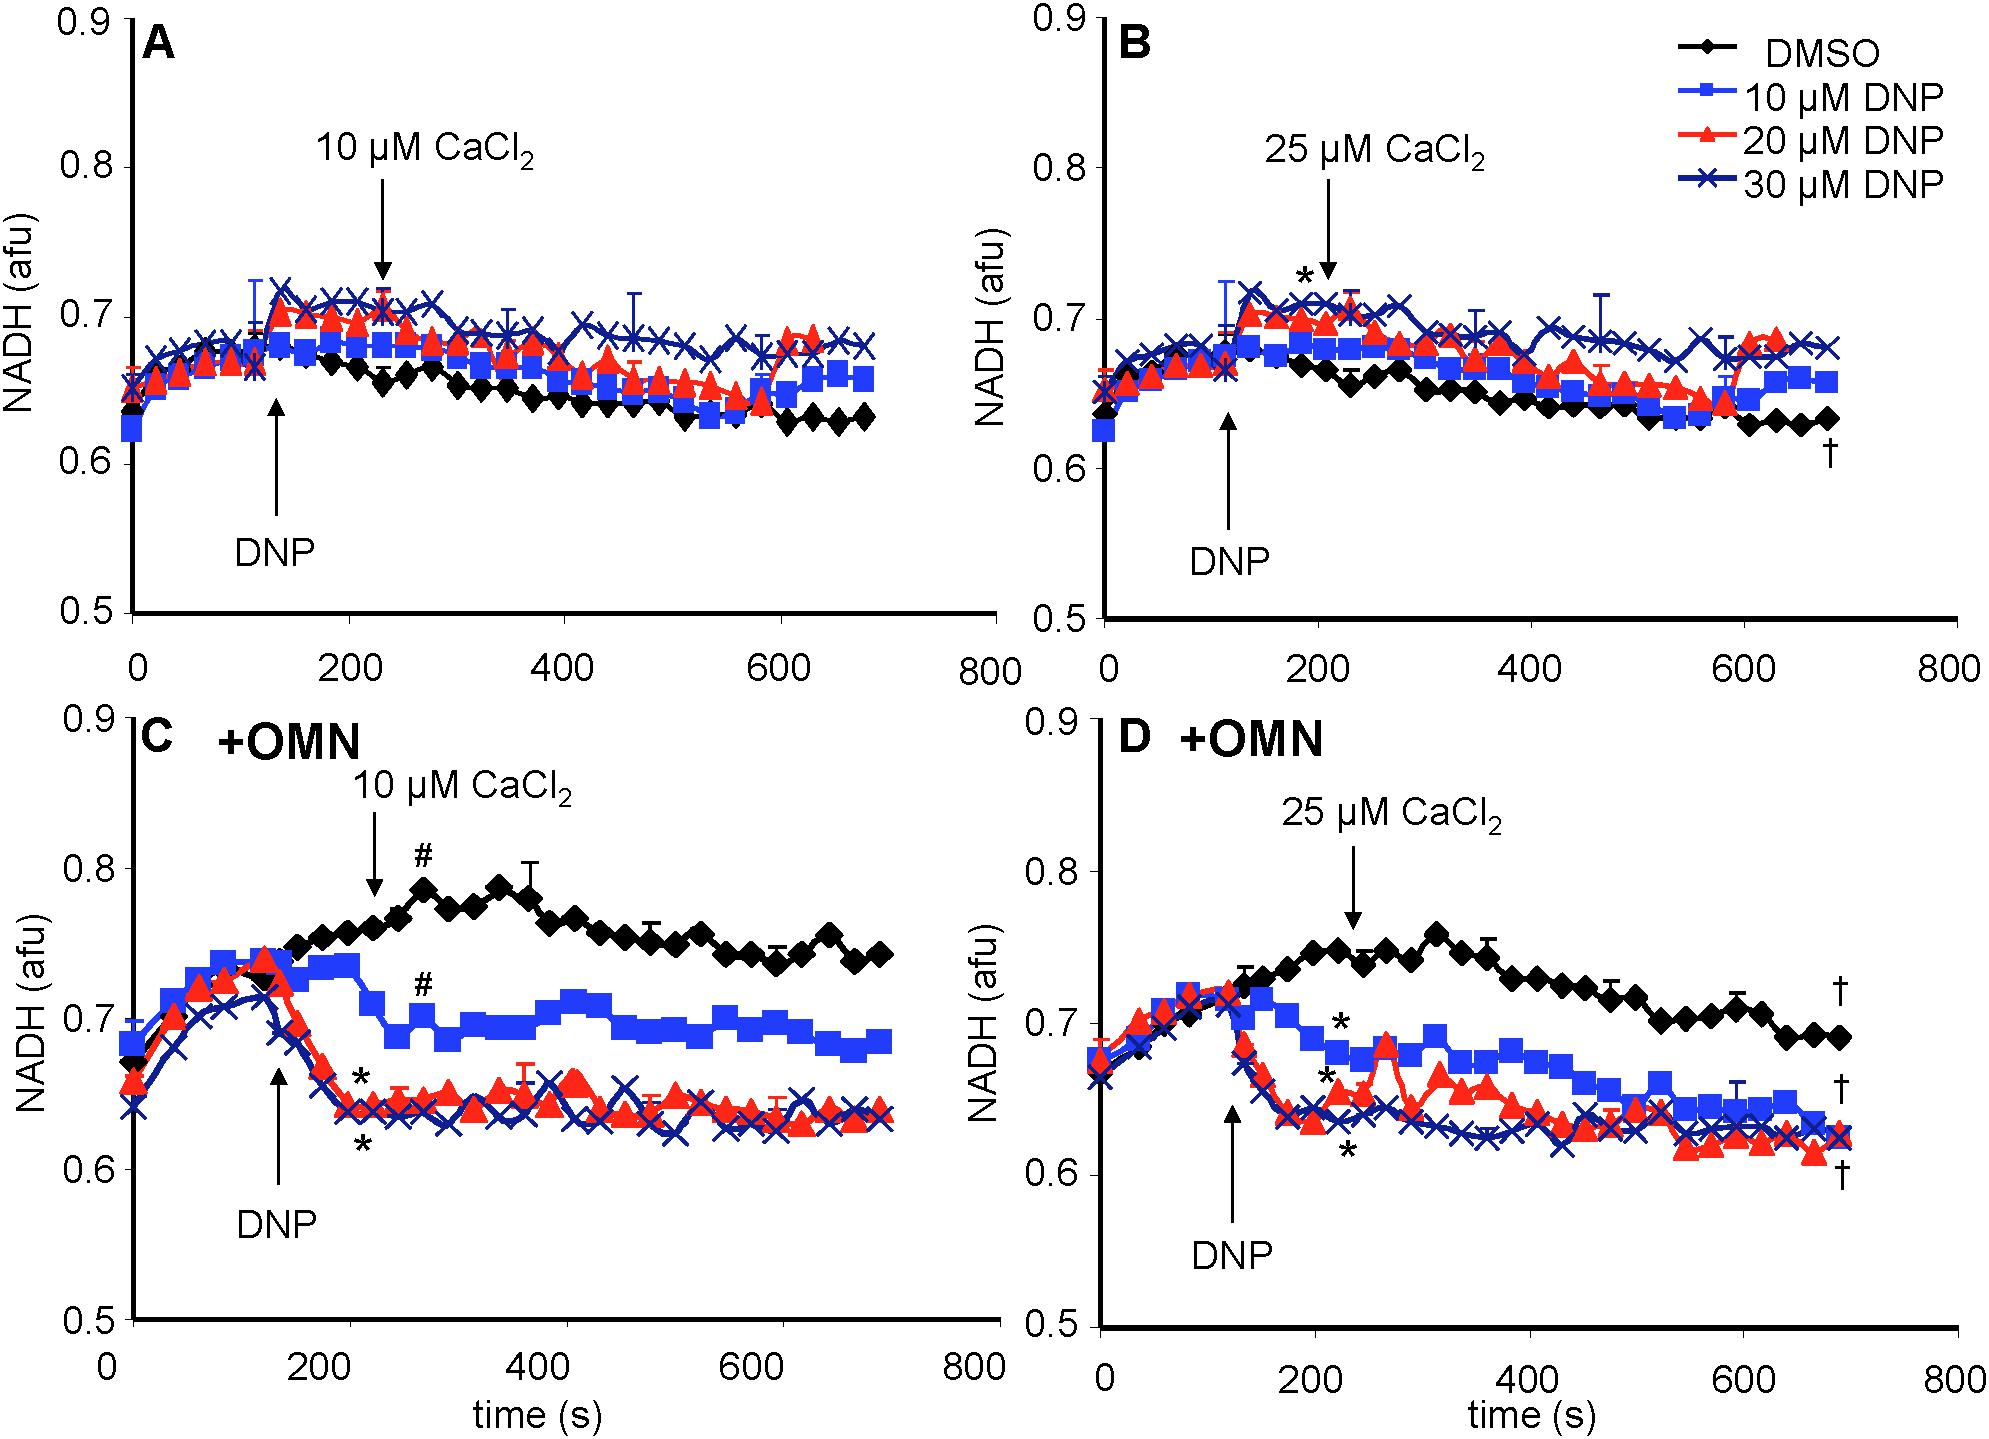
Figure 8. Change in mitochondrial redox state, measured by NADH autofluorescence, as a function of time after adding DNP and CaCl2 in the absence (A,B) or presence (C,D) of OMN. Note that the redox state was maintained after adding 10–30 μM DNP and CaCl2 in the absence of OMN (A,B) but that in the presence of OMN (C,D) there was a concentration-dependent decrease in NADH autofluorescence. Adding CaCl2 did not alter DNP-induced changes in redox state in the presence of OMN. Buffer pH = 7.15. Data obtained from eight hearts with 3–4 replicates per heart. See Figure 4 for statistical notation.
ATP Concentration Fell Without OMN but Remained Steady With OMN-Induced Block of Complex V
Total medium [ATP] was measured and mitochondrial [ATP]m was estimated (see section “Supplementary Materials S.1.10”). Basal [ATP]m was measured after adding mitochondria to the experimental buffer in the absence of OMN (Figures 9A,B). There was no change in basal [ATP]m after adding PA. DNP, at 10 μM, did not significantly change [ATP] before or after adding CaCl2 (Figures 9A,B). Basal [ATP]m was unchanged if CaCl2 was not added (data not displayed). Adding 20 or 30 μM DNP alone had no significant effect on [ATP]m, but adding CaCl2 resulted in a decrease in [ATP]m (Figures 9A,B). In the presence of OMN (Figures 9C,D), adding mitochondria to the buffer did not change [ATP]m, indicating inhibited complex V activity. [ATP]m remained at a very low level and was unaffected by DNP or CaCl2 in the presence of OMN. With OMN present, ATPm/ADPm ratios (see section “Supplementary Materials S.1.11, S.1.12 and Supplemental Results S.2.9”) also decreased with added DNP and CaCl2, along with the progressive declines in ΔΨm.
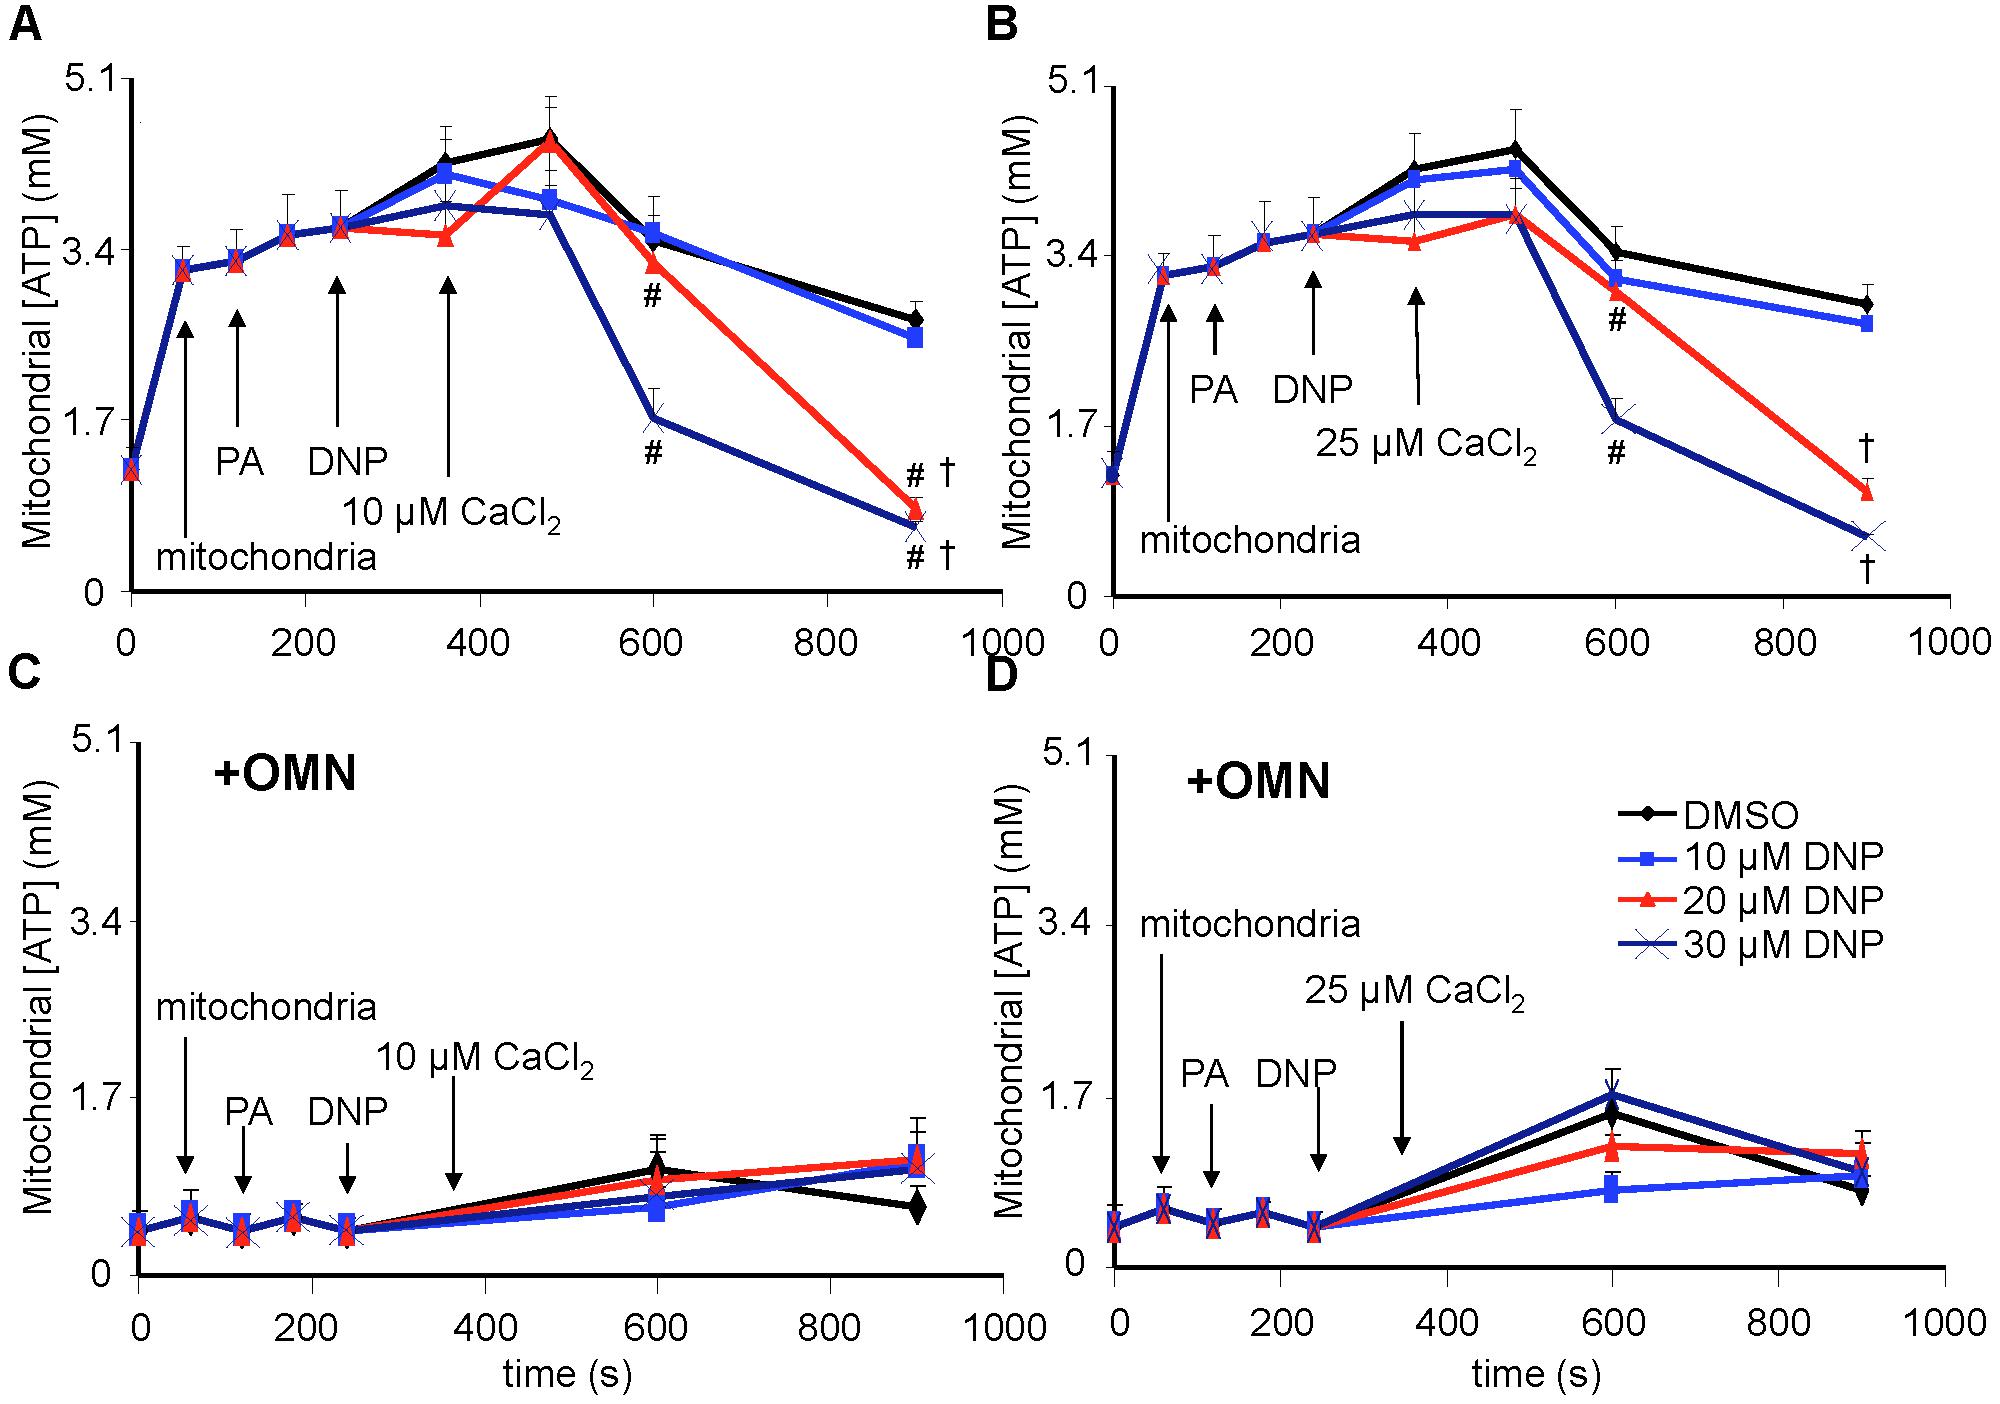
Figure 9. [ATP], measured in total solution by the luciferin-luciferase reaction, and expressed as the calculated mitochondrial [ATP], was altered as a function of DNP and added CaCl2 in the absence (A,B) and presence (C,D) of OMN. Adding mitochondria to the respiration buffer (first arrow) increased [ATP]; adding pyruvic acid (PA) and DNP had no additional effect; but adding CaCl2 after DNP in the absence of OMN resulted in concentration-dependent decreases in [ATP] as graded depolarization of the IMM occurred (Figure 4). FOF1-ATP synthase/ase activity was near zero and remained essentially unchanged after adding PA, DNP, and CaCl2 in the presence of OMN (C,D). Note that [ATP] was not measured continuously, so the lines between sampling points do not represent averaged data for any given intermediate time period between points. ADP/ATP ratio results are also given (see section “Supplementary Materials S.1.1, S.1.12 and Supplementary Results S.2.9”). Data obtained from 20 hearts. See Figure 4 for statistical notation.
Additional Supplemental Comparisons and Calculations
Supplementary Results S.2.2 and Supplementary Figure S.2 demonstrate the effect of adding DNP and CaCl2 on respiration. Supplementary Results S.2.7 and Supplementary Figure S.9 furnish values for ΔΨm, [Ca2+]m, and pHm at 700 s, replotted from Figures 4–7, to compare these results in the presence or absence of OMN. The Supplementary Table shows DNP concentrations that produced 50% inhibitions (IC50) of ΔΨm, [Ca2+]m, fast (initial) d[Ca2+]m/dt, and pHm as a linear function of 0–30 μM DNP ± OMN at the 700 s time point. Supplementary Figure S.10 displays calculated mCa2+ flux rates (JCHE) for CHEm (see section “Supplementary Results S.2.8”) in the absence and presence of OMN.
Discussion
Ca2+/H+ Exchange Activity Is Identified by Manipulating IMM Δ[H+] and Δ[Ca2+] Gradients
We provide firm support for a role of CHEm in maintaining homeostasis of Ca2+ against H+ under certain conditions in cardiac cell mitochondria that may mimic some sequelae of cardiac IR injury. Our results: (1) furnish direct evidence for CHEm activity by the secondary, slow increases in matrix Ca2+ efflux coupled to slow increases in matrix H+ influx, when both NCE and NHE activities are blocked, and particularly, when MCU-dependent mCa2+ re-uptake is blocked with Ru360; (2) demonstrate that respiration increases while ΔΨm decreases mildly, whereas pHm and redox state are relatively maintained when inducing a matrix inward H+ leak with DNP before adding CaCl2; adding CaCl2 results in a secondary, slow increase in [Ca2+]m that slowly depolarizes ΔΨm; (3) show that with permissive H+ influx, but inhibited outward H+ pumping at complex V, adding CaCl2 causes larger decreases in ΔΨm, pHm, and NADH and results in a slow decrease in [Ca2+]m; (4) indicate that blocking complex V with OMN to prevent H+ pumping causes ΔΨm to further decrease after adding CaCl2 because the influx of mCa2+ via the MCU is not opposed by H+ pumping at complex V; (5) suggest that the lack of a slow fall or rise in [Ca2+]m in the presence of 100 μM DNP is due to the loss of ΔΨm-dependent mCa2+ uptake by MCU; (6) point out that only in partially depolarized mitochondria does added CaCl2 result in a pHm-independent gradual increase in [Ca2+]m that is reciprocated by H+ pumping to maintain pHm; preventing matrix acidification is associated with a maintained redox state; and (7) show that the decrease in [ATP] in the absence of OMN supports ATP hydrolysis with H+ pumping. These two scenarios, ±OMN, are depicted graphically in Figure 10A vs. Figure 10B.
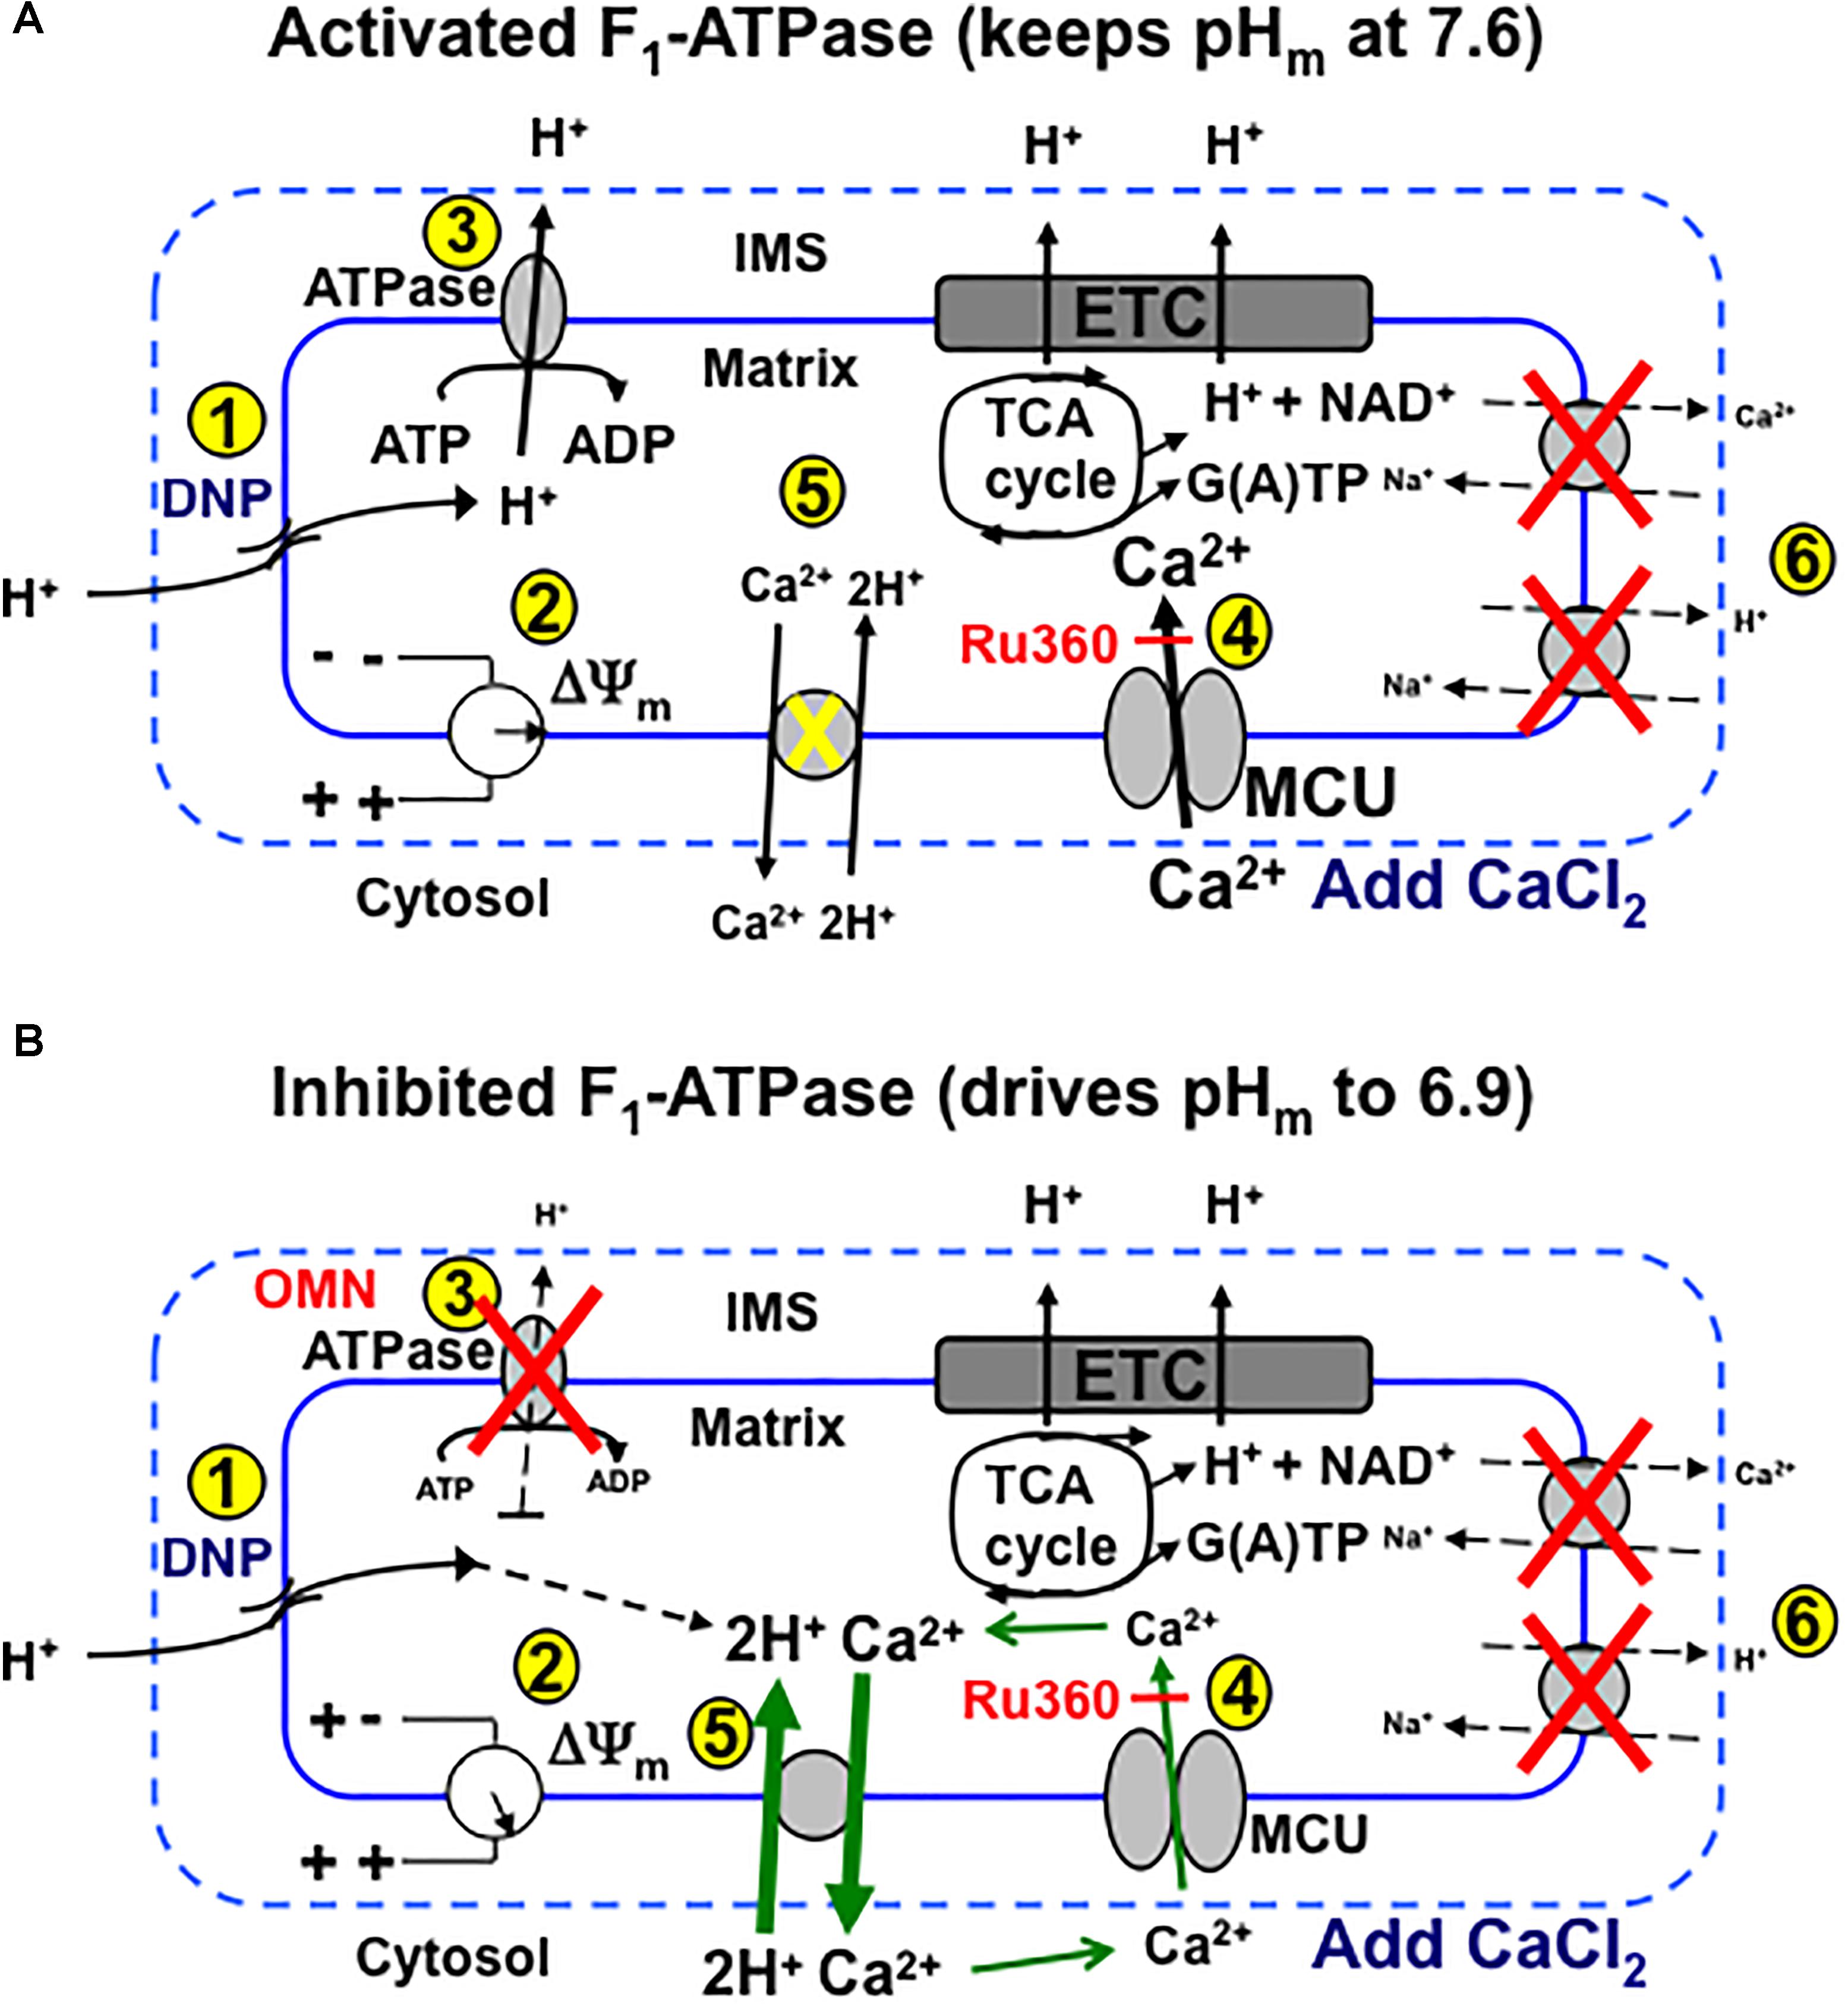
Figure 10. Schema depicting putative role of MCU and CHEm on slow Ca2+ influx and efflux, respectively, during stepwise depolarization with DNP with un-inhibited (i.e., minus OMN) (A) vs. inhibited (B) FOF1-ATPsynthase(ase) (i.e., plus OMN) after a bolus addition of CaCl2 to the mitochondrial medium. (A) (1) DNP permits H+ entry that tends to (2) decrease ΔΨm, which enhances H+ pumping by respiratory complexes, including (3) FOF1-ATPase, so that pHm does not decrease appreciably and ΔΨm is partially supported (2). Adding CaCl2 further depolarizes ΔΨm by allowing more cationic (Ca2+) charges into the matrix via the MCU (4). Over time, in the range of a 20–60% decline in ΔΨm, pHm remains unchanged as (5) H+ is pumped out (3) in exchange for permissive H+ entry (1) in triggering additional slow mCa2+ uptake by MCU and causing ΔΨm to decrease further. CHEm is inhibited by the lack (pH 7.6) of matrix acidity (5) and NCEm and NHEm are inactivated by the lack of substrate and buffer Na+ (6). (B) Alternatively, when FOF1-ATPase is inhibited (3), matrix acidity gradually increases (pH 6.9), ΔΨm is less supported (2) and Ca2+ slowly exits (CHEm) in exchange for slow H+ entry due to DNP (5). This sequence triggers a net loss of mCa2+ even though uptake of Ca2+ via the MCU continues, as shown by a greater efflux of mCa2+ by CHEm when additional mCa2+ uptake via MCU is blocked by Ru360 (4). DNP, dinitrophenol; ETC, electron transport chain; IMS, inner membrane space; MCU, mitochondrial Ca2+ uniporter; OMN, oligomycin; TCA, tricarboxylic acid.
Net Mitochondrial Ca2+ Influx Occurs via MCU and Net Ca2+ Efflux Can Occur via Ca2+/H+ Exchange
The dependence of rapid MCU-mediated mCa2+ uptake on ΔΨm has been examined extensively (Gunter and Pfeiffer, 1990; Gunter et al., 1994; Dash et al., 2009; Haumann et al., 2010). But our study demonstrates that net m[Ca2+] can additionally increase slowly via the MCU, and that this happens when pHm is relatively maintained despite a decline in ΔΨm resulting from the DNP-mediated inward H+ flux and after the initial rapid Ca2+ influx via MCU. A gradual increase in [Ca2+]m at the expense of maintaining the ΔpHm may be deleterious to mitochondrial function. We propose that this secondary rise in net [Ca2+]m results from an adequate ΔΨm with Ru360-dependent slow mCa2+ influx, which eventually leads to a slow, continued fall in ΔΨm. Because H+ pumping at complex V maintains the Δ[H+]m gradient, mCa2+ efflux via CHEm in exchange for mH+ influx due to the H+ leak is likely masked by mCa2+ re-uptake. Thus, the DNP-induced H+ leak and the concomitant dissipation of the IMM Δ[H+] gradient, when countered by H+ pumping at complex V (in addition to other complexes), can maintain the ΔpHm and support the pmf (ΔΨm + RT/FΔpHm) (Dzbek and Korzeniewski, 2008). This view is especially supported by the smaller decline in extra-mitochondrial [Ca2+]e in the presence of 20 μM DNP, 25 μM CaCl2, and OMN, as well as in the presence of Ru360, by the gradual increase in [Ca2+]e due to CHEm mediated Ca2+ efflux. These results are reinforced by the exaggerated effect of added CaCl2 to enhance the decline in ΔΨm over time and by the slow decreases in [Ca2+]m linked to slow decreases in pHm. Blocking outward H+ pumping by complex V prevented compensation for DNP-mediated H+ influx. Consistent with our observations, it was reported that matrix acidification may reduce Ca2+ uptake in cardiac mitochondria by its effect on decreasing ΔΨm (Gursahani and Schaefer, 2004). In contrast, when ATPm hydrolysis is prevented, pHm slowly decreases toward pHe with a greater fall in ΔΨm; the slow H+ influx is accompanied by a slow net fall in [Ca2+]m mediated by CHEm even though the extruded Ca2+ is recycled via the MCU. Since H+ influx (DNP-induced leak) is not countered by reciprocal H+ pumping to restore ΔpHm, the slow influx of H+ is exchanged for slow Ca2+ efflux via CHEm until the ΔpH gradient is dissipated.
Ca2+ and H+ gradients across the IMM are largely dependent on ΔΨm and ΔpH gradients resulting from H+ pumping by respiratory complexes. Ionic homeostasis requires one cation efflux pathway to oppose another cation influx pathway and vice versa. Cation exchangers fulfill this need. Unlike mCa2+ uptake via MCU, which is dependent on ΔΨm and on the chemical gradient, exchange of Ca2+ and H+ via CHEm may or may not be dependent on ΔΨm (Rottenberg and Marbach, 1990; Gunter et al., 1991). But the direction of Ca2+ and H+ flux mediated solely by CHEm is dependent on a large IMM [H+] or [Ca2+] gradient to shuttle Ca2+ or H+ across the IMM. This can be expressed by an electroneutral JCHE flux equation (Tewari et al., 2014), calculated here in the presence and absence of OMN (see section “Supplementary Results S.2.8” and Supplementary Figure S.10). JCHE flux analysis of our data suggests that slow mCa2+ influx could have occurred via CHEm in the absence of OMN, whereas mCa2+ efflux could have occurred in the presence of OMN. Indeed, we have provided strong support for slow net mCa2+ efflux mediated by CHEm (despite slow mCa2+ uptake by MCU) when complex V cannot pump H+ in the presence of OMN.
Although CHEm likely occurs both in the absence or presence of OMN, our results suggest that the observed secondary, slow influx of mCa2+ influx (minus OMN) is due primarily to re-uptake by a Ru360 sensitive mechanism, presumably MCU, that may overwhelm any CHEm activity. This is because Ru360 blocked the slow rise in [Ca2+]m and the slow fall in [Ca2+]e, thus supporting MCU as the mediator of the slow mCa2+ influx. The JCHE flux equation only monitors differences in [H+] and [Ca2+] on either side of the IMM and does not rely on effects of the ΔpHm gradient on H+ pumping or the ΔΨm gradient on mCa2+ uptake via MCU. Thus the secondary, slow mCa2+ uptake after the initial CaCl2 bolus (Figures 5A,B,E,F) appears to be a direct effect of H+ pumping by complex V (minus OMN) to maintain the ΔpHm charge gradient and support the pmf although ΔΨm continues to fall due to the continued mCa2+ influx. On the other hand, inhibiting ATPm hydrolysis (Figures 9C,D) to prevent H+ pumping not only enhances the fall in ΔΨm (Figures 4C,D) to retard further mCa2+ loading by the MCU, but also permits slow CHEm-mediated mCa2+ efflux (Figures 6A,B,E,F) in exchange for mH+ influx until the diminishing ΔpHm gradient is abolished (Figures 7C,D).
Alternatively, we demonstrated CHEm activity by acidifying the external medium before adding CaCl2, while blocking NCEm and NHEm activities by using Na+ free buffer and substrates. We observed a slowly increasing [Ca2+]e coupled to a slowly increasing [H+]m. We used Ru360 to expose the net amount of mCa2+ efflux via CHEm by blocking the effluxed Ca2+ from re-entering via MCU (Figures 1, 2). It is unlikely that 0.1–1 μM Ru360 inhibits CHEm because Ru360 did not block mCa2+ efflux (Figures 1, 2), only mCa2+ influx. Of course, Ru360 might block another mode of non-MCU Ca2+ uptake. Our proposed mechanism is described schematically in Figures 10A,B. We postulate that CHEm activity is completely inhibited if the matrix remains alkaline (large ΔpHm gradient), thus exposing net Ca2+ uptake via MCU. The slow increases in [Ca2+]m that we observed previously (Haumann et al., 2010) likely represent net slow mCa2+ via MCU (reference Figure 5).
A leucine zipper EF hand-containing trans-membrane protein (LETM1) found in non-mammalian cells is thought to be a molecular component of CHEm (Jiang et al., 2009; Shao et al., 2016). Knockdown and expression of LETM1 in a number of cell lines support its role in Ca2+/H+ exchange, particularly in mitochondria (Jiang et al., 2013; Doonan et al., 2014). Alternatively, other studies (Nowikovsky et al., 2004, 2012; Froschauer et al., 2005; Malli and Graier, 2010; Austin et al., 2017) support that LETM1 either does not mediate Ca2+ efflux (De Marchi et al., 2014) or that it mediates K+/H+ and/or Na+/H+ exchange, so conclusive genetic evidence for CHE requires more study. It is important to note that the elusive CHE protein appears to be insensitive to MCU inhibitors, i.e., ruthenium red (RR) compounds (Bernardi et al., 1984), and to CGP-37157, the NCE inhibitor (Tsai et al., 2014). The present study explores for the first time the kinetics of CHEm activity in relation to MCU activity in cardiac cell mitochondria.
ΔΨm < EREV-ATPase Promotes ATP Hydrolysis
FOF1-ATPsynthase/ase directionality is governed by ΔΨm and its “reversal potential” EREV -ATPase, which in turn is dependent on the concentration of the reactants ATP/ADP, and H+ (Metelkin et al., 2009; Chinopoulos and Adam-Vizi, 2010; Chinopoulos et al., 2010). Additional factors of EREV that affect the direction and rate of ATP synthesis/hydrolysis are the free [Pi] and the H+m/ATPm coupling ratio, n (Cross and Muller, 2004). When ΔΨm becomes less negative than EREV, which depends on a high [ATP]m and ΔpHm, but a low [ADP]m, H+ ejection by complex V becomes thermodynamically favorable (Metelkin et al., 2009; Chinopoulos and Adam-Vizi, 2010; Chinopoulos et al., 2010; Chinopoulos, 2011). EREV-ATPase can occur when ΔΨm falls between -130 and -100 mV, depending on matrix [ATP]m/[ADP]m, [Pi]m, ΔpHm, and the coupling ratio (Chinopoulos et al., 2010; Chinopoulos, 2011). Others (Leyssens et al., 1996; Bains et al., 2006; Chinopoulos and Adam-Vizi, 2010) have observed that a fall in ΔΨm caused by a protonophore, such as DNP or CCCP, can induce ATP hydrolysis through reversal of FOF1-ATPsynthase. The consequent H+ pumping by complex V would tend to partially restore ΔΨm to offset the protonophore-induced decreases in pHm and ΔΨm as discussed above. The electrical gradient ΔΨm and the H+ chemical gradient Δ[H+]m together contribute to the total pmf that powers the synthesis of ATP; when pmf is not maintained, hydrolysis of matrix ATP occurs. Previous studies have also furnished indirect evidence for reversal of FOF1-ATPsynthase under conditions of reduced mCa2+ uptake and a fully depolarized ΔΨm with CCCP (Leyssens et al., 1996; Bains et al., 2006). ATPm hydrolysis has been reported to occur in vivo during cardiac ischemia (Grover et al., 2004), but the in vivo ΔΨm at which this occurs is not known. Here we show how a DNP-induced fall in ΔΨm induces ATP hydrolysis.
In the absence of OMN, the lack of a fall in ATP levels after adding 10 μM DNP indicated that ATPm hydrolysis (Figure 9) did not occur because ΔΨm remained relatively stable before adding CaCl2. However, adding CaCl2 resulted in a gradual, but large, fall in ΔΨm over time. In the presence of 20 μM DNP and 25 μM CaCl2, ATP hydrolysis occurred (20–25% of maximum) with a decrease in ΔΨm at an IMM gradient of approximately 0.35 ΔpHm units (Figures 7A,B). A faster rate of ATP hydrolysis was indicated by the additional fall in [ATP]m over time after adding 30 μM DNP and CaCl2. The DNP-induced falls in ΔΨm were accompanied by reduced ATPm/ADPm ratios (see section “Supplementary Materials S.1.11, S1.12 and Supplementary Results S.2.9”) indicating consumption of ATP, as also shown by the lower [ATP]m (Figures 9A,B). A calculation of available matrix ATP is given (see section “Supplementary Results S.2.10”). In the presence of 100 μM DNP and added CaCl2, ΔΨm was maximally depolarized (Figures 4A,B), the ΔpHm gradient was abolished (Figures 7A,B), and NADH was oxidized (Figures 8A,B), indicating that ATPm hydrolysis was insufficient to maintain the pmf. This contrasts to the situation with 10–30 μM DNP where pmf was supported largely by the ΔpHm gradient, as also reflected by the maintained NADH redox state.
ΔΨm is normally fully polarized when complex V is blocked by OMN (Valdez et al., 2006; Brand and Nicholls, 2011); however, the effect of DNP to slightly decrease ΔΨm was intensified when OMN was present, particularly after adding 25 μM CaCl2 that intensifies the depolarization of ΔΨm in the presence of DNP. This effect of DNP in the absence of OMN indicates that ATP hydrolysis indeed supported the ΔpHm via H+ pumping even at a relatively small decline in ΔΨm with DNP. With OMN present, ATP hydrolysis cannot occur (Figures 9C,D) and so complex V cannot contribute to maintaining pHm; therefore, the low pHm accompanied by a high [Ca2+]m must have activated CHEm.
Changes in pHm, [Ca2+]m, and NADH Are Larger With OMN Than Without OMN
An interesting observation of our study is the contribution of complex V to maintain the ΔpHm gradient (and thus supporting the pmf) whereby the H+ leak is compensated by augmented H+ pumping by complex V; this resulted in slow mCa2+ influx (“Ca2+ leak”) that could be blocked by Ru360, which indicates the influx likely occurred via MCU. But if compensatory H+ pumping is blocked by OMN, the matrix becomes acidic, the ΔpHm gradient falls lower, and slow mCa2+ efflux occurs via CHEm thus masking the slow mCa2+ influx (Figure 10B). Evidence for H+ pumping during ATP hydrolysis during DNP-mediated H+ influx was provided by the maintenance of an alkaline pHm; moreover, pHm indeed fell when H+ pumping was blocked by OMN. Similarly, if mitochondria reside in an acidic environment (Figures 1, 2), [H+]m falls as [Ca2+]e rises, indicating CHEm. Indeed, in a previous study it was reported that adding lactic acid to a Na+ free mitochondrial suspension increased buffer Ca2+ by 43% (Gambassi et al., 1993); it was suggested that Ca2+ was extruded as H+ influx caused H+ ions to compete with Ca2+ ions for mitochondrial binding sites (Gambassi et al., 1993). We furnish direct evidence for a link between Ca2+ efflux with H+ influx in mammalian cardiac muscle mitochondria, when Na+ is absent and the MCU is blocked after adding CaCl2.
NADH levels remained unchanged after adding DNP and CaCl2 (Figures 8A,B); this likely reflects the faster state 2 respiration (Supplementary Figure S2) since the inward H+ leak by DNP was balanced by H+ pumping from complex V as well as from complexes I, III, and IV. Only at 100 μM DNP with CaCl2, which fully depolarized ΔΨm (Figures 4A,B), did DNP result in a lower pHm (Figures 7A,B) and a more oxidized redox state, i.e., a decrease in NADH (Figures 8A,B). It is likely that an increase in FOF1-ATPase activity plus a faster TCA cycle turnover (increased NADH/NAD+ ratio) can result in maintained NADH levels despite the DNP-induced H+ leak. In the presence of OMN, however, NADH was gradually oxidized (Figures 8C,D) along with the fall in pHm (Figures 7C,D); this scenario likely occurred because the additional H+ pumping by complex V to support ΔΨm was blocked. We observed that adding CaCl2 alone did not significantly change NADH levels in this model, which is consistent with our earlier study (Haumann et al., 2010). Although an increase in [Ca2+]m can stimulate NADH producing dehydrogenases (Denton et al., 1980; McCormack and Denton, 1980; Wan et al., 1989; Brandes and Bers, 1997), our experiments were conducted at maximal [Ca2+]m values below the K0.5 of 1 μM Ca2+ at which these dehydrogenases are reported to be activated (Denton et al., 1980; McCormack and Denton, 1980).
What Is the Functional Role of CHEm: How Is Net mCa2+ Efflux Modified by mCa2+ Influx via MCU?
The net Ca2+ driving force for ions across the IMM can be estimated by Nernst equilibrium potentials for given estimates of ΔΨm. Under conditions of 20 μM DNP, 25 μM CaCl2, and in the absence of OMN, when [Ca2+]m slowly increased, we calculated Nernst equilibrium potentials of approximately -8 and +18 mV, respectively, for [Ca2+] and [H+] at 700 s. We estimated ΔΨm as -110 to -120 mV at 700 s (based on our values for % of minimal and maximal depolarization (R-123 fluorescence) and curve fitting for approximating conversion to ΔΨm (Huang et al., 2007)). This indicated that the driving force for both Ca2+ and H+ would remain inward despite H+ pumping at complex V to attempt to re-establish the ΔpHm gradient by compensating for the DNP-mediated H+ influx. Based on our estimated ΔΨm and the calculated Ca2+ and H+ equilibrium potentials driving both Ca2+ and H+ inward, we conclude that the outward H+ pumping by complex V (in addition to complexes I, III, IV) was sufficient to compensate for the continued inward influx of H+ mediated by DNP thus restoring the ΔpHm gradient, but not the pmf, and thus preventing activation of CHEm. Ru360 blocked this additional uptake of mCa2+ by the MCU so that [Ca2+]e did not continue to fall.
We predict that the major conduit for both fast and slow mCa2+ influx under our experimental conditions occurs primarily via the MCU. The efflux of Ca2+ via the CHEm is slow so we expect the re-uptake of Ca2+ via the MCU also would be slow. Although the JCHE flux equation alone predicted that slow mCa2+ influx could have occurred via CHEm this is unsustainable if [H+]m < [H+]e. It is likely that voltage-dependent transport of net Ca2+ inward is mostly responsible if there is at least a partially maintained ΔΨm (Nernst potentials) despite mCa2+ extrusion via CHEm. Interestingly, under the condition of a fully polarized ΔΨm (no DNP and no OMN) (Figures 4A–D), [Ca2+]m did not rise as it did in the presence of DNP (Figures 5A,B) when pHm was maintained (Figures 7A,B). This suggests that the secondary, slow uptake of mCa2+ is indirectly related to H+ pumping due to the decline in [H+]m to support the pmf; the additional, slow mCa2+ uptake by the MCU occurs because of the remaining charge gradient (ΔΨm) and Ca2+ chemical gradient.
In contrast, in the presence of OMN the kinetics of the delayed, slow mCa2+ efflux via CHEm under conditions of reduced ΔΨm and low pHm are different. Our estimates of ΔΨ (Huang et al., 2007) of -60 to -70 mV at 700 s with OMN present are much lower than without OMN; this is likely due to dissipation of both ΔpHm and ΔΨm gradients because H+ pumping by complex V to support ΔpHm (and ΔΨm) was blocked. With OMN present, we estimated Nernst potentials of +13 and +6 mV, respectively, for Ca2+ and H+ (calculated at 700 s). Based on these Nernst potentials the driving forces for both Ca2+ and H+ would remain inward with OMN present, although their Nernst potentials are reversed compared to those in the absence of OMN. With the slow inward driving force for H+, unmatched by H+ pumping at complex V, pHm approached pHe and net [Ca2+]m became lowered due to CHEm. Because inhibiting the MCU with Ru360 caused a robust increase in [Ca2+]e, this indicated the Ca2+ effluxed via CHEm re-enters via the MCU unless this pathway is blocked. Under the unique condition of collapsed ΔΨm (100 μM DNP) and ΔpHm gradients, the secondary, slow uptake of mCa2+ is absent (Figures 5A,B, black lines) so that the decline in [Ca2+]m via CHEm is fully observed (Figures 6A,B). Thus, a fall in pHe strongly supports net mCa2+ efflux via CHEm even though the Nernst potentials indicate continued slow mCa2+ influx (via MCU), which indeed occurs if there is remaining ΔΨm. This means that net Ca2+ efflux due to CHEm (Figures 1, 2 and Supplementary Figure S.6) can be exposed by blocking the MCU after the initial bolus of CaCl2 to prevent further mCa2+ uptake. CHEm is predicted by the JCHE equation to favor mCa2+ efflux in exchange for mH+ influx based on matrix and buffer ion concentrations obtained with OMN present (Supplementary Figure S.10). Our prediction assumes that Ca2+ is exchanged for 2H+ with equal affinities for both cations, or a higher affinity for H+.
Does Transient, Low Conductance mPTP Also Shuttle Ca2+ Across the IMM in These Experiments?
Inducing a partial ΔΨm depolarization was reported to cause a slow influx of mCa2+ through low conductance mPTP opening (Saotome et al., 2005). CsA prevented both an increase in mCa2+ and the release of the small molecule calcein during simulated ischemia in cardiomyocytes suggesting that transient mPTP opening during ischemia allowed mCa2+ influx (Seidlmayer et al., 2015). In the present study adding CaCl2 in the presence of DNP or an acidic buffer caused falls in ΔΨm, so could low conductance mPTP opening have contributed to the secondary, slow increase or decrease in m[Ca2+] we observed in the absence or presence of OMN? We doubt this for the following reasons: (1) ROS, adenine nucleotide levels, and other factors are believed to contribute to mPTP formation during IR injury. But in our study we did not utilize IR to induce increases in Ca2+ and ROS or decreases in pHm or ΔΨm; (2) Altering just the driving force for protons across the IMM using DNP or external pH to exchange Ca2+ ion for H+ ions is not compatible for a mechanism to cause or prevent formation of mPTP but it is for inducing mCHE activity; (3) Transient mPTP formation is controversial and based largely on the utility of calcein or other small particles to mark mitochondrial release of small molecules with free flowing ions such as Ca2+ (Petronilli et al., 1999); (4) CsA-sensitive transient mPTP opening in individual mitochondria of cardiac myocytes is quite rare even with elevated m[Ca2+] or exposure to H2O2 (Lu et al., 2016); (4) CsA, or its inhibition of the peptidyl prolyl cis–trans isomerase activity of cyclophilin D, has known and unknown effects on mitochondrial function that may be unrelated to mPTP formation (Giorgio et al., 2010). Some interpretations on effects of cyclophilin D, via CsA, may pertain to changes in Ca2+ flux due to mCHE rather than transitional mPTP opening.
CSA Ceases Activation of CHEm
CsA unexpectedly stopped the secondary CaCl2-induced effects attributed to CHEm. CsA ceased all apparent CHEm activity after adding CaCl2 when pHe was 6.9 or 7.15, as assessed by measurements of extra-matrix [Ca2+]e, pHm, and ΔΨm (Supplementary Figures S.1A–C). CsA did not blunt the partial ΔΨm depolarization induced by DNP alone at pHe 7.15, but did delay full ΔΨm depolarization induced by adding CaCl2 after DNP (Supplementary Figures S.7A,B). We do not believe the slow, attenuated decreases in extrusion of Ca2+ or slow fall in matrix pH observed in the presence of CsA are directly related to inhibition of permanent or transient mPTP opening. CsA did not directly prevent the ΔΨm depolarization that occurs during CHEm or with addition of DNP alone. In the absence of CsA (Figures 1A–C), the observed changes in pHm, external [Ca2+]e, and ΔΨm, induced by adding CaCl2 at extra-matrix pH 6.9, occurred very slowly over 25–30 min; this is indicative of slow cation exchange activity, not mPTP. Moreover, full ΔΨm depolarization was incomplete. CsA or its inhibition of cyclophilin D may obviate the conditions for matrix H+ influx or mCa2+ efflux as well as Ca2+ recycling via the MCU. CsA may prevent dissipation of the ΔpH gradient when the external pH is low. Since the results obtained in the presence of CsA are not compatible with preventing or delaying mPTP opening, the effects of CsA in this setting are unclear. Additional experiments will be needed to delineate the mechanism of CsA on preventing CHEm.
Other Potential Limitations of the Study
One important limitation of our study is the lack of a selective inhibitor of CHEm to aid in defining a more precise mechanism of action. Since the gene code for LETM1 and its protein sequence are known, point mutations (Tsai et al., 2014) and knockdowns (Jiang et al., 2013; Doonan et al., 2014) in mammalian models will be helpful to assess mechanisms and kinetics of this cation antiporter; but it remains unclear if LETM1 mediates CHEm exclusively, or at all. Another limitation is that mitochondria were examined outside their normal milieu so that the contributions of ATP synthesis by glycolysis and ATP hydrolysis for cellular metabolic support could not be assessed. Experiments were conducted at room temperature at which metabolism would be lower and buffering capacity different than at 37°C. The activity of CHEm during cardiac IR is unknown and mCa2+ efflux in cardiac mitochondria may occur primarily via the NCEm and not CHEm. Nevertheless, induction of CHEm could occur in vivo during IR injury under very specific circumstances of trans-IMM cationic imbalance. Evaluation of CHEm activity in cardiac myocytes after IR injury should be helpful to design protective strategies using this mechanism.
Conclusion
This study furnishes new insights into the bioenergetic and dynamic mechanisms in cardiac cell mitochondria of delayed, slow mCa2+ influx via the MCU, and mCa2+ efflux via the pHm-dependent CHEm. We demonstrate the kinetics of slow changes in mCa2+ loading/unloading that are linked to unblocked vs. blocked ATPm hydrolysis to decrease vs. increase pHm, respectively, after partial depolarization by DNP. We found that after an initial CaCl2 bolus there is slow mCa2+ influx (Ca2+ leak) through a Ru360-sensitive pathway if H+ pumping counteracts a H+ leak; however, there is net slow mCa2+ efflux that overrides ΔΨm-mediated Ca2+ influx that is activated via CHEm if there is a high ΔpHm gradient. In cardiac mitochondria, the rapid and slow mode of uptake of mCa2+ appears to be dependent primarily on the trans-membrane [Ca2+] and ΔΨm gradients if outward H+ pumping counteracts inward H+ entry. In contrast, slow extrusion of mCa2+ by CHEm appears to be dependent primarily on the [ΔH+]m gradient induced by H+ influx/leak by DNP or by an acidic pHe. Importantly, if NCEm and NHEm are inactivated, blocking complex V might prevent delayed Ca2+ overload and instead stimulate Ca2+ extrusion via CHEm if there is an inward H+ leak. In intact cells, this can also serve to preserve TCA cycle-generated ATP, i.e., substrate level phosphorylation. Such passive homeostatic balance of Δ[Ca2+]m may occur during cardiac injury when there is mCa2+ loading accompanied by declines in NADH redox state, pHm and Ψm. We conclude that the differences in the rate and magnitude of mCa2+ influx/efflux in partially depolarized mitochondria, in the presence or absence of FOF1-ATPase activity, can be ascribed to the underlying changes in pmf components, ΔpHm and ΔΨm, after rapid mCa2+ loading.
Author Contributions
DS proposed the study and its initial design. JH conducted most experiments, carried out initial statistical analysis, constructed initial figures, and participated in design, interpretation and writing. AG, AB, CB, CN, and MB conducted supporting experiments. AC, W-MK, and RD participated in theoretical interpretation of the results and text editing. DS and AC supervised the team in subsequent experimental designs, interpretation of results, and manuscript construction and writing.
Funding
This project was supported by grants from the National Institutes of Health (R01HL089514, R01HL095122 and 5T35HL072483) and the Veterans Administration (Merit Review BX820405P and BX002539).
Conflict of Interest Statement
The authors declare that the research was conducted in the absence of any commercial or financial relationships that could be construed as a potential conflict of interest.
Acknowledgments
The authors wish to thank Drs. Mohammed Aldakkak, Jason Bazil, Shivendra G. Tewari, Venkat Pannala, Kalyan C. Vinnakota, and Gayathri Natarajan for their help and advice, laboratory manager James S. Heisner for technical assistance and supporting experiments, and medical student David S. Lambert for discussions on follow up studies.
Supplementary Material
The Supplementary Material for this article can be found online at: https://www.frontiersin.org/articles/10.3389/fphys.2018.01914/full#supplementary-material
References
Aldakkak, M., Stowe, D. F., Cheng, Q., Kwok, W. M., and Camara, A. K. (2010). Mitochondrial matrix K+ flux independent of large-conductance Ca2+-activated K+ channel opening. Am. J. Physiol. Cell Physiol. 298, C530–C541. doi: 10.1152/ajpcell.00468.2009
Austin, S., Tavakoli, M., Pfeiffer, C., Seifert, J., Mattarei, A., De Stefani, D., et al. (2017). LETM1-mediated K+ and Na+ homeostasis regulates mitochondrial Ca2+ efflux. Front. Physiol. 8:839. doi: 10.3389/fphys.2017.00839
Azzone, G. F., Pozzan, T., Massari, S., Bragadin, M., and Dell’Antone, P. (1977). H+/site ratio and steady state distribution of divalent cations in mitochondria. FEBS Lett. 78, 21–24. doi: 10.1016/0014-5793(77)80264-0
Bains, R., Moe, M. C., Larsen, G. A., Berg-Johnsen, J., and Vinje, M. L. (2006). Volatile anaesthetics depolarize neural mitochondria by inhibition of the electron transport chain. Acta Anaesthesiol. Scand. 50, 572–579. doi: 10.1111/j.1399-6576.2006.00988.x
Bazil, J. N., Blomeyer, C. A., Pradhan, R. K., Camara, A. K., and Dash, R. K. (2013). Modeling the calcium sequestration system in isolated guinea pig cardiac mitochondria. J. Bioenerg. Biomembr. 45, 177–188. doi: 10.1007/s10863-012-9488-2
Bernardi, P. (1999). Mitochondrial transport of cations: channels, exchangers, and permeability transition. Physiol. Rev. 79, 1127–1155. doi: 10.1152/physrev.1999.79.4.1127
Bernardi, P., Paradisi, V., Pozzan, T., and Azzone, G. F. (1984). Pathway for uncoupler-induced calcium efflux in rat liver mitochondria: inhibition by ruthenium red. Biochemistry 23, 1645–1651. doi: 10.1021/bi00303a010
Blomeyer, C. A., Bazil, J. N., Stowe, D. F., Pradhan, R. K., Dash, R. K., and Camara, A. K. (2013). Dynamic buffering of mitochondrial Ca2+ during Ca2+ uptake and Na+-induced Ca2+ release. J. Bioenerg. Biomembr. 45, 189–202. doi: 10.1007/s10863-012-9483-7
Boelens, A. D., Pradhan, R. K., Blomeyer, C. A., Camara, A. K., Dash, R. K., and Stowe, D. F. (2013). Extra-matrix Mg2+ limits Ca2+ uptake and modulates Ca2+ uptake-independent respiration and redox state in cardiac isolated mitochondria. J. Bioenerg. Biomembr. 45, 203–218. doi: 10.1007/s10863-013-9500-5
Boyman, L., Williams, G. S., Khananshvili, D., Sekler, I., and Lederer, W. J. (2013). NCLX: the mitochondrial sodium calcium exchanger. J. Mol. Cell Cardiol. 59, 205–213. doi: 10.1016/j.yjmcc.2013.03.012
Brand, M. D. (1985). Electroneutral efflux of Ca2+ from liver mitochondria. Biochem. J. 225, 413–419. doi: 10.1042/bj2250413
Brand, M. D., and Nicholls, D. G. (2011). Assessing mitochondrial dysfunction in cells. Biochem. J. 435, 297–312. doi: 10.1042/BJ20110162
Brandes, R., and Bers, D. M. (1997). Intracellular Ca2+ increases the mitochondrial NADH concentration during elevated work in intact cardiac muscle. Circ. Res. 80, 82–87. doi: 10.1161/01.RES.80.1.82
Brookes, P. S., Yoon, Y., Robotham, J. L., Anders, M. W., and Sheu, S. S. (2004). Calcium, ATP, and ROS: a mitochondrial love-hate triangle. Am. J. Physiol. Cell Physiol. 287, C817–C833. doi: 10.1152/ajpcell.00139.2004
Camara, A. K., Lesnefsky, E. J., and Stowe, D. F. (2010). Potential therapeutic benefits of strategies directed to mitochondria. Antioxid. Redox. Signal. 13, 279–347. doi: 10.1089/ars.2009.2788
Chinopoulos, C. (2011). Mitochondrial consumption of cytosolic ATP: not so fast. FEBS Lett 585, 1255–1259. doi: 10.1016/j.febslet.2011.04.004
Chinopoulos, C., and Adam-Vizi, V. (2010). Mitochondria as ATP consumers in cellular pathology. Biochim. Biophys. Acta 1802, 221–227. doi: 10.1016/j.bbadis.2009.08.008
Chinopoulos, C., Gerencser, A. A., Mandi, M., Mathe, K., Torocsik, B., Doczi, J., et al. (2010). Forward operation of adenine nucleotide translocase during F0F1-ATPase reversal: critical role of matrix substrate-level phosphorylation. FASEB J. 24, 2405–2416. doi: 10.1096/fj.09-149898
Cross, R. L., and Muller, V. (2004). The evolution of A-, F-, and V-type ATP synthases and ATPases: reversals in function and changes in the H+/ATP coupling ratio. FEBS Lett. 576, 1–4. doi: 10.1016/j.febslet.2004.08.065
Csordas, G., Varnai, P., Golenar, T., Roy, S., Purkins, G., Schneider, T. G., et al. (2010). Imaging interorganelle contacts and local calcium dynamics at the ER-mitochondrial interface. Mol. Cell. 39, 121–132. doi: 10.1016/j.molcel.2010.06.029
Dash, R. K., and Beard, D. A. (2008). Analysis of cardiac mitochondrial Na+-Ca2+ exchanger kinetics with a biophysical model of mitochondrial Ca2+ handling suggests a 3:1 stoichiometry. J. Physiol. 586, 3267–3285. doi: 10.1113/jphysiol.2008.151977
Dash, R. K., Qi, F., and Beard, D. A. (2009). A biophysically based mathematical model for the kinetics of mitochondrial calcium uniporter. Biophys. J. 96, 1318–1332. doi: 10.1016/j.bpj.2008.11.005
De Marchi, U., Santo-Domingo, J., Castelbou, C., Sekler, I., Wiederkehr, A., and Demaurex, N. (2014). NCLX protein, but not LETM1, mediates mitochondrial Ca2+ extrusion, thereby limiting Ca2+-induced NAD(P)H production and modulating matrix redox state. J. Biol. Chem. 289, 20377–20385. doi: 10.1074/jbc.M113.540898
De Stefani, D., Patron, M., and Rizzuto, R. (2015). Structure and function of the mitochondrial calcium uniporter complex. Biochim. Biophys. Acta 1853, 2006–2011. doi: 10.1016/j.bbamcr.2015.04.008
Delcamp, T. J., Dales, C., Ralenkotter, L., Cole, P. S., and Hadley, R. W. (1998). Intramitochondrial [Ca2+] and membrane potential in ventricular myocytes exposed to anoxia-reoxygenation. Am. J. Physiol. 275(2 Pt 2), H484–H494. doi: 10.1152/ajpheart.1998.275.2.H484
Demaurex, N., Poburko, D., and Frieden, M. (2009). Regulation of plasma membrane calcium fluxes by mitochondria. Biochim. Biophys. Acta 1787, 1383–1394. doi: 10.1016/j.bbabio.2008.12.012
Denton, R. M., McCormack, J. G., and Edgell, N. J. (1980). Role of calcium ions in the regulation of intramitochondrial metabolism. Effects of Na+, Mg2+ and ruthenium red on the Ca2+-stimulated oxidation of oxoglutarate and on pyruvate dehydrogenase activity in intact rat heart mitochondria. Biochem. J. 190, 107–117. doi: 10.1042/bj1900107
Di Lisa, F., and Bernardi, P. (1998). Mitochondrial function as a determinant of recovery or death in cell response to injury. Mol. Cell. Biochem. 184, 379–391. doi: 10.1023/A:1006810523586
Doonan, P. J., Chandramoorthy, H. C., Hoffman, N. E., Zhang, X., Cardenas, C., Shanmughapriya, S., et al. (2014). LETM1-dependent mitochondrial Ca2+ flux modulates cellular bioenergetics and proliferation. FASEB J. 28, 4936–4949. doi: 10.1096/fj.14-256453
Dzbek, J., and Korzeniewski, B. (2008). Control over the contribution of the mitochondrial membrane potential (ΔΨ) and proton gradient (ΔpH) to the protonmotive force (Δp). In silico studies. J. Biol. Chem. 283, 33232–33239. doi: 10.1074/jbc.M802404200
Froschauer, E., Nowikovsky, K., and Schweyen, R. J. (2005). Electroneutral K+/H+ exchange in mitochondrial membrane vesicles involves Yol027/LETM1 proteins. Biochim. Biophys. Acta 1711, 41–48. doi: 10.1016/j.bbamem.2005.02.018
Gambassi, G., Hansford, R. G., Sollott, S. J., Hogue, B. A., Lakatta, E. G., and Capogrossi, M. C. (1993). Effects of acidosis on resting cytosolic and mitochondrial Ca2+ in mammalian myocardium. J. Gen. Physiol. 102, 575–597. doi: 10.1085/jgp.102.3.575
Giorgio, V., Soriano, M. E., Basso, E., Bisetto, E., Lippe, G., Forte, M. A., et al. (2010). Cyclophilin D in mitochondrial pathophysiology. Biochim. Biophys. Acta 1797, 1113–1118. doi: 10.1016/j.bbabio.2009.12.006
Grover, G. J., Atwal, K. S., Sleph, P. G., Wang, F. L., Monshizadegan, H., Monticello, T., et al. (2004). Excessive ATP hydrolysis in ischemic myocardium by mitochondrial F1F0-ATPase: effect of selective pharmacological inhibition of mitochondrial ATPase hydrolase activity. Am. J. Physiol. Heart Circ. Physiol. 287, H1747–H1755. doi: 10.1152/ajpheart.01019.2003
Gunter, K. K., Zuscik, M. J., and Gunter, T. E. (1991). The Na+-independent Ca2+ efflux mechanism of liver mitochondria is not a passive Ca2+/2H+ exchanger. J. Biol. Chem. 266, 21640–21648.
Gunter, T. E., Gunter, K. K., Sheu, S. S., and Gavin, C. E. (1994). Mitochondrial calcium transport: physiological and pathological relevance. Am. J. Physiol. 267(2 Pt 1), C313–C339. doi: 10.1152/ajpcell.1994.267.2.C313
Gunter, T. E., and Pfeiffer, D. R. (1990). Mechanisms by which mitochondria transport calcium. Am. J. Physiol. 258(5 Pt 1), C755–C786. doi: 10.1152/ajpcell.1990.258.5.C755
Gursahani, H. I., and Schaefer, S. (2004). Acidification reduces mitochondrial calcium uptake in rat cardiac mitochondria. Am. J. Physiol. Heart Circ. Physiol. 287, H2659–H2665. doi: 10.1152/ajpheart.00344.2004
Haumann, J., Dash, R. K., Stowe, D. F., Boelens, A., Beard, D. A., and Camara, A. K. S. (2010). Mitochondrial free [Ca2+] increases during ATP/ADP antiport and ADP phosphorylation: exploration of mechanisms. Biophys. J. 99, 997–1006. doi: 10.1016/j.bpj.2010.04.069
Heinen, A., Camara, A. K., Aldakkak, M., Rhodes, S. S., Riess, M. L., and Stowe, D. F. (2007). Mitochondrial Ca2+-induced K+ influx increases respiration and enhances ROS production while maintaining membrane potential. Am. J. Physiol. Cell Physiol. 292,C148–C156. doi: 10.1152/ajpcell.00215.2006
Hoppe, U. C. (2010). Mitochondrial calcium channels. FEBS Lett. 584, 1975–1981. doi: 10.1016/j.febslet.2010.04.017
Huang, M., Camara, A. K., Stowe, D. F., Qi, F., and Beard, D. A. (2007). Mitochondrial inner membrane electrophysiology assessed by rhodamine-123 transport and fluorescence. Ann. Biomed. Eng. 35, 1276–1285. doi: 10.1007/s10439-007-9265-2
Jennings, R. B., Reimer, K. A., and Steenbergen, C. (1991). Effect of inhibition of the mitochondrial ATPase on net myocardial ATP in total ischemia. J. Mol. Cell Cardiol. 23, 1383–1395. doi: 10.1016/0022-2828(91)90185-O
Jiang, D., Zhao, L., and Clapham, D. E. (2009). Genome-wide RNAi screen identifies LETM1 as a mitochondrial Ca2+/H+ antiporter. Science 326, 144–147. doi: 10.1126/science.1175145
Jiang, D., Zhao, L., Clish, C. B., and Clapham, D. E. (2013). LETM1, the mitochondrial Ca2+/H+ antiporter, is essential for normal glucose metabolism and alters brain function in Wolf-Hirschhorn syndrome. Proc. Natl. Acad. Sci. U.S.A. 110, E2249–E2254. doi: 10.1073/pnas.1308558110
Leyssens, A., Nowicky, A. V., Patterson, L., Crompton, M., and Duchen, M. R. (1996). The relationship between mitochondrial state, ATP hydrolysis, [Mg2+]i and [Ca2+]i studied in isolated rat cardiomyocytes. J. Physiol. 496, 111–128. doi: 10.1113/jphysiol.1996.sp021669
Lu, X., Kwong, J. Q., Molkentin, J. D., and Bers, D. M. (2016). Individual cardiac mitochondria undergo rare transient permeability transition pore openings. Circ. Res. 118, 834–841. doi: 10.1161/CIRCRESAHA.115.308093
Malli, R., and Graier, W. F. (2010). Mitochondrial Ca2+ channels: great unknowns with important functions. FEBS Lett. 584, 1942–1947. doi: 10.1016/j.febslet.2010.01.010
McCormack, J. G., and Denton, R. M. (1980). Role of calcium ions in the regulation of intramitochondrial metabolism. Properties of the Ca2+-sensitive dehydrogenases within intact uncoupled mitochondria from the white and brown adipose tissue of the rat. Biochem. J. 190, 95–105. doi: 10.1042/bj1900095
Metelkin, E., Demin, O., Kovacs, Z., and Chinopoulos, C. (2009). Modeling of ATP-ADP steady-state exchange rate mediated by the adenine nucleotide translocase in isolated mitochondria. FEBS J. 276, 6942–6955. doi: 10.1111/j.1742-4658.2009.07394.x
Murphy, E., and Steenbergen, C. (2008). Mechanisms underlying acute protection from cardiac ischemia-reperfusion injury. Physiol. Rev. 88, 581–609. doi: 10.1152/physrev.00024.2007
Nishizawa, T., Kita, S., Maturana, A. D., Furuya, N., Hirata, K., Kasuya, G., et al. (2013). Structural basis for the counter-transport mechanism of a H+/Ca2+ exchanger. Science 341, 168–172. doi: 10.1126/science.1239002
Nowikovsky, K., Froschauer, E. M., Zsurka, G., Samaj, J., Reipert, S., Kolisek, M., et al. (2004). The LETM1/YOL027 gene family encodes a factor of the mitochondrial K+ homeostasis with a potential role in the Wolf-Hirschhorn syndrome. J. Biol. Chem. 279, 30307–30315. doi: 10.1074/jbc.M403607200
Nowikovsky, K., Pozzan, T., Rizzuto, R., Scorrano, L., and Bernardi, P. (2012). Perspectives on: SGP symposium on mitochondrial physiology and medicine: the pathophysiology of LETM1. J. Gen. Physiol. 139, 445–454. doi: 10.1085/jgp.201110757
O’Rourke, B., Cortassa, S., and Aon, M. A. (2005). Mitochondrial ion channels: gatekeepers of life and death. Physiology 20, 303–315. doi: 10.1152/physiol.00020.2005
O-Uchi, J., Jhun, B. S., Hurst, S., Bisetto, S., Gross, P., Chen, M., et al. (2013). Overexpression of ryanodine receptor type 1 enhances mitochondrial fragmentation and Ca2+-induced ATP production in cardiac H9c2 myoblasts. Am. J. Physiol. Heart Circ. Physiol. 305, H1736–H1751. doi: 10.1152/ajpheart.00094.2013
Petronilli, V., Miotto, G., Canton, M., Brini, M., Colonna, R., Bernardi, P., et al. (1999). Transient and long-lasting openings of the mitochondrial permeability transition pore can be monitored directly in intact cells by changes in mitochondrial calcein fluorescence. Biophys. J. 76, 725–734. doi: 10.1016/S0006-3495(99)77239-5
Pozzan, T., Bragadin, M., and Azzone, G. F. (1977). Disequilibrium between steady-state Ca2+ accumulation ratio and membrane potential in mitochondria. Pathway and role of Ca2+ efflux. Biochemistry 16, 5618–5625. doi: 10.1021/bi00644a036
Riess, M. L., Camara, A. K., Heinen, A., Eells, J. T., Henry, M. M., and Stowe, D. F. (2008). KATP channel openers have opposite effects on mitochondrial respiration under different energetic conditions. J. Cardiovasc. Pharmacol. 51, 483–491. doi: 10.1097/FJC.0b013e31816bf4a4
Riess, M. L., Camara, A. K., Novalija, E., Chen, Q., Rhodes, S. S., and Stowe, D. F. (2002). Anesthetic preconditioning attenuates mitochondrial Ca2+ overload during ischemia in Guinea pig intact hearts: reversal by 5-hydroxydecanoic acid. Anesth. Analg. 95, 1540–1546. doi: 10.1097/00000539-200212000-00013
Rottenberg, H., and Marbach, M. (1990). The Na+-independent Ca2+ efflux system in mitochondria is a Ca2+/2H+ exchange system. FEBS Lett. 274, 65–68. doi: 10.1016/0014-5793(90)81330-Q
Ryu, S. Y., Beutner, G., Kinnally, K. W., Dirksen, R. T., and Sheu, S. S. (2011). Single channel characterization of the mitochondrial ryanodine receptor in heart mitoplasts. J. Biol. Chem. 286, 21324–21329. doi: 10.1074/jbc.C111.245597
Saotome, M., Katoh, H., Satoh, H., Nagasaka, S., Yoshihara, S., Terada, H., et al. (2005). Mitochondrial membrane potential modulates regulation of mitochondrial Ca2+ in rat ventricular myocytes. Am. J. Physiol. Heart Circ. Physiol. 288, H1820–H1828. doi: 10.1152/ajpheart.00589.2004
Seidlmayer, L. K., Juettner, V. V., Kettlewell, S., Pavlov, E. V., Blatter, L. A., and Dedkova, E. N. (2015). Distinct mPTP activation mechanisms in ischaemia-reperfusion: contributions of Ca2+, ROS, pH, and inorganic polyphosphate. Cardiovasc. Res. 106, 237–248. doi: 10.1093/cvr/cvv097
Shao, J., Fu, Z., Ji, Y., Guan, X., Guo, S., Ding, Z., et al. (2016). Leucine zipper-EF-hand containing transmembrane protein 1 (LETM1) forms a Ca2+/H+ antiporter. Sci. Rep. 6:34174. doi: 10.1038/srep34174
Stowe, D. F., and Camara, A. K. (2009). Mitochondrial reactive oxygen species production in excitable cells: modulators of mitochondrial and cell function. Antioxid. Redox. Signal. 11, 1373–1414. doi: 10.1089/ARS.2008.2331
Tewari, S. G., Camara, A. K., Stowe, D. F., and Dash, R. K. (2014). Computational analysis of Ca2+ dynamics in isolated cardiac mitochondria predicts two distinct modes of Ca2+ uptake. J. Physiol. 592(Pt 9), 1917–1930. doi: 10.1113/jphysiol.2013.268847
Tsai, M. F., Jiang, D., Zhao, L., Clapham, D., and Miller, C. (2014). Functional reconstitution of the mitochondrial Ca2+/H+ antiporter LETM1. J. Gen. Physiol. 143, 67–73. doi: 10.1085/jgp.201311096
Valdez, L. B., Zaobornyj, T., and Boveris, A. (2006). Mitochondrial metabolic states and membrane potential modulate mtNOS activity. Biochim. Biophys. Acta 1757, 166–172. doi: 10.1016/j.bbabio.2006.02.013
Wan, B., LaNoue, K. F., Cheung, J. Y., and Scaduto, R. C. Jr. (1989). Regulation of citric acid cycle by calcium. J. Biol. Chem. 264, 13430–13439.
Keywords: cardiac mitochondria, Ca2+ uptake/release, mitochondrial Ca2+ uniporter, Ca2+/H+ exchange, H+ leak and pumping, complex V
Citation: Haumann J, Camara AKS, Gadicherla AK, Navarro CD, Boelens AD, Blomeyer CA, Dash RK, Boswell MR, Kwok W-M and Stowe DF (2019) Slow Ca2+ Efflux by Ca2+/H+ Exchange in Cardiac Mitochondria Is Modulated by Ca2+ Re-uptake via MCU, Extra-Mitochondrial pH, and H+ Pumping by FOF1-ATPase. Front. Physiol. 9:1914. doi: 10.3389/fphys.2018.01914
Received: 16 July 2018; Accepted: 18 December 2018;
Published: 04 February 2019.
Edited by:
Miguel A. Aon, National Institute on Aging (NIA), United StatesReviewed by:
Karin Nowikovsky, Medical University of Vienna, AustriaElena N. Dedkova, University of California, Davis, United States
Copyright © 2019 Haumann, Camara, Gadicherla, Navarro, Boelens, Blomeyer, Dash, Boswell, Kwok and Stowe. This is an open-access article distributed under the terms of the Creative Commons Attribution License (CC BY). The use, distribution or reproduction in other forums is permitted, provided the original author(s) and the copyright owner(s) are credited and that the original publication in this journal is cited, in accordance with accepted academic practice. No use, distribution or reproduction is permitted which does not comply with these terms.
*Correspondence: David F. Stowe, dfstowe@mcw.edu
†Present address: Johan Haumann, Department of Anesthesiology and Pain Management, Maastricht University Medical Centre, University Pain Centre Maastricht, Maastricht, Netherlands Ashish K. Gadicherla, Institute of Clinical Medicine, University of Oslo, Oslo, Norway Age D. Boelens, Department of Anesthesiology, Academic Medical Center, University of Amsterdam, Amsterdam, Netherlands Christoph A. Blomeyer, Department of Anesthesia and Critical Care, University Hospital Würzburg, Würzburg, Germany