 Fuli Kong1,2†
 Lu Bai1,2†Zhengxiao He1,2
 Jiahong Sun1,2Xiaodong Tan1,2Di Zhao1,2Furong Feng3Dawei Liu3
 Guiping Zhao1,2
 Jie Wen1,2*
 Ranran Liu1,2*
- 1Institute of Animal Sciences, Chinese Academy of Agricultural Sciences, Beijing, China
- 2State Key Laboratory of Animal Nutrition, Key Laboratory of Animal (Poultry), Genetics Breeding and Reproduction, Ministry of Agriculture, Beijing, China
- 3Foshan Gaoming Xinguang Agricultural and Animal Industrials Corporation, Foshan, China
White striping (WS) is the most common myopathy in the broiler chicken industry. To reveal flavor changes of WS meat objectively, flavor precursors of WS breast muscle were evaluated systematically with integrated metabolomics and lipidomics. The results showed that WS could be distinguished from normal controls by E-nose, and four volatile compounds (o-xylene, benzene, 1,3-dimethyl, 2-heptanone and 6-methyl and Acetic acid and ethyl ester) were detected as decreased compounds by gas chromatography-mass spectrometry. Lipidomic analysis showed that WS breast fillets featured increased neutral lipid (83.8%) and decreased phospholipid molecules (33.2%). Targeted metabolomic analysis indicated that 16 hydrophilic metabolites were altered. Thereinto, some water-soluble flavor precursors, such as adenosine monophosphate, GDP-fucose and L-arginine increased significantly, but fructose 1,6-bisphosphate and L-histidine significantly decreased in the WS group. These results provided a systematic evaluation of the flavor precursors profile in the WS meat of broiler chickens.
1 Introduction
Chicken, especially the breast muscle, is widely regard as an important source of high quality protein with low lipid content (Marangoni et al., 2015). Modern broilers have been intensively selected for an accelerated growth rate and increased breast yield. Consequently, growth-related breast muscle abnormalities have been reported successively in recent years. Studies have shown that factors influencing the incidence of the WS symptom are breast weight, dietary nutrition, dietary management, inheritance, and gender (Kuttappan et al., 2012a; Kuttappan et al., 2013; Trocino et al., 2015; Malila et al., 2018). WS is featured with white striations parallel to muscle fibers (Kuttappan et al., 2012a). WS incidence has varied from 12% up to 98% in broilers (Kuttappan et al., 2012a; Petracci et al., 2013; Tijare et al., 2016; Kuttappan et al., 2017; Malila et al., 2018; Golzar Adabi and Demirok Soncu, 2019). According to the degree of WS partitioning, the affected breasts were divided into normal, moderate, severe, or extreme (Kuttappan et al., 2016). De carvalho et al. (2020) showed that the occurrence of moderate WS (9.6%–92.5%) was always well above severe WS (0.0%–2.5%), which was consistent with a report by Golzar Adabi and Demirok Soncu, (2019). Breast fillets with severe scores are not suitable for fresh retails due to an unacceptable appearance, but breasts with a moderate score are common in the supermarket. Thus, moderate WS deserves further study in the respect of flavor quality.
In general, the disadvantages of WS meat quality include the appearance, nutritional value and processing characteristics (water holding capacity) (Kuttappan et al., 2012b; Petracci et al., 2013; Baldi et al., 2018). Moderate WS does not have a significant impact on cook loss, marinade uptake and Meullenet-Owens razor shear energy (Tijare et al., 2016) and texture attributes (such as juiciness, rate of breakdown, chewiness, cohesiveness and hardness) (Sanchez Brambila et al., 2016). Therefore, moderate WS with minor changes in appearance has few effects on meat quality.
It is well-known that intramuscular fat (IMF), composed of triacylglycerols (TGs), phospholipids, etc., is an important factor to increase meat quality (Cui et al., 2012; Jiang et al., 2017; Qiu et al., 2017). A certain amount of IMF content can enhance flavor, tenderness, water retention and the sensory quality of meat (Suzuki et al., 2005; Zhao et al., 2007). It was reported that phospholipids contribute significantly to pork and beef flavor (Mottram 1998; Huang et al., 2010). Gandemer (2002) although TGs were also important for flavor formation as TGs contributed 30%–50% of free fatty acids. WS was associated with a greater amount of lipids and moderate scored WS fillets were also rich in polyunsaturated fatty acids (Kuttappan et al., 2012a; Golzar Adabi and Demirok Soncu, 2019). However, there are limited systematic evaluations of flavor precursors in WS meat. In this study, integrated lipidomics and metabolomic analyses were applied to reveal volatile compounds, lipids and hydrophilic metabolite changes in WS meat.
2 Materials and methods
2.1 Broiler husbandry and sample collection
One hundred male Arbor Acres (AA) commercial broilers were raised in the Institute of Animal Sciences at the Chinese Academy of Agricultural Sciences (IASCAAS, Beijing, China) experimental base. Broilers were fasted for 12 h and weighed individually at 42 d of age. All the chickens were electrically stunned and slaughtered. The samples about 20 g of the right breast muscle from the cranial part were collected and stored at −80°C. The samples were crushed and mixed after defrosted at 4°C, two portions of 6 g samples were weighed and used for E-nose and GC/MS test separately. The left part was deboned and stored for 3 h at 4°C before scoring. Five moderate WS breast fillets and five normal samples selected were used for the E-nose and volatile compounds measurement.
A total of 150 male fast-growing white feathered pure line B were raised by Xinguang Agricultural and Animal Industrial Co., Ltd. (Mile, China). The chickens were fasted for 12 h and weighed individually at 42 d of age. The samples from the superficial layer of the cranial part of the right breast muscle were collected and stored at −80°C for next step analyses. Other procedures such as selection and slaughter of chickens, deboned left breast and WS scoring were the same as in the AA broilers flock. Five moderate WS breast fillets and five normal samples selected were used for omics analysis.
All chickens were raised individually in three-story step cages and the environmental conditions and nutritional compositions were same as recommended by the Feeding Standard of Chickens in China (NY 33-2004). The diets and water were available ad libitum. The guidelines established by the Ministry of Science and Technology (Beijing, China) was the reference standard of this experimental animals. All procedures were approved by the ethics committee of the Institute of Animal Sciences in the CAAS and the reference number was IAS 2019-44.
2.2 Phenotype identification and sample selection
The left breast fillets of 100 AA commercial broilers and 150 pure line B chickens were scored. Briefly, the score included normal breast score = 0, moderate WS score = 1 (narrow fat white lines, <1 mm wide), severe WS score = 2 (fat white lines 1–2 mm wide and visible on the surface) and extreme WS score = 3 (white bands >2 mm wide and covering the whole surface) (Kuttappan et al., 2016). The compression test was introduced to identify fillet with WB.The compression force of fillets was measured as described by Sun et al. (2018). Fillets were measured on cranial regions and compressed to 20% with a 6-mm flat probe on a TA.XT Plus Texture Analyzer (Stable Micro Systems Ltd., Godalming, United Kingdom). The parameters were set as follows: trigger force was 5 g, probe height was 55 mm, pre- and post-probe speeds were 10 mm/s and the test probe speed was 5 mm/s. Each fillet was tested three times at different regions of the fillet.
The breast tissues of pure line B were used to estimate the triglyceride (TG) content commercial kits (Nanjing Jiancheng Bioengineering Institute, Nanjing, China). In brief, procedures were as follows: add 18 ml absolute ethyl alcohol solution in the tube with 2 g breast tissue and ground for 2 min with a tissue grinder, centrifuged at 2,500 rmp for 10 min at 4°C, then obtain the supernatant for TG determined.
2.3 Electronic nose analysis
The five moderate WS and five control samples from AA chickens were defrosted at 4°C, and 6.0 g of each sample were placed in sealed sample bottles, and the ratio of water to meat is 2:1. Subsequently, the bottles were boiled at 100°C for a further 30 min (Jin et al., 2021). The E-nose used in the experiment was a Heracles II moderate (Alpha MOS, Toulouse, France) based on fast gas chromatography (GC). There are two ultrasensitive flame ionization detectors (μ-FIDs) and two capillary columns of different polarity including a non-polar MTX-5 (5% diphenyl) and a medium polarity MXT1701 (14% cyanopropyl-phenyl) dimensioning as 10 m × 0.18 mm × 0.4 μm. There are also an Odor Scanner HS 100 autosampler (Gerstel GmbH, Mülheim, Germany) equipped with the E-nose. All samples were incubated at 50°C for 30 min and agitation at 500 rpm. The headspace phase (3,000 μL) was migrated to the injector and heated to 200°C. The parameters were as follows: initial temperature at 70°C for 29 s, then ramped at 2°C/s to 250°C for 34 s, and the detector temperature was at 270°C. The carrier gas was Hydrogen N5.0 (Linde Gaz, Krakow, Poland).
2.4 Analysis of volatile compounds
The same pre-treated were applied as those for the electronic nose analysis. The solid-phase microextraction (SPME) arrows were directly migrated and desorbed in the injection port of the GC for 3 min on splitless mode after headspace extraction. GC-mass spectrometry (MS) (Thermo Fisher Scientific, United States) with a TG-WAX capillary column (30 m × 0.25 mm, 0.25 μm film wide, Thermo Fisher Scientific, Waltham, MA, United States) were used for volatile compounds analysis. Firstly, the column temperature was kept at 40°C for 2 min, then slowly increased to 230°C at a rate of 4°C/min and finally kept at 230°C for 5 min. The mass spectrometer parameters were as follows: ion source temperature 280°C, interface temperature 250°C and electron ionization (EI) 70 eV; MS detection was full scan mode (mass range of 30-400 m/z). Each chromatographic peak corresponded by each spectrogram was qualitatively determined according to the computer chart. The mass spectra were compared with information from the National Institute of Standards and Technology and Wiley libraries and the linear retention indices (LRIs) was matched with the online database to confirmed all the information (http://www.flavornet.org/https://pubchem.ncbi.nlm.nih.gov/), then the volatile compounds were identified.
2.5 Lipidomics analysis
Five controls and five moderate WS samples were selected in pure line B. The lipids were extracted as follows: added 650 μL chloroform/methanol (2:1 v/v) into 65 mg sample and homogenized by a superfine homogenizer. The 150 μL water was added; samples were vortexed for 2 min and incubated for 10 min at 4°C, then centrifuged at 3,000 rpm for 15 min at 4°C. Transferred the lower chloroform layer into a new tube (1.5 ml, Eppendorf, Wesseling-Berzdorf, Germany) and aqueous washing was repeated twice again. The extracts were dried in a Thermo Scientific Savant Vac (ThermoFisher, Waltham, MA) for 1.5 h and dry pellets were stored at -80°C. The pellet was dissolved and protein concentration was determined and normalized to the protein level for the later detection.
Untargeted lipidomics test was carried out with the Q-Exactive Orbitrap mass spectrometer coupled to a UPLC system Ultimate 3,000 (Thermo Fisher). The UPLC system was coupled to a Q-Exactive HFX Orbitrap mass spectrometer (Thermo Fisher) which was furnished with a heated electrospray ionization (HESI) probe. Lipid extracts were obtained by a Cortecs C18 column (100 × 2.1 mm, Waters, Milford, MA, United States). A binary solvent system was utilized. The mobile phase A consisted of Acetonitrile (ACN): H2O (60:40), 10 mM ammonium acetate, and the mobile phase B included iso-propyl alcohol (IPA): ACN (90:10), 10 mM ammonium acetate. A 35-min gradient was applied with a flow rate of 220 μL/min. The sample tray and column chamber were preserved at 10°C and 40°C, respectively.
The data were obtained through data dependent acquisition by MS/MS. The mass spectrometer parameters were set as follows: a spray voltage of 3,200 V (positive) and 2,800 V (negative), an auxiliary gas flow rate of 10 Arb units, a capillary temperature of 320°C, an NCE of 15/30/45, a mass range (m/z) of 240–2,000 (positive) and 200–2,000 (negative), and a topN of 10. A full scan and fragment spectra were acquired with a resolution of 70,000 and 17,500, respectively. Lipid identification were carried out by LipidSearch software (Version 4.1.16; Thermo Fisher). The relative quantification of the identified lipids were calculated from their relative peak areas.
2.6 Metabolomics analysis
Five controls and five moderate WS from pure line B were used for metabolite extraction and metabolomics analysis based on MS. Added HPLC-grade methanol (700 μL, 80% v/v) which was cooled at −80°C for 2 h to the sample (70 mg). The mixture was ground in dry ice by a superfine homogenizer, vortexed for 3 times (10 s per time) incubated at −80°C for 8 h and centrifuged at rmp 12.000 at 4°C for 20 min. The supernatant of the sample was diverted to a new tube (1.5 ml, Eppendorf) and concentrated by a Thermo Scientific Savant Vac for 4 h to dryness. 80% methanol was used for the redissolution of residues to furthur analyze.
Targeted metabolomic analysis was implemented by TSQ Quantiva (Thermo Fisher Scientific). Reverse-phase chromatography (C18 column) was used with 10 mM tributylamine, 15 mM acetate in water as mobile A and 100% methanol as mobile phases B. The emphasis of this analysis was the TCA cycle, glycolysis pathway, amino acids, purine metabolism and pentose phosphate pathway. In this experiment, we used a 25-min gradient from 5% to 90% as mobile B. Data acquisition form the positive-negative ion switching mode. The resolving power of Q1 and Q3 are both 0.7 FWHM. The source voltage positive-negative ion mode was 3,500 v and 2,500 v respectively. The source work conditions were as follows: heater temperature, 300°C; auxiliary gas flow rate, 10; sheath gas flow rate, 35; spray voltage, 3,000 v; capillary temperature, 320°C. Tracefinder 3.2 (Thermo Fisher Scientific) with a home-built database was used for the metabolite identification.
2.7 Statistical analysis
The SPSS 25.0 software (SPSS, Inc., Chicago, IL) was utilized. Statistical evaluation was carried out by the Student’s two-tailed t-test. Data are displayed as means ± standard error. Statistical significance was set as p < 0.05. Principal component analysis (PCA) and pathway analysis were performed with MetaboAnalyst 5.0. Graphs were generated with GraphPad Prism 8.0 software (GraphPad Software Inc., La Jolla, CA).
3 Results
3.1 Phenotype identification and sample selection
In the 100 AA chickens measured, there were eight (8%) moderate WS, six (6%) severe WS, 27 (27%) WB and 35 (35%) WB accompanied by WS were found. The compression force, the body weight and breast weight were similar between WS and controls (Table 1). In the 150 pure line B chickens, there were 23 (15%) moderate WS, 43 (29%) WB and 25 (17%) WB accompanied by WS were found. The compression force and TG remarkably increased in the WS group, but the average body weight and breast weight were similar. The figures of WS breast with score 1 and controls are displayed in Figure 1A. The samples with severe WS or WB were excluded in the following test.
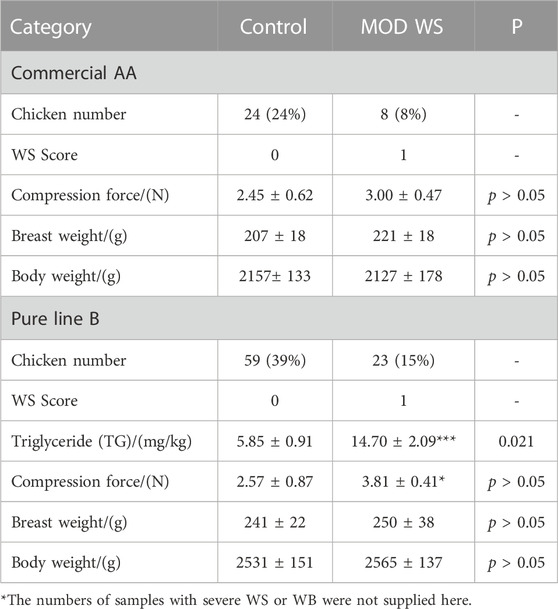
TABLE 1. The compression force, breast weight and body weight between the control and moderate WS groups in AA and pure line B chickens.*
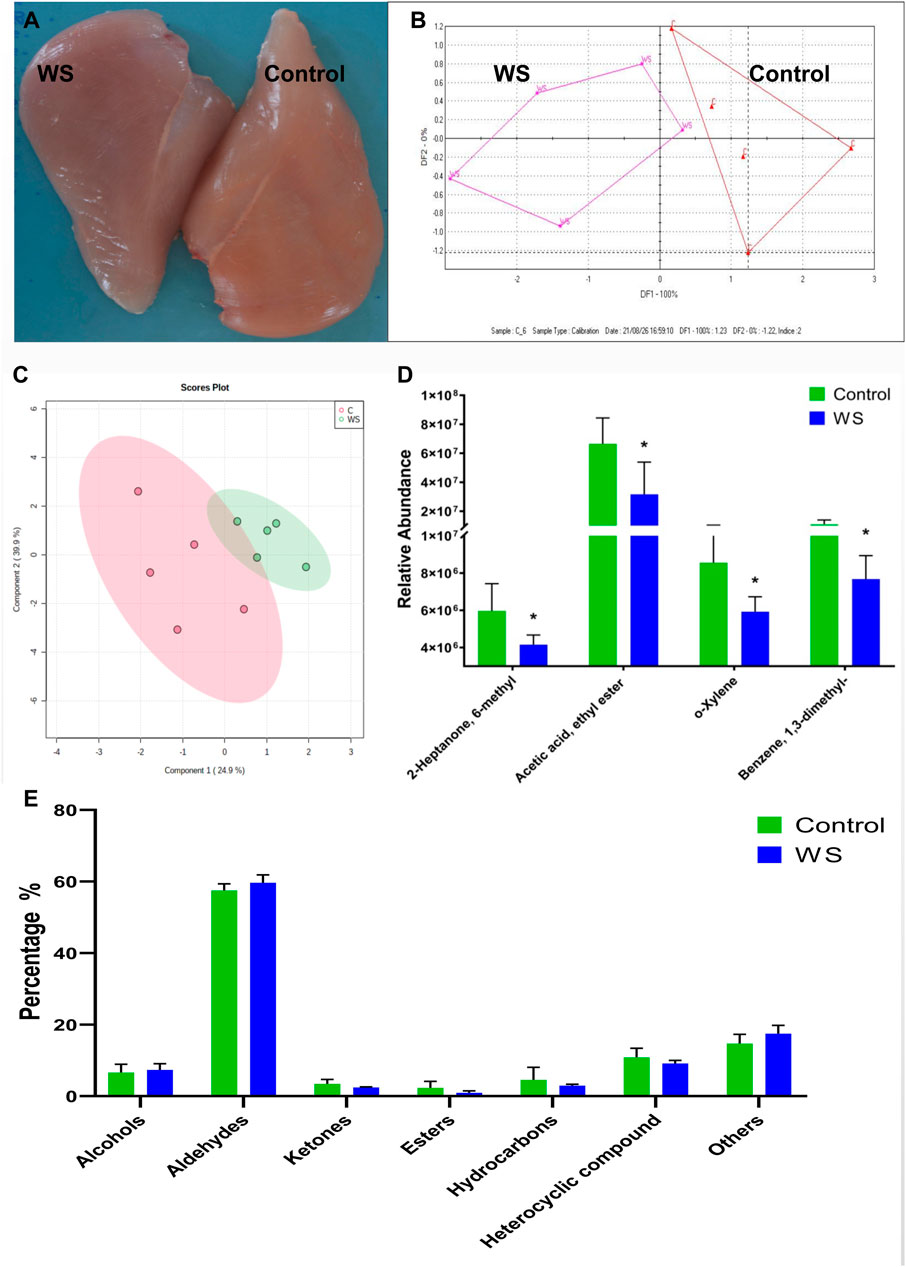
FIGURE 1. The differences between the moderate WS and control breast fillets in AA chickens. (A) representative WS (scores 1) and control breast muscle. (B) E-nose results was displayed by the discriminant factor analysis (DFA). (C) Volatile compounds in the WS and normal breast fillets showed by partial least squares-discriminant analysis (PLS-DA) score plots. (D) Relative abundance of significant differential volatile flavor molecules between the two groups. (E) The percentage of volatile categories identified in breast fillets (*p < 0.05).
3.2 Analysis of volatile organic compounds (VOCs) in WS and normal breast fillets
Moderate WS samples were selected from AA broilers and measured using E-nose. The WS meat could be distinguished with discriminant factor analysis (DFA) (Figure 1B). The changes of VOCs in WS fillets were further measured by GC-MS. Overall, 101 VOCs from breast fillets were identified (Supplementary Table S1). These VOCs were classified into seven categories: alcohols (8), aldehydes (27), ketones (16), esters (6), hydrocarbons (17), heterocyclic compounds (18) and other compounds (9). Based on the PLS-DA score plot, there was some overlap between the control and moderate WS group (Figure 1C). For hydrocarbons, the relative intensity of o-xylene and benzene, 1,3-dimethyl in WS significantly decreased (Figure 1D). Regarding ketones and esters, levels of 2-heptanone, 6-methyl and acetic acid and ethyl ester in the WS group were remarkably lower than in the controls (Figure 1D). There is no significant difference of the percentage of volatile categories between the control and moderate WS groups (Figure 1E).
3.3 Lipidomic analysis of WS and normal breast fillets
There are 560 lipid molecules identified form the positive and negative ion mode in breast fillets of pure line B (Supplementary Table S2) including 20 lipid categories. The major lipid categories were phosphatidylcholine (PC, 138), phosphatidylethanolamine (PE, 133) and TG (108) (Table 2, Supplementary Table S3). PCA analysis demonstrated discrimination between the control and WS fillets (Figure 2A). The lipid molecules with significantly differential abundance in WS are shown in Figure 2B and Table 2. Compared with the control group, TGs increased in 90 categories whereas PCs in 52 categories and PEs in 38 categories decreased. In total, 29 categories of TGs increased 2.5-fold-6.2-fold as shown in Figures 2C,D. Changes in PC and PE lipid molecules were lower than 66.7% of the controls (Figure 2E). The ranges of 10 PC categories decreased from 33.5% to 46.4% and 7 categories of PEs changed from 35.6% to 40.0%. As shown in Figure 2F, the relative level of monounsaturated fatty acids (MUFAs) was remarkably increased in the WS (45.48%) than in the controls (38.85%). The level of SFAs and PUFA was significantly decreased in the WS (36.82%, 17.69%, respectively) than in the controls (41.77%, 19.38%, respectively).
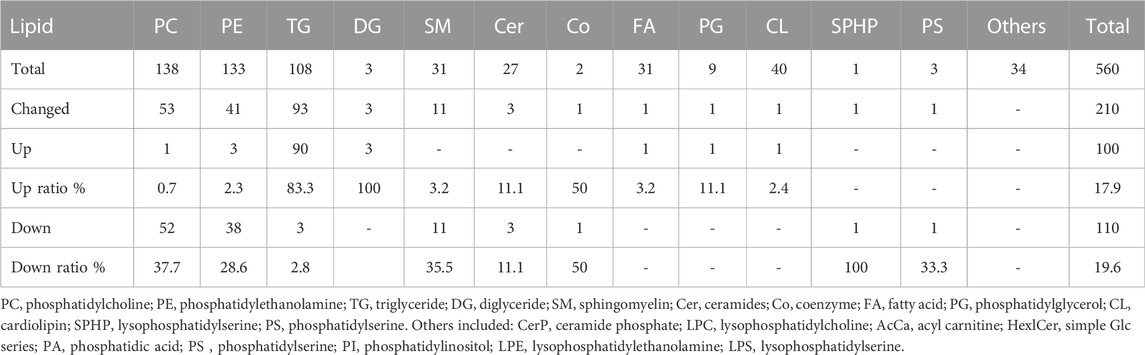
TABLE 2. The number of increased and decreased lipid molecules in different lipid categories of the WS group in the pure line B chickens.
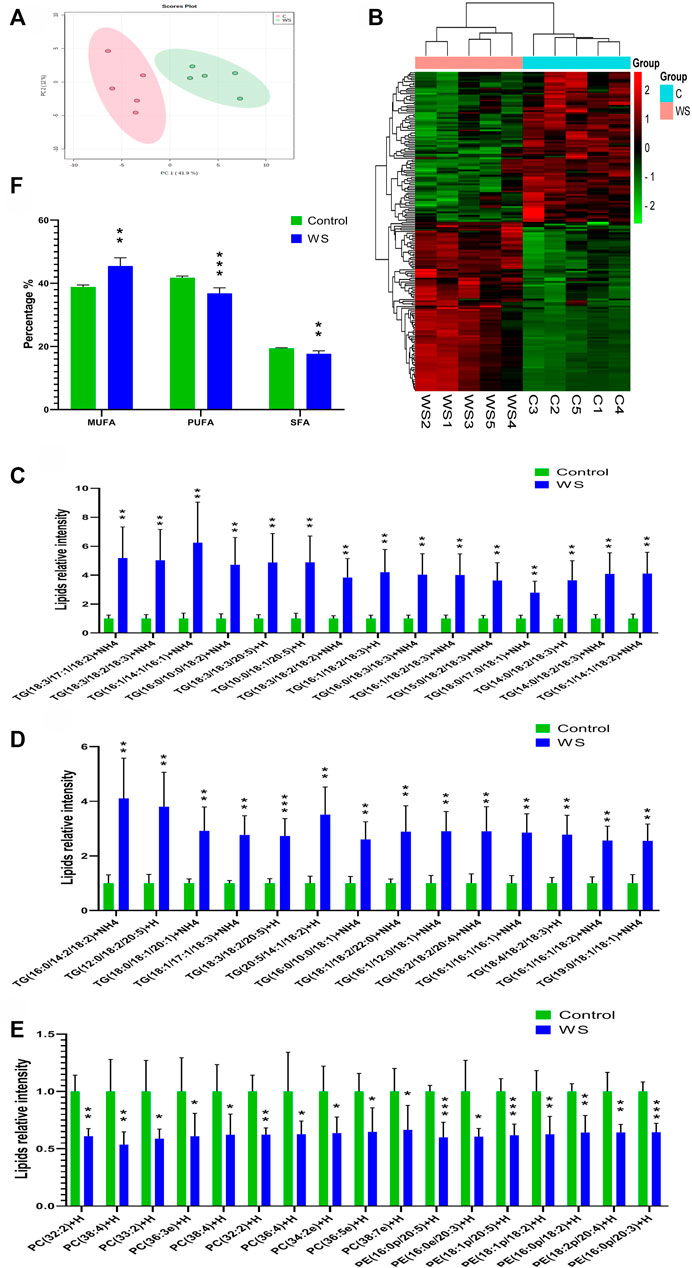
FIGURE 2. The lipid profiles of moderate WS and control breast fillets in pure line B chickens. (A) Principal component analysis (PCA) score plots of all the lipid molecules in the WS and control. (B) Heat map of significantly different lipid molecular categories influenced by WS. Increased and decreased lipids molecules were represented by red and green cells of the heat map respectively. (C–D) Differential abundance of TG lipid molecules in the WS group higher than 2.5-fold change of controls. (E) Differential abundance of PC and PE lipid molecules in the WB-affected group lower than 66.7% of the controls. (F) Percentages of MUFAs, PUFAs and SFAs in FAs. TGs, triglycerides; PC, phosphatidylcholine; PE, phosphatidylethanolamine; SFAs, saturated fatty acids; MUFAs, monounsaturated fatty acids; PUFAs, polyunsaturated fatty acids (*p < 0.05, **p < 0.01, ***p < 0.001).
3.4 Hydrophilic metabolites changed by WS symptom in breast according to targeted metabolomics
A total of 98 compounds in breast fillets in pure line B were determined (Supplementary Table S4). An obvious separation between the WS samples and controls based on PLS-DA is shown in Figure 3A. There were 16 hydrophilic metabolites significantly changed between the WS group and control. The significant metabolites are displayed in heat map analysis (p < 0.05; Figure 3B). As shown in Figure 3D, 14 metabolites, including adenosine monophosphate (AMP)/2′-deoxyguanosine 5′-monophosphate (dGMP), GDP-fucose, xanthosine, L-arginine, and oxidized glutathione, increased in the WS group. Only fructose 1,6-bisphosphate and L-histidine significantly decreased in WS. One pathway, glutathione metabolism, was enriched (p-value <0.05) using the 16 hydrophilic metabolites (Figure 3C).
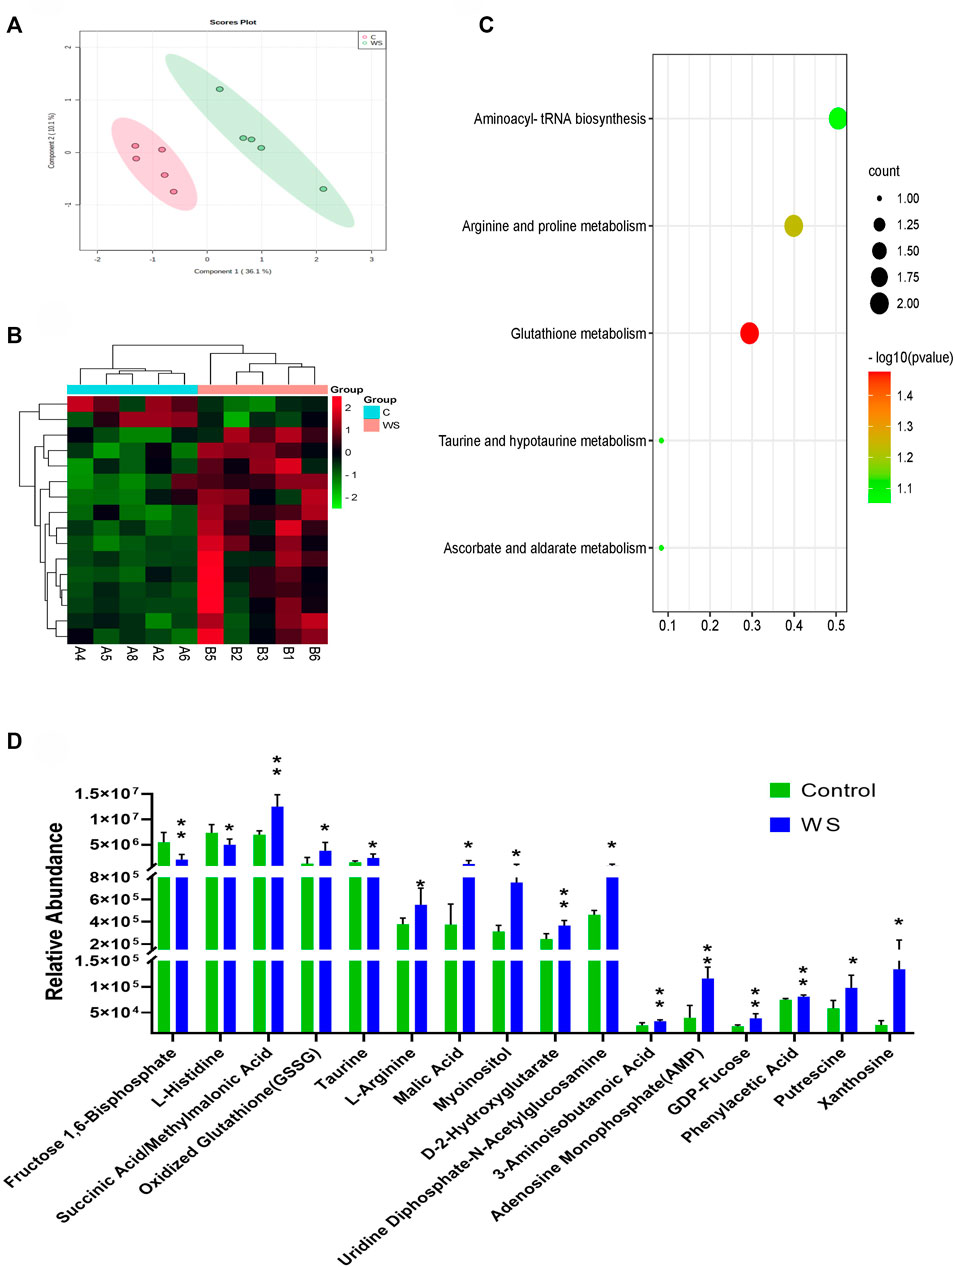
FIGURE 3. Targeted metabolomic analysis of moderate WS and controls in pure line B. (A) PLS-DA score plots of individual metabolites moderate WS and controls. (B) Heat map and (D) changes in remarkably different metabolites in the breast muscle affected by WS. (C) Overview of pathway enriched with significant metabolites in the breast muscle (*p < 0.05, **p < 0.01).
4 Discussion
Flavor composed of taste and aroma is an important sensory attribute in the overall acceptance of meat (Wang et al., 2019). Aroma is a consequence of various VOCs that are produced by the complex biochemical changes of the inherent composition of the meat (Shahidi et al., 1986; Khan et al., 2015), such as lipid oxidation, Strecker, Maillard reactions and thiamine degradation (Resconi et al., 2013). However, taste is due to non-volatile water-soluble compounds closely related to water-soluble precursors including carbohydrate compounds, peptides, nucleotides, free amino acids and other nitrogenous components (Mottram and Edwards, 1983). In short, the formation of specific meat flavors can be achieved through different reactions among amino acids of meat hydrolysate and cysteine or methionine and glucose (Jayasena et al., 2013). Therefore, any alteration of metabolite and lipid composition may cause changes in flavor.
The E-nose can analyze food objectively by the instrument of “smell” (Shi et al., 2018). E-nose was able to detect changes in chicken meat owing to storage time and temperature according to Boothe and Arnold (2002). E-noses can also be used to distinguish the flavor of different Chinese local high-quality chicken meat (Jin et al., 2021). In this study, we found that moderate WS and control AA broiler samples could be distinguished by an E-nose. The volatile compounds were further detected by GC-MS in detail. Moderate WS breast contained about 70% of the o-xylene, benzene, 1,3-dimethyl and 2-heptanone and 6-methyl found in the control group. Acetic acid and ethyl ester in moderate WS decreased significantly to 48% of normal levels. The four volatile compounds did not belong to the major volatile compounds found in chicken; 2-methyl-3-furanthiol is reported as the most important compound in chicken flavor and aldehyde is the major one in chicken meat (Jin et al., 2021). In this study, there was no significant difference in aldehyde content between WS and normal groups. This indicates that the major content of WS volatile compounds did not change in moderate WS meat.
As for the 150 pure line chickens, the muscle TG remarkably increased in the WS group. Previous studies also evidenced that the WS samples were increased lipidosis (Kuttappan et al., 2013; Baldi et al., 2018), and moderate WS samples exhibited higher lipid content compared with control samples (Carvalho et al., 2021). Based on the results obtained from lipidomic analysis of pure line broiler chickens, 83.3% of TGs increased, 37.7% of PCs and 28.6% of PEs decreased in the WS meat. Some studies have demonstrated that phospholipids, not TGs, contributed to the sensory aroma in beef (Mottram and Edwards, 1983). Our findings suggested a decreasing pattern in phospholipid flavor precursors in the moderate WS breast fillets. Phospholipids, mainly composed of PCs and PEs and the lipolysis PE, were the main contributor to the increase of free fatty acids during the formation of meat flavor of Nanjing dry-cured duck (Xu et al., 2008). In this study, there are 38 PEs (28.6%) that were decreased significantly and this may be related to the limited changing of VOCs found in the WS tested. The samples for VOCs and lipidomic measurements were from different chicken flocks, which could also influence the consistency of the results. The specific relationship between lipid changes and volatile flavor substances needs further study.
In food, umami taste plays a important role in consumer satisfaction and it is derived from several non-volatile compounds with regard to amino acids, predominantly glutamate and aspartic acid and 5′-nucleotides such as AMP, inosine-5′-monophosphate (IMP) and GMP (Chen and Zhang, 2007). The water-soluble flavor precursors make a important contribution to the umami taste (Mottram, 1998). IMP contributes to the taste of chicken meat (Fujimura et al., 1996; Vani et al., 2006) and ribose, ribose-5-phosphate, glucose and glucose-6-phosphate are the main carbohydrates with flavor-forming potential (Meinert et al., 2009). In this study, AMP/GMP, xanthosine and GDP-fucose increased significantly and fructose 1,6-bisphosphate decreased significantly in the WS meat. By One-dimensional 1H-NMR, previous research showed that malonate, taurine, threonine, and arginine were important metabolites for distinguishing normal breast from severe WS (Cônsolo et al., 2020). The inconsistency results showed in two studies may be related to the different analysis methods and the sample conditions. A certain lysine to arginine ratio decreases cooking loss and increases the water holding capacity of pork sausage (Zheng et al., 2017). Histidine is the second largest contribution to taste activity value (TAV) in local chicken breast muscles (Zhao et al., 2020). The increased arginine and decreased histidine of WS found in the current study may also affect the final taste of the breast meat. Thus, changes in water-soluble metabolites may affect the flavoring and substance composition of moderate WS meat. There are still some limitations in our study that volatile compounds and lipids were tested in different sample collections. More studies are required to further explore the flavor precursor alterations related to chicken white striping symptom.
5 Conclusion
GC-MS results showed that four volatile compounds, o-xylene, benzene, 1,3-dimethyl, 2-heptanone, 6-methyl and acetic acid, ethyl ester, were found to be decreased in WS meat. Lipidomic analysis showed that the WS meat featured increased neutral lipid, decreased phospholipid molecules. Targeted metabolomic analysis indicated that 16 hydrophilic metabolites were altered in the WS meat. In the WS group, water-soluble flavor precursors, such as L-arginine, AMP/dGMP, xanthosine and GDP-fucose increased significantly but fructose 1,6-bisphosphate and L-histidine significantly decreased. These results provided a systematic evaluation of the flavor precursors in the WS meat of broiler chickens.
Data availability statement
The original contributions presented in the study are included in the article/Supplementary Material, further inquiries can be directed to the corresponding authors.
Ethics statement
The animal study was reviewed and approved by Institute of Animal Sciences in the Chinese Academy of Agricultural Sciences (IAS, CAAS, Beijing, China) with the following reference number: IAS2019–44.
Author contributions
RL and JW designed the study. FK, RL, LB, and JS performed the animal experiments and samples collection. FK and LB tested the phenotypes. FK, RL and LB performed data analysis and wrote the manuscript. JW, GZ, ZH, XT, and DZ discussed the results and provided valuable suggestion and comments to improve the manuscript. FF and DL were involved in the breeding and slaughtering of experimental materials. All authors contributed to the article and approved the submitted version.
Funding
This research was supported by grants from the National Key Research and Development Program of China (2022YFD1301600), the Study of the Key Genetic Resources [JBGS (2021) 107], the Agricultural Science and Technology Innovation Program (CAAS-ZDRW202005), and the China Agriculture Research System (CARS-41).
Acknowledgments
The authors highly acknowledge the excellent technical support by the Metabolomics Center at Tsinghua University-National Protein Science Facility. Meanwhile, sincerely thanks to Jing Li from Institute of Animal Science, Chinese Academy of Agricultural Sciences for her guidance on data analysis.
Conflict of interest
FF and DL were empolyed by Foshan Gaoming Xinguang Agricultural and Animal Industrials Corporation.
The remaining authors declare that the research was conducted in the absence of any commercial or financial relationships that could be construed as a potential conflict of interest.
Publisher’s note
All claims expressed in this article are solely those of the authors and do not necessarily represent those of their affiliated organizations, or those of the publisher, the editors and the reviewers. Any product that may be evaluated in this article, or claim that may be made by its manufacturer, is not guaranteed or endorsed by the publisher.
Supplementary material
The Supplementary Material for this article can be found online at: https://www.frontiersin.org/articles/10.3389/fphys.2022.1079667/full#supplementary-material
References
Baldi G., Soglia F., Mazzoni M., Sirri F., Canonico L., Babini E., et al. (2018). Implications of white striping and spaghetti meat abnormalities on meat quality and histological features in broilers. Animal 12 (1), 164–173. doi:10.1017/S1751731117001069
Boothe D. D. H., Arnold J. W. (2002). Electronic nose analysis of volatile compounds from poultry meat samples, fresh and after refrigerated storage. J. Sci. Food Agric. 82 (3), 315–322. doi:10.1002/jsfa.1036
Carvalho L. M., Delgado J., Madruga M. S., Estévez M. (2021). Pinpointing oxidative stress behind the white striping myopathy: Depletion of antioxidant defenses, accretion of oxidized proteins and impaired proteostasis. J. Sci. Food Agric. 101 (4), 1364–1371. doi:10.1002/jsfa.10747
Chen D.-W., Zhang M. (2007). Non-volatile taste active compounds in the meat of Chinese mitten crab (Eriocheir sinensis). Food Chem. 104 (3), 1200–1205. doi:10.1016/j.foodchem.2007.01.042
Cônsolo N. R. B., Samuelsson L. M., Barbosa L. C. G. S., Monaretto T., Moraes T. B., Buarque V. L. M., et al. (2020). Characterization of chicken muscle disorders through metabolomics, pathway analysis, and water relaxometry: A pilot study. Poult. Sci. 99 (11), 6247–6257. doi:10.1016/j.psj.2020.06.066
Cui H. x., Liu R. r., Zhao G. p., Zheng M. q., Chen J. l., Wen J. (2012). Identification of differentially expressed genes and pathways for intramuscular fat deposition in pectoralis major tissues of fast-and slow-growing chickens. BMC Genomics 13 (213), 213. doi:10.1186/1471-2164-13-213
De Carvalho L. M., Madruga M. S., Estevez M., Badaro A. T., Barbin D. F. (2020). Occurrence of wooden breast and white striping in Brazilian slaughtering plants and use of near-infrared spectroscopy and multivariate analysis to identify affected chicken breasts. J. Food Sci. 85 (10), 3102–3112. doi:10.1111/1750-3841.15465
Fujimura S., Hidenori Koga H. T., Tone N., Kadowski M., Ishibashi T. (1996). Role of taste-active components, glutamic acid, 5'-inosinic acid and potassium ion in taste of chicken meat extract. Animal Sci. Technol. Jpn. 67 (5), 423
Gandemer G. (2002). Lipids in muscles and adipose tissues, changes during processing and sensory properties of meat products. Meat Sci. 62, 309–321. doi:10.1016/s0309-1740(02)00128-6
Golzar Adabi S., Demirok Soncu E. (2019). White striping prevalence and its effect on meat quality of broiler breast fillets under commercial conditions. J. Animal Physiology Anim Nutr. (Berl) 103 (4), 1060–1069. doi:10.1111/jpn.13092
Huang Y.-C., Li H.-J., He Z.-F., Wang T., Qin G. (2010). Study on the flavor contribution of phospholipids and triglycerides to pork. Food Sci. Biotechnol. 19 (5), 1267–1276. doi:10.1007/s10068-010-0181-0
Jayasena D. D., Dong Uk Ahn K., Jo C., Jo C. (2013). Flavour chemistry of chicken meat: A review. Asian-Australasian J. Animal Sci. 26 (5), 732–742. doi:10.5713/ajas.2012.12619
Jiang M., Fan W. L., Xing S. Y., Wang J., Li P., Liu R. R., et al. (2017). Effects of balanced selection for intramuscular fat and abdominal fat percentage and estimates of genetic parameters. Poult. Sci. 96 (2), 282–287. doi:10.3382/ps/pew334
Jin Y., Cui H., Yuan X., Liu L., Liu X., Wang Y., et al. (2021). Identification of the main aroma compounds in Chinese local chicken high-quality meat. Food Chem. 359 (129930), 129930. doi:10.1016/j.foodchem.2021.129930
Khan M. I., Jo C., Tariq M. R. (2015). Meat flavor precursors and factors influencing flavor precursors–A systematic review. Meat Sci. 110, 278–284. doi:10.1016/j.meatsci.2015.08.002
Kuttappan V. A., Brewer V. B., Apple J. K., Waldroup P. W., Owens C. M. (2012a). Influence of growth rate on the occurrence of white striping in broiler breast fillets. Poult. Sci. 91 (10), 2677–2685. doi:10.3382/ps.2012-02259
Kuttappan V. A., Brewer V. B., Mauromoustakos A., McKee S. R., Emmert J. L., Meullenet J. F., et al. (2013). Estimation of factors associated with the occurrence of white striping in broiler breast fillets. Poult. Sci. 92 (3), 811–819. doi:10.3382/ps.2012-02506
Kuttappan V. A., Hargis B. M., Owens C. M. (2016). White striping and woody breast myopathies in the modern poultry industry: A review. Poult. Sci. 95 (11), 2724–2733. doi:10.3382/ps/pew216
Kuttappan V. A., Lee Y. S., Erf G. F., Meullenet J. F., McKee S. R., Owens C. M. (2012b). Consumer acceptance of visual appearance of broiler breast meat with varying degrees of white striping. Poult. Sci. 91 (5), 1240–1247. doi:10.3382/ps.2011-01947
Kuttappan V. A., Owens C. M., Coon C., Hargis B. M., Vazquez-Añon M. (2017). Incidence of broiler breast myopathies at 2 different ages and its impact on selected raw meat quality parameters. Poult. Sci. 96 (8), 3005–3009. doi:10.3382/ps/pex072
Malila Y., U-Chupaj J., Srimarut Y., Chaiwiwattrakul P., Uengwetwanit T., Arayamethakorn S., et al. (2018). Monitoring of white striping and wooden breast cases and impacts on quality of breast meat collected from commercial broilers (Gallus gallus). Asian-Australas J. Anim. Sci. 31 (11), 1807–1817. doi:10.5713/ajas.18.0355
Marangoni F., Corsello G., Cricelli C., Ferrara N., Ghiselli A., Lucchin L., et al. (2015). Role of poultry meat in a balanced diet aimed at maintaining health and wellbeing: An Italian consensus document. Food & Nutr. Res. 59, 27606. doi:10.3402/fnr.v59.27606
Meinert L., Schafer A., Bjergegaard C., Aaslyng M. D., Bredie W. L. (2009). Comparison of glucose, glucose 6-phosphate, ribose, and mannose as flavour precursors in pork; the effect of monosaccharide addition on flavour generation. Meat Sci. 81 (3), 419–425. doi:10.1016/j.meatsci.2008.08.018
Mottram D. S., Edwards R. A. (1983). The role of triglycerides and phospholipids in the aroma of cooked beef. J. Sci. Food Agric. 34, 517–522. doi:10.1002/jsfa.2740340513
Mottram D. S. (1998). Flavour formation in meat and meat products: A review. Food Chem. 62 (4), 415–424. doi:10.1016/s0308-8146(98)00076-4
Petracci M., Mudalal S., Bonfiglio A., Cavani C. (2013). Occurrence of white striping under commercial conditions and its impact on breast meat quality in broiler chickens. Poult. Sci. 92 (6), 1670–1675. doi:10.3382/ps.2012-03001
Qiu F., Xie L., Ma J. E., Luo W., Zhang L., Chao Z., et al. (2017). Lower expression of SLC27A1 enhances intramuscular fat deposition in chicken via down-regulated fatty acid oxidation mediated by CPT1A. Front. Physiology 8, 449. doi:10.3389/fphys.2017.00449
Resconi V. C., Escudero A., Campo M. M. (2013). The development of aromas in ruminant meat. Molecules 18 (6), 6748–6781. doi:10.3390/molecules18066748
Sanchez Brambila G., Bowker B. C., Zhuang H. (2016). Comparison of sensory texture attributes of broiler breast fillets with different degrees of white striping. Poult. Sci. 95 (10), 2472–2476. doi:10.3382/ps/pew165
Shahidi F., Rubin L. J., D'Souza L. A. (1986). Meat flavor volatiles: A review of the composition, techniques of analysis, and sensory evaluation. Crit. Rev. Food Sci. Nutr. 24 (2), 141–243. doi:10.1080/10408398609527435
Shi H., Zhang M., Adhikari B. (2018). Advances of electronic nose and its application in fresh foods: A review. Crit. Rev. Food Sci. Nutr. 58 (16), 2700–2710. doi:10.1080/10408398.2017.1327419
Sun X., Koltes D. A., Coon C. N., Chen K., Owens C. M. (2018). Instrumental compression force and meat attribute changes in woody broiler breast fillets during short-term storage. Poult. Sci. 97 (7), 2600–2606. doi:10.3382/ps/pey107
Suzi K., Irie M., Kadowaki H., Shibata T., Kumagai M., Nishida A. (2005). Genetic parameter estimates of meat quality traits in Duroc pigs selected for average daily gain, longissimus muscle area, backfat thickness, and intramuscular fat content. J. Animal Sci. 83, 2058–2065. doi:10.2527/2005.8392058x
Tijare V. V., Yang F. L., Kuttappan V. A., Alvarado C. Z., Coon C. N., Owens C. M. (2016). Meat quality of broiler breast fillets with white striping and woody breast muscle myopathies. Poult. Sci. 95 (9), 2167–2173. doi:10.3382/ps/pew129
Trocino A., Piccirillo A., Birolo M., Radaelli G., Bertotto D., Filiou E., et al. (2015). Effect of genotype, gender and feed restriction on growth, meat quality and the occurrence of white striping and wooden breast in broiler chickens. Poult. Sci. 94 (12), 2996–3004. doi:10.3382/ps/pev296
Vani N. D., Modi V. K., Kavitha S., Sachindra N. M., Mahendrakar N. S. (2006). Degradation of inosine-5′-monophosphate (IMP) in aqueous and in layering chicken muscle fibre systems: Effect of pH and temperature. LWT - Food Sci. Technol. 39 (6), 627–632. doi:10.1016/j.lwt.2005.05.003
Wang W., Sun B., Hu P., Zhou M., Sun S., Du P., et al. (2019). Comparison of differential flavor metabolites in meat of lubei white goat, Jining Gray Goat and Boer Goat. Metabolites 9 (9), 176. doi:10.3390/metabo9090176
Xu W., Xu X., Zhou G., Wang D., Li C. (2008). Changes of intramuscular phospholipids and free fatty acids during the processing of Nanjing dry-cured duck. Food Chem. 110 (2), 279–284. doi:10.1016/j.foodchem.2007.11.044
Zhao G. P., Chen J. L., Zheng M. Q., Wen J., Zhang Y. (2007). Correlated responses to selection for increased intramuscular fat in a Chinese quality chicken line. Poult. Sci. 86 (11), 2309–2314. doi:10.1093/ps/86.11.2309
Zhao W. H., Wang G. Y., Wen X., Yuan R, Y., ChangRong G., GuoZhou L. (2020). Selection of water-soluble compounds by characteristic flavor in Chahua chicken muscles based on metabolomics. Sci. Agric. Sin. 53 (8), 1267–1642. doi:10.3864/j.issn.0578-1752.2020.08.012
Keywords: broiler chickens, white striping, lipidomics, metabolomics, flavor precursors
Citation: Kong F, Bai L, He Z, Sun J, Tan X, Zhao D, Feng F, Liu D, Zhao G, Wen J and Liu R (2023) Integrated metabolomics and lipidomics evaluate the alterations of flavor precursors in chicken breast muscle with white striping symptom. Front. Physiol. 13:1079667. doi: 10.3389/fphys.2022.1079667
Received: 25 October 2022; Accepted: 13 December 2022;
Published: 18 January 2023.
Edited by:
Xiquan Zhang, South China Agricultural University, ChinaReviewed by:
Yuwares Malila, National Center for Genetic Engineering and Biotechnology (BIOTEC), ThailandGenxi Zhang, Yangzhou University, China
Copyright © 2023 Kong, Bai, He, Sun, Tan, Zhao, Feng, Liu, Zhao, Wen and Liu. This is an open-access article distributed under the terms of the Creative Commons Attribution License (CC BY). The use, distribution or reproduction in other forums is permitted, provided the original author(s) and the copyright owner(s) are credited and that the original publication in this journal is cited, in accordance with accepted academic practice. No use, distribution or reproduction is permitted which does not comply with these terms.
*Correspondence: Jie Wen, wenjie@caas.cn; Ranran Liu, liuranran@caas.cn
†These authors have contributed equally to this work