 Przemysław Kasiak1,2*
 Tomasz Kowalski3
 Kinga Rębiś3
 Andrzej Klusiewicz3
 Michał Starczewski4
 Maria Ładyga3
 Szczepan Wiecha5
 Marcin Barylski6
 Adam Rafał Poliwczak6Piotr Wierzbiński1Artur Mamcarz1
 Daniel Śliż1
- 13rd Department of Internal Medicine and Cardiology, Medical University of Warsaw, Warsaw, Poland
- 2Doctoral School, Medical University of Warsaw, Warsaw, Poland
- 3Department of Physiology, Institute of Sport—National Research Institute, Warsaw, Poland
- 4Faculty of Rehabilitation, Jozef Pilsudski University of Physical Education in Warsaw, Warsaw, Poland
- 5Faculty of Physical Education and Health, Jozef Pilsudski University of Physical Education in Warsaw, Branch in Biala Podlaska, Biała Podlaska, Poland
- 6Department of Internal Medicine and Cardiac Rehabilitation, Medical University of Lodz, Łódź, Poland
Background: The ratio of oxygen uptake (VO2) to minute ventilation (VE) is described as the oxygen uptake efficiency slope (OUES). OUES has been suggested as a valuable submaximal cardiorespiratory index; however, its characteristics in endurance athletes remain unknown. In this study, we a) investigated OUES between different time intervals, b) assessed their prediction power for VO2peak, and c) derived new prediction equations for OUES tailored for well-trained individuals.
Materials and Methods: A total of 77 male (age = 21.4 ± 4.8 yrs; BMI = 22.1 ± 1.6 kg·m−2; peak oxygen uptake = 4.40 ± 0.64 L·min−1) and 63 female individuals (age = 23.4 ± 4.3 yrs; BMI = 23.1 ± 1.6 kg·m−2; peak oxygen uptake = 3.21 ± 0.48 L·min−1) underwent the cycling cardiopulmonary exercise test. OUES was measured at 75%, 90%, and 100% of exercise duration. Prediction power and new models were derived with the multiple linear regression method.
Results: In male subjects, OUES [mL·min−1/L·min−1] from 75% = 4.53 ± 0.90, from 90% = 4.52 ± 0.91, and from 100% = 4.41 ± 0.87. In female subjects, OUES [mL·min−1/L·min−1] from 75% = 3.50 ± 0.65, from 90% = 3.49 ± 0.62, and from 100% = 3.41 ± 0.58. OUES did not differ between time intervals in male (p = 0.65) and female individuals (p = 0.69). OUES strongly predicts peak VO2 independently from the measuring interval (β = 0.71–0.80; R2 = 0.50–0.63). The prediction model designed for elite athletes was OUES [mL·min−1/L·min−1] = −1.54 + 2.99; BSA [m2]—0.0014; (age [in years]; sex [1 = male, 2 = female]) (R2 = 0.36).
Conclusion: OUES enables an accurate prediction of peak cardiorespiratory fitness in elite endurance athletes. OUES is a feasible alternative to maximal exercise testing. A new prediction equation should be used for highly trained individuals. Physicians should understand OUES physiology to properly assess the cardiorespiratory response to exercise in athletic cohorts.
Introduction
Maximal symptom-limited cardiopulmonary exercise testing (CPET) is a gold standard of assessment of an individual’s endurance capacity, and its diagnostic value is most often assigned to maximal effort (Balady et al., 2010). However, Baba et al. introduced a new submaximal exercise performance indicator, the oxygen uptake efficiency slope (Baba et al., 1996). OUES has previously been evaluated in a clinical context to stratify the risk for cardiovascular diseases (Hollenberg and Tager, 2000).
OUES is plotted as the course of oxygen uptake (VO2) relative to the logarithm of minute ventilation (VE) (Baba et al., 1996). VE is mostly affected by the partial pressure of carbon dioxide and further acidemia, and VO2 reflects the oxygen absorption of the body (Baba et al., 1996). Similarly to peak VO2 (VO2peak), OUES is determined by the integrated functions of several different physiological systems: musculoskeletal, cardiac, and respiratory (Baba et al., 1996). A key advantage of OUES is the stable, linear course throughout the whole exercise duration (Sun et al., 2012). This is possible by the logarithmic transformation of the curvilinear relation of VE to VO2 (Akkerman et al., 2010). OUES represents an almost excellent linear course during the whole physical effort, and OUES determines how effectively oxygen is transported (Baba et al., 1996). Previous research has suggested that, in the general population, OUES may correlate well with VO2peak and allows for its accurate prediction only with the submaximal CPET (Ashikaga et al., 2021).
OUES enables a comprehensive assessment of the cardiac response to physical exercise (Baba, 2000; Akkerman et al., 2010). Individuals with higher fitness levels had a steeper OUES (Sun et al., 2012). VO2 and OUES measure a close physiological mechanism (Hollenberg and Tager, 2000). OUES and VO2peak correlate well with each other (Baba et al., 1999a). VO2 and OUES increase simultaneously with growing exercise intensity (Baba et al., 1996). Moreover, the linear relationship between OUES and VO2 should be maintained independently from the performance achieved during the exercise test (Baba et al., 1996; Baba et al., 1999a). A reduced slope is found in individuals with limited functional capacity or suggested pathology (Baba, 2000; Sun et al., 2012). OUES has been most often determined with 75% (OUES75), 90% (OUES90), and 100% (OUES100) of data from the CPET protocol (Baba et al., 1996; Hollenberg and Tager, 2000). Among normal, healthy populations, all measuring intervals provide comparable values (Hollenberg and Tager, 2000), and OUES also maintains this relationship under clinical conditions (Baba et al., 1999b).
Moderate endurance training has several health benefits (Kim and Baggish, 2017). However, elite athletes are subjected to strenuous physical demands (Wasfy and Baggish, 2016). This results in a higher risk of cardiovascular diseases (CVDs) (Andersen et al., 2013; Schnohr et al., 2015). Athletes usually do not fit well into the general cardiopulmonary reference values (Petek et al., 2021; Wiecha et al., 2023b). Moreover, no studies so far compared the prediction powers of different OUES intervals on VO2peak among well-trained endurance athletes (Akkerman et al., 2010). We stipulate that all those relationships could be more complex than in untrained individuals. Therefore, determining the underlying response profile of OUES for the athletic population remains crucial to avoid controversies and misdiagnosis.
In this study, we a) explained the relationship between OUES intervals for endurance athletes, b) assessed the prediction power of OUES for VO2peak in well-trained participants, c) derived and internally validated new prediction equations for OUES, and d) externally validated current prediction equations in a highly trained reference cohort.
Materials and methods
Study design
We applied the recommendations for observational studies by the EQUATOR Network–STROBE Guidelines for cross-sectional studies (Supplementary Table S1). CPET was performed by endurance athletes in the years 2022–2023. Exercise tests took place at the Institute of Sport–National Research Institute in Warsaw. The study was reviewed and approved by the Bioethics Committee of the Medical University of Warsaw (AKBE/277/2023). Written informed consent was obtained for each subject. In particular, we did not initially refer to the CPET potential study candidates who had past medical or family histories and evident medical conditions (diagnosed during pre-participation physical examination).
Only adult subjects of age ≥18 years were included. To be eligible for this study, endurance athletes had to be free from a) cardiovascular or pulmonary conditions, b) psychiatric or neurological diseases, d) orthopedic conditions restricting effort at CPET, e) divergences in complete blood count, f) and tobacco smoking. All athletes had at least a 4-year experience in regular endurance training and were members of a training club and elite or development national teams in Olympic sports. They periodically participated in both national and international competitions, including the Olympic Games. The participants of this study belonged to tiers 3–5, according to the McKay classification system (McKay et al., 2022). The full participant selection process is detailed in Figure 1.
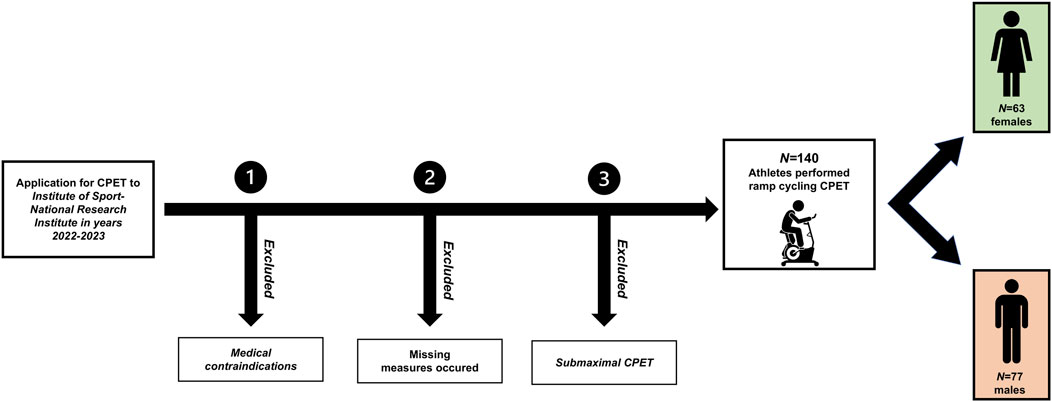
FIGURE 1. Flowchart for the study recruitment process. Abbreviation: CPET, cardiopulmonary exercise test. Note: only adult endurance athletes were enrolled in the study. A 3-step recruitment process was performed. During the first step, medical contraindications considered as mandatory exclusion criteria were: cardiovascular conditions, respiratory conditions, actual psychiatric or neurological disease, orthopedic conditions restricting effort at CPET, divergences in complete blood count, and tobacco smoking. At the second step, if any missing variables occurred, participants were excluded from the analysis to ensure the highest reliability of the analyses. Finally, in the third step, athletes with submaximal performance were not included, and the peak effort was defined as plateau in oxygen uptake, respiratory exchange ratio ≥1.05, declaration of volitional exhaustion with a rating of perceived exertion ≥18 according to the Borg scale, and maximal heart rate was ≥80% of the age-predicted value.
Cardiopulmonary exercise testing
All endurance athletes performed maximal-graded symptom-limited CPET. We considered the maximal exercise response when there was a a) ≥30-s VO2 plateau, b) respiratory exchange ratio (RER) ≥1.05, c) declaration of fatigue confirmed by a Borg’s RPE ≥18, and d) measured heart rate ≥80% of the age-predicted value. Experienced physiologists supervised the CPET, and the athletes were verbally motivated to reach maximal effort.
The athletes underwent ramp cycling CPET on a Cyclus2 Ergometer (RBM, Leipzig, Germany). At the beginning of CPET, there was a brief 2–3 min warm-up of freewheeling pedaling. The initial load began with 55–70 W and was progressively raised by 0.17–0.28 W s−1. The resistance was modified individually in provided ranges to adjust the intensity in agreement with each participant.
Body measurements
We obtained the following anthropometric measurements: age, weight, height, and body mass index (BMI). The weight was measured prior to breakfast by a TANITA weight scale (TANITA Corporation, Arlington Heights, IL, United States). The height was measured in the morning (in the same time as weight) with a stadiometer (Seca GmbH and Co., Hamburg, Germany).
Cardiopulmonary fitness outcomes
Polar H10 (Polar Electro Oy, Kempele, Finland) was used to monitor the heart rate (HR). Gas-exchange variables were taken breath-by-breath with a V2 Mask (Hans Rudolph, Inc., Shawnee, KS, United States) and a Cortex B3 Metamax system (CORTEX Biophysik GmbH, Leipzig, Germany). All the pieces of equipment used were calibrated according to the manufacturer’s guidelines before each CPET. We applied 15-s intervals to average the measurements. The measured VO2peak was compared with the VO2peak predicted by the Wasserman and Hansen equation (Wasserman et al., 1987).
OUES was defined according to the method of Baba et al. (1996): VO2 = a · log10 · VE + b., where “a” represents the OUES. OUES was calculated at 75%, 90%, and 100% of the exercise duration. The first minute of the loaded protocol was not included in the analysis, as recommended by Hollenberg and Tager (2000). The body surface area was calculated using the Du Bois and Du Bois formula: 0.007184 · height (cm)0.725 · weight (kg)0.425 (Burton, 2008). We additionally calculated the HR (both absolute and percentage of peak HR) for each intensity zone (OUES75, OUES90, and OUES100).
Prediction models for external validation
Prediction equations for external validation were chosen from the review by Akkerman et al. (2010) up to year 2010 and through additional search for studies published in years 2010–2024. The applied keywords were “oxygen uptake efficiency slope,” “OUES,” “prediction model,” “prediction equation,” “cardiopulmonary exercise testing,” “reference values,” and “linear regression” in the scientific literature. Equations derived from clinical cohorts (with comorbidities) were excluded to ensure maximal similarity. To sum up, 11 reference equations from seven studies fulfilled the inclusion criteria. Their characteristics are provided in Table 1.
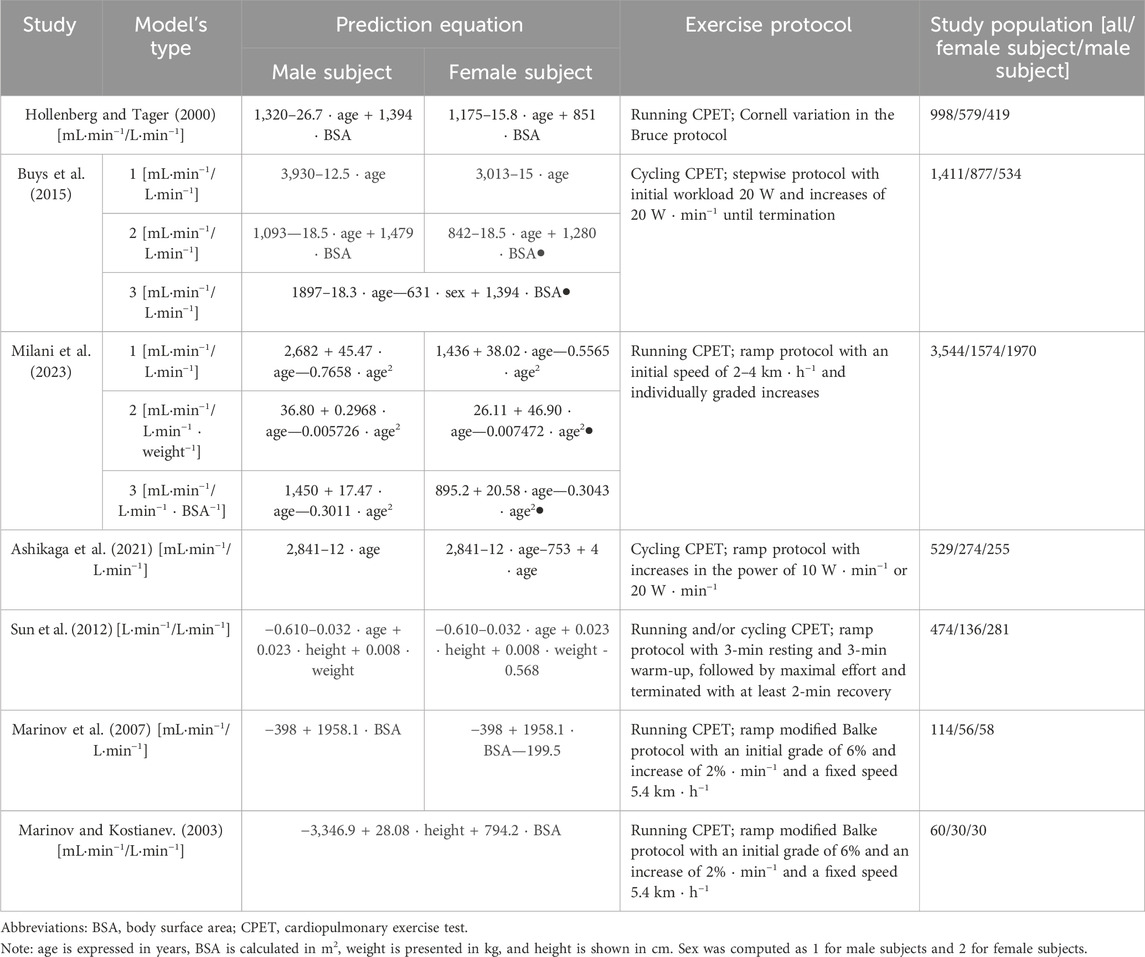
TABLE 1. Prediction models selected for validation.
Statistical analysis
First, data distribution was evaluated with the Shapiro–Wilk test and quantile–quantile plots. The continuous measures have been shown as mean (standard deviation [±]). The categorical measures have been shown as numbers (percentage [%]). An athlete was removed from the analysis when there were any missing measurements, with the aim of supporting maximal credibility of the results. The significance borderline was set at a two-sided p-value < 0.05.
For applied statistical tests, we verified the cohorts’ sizes. The whole population or particular subgroups (males and females) fulfilled the required numbers to achieve a large effect size, statistical significance (p < 0.05), and high power (>0.8).
Differences between all measurements (OUES75, OUES90, and OUES100) were compared by one-way ANOVA. Additionally, Student’s t-test for independent means was conducted to compare differences between paired measurements (OUES75 and OUES90, OUES75 and OUES100, and OUES90 and OUES100). Linear regression was used to examine the prediction power of OUES75, OUES90, and OUES100 on VO2peak. Each calculation was carried out independently for male and female individuals.
The model’s derivation was preceded by an assessment of the data assumptions (correlations, collinearity, independence of observations, analysis of residuals, and leverage or influence plots). We used multiple linear regression to derive new prediction equations. The performance of new models was presented with the root-mean-square error (RMSE) and two-way mixed-effects interclass correlation coefficient (ICC3,1) (Koo and Li, 2016). The Bland–Altman plots and 10-fold cross-validation were used to evaluate the model’s agreement (Jung and Hu, 2015). Linear models were developed to externally validate equations by regressing the predicted OUES against the observed OUES. In analysis, the coefficient of determination (R2) was considered as the adjusted R2.
The results have been shown in line with the APA style guidelines. IBM SPSS (version 29.0, IBM, Chicago, IL, United States) was used for analysis, and GraphPad Prism (version 10.1.0, GraphPad Software, San Diego, California, United States) was used to prepare figures.
Results
OUES relationships among elite athletes
A total of 140 healthy endurance athletes were qualified. A total of 45.0% (n = 63) of the study population were female individuals, and 55.0% (n = 77) of the population were male individuals. The participants represented sports from endurance-oriented Olympic disciplines. A total of 40.0% (n = 56) were specified in triathlon or cycling, 42.1% (n = 59) in speedskating, and 17.9% (n = 25) chose other disciplines. Percent-predicted VO2peak equals 144.5% ± 25.9% according to the Wasserman and Hansen equation. The demographic characteristics and exercise results are stratified by sex in Table 2.
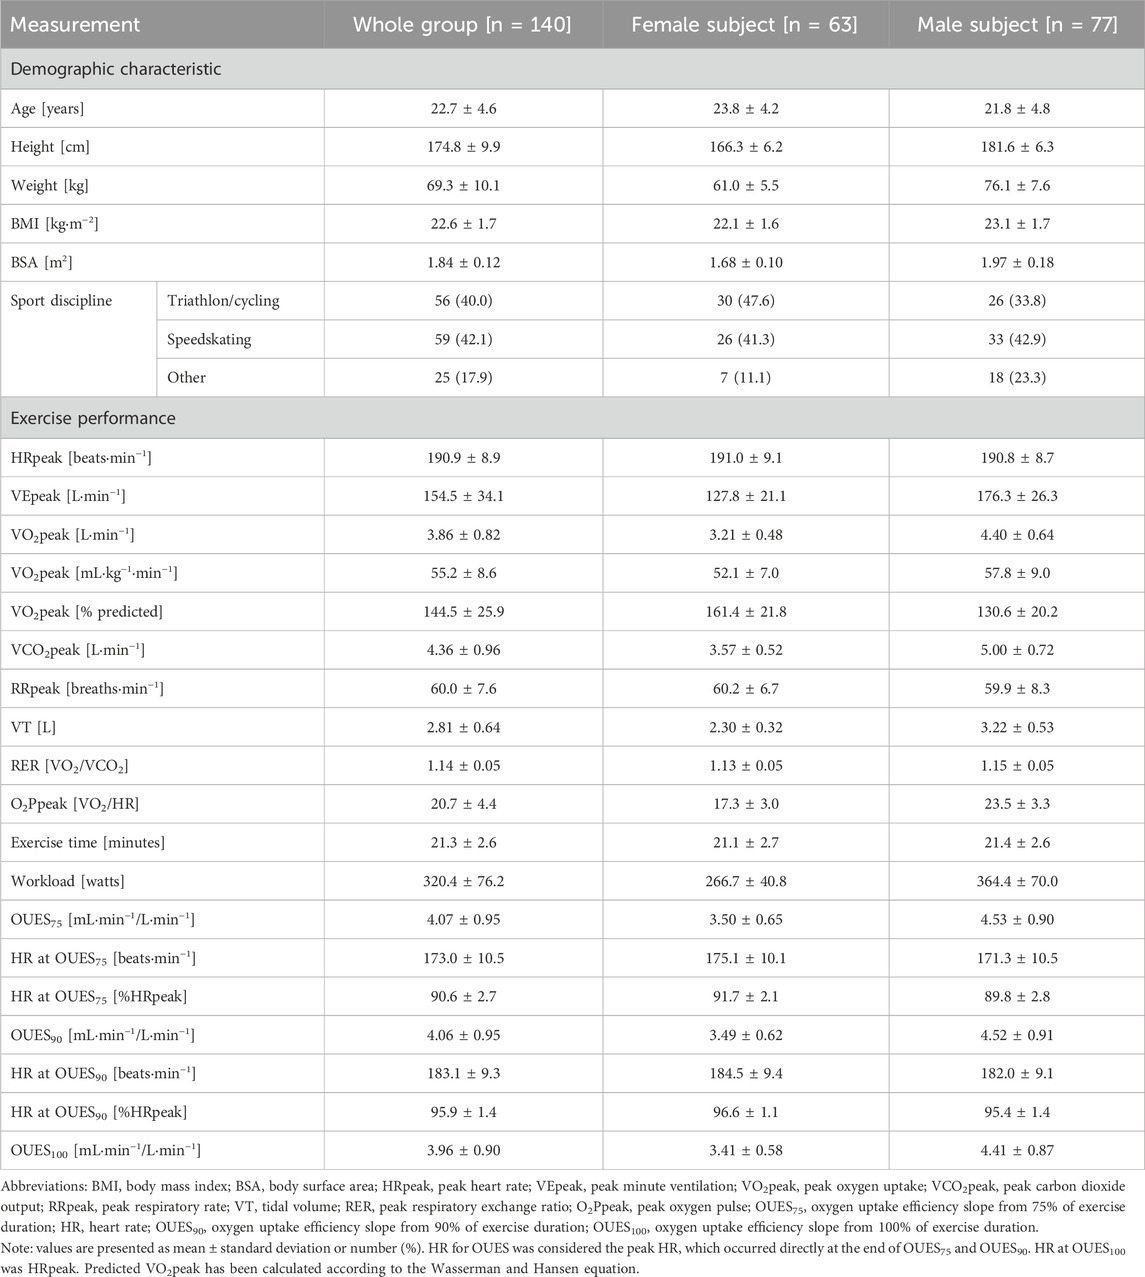
TABLE 2. Demographic and exercise characteristics.
For males, the mean OUES75 (4.53 ± 0.90 mL·min−1/L·min−1) was not significantly different than OUES90 [(4.52 ± 0.91 mL·min−1/L·min−1); t (152) = 0.08, p = 0.94] or OUES100 [(4.41 ± 0.87 mL·min−1/L·min−1); t (152) = −0.85, p = 0.398]. Similarly, OUES90 did not differ significantly from OUES100 [t (152) = −0.76, p = 0.45]. The same relationship was observed among female subjects. Average OUES75 (3.50 ± 0.65 mL·min−1/L·min−1) did not differ significantly from OUES90 [(3.49 ± 0.62 mL·min−1/L·min−1); t (124) = 0.07, p = 0.95] or OUES100 [(3.41 ± 0.58 mL·min−1/L·min−1); t (124) = 0.79, p = 0.43]. Moreover, OUES90 did not differ significantly from OUES100 [t (124) = 0.73, p = 0.46]. One-way ANOVA revealed that there was no significant difference in all OUES measurements both for male [F (2,228) = 0.43, p = 0.65] and female subjects [F (2,168) = 0.38, p = 0.69]. On average, the difference between OUES75 and OUES90 was 0.11 ± 0.11 mL·min−1/L·min−1 for male individuals and 0.12 ± 0.12 mL·min−1/L·min−1 for female individuals, that between OUES75 and OUES90 was 0.21 ± 0.19 mL·min−1/L·min−1 for male individuals and 0.18 ± 0.20 mL·min−1/L·min−1 for female individuals, and that between OUES90 and OUES100 was 0.13 ± 0.11 mL·min−1/L·min−1 for male individuals and 0.10 ± 0.12 mL·min−1/L·min−1 for female individuals. OUES dependencies among the endurance athletes are shown independently for male and female individuals in the lower rows of Table 2 and Figure 2.
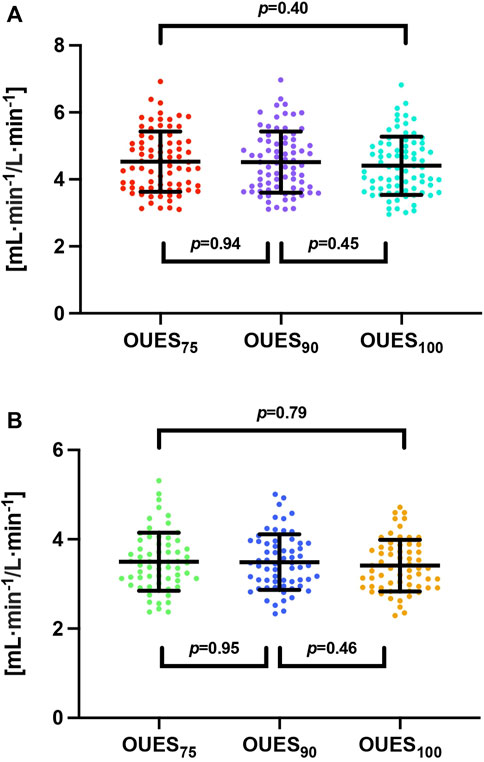
FIGURE 2. Oxygen uptake efficiency slope variability among endurance athletes. Abbreviations: OUES75, oxygen uptake efficiency slope from 75% of exercise duration; OUES90, oxygen uptake efficiency slope from 90% of exercise duration; OUES100, oxygen uptake efficiency slope from 100% of exercise duration. Note: (A) represents male subjects, while (B) represents female subjects. There were no significant differences in independent bivariable comparisons or comprehensive multivariable comparisons.
Prediction power of OUES for VO2peak
Univariable models were developed to examine OUES prediction power on VO2peak. OUES presented a high ability to predict VO2peak. OUES explained up to 63% of the variance in VO2peak in male subjects and up to 62% of the variance in VO2peak in female subjects. VO2peak increased simultaneously with OUES calculated from all time intervals. This relationship was more noticeable in male individuals (β = 0.73–0.80) than in female individuals (β = 0.71–0.79). The RMSE was consistently lower in female individuals than in male individuals. For the presented models, the predicted VO2peak is in L·min−1 and OUES should be calculated in mL·min−1/L·min−1.
The fitted univariable models for male subjects were expressed as follows:
(a) VO2peak = 2.07 + 0.51 · OUES75
The regression model covered 52% of the variance in VO2peak (R2 = 0.52, F (1, 75) = 83.6, p < 0.001), and OUES75 significantly predicted VO2peak (β = 0.73, p < 0.001). The RMSE was 0.44 L·min−1.
(b) VO2peak = 1.97 + 0.54 · OUES90
The regression model covered 59% of the variance in VO2peak (R2 = 0.59, F (1, 75) = 108.2, p < 0.001), and OUES75 significantly predicted VO2peak (β = 0.77, p < 0.001). The RMSE was 0.44 L·min−1.
(c) VO2peak = 1.81 + 0.59 · OUES100
The regression model covered 63% of the variance in VO2peak (R2 = 0.63, F (1, 75) = 131.5, p < 0.001), and OUES75 significantly predicted VO2peak (β = 0.80, p < 0.001). The RMSE was 0.39 L·min−1.
The fitted univariable models for female subjects were expressed as follows:
(a) VO2peak = 1.36 + 0.53 · OUES75
The regression model covered 50% of the variance in VO2peak (R2 = 0.50, F (1, 61) = 63.0, p < 0.001), and OUES75 significantly predicted VO2peak (β = 0.71, p < 0.001). The RMSE was 0.34 L·min−1.
(b) VO2peak = 1.18 + 0.58 · OUES90
The regression model covered 56% of the variance in VO2peak (R2 = 0.56, F (1, 61) = 79.2, p < 0.001), and OUES75 significantly predicted VO2peak (β = 0.75, p < 0.001). The RMSE was 0.32 L·min−1.
(c) VO2peak = 0.96 + 0.66 · OUES100
The regression model covered 62% of the variance in VO2peak (R2 = 0.62, F (1, 61) = 100.1, p < 0.001), and OUES75 significantly predicted VO2peak (β = 0.79, p < 0.001). The RMSE was 0.30 L·min−1.
Plots visualizing the prediction powers are shown in Figure 3.
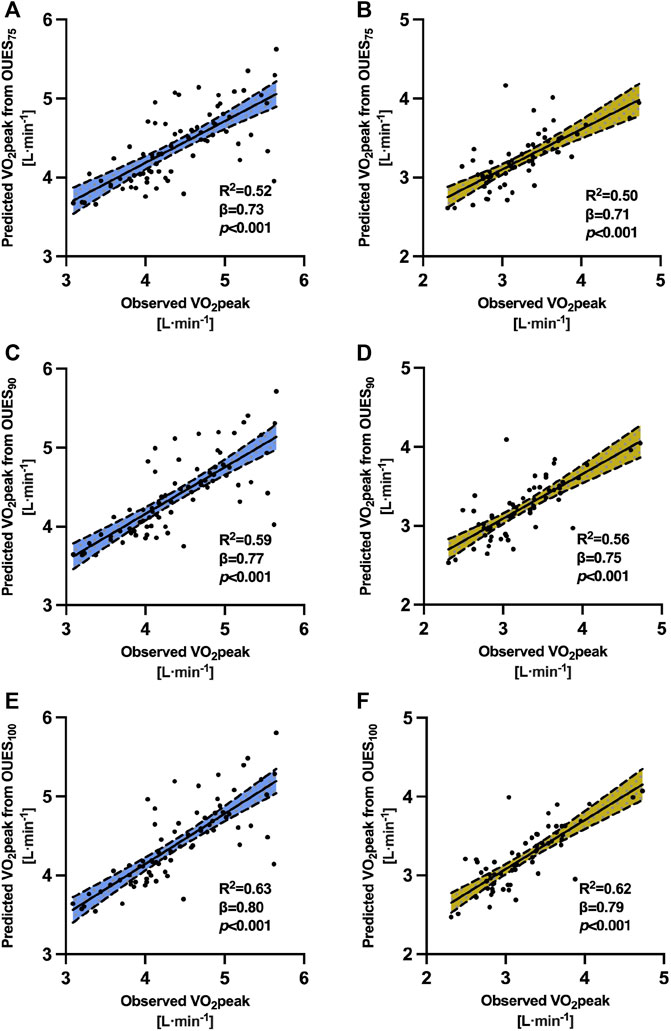
FIGURE 3. Prediction power of oxygen uptake efficiency slope on peak oxygen uptake. Abbreviations: VO2peak, peak oxygen uptake; R2, adjusted coefficient of determination; OUES75, oxygen uptake efficiency slope from 75% of exercise duration; OUES90, oxygen uptake efficiency slope from 90% of exercise duration; OUES100, oxygen uptake efficiency slope from 100% of exercise duration. Note. (A) Prediction power of the oxygen uptake efficiency slope from 75% of exercise duration on VO2peak for male subjects. (B) Prediction power of the oxygen uptake efficiency slope from 75% of exercise duration on VO2peak for female subjects. (C) Prediction power of the oxygen uptake efficiency slope from 90% of exercise duration on VO2peak for male subjects. (D) Prediction power of the oxygen uptake efficiency slope from 90% of exercise duration on VO2peak for female subjects. (E) Prediction power of the oxygen uptake efficiency slope from 100% of exercise duration on VO2peak for male subjects. (F) Prediction power of the oxygen uptake efficiency slope from 100% of exercise duration on VO2peak for male subjects. In each model, the regression was significant with p < 0.001. The x-axis presents directly measured VO2peak in cardiopulmonary exercise tests. The y-axis presents predicted VO2peak by oxygen uptake efficiency slopes from 75%, 90%, and 100% portions of exercise data. The continuous central line represents a trend line. The upper and lower dashed lines represent upper and lower 95% limits of normal.
Developed prediction equations for OUES
We predicted OUES using several variables: age, sex, and BSA. Models for OUES75, OUES90, and OUES100 showed similar and promising accuracy. In the developed equations, BSA should be in m2, age in years, and the sex coefficients are 2 if female and 1 if male. The RMSE was similar in all three equations (0.72–0.77 mL·min−1/L·min−1) developed to predict OUES obtained from different portions of the exercise data.
The new prediction equations for OUES are as follows:
(a) OUES75 = 1.09 + 2.87 · BSA—0.0030 · (age · sex)
The prediction equation explained 34% of variance in OUES75 (R = 0.59, R2 = 0.34, F (2, 137) = 36.1, p < 0.001). The overall RMSE was 0.77 mL·min−1/L·min−1.
(b) OUES90 = 1.46–3.02 · BSA—0.0010 · (age · sex)
The prediction equation explained 35% of variance in OUES75 (R = 0.60; R2 = 0.35, F (2, 137) = 37.5, p < 0.001). The overall RMSE was 0.77 mL·min−1/L·min−1.
(c) OUES100 = 1.54–2.99 · BSA—0.0014 · (age · sex)
The prediction equation explained 36% of variance in OUES75 (R = 0.61; R2 = 0.36, F (2, 137) = 40.3, p < 0.001). The overall RMSE was 0.72 mL·min−1/L·min−1.
Model validation
In all external models, a high variability was observed between the observed and predicted data sets (only 4 out of 11 models have ICC>0.5). The best alignment was noted in Milani et al. (2023) (equation adjusted to age) (ICC = 0.510 [0.491, 0.529] for OUES75, ICC = 0.512 [0.492, 0.531] for OUES90, and ICC = 0.529 [0.511, 0.548] for OUES100). The equations underestimated all OUES75, OUES90, and OUES100. Underestimation ranged up to 186.8% for the formula proposed by Marinov et al. (2007). However, the overall prediction trend in endurance athletes was maintained. The predicted values followed those directly observed, but the degree of explained variance was wide (R2 = 0.004–0.388). For detailed external validation, see Table 3. The agreement was lower in equations for OUES90 (R2 = 0.290) and OUES75 (R2 = 0.346). Bland–Altman plots showing the validity of our models are shown in Figure 4. All the equations slightly underestimated OUES. The best-performing model was the one for OUES90, with the bias of only −0.001 mL·min−1/L·min−1. The next was the model for OUES100 (bias = −0.04 mL·min−1/L·min−1). The least-performing model was for OUES75, with an error of −0.13 mL·min−1/L·min−1. The limits of agreement were narrow and similar in all models. For OUES75, it ranged between −1.51 and 1.50 mL·min−1/L·min−1. The limit of agreement in the equation for OUES90 was from −1.49 to 1.49 mL·min−1/L·min−1. Finally, in the model for OUES100, it ranged between −1.36 and 1.44 mL·min−1/L·min−1. As presented in Figure 4, some athletes exceeded the upper limits of agreement, but no one exceeded the lower limits.
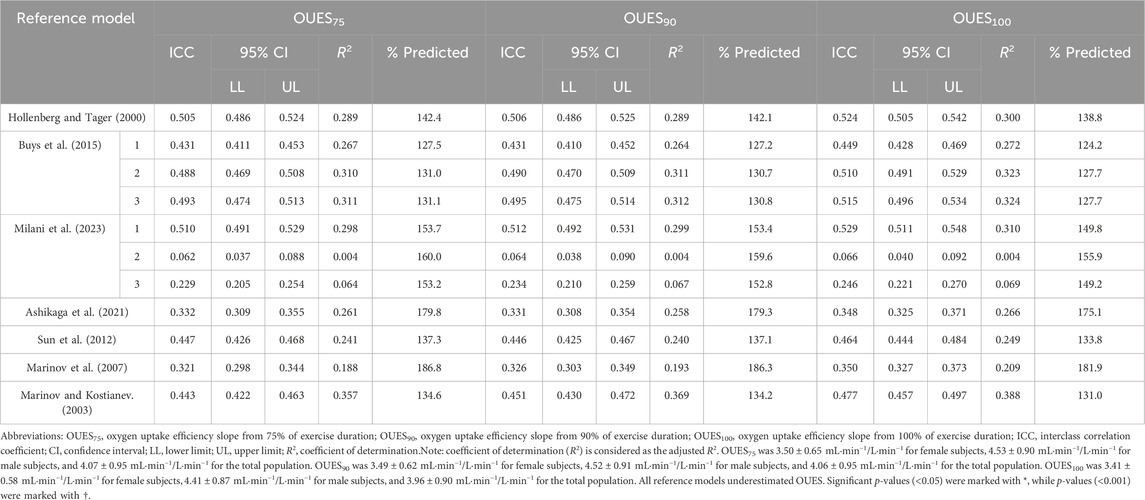
TABLE 3. Reliability of OUES prediction models.
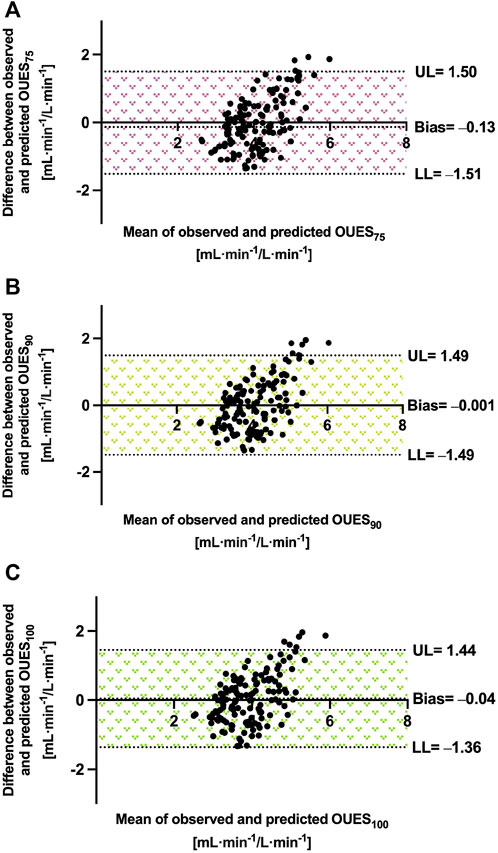
FIGURE 4. Precision of OUES equations in endurance athletes. Abbreviations: OUES75, oxygen uptake efficiency slope from 75% of exercise duration; OUES90, oxygen uptake efficiency slope from 90% of exercise duration; OUES100, oxygen uptake efficiency slope from 100% of exercise duration; UL, upper 95% limit of agreement; LL, lower 95% limit of agreement. Note: the means and differences are calculated in mL·min−1/L·min−1. (A) Prediction performance for OUES75. (B) Prediction performance for OUES90. (C) Prediction performance for OUES100. The area between LL and UL represents the limit of agreement and is indicated as the measure of the model’s fit.
Discussion
We have shown that OUES is a valuable submaximal parameter in elite athletes as well. The key findings of this study are as follows:
• First, the new prediction equations provide promising but moderate precision for endurance athletes and explain between 34% and 36% of the variance in OUES.
• Second, the overall association between OUES75, OUES90, and OUES100 was similar to those observed in untrained and elderly subjects.
• Third, we observed a strong relationship between OUES and VO2peak, even in well-trained endurance athletes, and its predictive impact was comparable for all time intervals.
• Finally, the findings from this study confirm our hypothesis that prediction equations derived from the general population perform poorly in a cohort of endurance athletes.
We noticed that even when OUES is elevated in high-performance endurance athletes, the overall trend and lack of significant differences were still maintained. Previous studies have not assessed such relationships in trained participants or merged trained and untrained subjects (Akkerman et al., 2010; Sun et al., 2012). We confirmed that even if an athlete can continue strenuous exercises for a prolonged time, the OUES remains stable across its duration. On the other hand, when one of the time intervals (OUES75, OUES90, or OUES100) is underestimated or overestimated and presents a high difference from others, it should raise awareness (Hollenberg and Tager, 2000). Thus, monitoring OUES can valuably contribute to the assessment of the response profile to exercise (Hammond and Froelicher, 1985; Akkerman et al., 2010). Medical professionals can add OUES to their testing portfolio when challenging CPET results in this unique patient population.
Furthermore, our results show that OUES is a comparable predictor of VO2peak independently from the measuring interval. In univariable models, we noticed that the relationship remained very strong, regardless of sex, age, and other covariates. For all prediction models, the overall regression was statistically significant (R2 = 0.50–0.63, all p < 0.001), and OUES showed high prediction abilities (β = 0.71–0.80, all p < 0.001). Both submaximal OUES75 and OUES90 explained up to 60% of the variance in VO2peak. Previously, Brown et al. reported a weaker correlation between OUES and VO2peak, with R2 = 0.09–0.15 (Brown et al., 2013). Perhaps, their research was conducted on youngsters (mean age was 14.7 years) and with fewer athletes (n = 25) than in ours (mean age 22.3 years, n = 140). The present study strongly advocates the conclusions made by Sun et al. that OUES and VO2peak measure analogous mechanisms in athletes (Sun et al., 2012). Each may be complementary and supplementary to the other.
External validation of the prediction models for OUES confirmed the results of our previous studies that equations derived from the general population showed limited agreement when applied to endurance athletes (Wiecha et al., 2023a; Kasiak et al., 2023). Although the general trend was maintained, the variability between the observed and predicted values was high. Only 4 of the 11 models achieved at least ICC ≥0.5, which is considered the lowest borderline of moderate compliance (for precise data, see Table 3) (Koo and Li, 2016). Adjusting models to BSA or weight provides some additional benefits. The simple equations by Marinov and Kostianev (2003) using only BSA covered the highest amount of variance (R2 = 0.388). The model by Marinov and Kostianev (2003) is a model derived from a pediatric sample. The athletic cohort of this study consisted of younger individuals with a mean age of roughly 22.3 years. We stipulate that this is the underlying reason for why the use of the age covariate provided only a slight predictive value in our participants. However, future studies should confirm our findings and externally examine our equations as this is the first study prediction of OUES among endurance athletes.
We adjusted OUES to BSA, as recommended by Baba et al. (1996) and Hollenberg and Tager (2000). Our model performed more accurately or with similar precision than that proposed by previous authors. The R2 was approximately 34%–36%. Comparably, Milani et al. (2023) observed R2 between 7.7% and 10.4%. A study by Milani et al. (2023) was conducted among healthy individuals, although with wider age ranges and with other ethnicity than in our participants. A model partially derived from trained subjects by Sun et al. (2012) provided R = 0.701, which was slightly higher than the R-value achieved in this study (between 0.59 and 0.61). To enrich the quality of the analysis, we additionally validated each of our models. It is worth underlining that our models performed comparably during the development and validation. The mean bias was −0.13 mL·min−1/L·min−1 for the predicted OUES75, –0.001 mL·min−1/L·min−1 for OUES90, and –0.04 mL·min−1/L·min−1 for OUES100. This shows that the model fits well, as presented in Figure 2.
Perspectives and significance
So far, the diagnostic value of submaximal cardiorespiratory fitness has been mostly discussed in clinical populations when the maximal strenuous effort is not recommended, e.g., in heart failure (Metra et al., 1998). However, among healthy, highly trained individuals, the holistic approach should include an evaluation of the whole exercise duration (Shushan et al., 2022). Submaximal performance could also deteriorate in elite endurance athletes, e.g., after a viral infection (Sliz et al., 2022). Sheridan et al. noticed limited prediction power of OUES for VO2peak when measured from the start to the ventilatory threshold in endurance athletes (Sheridan et al., 2021). OUES measured from the percentage of exercise duration is a more objective and replicable index because it includes the precisely truncated parts of exercise data (in our study, 75%, 90%, and 100%, respectively) (Baba, 2000). Even in elite athletes, OUES links well with the most reliable index of cardiorespiratory fitness, i.e., VO2peak. Therefore, considering OUES as a prognostic indicator is justified when we suspect CVD in the athletic population. Furthermore, comparing OUES of a single participant between 75%, 90%, and 100% intervals would be beneficial to determine how an athlete’s heart responds to increasing intensity. Furthermore, the developed new prediction equations could be applied when direct CPET is not possible.
Limitations and interpretation
Our study also has some points that have to be mentioned to ensure correct interpretation. The population was homogenous in age and ethnicity. The other studies for OUES prediction models included a higher number of participants than our study. In this research, the average age of the participants was roughly 22 years. The subjects were younger and had above-average endurance capacity when compared to other studies in this field. Our athletes were healthy. Thus, the results have limited application in patients with pathologies. We conducted CPET on cycle ergometry. Testing modality could influence the achieved performance, and exercise tests performed on other machines (treadmill and rowing ergometry) could provide slightly different results (Price et al., 2022). The participants usually achieve a lower performance on the cycle ergometer than on the treadmill, and our models are mostly tailored for cycling exercise tests. We expect that applying the presented models to other testing protocols could cause some inaccuracies. Therefore, we recommend considering all the above-mentioned aspects when deriving future reference equations. This is the first study of OUES predictions in highly fit participants, so we recommend careful extrapolation when considering the results. The external validation of our equations is welcome. Moreover, the development of formulas from other testing machines is also needed.
Conclusion
OUES remains stable between 75%, 90%, and 100% of exercise duration even in highly trained individuals. OUES was comparable between the measurements for endurance athletes. The prediction models derived from the general population demonstrated poor alignment. We do not recommend them for endurance athletes. New equations explained up to 36% of the variance and were inaccurate for only up to −0.13 mL·min−1/L·min−1. The proposed equations are internally validated and designed for endurance athletes. Medical professionals and physicians should be acknowledged to precisely adjust the training and properly interpret the specific cardiovascular response profile in athletes.
Data availability statement
The raw data supporting the conclusion of this article will be made available by the authors, without undue reservation.
Ethics statement
The studies involving humans were approved by the Bioethics Committee of the Medical University of Warsaw (Pawińskiego 3C Street, 02-106 Warsaw). The studies were conducted in accordance with the local legislation and institutional requirements. The participants provided their written informed consent to participate in this study.
Author contributions
PK: conceptualization, data curation, formal analysis, investigation, methodology, project administration, resources, validation, visualization, writing–original draft, and writing–review and editing. TK: conceptualization, investigation, methodology, project administration, resources, validation, writing–original draft and writing–review and editing. KR: investigation, resources, and writing–review and editing. AK: conceptualization, investigation, resources, supervision, and writing–review and editing. MS: data curation, investigation, resources, and writing–review and editing. MŁ: investigation, resources, and writing–review and editing. SW: methodology and writing–review and editing. MB: funding acquisition and writing–review and editing. AP: funding acquisition and writing–review and editing. PW: funding acquisition and writing–review and editing. AM: project administration, supervision, and writing–review and editing. DŚ: conceptualization, funding acquisition, project administration, supervision, and writing–review and editing.
Funding
The author(s) declare that no financial support was received for the research, authorship, and/or publication of this article.
Conflict of interest
The authors declare that the research was conducted in the absence of any commercial or financial relationships that could be construed as a potential conflict of interest.
Publisher’s note
All claims expressed in this article are solely those of the authors and do not necessarily represent those of their affiliated organizations, or those of the publisher, the editors, and the reviewers. Any product that may be evaluated in this article, or claim that may be made by its manufacturer, is not guaranteed or endorsed by the publisher.
Supplementary material
The Supplementary Material for this article can be found online at: https://www.frontiersin.org/articles/10.3389/fphys.2024.1348307/full#supplementary-material
References
Akkerman M., Van Brussel M., Hulzebos E., Vanhees L., Helders P. J., Takken T. (2010). The oxygen uptake efficiency slope: what do we know? J. Cardiopulm. Rehabil. Prev. 30, 357–373. doi:10.1097/HCR.0b013e3181ebf316
Andersen K., Farahmand B., Ahlbom A., Held C., Ljunghall S., Michaelsson K., et al. (2013). Risk of arrhythmias in 52 755 long-distance cross-country skiers: a cohort study. Eur. Heart J. 34, 3624–3631. doi:10.1093/eurheartj/eht188
Ashikaga K., Itoh H., Maeda T., Itoh H., Ichikawa Y., Tanaka S., et al. (2021). Ventilatory efficiency during ramp exercise in relation to age and sex in a healthy Japanese population. J. Cardiol. 77, 57–64. doi:10.1016/j.jjcc.2020.07.008
Baba R. (2000). The oxygen uptake efficiency slope and its value in the assessment of cardiorespiratory functional reserve. Congest. Heart Fail 6, 256–258. doi:10.1111/j.1527-5299.2000.80164.x
Baba R., Nagashima M., Goto M., Nagano Y., Yokota M., Tauchi N., et al. (1996). Oxygen uptake efficiency slope: a new index of cardiorespiratory functional reserve derived from the relation between oxygen uptake and minute ventilation during incremental exercise. J. Am. Coll. Cardiol. 28, 1567–1572. doi:10.1016/s0735-1097(96)00412-3
Baba R., Nagashima M., Nagano Y., Ikoma M., Nishibata K. (1999a). Role of the oxygen uptake efficiency slope in evaluating exercise tolerance. Arch. Dis. Child. 81, 73–75. doi:10.1136/adc.81.1.73
Baba R., Tsuyuki K., Kimura Y., Ninomiya K., Aihara M., Ebine K., et al. (1999b). Oxygen uptake efficiency slope as a useful measure of cardiorespiratory functional reserve in adult cardiac patients. Eur. J. Appl. Physiol. Occup. Physiol. 80, 397–401. doi:10.1007/s004210050610
Balady G. J., Arena R., Sietsema K., Myers J., Coke L., Fletcher G. F., et al. (2010). Clinician's Guide to cardiopulmonary exercise testing in adults: a scientific statement from the American Heart Association. Circulation 122, 191–225. doi:10.1161/CIR.0b013e3181e52e69
Brown S. J., Raman A., Schlader Z., Stannard S. R. (2013). Ventilatory efficiency in juvenile elite cyclists. J. Sci. Med. Sport 16, 266–270. doi:10.1016/j.jsams.2012.06.010
Burton R. F. (2008). Estimating body surface area from mass and height: theory and the formula of Du Bois and Du Bois. Ann. Hum. Biol. 35, 170–184. doi:10.1080/03014460801908439
Buys R., Coeckelberghs E., Vanhees L., Cornelissen V. A. (2015). The oxygen uptake efficiency slope in 1411 Caucasian healthy men and women aged 20-60 years: reference values. Eur. J. Prev. Cardiol. 22, 356–363. doi:10.1177/2047487314547658
Hammond H. K., Froelicher V. F. (1985). Normal and abnormal heart rate responses to exercise. Prog. Cardiovasc Dis. 27, 271–296. doi:10.1016/0033-0620(85)90010-6
Hollenberg M., Tager I. B. (2000). Oxygen uptake efficiency slope: an index of exercise performance and cardiopulmonary reserve requiring only submaximal exercise. J. Am. Coll. Cardiol. 36, 194–201. doi:10.1016/s0735-1097(00)00691-4
Jung Y., Hu J. H. (2015). A K-fold averaging cross-validation procedure. J. Nonparametric Statistics 27, 167–179. doi:10.1080/10485252.2015.1010532
Kasiak P. S., Wiecha S., Cieslinski I., Takken T., Lach J., Lewandowski M., et al. (2023). Validity of the maximal heart rate prediction models among runners and cyclists. J. Clin. Med. 12, 2884. doi:10.3390/jcm12082884
Kim J. H., Baggish A. L. (2017). Strenuous exercise and cardiovascular disease outcomes. Curr. Atheroscler. Rep. 19, 1. doi:10.1007/s11883-017-0636-3
Koo T. K., Li M. Y. (2016). A guideline of selecting and reporting intraclass correlation coefficients for reliability research. J. Chiropr. Med. 15, 155–163. doi:10.1016/j.jcm.2016.02.012
Marinov B. I., Kostianev S. S. (2003). Exercise performance and oxygen uptake efficiency slope in obese children performing standardized exercise. Acta physiologica Pharmacol. Bulg. 27 (2-3), 59–64.
Marinov B., Mandadzhieva S., Kostianev S. (2007). Oxygen-uptake efficiency slope in healthy 7- to 18-year-old children. Pediatr. Exerc Sci. 19, 159–170. doi:10.1123/pes.19.2.159
Mckay A. K. A., Stellingwerff T., Smith E. S., Martin D. T., Mujika I., Goosey-Tolfrey V. L., et al. (2022). Defining training and performance caliber: a participant classification framework. Int. J. Sports Physiol. Perform. 17, 317–331. doi:10.1123/ijspp.2021-0451
Metra M., Nodari S., Raccagni D., Garbellini M., Boldi E., Bontempi L., et al. (1998). Maximal and submaximal exercise testing in heart failure. J. Cardiovasc Pharmacol. 32 (Suppl. 1), S36–S45. doi:10.1097/00005344-199800003-00007
Milani J., Milani M., Cipriano G. F. B., De Castro I., Hansen D., Cipriano Junior G. (2023). Oxygen uptake efficiency slope in south American healthy adults: COMPREHENSIVE reference values and international comparisons. J. Cardiopulm. Rehabil. Prev. 43, 290–300. doi:10.1097/HCR.0000000000000778
Petek B. J., Tso J. V., Churchill T. W., Guseh J. S., Loomer G., Dicarli M., et al. (2021). Normative cardiopulmonary exercise data for endurance athletes: the cardiopulmonary health and endurance exercise registry (CHEER). Eur. J. Prev. Cardiol. 29, 536–544. doi:10.1093/eurjpc/zwab150
Price S., Wiecha S., Cieslinski I., Sliz D., Kasiak P. S., Lach J., et al. (2022). Differences between treadmill and cycle ergometer cardiopulmonary exercise testing results in triathletes and their association with body composition and body mass index. Int. J. Environ. Res. Public Health 19, 3557. doi:10.3390/ijerph19063557
Schnohr P., O'Keefe J. H., Marott J. L., Lange P., Jensen G. B. (2015). Dose of jogging and long-term mortality: the Copenhagen city heart study. J. Am. Coll. Cardiol. 65, 411–419. doi:10.1016/j.jacc.2014.11.023
Sheridan S., Mccarren A., Gray C., Murphy R. P., Harrison M., Wong S. H. S., et al. (2021). Maximal oxygen consumption and oxygen uptake efficiency in adolescent males. J. Exerc Sci. Fit. 19, 75–80. doi:10.1016/j.jesf.2020.11.001
Shushan T., Mclaren S. J., Buchheit M., Scott T. J., Barrett S., Lovell R. (2022). Submaximal fitness tests in team sports: a theoretical framework for evaluating physiological state. Sports Med. 52, 2605–2626. doi:10.1007/s40279-022-01712-0
Sliz D., Wiecha S., Ulaszewska K., Gasior J. S., Lewandowski M., Kasiak P. S., et al. (2022). COVID-19 and athletes: endurance sport and activity resilience study-CAESAR study. Front. Physiol. 13, 1078763. doi:10.3389/fphys.2022.1078763
Sun X. G., Hansen J. E., Stringer W. W. (2012). Oxygen uptake efficiency plateau: physiology and reference values. Eur. J. Appl. Physiol. 112, 919–928. doi:10.1007/s00421-011-2030-0
Wasfy M. M., Baggish A. L. (2016). Exercise dose in clinical practice. Circulation 133, 2297–2313. doi:10.1161/CIRCULATIONAHA.116.018093
Wasserman K., Hansen J. E., Sue D. Y., Whipp B. J., Froelicher V. F. (1987). Principles of exercise testing and interpretation. J. Cardiopulm. Rehabilitation Prev. 7, 189. doi:10.1097/00008483-198704000-00014
Wiecha S., Kasiak P. S., Cieslinski I., Takken T., Palka T., Knechtle B., et al. (2023a). External validation of VO2max prediction models based on recreational and elite endurance athletes. PLoS One 18, e0280897. doi:10.1371/journal.pone.0280897
Keywords: cardiopulmonary exercise test, endurance athletes, exercise physiology, oxygen uptake efficiency slope, prediction equation
Citation: Kasiak P, Kowalski T, Rębiś K, Klusiewicz A, Starczewski M, Ładyga M, Wiecha S, Barylski M, Poliwczak AR, Wierzbiński P, Mamcarz A and Śliż D (2024) Below or all the way to the peak? Oxygen uptake efficiency slope as the index of cardiorespiratory response to exercise—the NOODLE study. Front. Physiol. 15:1348307. doi: 10.3389/fphys.2024.1348307
Received: 02 December 2023; Accepted: 15 January 2024;
Published: 26 January 2024.
Edited by:
Keith George, Liverpool John Moores University, United KingdomReviewed by:
Siana Jones, University College London, United KingdomIhász Ferenc, Eötvös Loránd University, Hungary
Copyright © 2024 Kasiak, Kowalski, Rębiś, Klusiewicz, Starczewski, Ładyga, Wiecha, Barylski, Poliwczak, Wierzbiński, Mamcarz and Śliż. This is an open-access article distributed under the terms of the Creative Commons Attribution License (CC BY). The use, distribution or reproduction in other forums is permitted, provided the original author(s) and the copyright owner(s) are credited and that the original publication in this journal is cited, in accordance with accepted academic practice. No use, distribution or reproduction is permitted which does not comply with these terms.
*Correspondence: Przemysław Kasiak, przemyslaw.kasiak@wum.edu.pl