 Lin Yang1†
 Zhijun Gao1†Xinsheng Cao1†Shuying Sun2
 Chunchen Wang1
 Hang Wang1
 Jing Dai1Yang Liu1Yilong Qin1
 Meng Dai3Wei Guo2*
 Binghua Zhang2*Ke Zhao2*
 Zhanqi Zhao4,5
- 1Department of Aerospace Medicine, Air Force Medical University, Xi’an, China
- 2Department of Pulmonary and Critical Care Medicine, 986th Hospital of Air Force, Air Force Medical University, Xi’an, China
- 3Department of Biomedical Engineering, Air Force Medical University, Xi’an, China
- 4School of Biomedical Engineering, Guangzhou Medical University, Guangzhou, China
- 5Department of Critical Care Medicine, Peking Union Medical College Hospital, Chinese Academy of Medical Sciences, Beijing, China
For patients with chronic obstructive pulmonary disease (COPD), the assessment of the treatment efficacy during hospitalization is of importance to the optimization of clinical treatments. Conventional spirometry might not be sensitive enough to capture the regional lung function development. The study aimed to evaluate the feasibility of using electrical impedance tomography (EIT) as an objective bedside evaluation tool for the treatment of acute exacerbation of COPD (AECOPD). Consecutive patients who required hospitalization due to AECOPD were included prospectively. EIT measurements were conducted at the time of admission and before the discharge simultaneously when a forced vital capacity maneuver was conducted. EIT-based heterogeneity measures of regional lung function were calculated based on the impedance changes over time. Surveys for attending doctors and patients were designed to evaluate the ease of use, feasibility, and overall satisfaction level to understand the acceptability of EIT measurements. Patient-reported outcome assessments were conducted. User’s acceptance of EIT technology was investigated with a five-dimension survey. A total of 32 patients were included, and 8 patients were excluded due to the FVC maneuver not meeting the ATS criteria. Spirometry-based lung function was improved during hospitalization but not significantly different (FEV1 %pred.: 35.8% ± 6.7% vs. 45.3% ± 8.8% at admission vs. discharge; p = 0.11. FVC %pred.: 67.8% ± 0.4% vs. 82.6% ± 5.0%; p = 0.15. FEV1/FVC: 0.41 ± 0.09 vs. 0.42 ± 0.07, p = 0.71). The symptoms of COPD were significantly improved, but the correlations between the improvement of symptoms and spirometry FEV1 and FEV1/FVC were low (R = 0.1 and −0.01, respectively). The differences in blood gasses and blood tests were insignificant. All but one EIT-based regional lung function parameter were significantly improved after hospitalization. The results highly correlated with the patient-reported outcome assessment (R > 0.6, p < 0.001). The overall acceptability score of EIT measurement for both attending physicians and patients was high (4.1 ± 0.8 for physicians, 4.5 ± 0.5 for patients out of 5). These results demonstrated that it was feasible and acceptable to use EIT as an objective bedside evaluation tool for COPD treatment efficacy.
Introduction
Chronic obstructive pulmonary disease (COPD) is a severe pulmonary disease characterized by progressive airflow obstruction. It has emerged as the third leading cause of death globally (now the fourth following the COVID-19 pandemic). This respiratory disorder affects 9%–19% of adults, with many cases going undiagnosed (Varmaghani et al., 2019). A recent study revealed that approximately 99.9 million individuals in China have COPD (Wang et al., 2018). The increasing prevalence of COPD is attributed to factors such as an aging population and escalating environmental pollution, leading to a growing global disease burden. By 2030, the World Health Organization predicts that COPD will move up to become the third leading cause of death around the world, following ischemic heart disease and stroke (WHO World Health Organization, 2020). Acute exacerbations of COPD (AECOPD) are often triggered by infectious or environmental factors, necessitating hospitalization, thereby adding pressure on both patients and the social healthcare system. The treatment focus for AECOPD is symptom relief during acute exacerbations and their prevention. Common medications include bronchodilators, corticosteroids, and antibiotics. Inhalation therapy with short-acting beta-agonists and anticholinergics is typical in uncomplicated cases. Elevated blood eosinophil levels may lead to inhaled corticosteroid addition. Severe cases benefit from oral corticosteroids, improving lung function and recovery time. Antibiotic use depends on respiratory distress severity, sputum characteristics, and ventilation needs. Oxygen therapy and mechanical ventilation support are crucial adjunctive measures.
COPD is a complex and heterogeneous disease characterized by various phenotypes, including chronic bronchitis and emphysema, leading to diverse responses to treatments and disease progression (Agustí et al., 2022). According to the GOLD guidelines, lung function evaluation using a spirometry test [such as forced expiratory volume in one second (FEV1) and forced vital capacity (FVC)] is the gold standard for diagnosing COPD and monitoring disease progression (Global Initiative for Chronic Obstructive Lung Disease, 2023). Although spirometry is reproducible, it cannot differentiate between COPD phenotypes or evaluate respiratory symptoms. Questionnaire-based patient-reported outcome (PRO) assessments, like the COPD assessment test (CAT) and Quality of Life Disease Impact Scale, are often used to determine changes in the overall COPD disease status and health-related quality of life. These assessments are subjective, making it challenging to compare results across individuals. In addition, the age of patients might influence their comprehension of the questionnaires.
To assess treatment efficacy, imaging techniques could be a viable option. However, x-ray or computed tomography scans cannot be applied frequently due to radiation exposure. Electrical impedance tomography (EIT) is a novel medical imaging technique that evaluates regional lung ventilation and perfusion (Frerichs et al., 2017). By introducing imperceptible alternating currents through electrodes on the chest wall surface, EIT measures the electrical potentials and reconstructs the impedance images. This technique is based on changes in the regional air content and regional blood flow alternating the electrical impedance of lung tissue (de Castro Martins et al., 2019). So far, EIT has been used to evaluate regional ventilation in patients with various lung diseases, e.g., COPD, asthma, cystic fibrosis, and IPF (Zhao et al., 2013; Milne et al., 2017; Ngo et al., 2018; Krauss et al., 2021). Alterations in spatial and temporal ventilation distribution after bronchodilator were captured both in asthma and COPD cases (Frerichs et al., 2016; Vogt et al., 2016). Jiang et al. (2021) also used EIT to evaluate treatment efficacy on ventilation in patients with pneumonia. Up to now, no study has explored the use of EIT to assess the improvement after longer treatment for patients with COPD. The study aimed to evaluate the feasibility of using EIT as an objective bedside tool for evaluating COPD treatment effectiveness.
Methods and materials
The prospective observational study was approved by the ethics committee of the Fourth Military Medical University (KY20224101-1). Informed consent was obtained from all subjects prior to the study. Consecutive patients admitted to the Department of Pulmonary and Critical Care Medicine of 986th Hospital of the Air Force Medical University due to AECOPD from March 2023 to October 2023 were included prospectively. The exclusion criteria included the following: difficulty in completing the lung function test, chest skin injury against the placement of the EIT electrode belt, and other contraindications to using chest EIT (e.g., cardiac pacemaker).
Treatments and measurements
During hospitalization, hypoxemia improved with supplemental oxygen given via nasal catheter-inspired oxygen (FiO2 24%–35%). Short-acting inhaled beta-2 agonists were administered, with short-acting anticholinergics salbutamol (albuterol) and ipratropium bromide. In patients with severe exacerbations, systemic corticosteroids (methylprednisolone) were used to improve lung function and oxygenation and shorten recovery time. The duration of therapy was normally no more than 5 days. Antibiotics were applied when signs of bacterial infection were presented.
Blood gases; blood tests including procalcitonin (PCT), C-reactive protein (CRP), and white blood cell (WBC); interleukin (IL)-6; lactic acid (LA); and x-ray or CT were performed at the time of admission and discharge. Modified Medical Research Council (mMRC) and COPD assessment test (CAT) scores were used to evaluate patients’ symptom status. The FVC maneuver was performed according to ATS guidelines (Graham et al., 2019).
EIT measurements were conducted according to the manufacturer’s manual at the time of admission and before the discharge simultaneously when the FVC maneuver was conducted. The device and measurement setup details were previously published (Yang et al., 2023a; Yang et al., 2024). In brief, a belt with 16 equidistantly fixed electrodes was placed around the chest in one transverse plane at the level of the 5th intercostal space at the parasternal line, as shown in Figure 1. Raw EIT data were acquired with VenTom-100 (MidasMED Biomedical Technology, Suzhou, China) at a scan rate of 20 images/s using excitation currents of 1 mArms applied through opposite electrodes. Image reconstruction was accomplished by the GREIT algorithm (Adler et al., 2009). The baseline for image reconstruction was obtained individually for each subject during quiet tidal breathing.
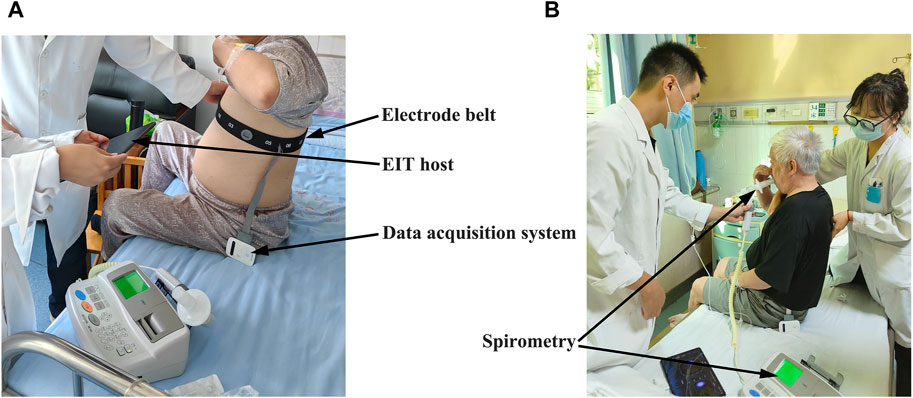
FIGURE 1. View of the EIT measurement on the patient with chronic obstructive pulmonary disease (COPD) during hospitalization: (A) attachment and adjustment of the EIT electrode belt to ensure good electrode–skin contact; (B) implement of the forced vital capacity (FVC) maneuver. The locations of the EIT acquisition system, electrode belt, and spirometer are highlighted with arrows.
EIT data analysis
Lung regions were identified as the pixels with a relative impedance change ΔZ higher than 20% of the maximum ΔZ (Zhao et al., 2018). The differences between the maximum relative impedance change ΔZ values achieved after the forced full inspiration to total lung capacity and the lowest relative ΔZ values during the succeeding maximum expiration to residual lung volume were calculated in the pixels of the lung regions. These values reflected the pixel values of forced expiratory vital capacity (FVCEIT). ΔZ in arbitrary unit (AU) was normalized to milliliter by comparing the sum of all pixel FVCEIT values and the FVC measured with spirometry (Eq. 1).
Another parameter determined from the forced full inspiration was the forced expiratory volume in 1 s (FEV1EIT), which was calculated as the difference between the rel. ΔZ values after 1 s of forced full expiration and the value at residual lung volume at the beginning of the expiration limb of the maneuver in the lung pixels. Furthermore, the global time points of 25% and 75% of FVC were identified (MEF25 and MEF75). The mean flow was calculated in the pixel level and denoted as MEF25-75EIT. Together with pixel-wise FEV1EIT/FVCEIT, a total of four functional EIT images were calculated (fEIT FVC, fEIT FEV1, fEIT MEF25-75, and fEIT FEV1/FVC). To characterize the dispersion of the fEIT images, i.e., the heterogeneity of their spatial distribution, the global inhomogeneity (GI) index (Zhao et al., 2009) was calculated for each type of fEIT. For fEIT FEV1/FVC, the number of pixels with values < 0.7 was calculated in percentage to the total number of pixels in the lung regions. This parameter was denoted as Abnormal%.
The time constant map was calculated as described in a previous study (Karagiannidis et al., 2018; Strodthoff et al., 2022). In brief, for every pixel within the lung regions, the regional time constant was calculated by fitting the following exponential equation: (Eq. 2).
where Z(t) is the relative impedance in a pixel that is within the lung at time point t, Z0 is the impedance at the start of expiration, t represents the time from the end-inspiration to the end-expiration, τ denotes the regional time constant, and c denotes the end-expiratory volume. Instead of calculating it for every tidal breath, as proposed earlier, the time constant map was calculated from the FVC data in the present study. The regional median τ (τmed) and interquartile range (τiqr) were calculated.
To understand the acceptability of EIT measurements, two surveys for attending doctors and patients were designed including the ease of use, feasibility, and overall satisfaction level. It was scored from 1 to 5, with 1 being unsatisfied and 5 being totally satisfied.
Statistical analysis
The data processing and statistical analysis were conducted with MATLAB R2023a (The MathWorks Inc., Natick, United States). As there was no relevant prior information available, the sample size was determined not by calculating based on specific endpoints but rather by convenience sampling. The Lilliefors test was used for normality testing. For normally distributed data, results were expressed as mean ± standard deviation. A two-tailed paired t-test was used to compare the changes of the EIT parameters, FVC parameters, questionnaires, and other clinical parameters. Pearson’s linear correlation was used to compare the CAT score with FEV1 and FEV1/FVC (both global and regional). A p-value < 0.05 was considered statistically significant. Significance levels were corrected for multiple comparisons using Holm’s sequential Bonferroni method.
Results
A total of 32 patients were included in the study. Eight patients were excluded due to the FVC maneuver not meeting the ATS criteria. Finally, data from 24 patients were analyzed (age, 59.5 ± 7.8 years old; height, 168.5 ± 6.4 cm; weight, 67.5 ± 10.6 kg). The FVC parameters and the questionnaires at the time of admission and discharge are presented in Table 1. Lung function was improved during hospitalization but was not significantly different. The symptoms of COPD were significantly improved. The differences in blood gases and other clinical parameters (PCT, CRP, WBC, IL-6, and LA) were not statistically significant.
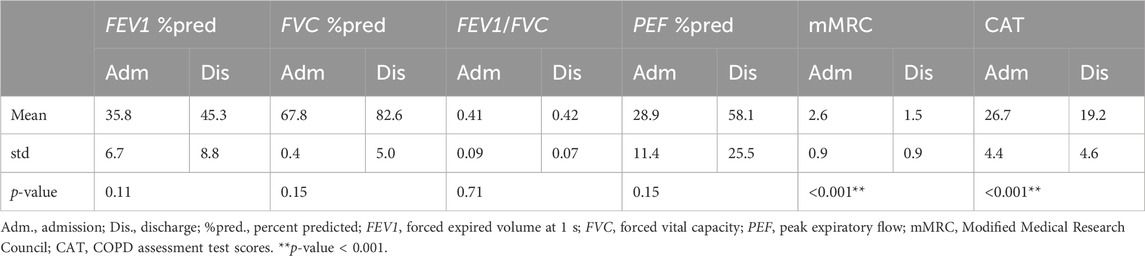
TABLE 1. FVC parameters and questionnaires at admission and discharge of the study subjects.
Example functional EIT images obtained from one of the studied patients are shown in Figure 2. These images present the spatial distribution of FEV1, FVC, FEV1/FVC, MEF25-75, and time constants. Each pixel in the images represents the corresponding functional parameters. It is observed that FEV1EIT, FVCEIT, and FEV1/FVCEIT were improved at discharge (the pixel values were higher compared to that at admission). The time constants were distributed toward lower values (histogram). The values of EIT-based parameters are presented in Table 2. The improvement of the EIT-based parameters is presented in Figure 3 as the percentage to the values at the admission. All the parameters were significantly improved except τiqr, which was improved but statistically insignificant. The correlations between the improvement of CAT and spirometry FEV1 and FEV1/FVC were low (R = 0.1 and −0.01, respectively). The correlations between ΔCAT and EIT-based heterogeneity (GIFEV1 and GIFEV1/FVC) were significant (R = 0.62 and 0.68, p = 0.002 and <0.001, respectively). The scatter plot in Figure 4 suggests that a high correlation between ΔCAT and ΔGIFEV1 was due to two outliers. However, ΔCAT and ΔGIFEV1/FVC were highly correlated.
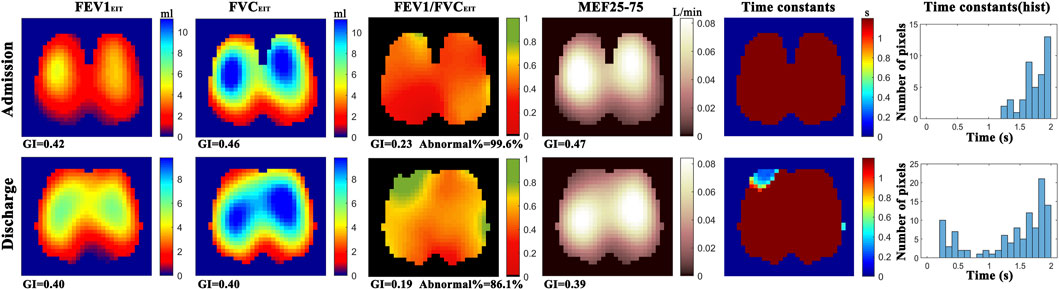
FIGURE 2. Functional EIT images showing the distribution of regional forced expiratory volume in 1s (FEV1), forced vital capacity (FVC), FEV1/FVC, mean expiratory flow between 25% and 75% of FVC (MEF25-75), and expiratory time constants. GI, global inhomogeneity. Abnormal%, percentage of the number of pixels with values < 0.7 over the total number of pixels in the lung regions. For the above-mentioned functional EIT images, each pixel corresponds to the functional parameter. Color bar on the right side of the subfigures indicates the level of the values of the corresponding parameters in each pixel. For example, in the functional image FEV1/FVCEIT, most of regions are red at admission (∼0.4), vs. green and yellow in some regions at discharge (∼0.7). Histogram of time constants (right column) showed the distribution of time constants of forced expiration. The average time is shorter, and the distribution is wider at discharge compared to that at admission.
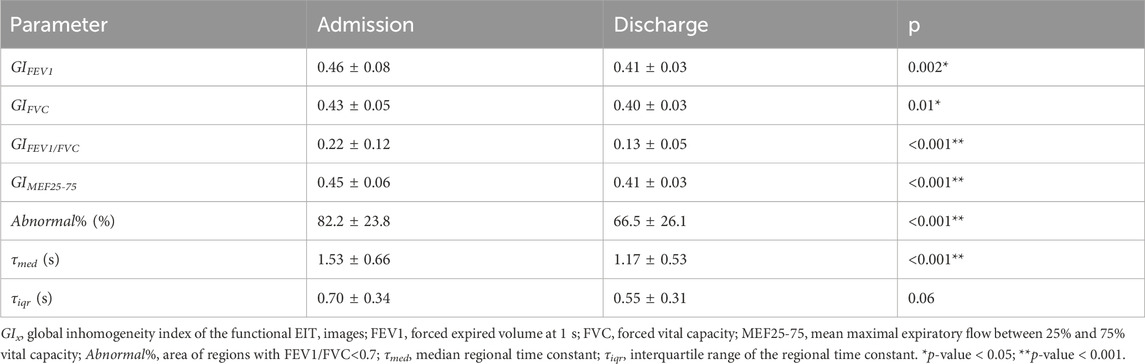
TABLE 2. EIT-based parameters at admission and discharge.
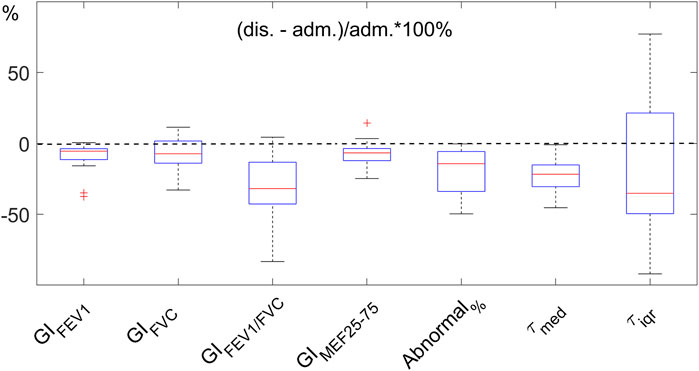
FIGURE 3. Improvement of EIT-based parameters after hospitalization. The parameters indicate the heterogeneity of the functional images (GIx, where x represents the parameters FEV1, FVC, FEV1/FVC, and MEF25-75), the regions with FEV1/FVC<0.7 (Abnormal%), and regional expiratory time constants (τmed and τiqr). The improvement is normalized to the values at admission (adm.). Dashed line indicates no change. The lower the values at discharge (dis.), the better. FEV1, forced expiratory volume in 1s. FVC, forced vital capacity. MEF25-75, mean expiratory flow between 25% and 75% of FVC. GI, global inhomogeneity. Abnormal%, percentage of the number of pixels with values < 0.7 over the total number of pixels in the lung regions.
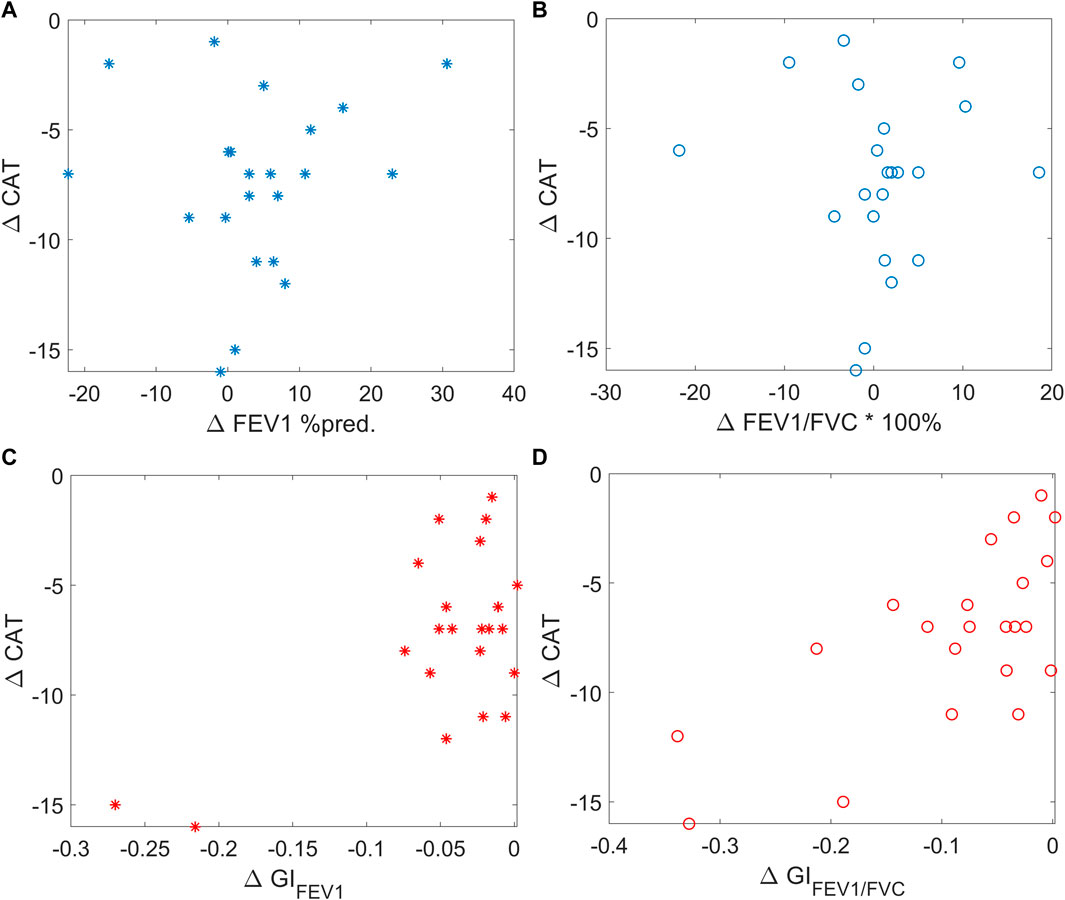
FIGURE 4. Scatter plots showing the correlation between ΔCAT and spirometry FEV1 (left top, blue stars), spirometry FEV1/FVC (right top, blue circles), EIT-based GIFEV1 (left bottom, red stars), and EIT-based GIFEV1/FVC (right bottom, red circles). CAT, COPD assessment test; FEV1, forced expiratory volume in 1 s. FVC, forced vital capacity. MEF25-75, mean expiratory flow between 25% and 75% of FVC. GI, global inhomogeneity. Abnormal%, percentage of the number of pixels with values < 0.7 over the total number of pixels in the lung regions.
The survey for EIT use satisfaction is summarized in Table 3. Six attending physicians and all 24 patients completed the survey. The overall acceptability of EIT measurement for patients was very high. The physicians were not familiar with the EIT procedure and considered the belt application a bit complicated. However, the measurement duration and the information provided by EIT were satisfactory.
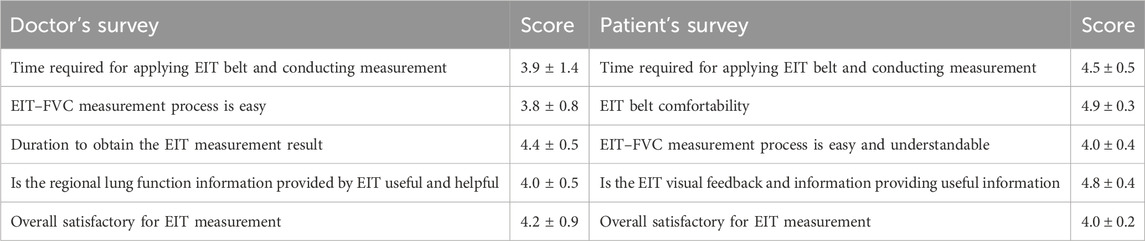
TABLE 3. Surveys for the users’ satisfactory evaluation (translated) and the scores (ranging from 1 to 5, with 5 being most satisfied).
Discussion
In the present study, we found that EIT captured the regional lung function improvement after COPD treatment. The results were highly correlated with patient-reported outcome assessments. Compared to the conventional spirometry FVC maneuver, EIT-based parameters were more sensitive. The overall acceptability of EIT measurement for both attending physicians and patients was high.
The COPD severity degree is defined by spirometry FVC parameters. Short hospitalization treatment of AECOPD improved the symptoms but did not significantly improve the spirometry parameters. For the diagnosis of AECOPD and criteria of admission, respiratory distress and significant symptoms not relieved by initial treatment are listed (NCBI, 2023). Ding et al. (2018) suggested that symptoms may be more related to physical activity impairment compared to lung function. We suspected that lung function reservoir is usually large, and global lung function parameters are usually impaired/improved with delay. In addition, unlike most diagnostic testing (e.g., blood tests and radiology), the FVC maneuver requires the patient to perform strenuous and precise physical procedures to capture accurate data. Although we have excluded eight patients with unacceptable spirometry data from the study, it was not possible to ensure that the patients had performed the maximum inhalation to total lung capacity or maximum expiratory efforts. The updates of ATS guidelines of 2019 implemented the “fourth phase” forced inspiration after the FVC as an extra measure to confirm the subject’s inspiratory effort (Graham et al., 2019). However, we cannot exclude the possibility that the insignificant differences in spirometry data between admission and discharge might be caused by the variation in the subjects’ inspiratory/expiratory efforts. On the other hand, regional lung function calculated with EIT data might be less dependent on the subjects’ effort. Frerichs et al. (2021) demonstrated that EIT-based ventilation inhomogeneity occurs not only during the FVC maneuver but also during normal tidal breathing. Therefore, pulmonary dysfunction or improvement might be identified without extreme cooperation of the COPD patients. In our present study, the FVC maneuver was scheduled for both admission and discharge. Therefore, simultaneous EIT measurement added no further burden to the patients. The accuracy and reliability of EIT have been compared previously with various standard modalities [e.g., (Frerichs et al., 2002; Hinz et al., 2003; Marquis et al., 2006)]. The EIT-derived flow should also be reliable as the volume changes are validated.
Both mMRC and CAT are recommended by the Global Initiative for Chronic Obstructive Lung Disease (GOLD) guidelines. Due to the items (symptoms) evaluated in two questionnaires, a discrepancy is expected between the two scoring systems (Rhee et al., 2015). Since the CAT scoring system better reflects the symptom severity (Cheng et al., 2019) and is less discrete compared to mMRC, we calculated the correlations between ΔCAT and spirometry and EIT-based parameters. The severity of COPD is defined with the FEV1 level and FEV1/FVC; hence, among the lung function parameters, we chose these two parameters. Patient-reported outcome assessments are widely accepted for clinical trials and drug development as important endpoints (Afroz et al., 2020). Nevertheless, such assessments are subjective. An objective measure is warranted to assess the treatment outcome. As demonstrated in the current study, blood tests and spirometry were not able to reflect the improvement for every individual. Previously, we demonstrated that EIT captured regional lung function information that was correlated with CT findings (Zhao et al., 2013). Theoretically, with a high temporal resolution and certain spatial resolution, EIT has much higher sensitivity than spirometry in terms of lung function and flow limitation. Shortening the treatment effect improving flow limitation was visualized with the EIT-based regional end-expiratory flow map (Zhao et al., 2020). In the present study, we demonstrated that the regional lung functions evaluated with EIT improved significantly (Table 2; Figure 1). Furthermore, EIT-based regional lung function was more sensitive and more related to symptom improvement (Figure 2). In addition to the conventional spirometry parameters, we also included the regional time constants into the analysis (Karagiannidis et al., 2018; Strodthoff et al., 2022). Time constant is a combination of resistance and compliance per definition (Karagiannidis et al., 2018; Strodthoff et al., 2022). In patients with COPD, its value significantly increases, and spatial heterogeneity is observed. As shown in the example in Figure 2, the time constant was high for most of the regions at admission, and after treatment, it was improved in some regions (Figure 2 last two columns on the right). The regional improvement during hospitalization enables the physician to judge the lung status from another angle besides flow limitation during the FVC maneuver. In the near future, we foresee that the EIT measurement can become a standard tool to assess the regional lung function. With such information, the physicians can better understand the lung status to plan individualized treatment programs and adjust the program according to the treatment effect on regional ventilation. With further development of the EIT technology, we hope that one day hardware would be as cheap as a peak flow meter so that all patients with COPD may have an EIT device at home to monitor their regional lung function and guide their daily respiratory exercises.
Although the ability of the EIT-based titration of positive end-expiratory pressure in ICU and perioperative has been validated (Pereira et al., 2018; Girrbach et al., 2020; He et al., 2021; Hsu et al., 2021), EIT is still a relatively novel imaging tool in respiratory medicine. A consensus statement of EIT examination and data analysis was published in 2017, where the measurement procedures were well-defined. However, for the attending physicians who learn to use EIT for the first time, the application of the electrode belt, patient management, etc. requires extra effort and time. Hence, the survey scores regarding these aspects were lower than those of other aspects (e.g., the value of the information; Table 3). The EIT imaging technology, on the other hand, is highly appreciated by the patients since the real-time visual feedback provided by EIT helps understand the ventilation status intuitively. In a previous study, EIT was used to guide chest physiotherapy, and the patients were also satisfied with the visual feedback, which increased the compliance of chest physiotherapy (Li et al., 2023). Therefore, we recommend that EIT be used as a bedside tool when developing patient-centered treatment programs.
We acknowledge several limitations to the present study. The number of participants was small, and due to the lack of prior information, the sample size was not calculated. No thresholds could be determined in terms of treatment effectiveness. Nevertheless, our data demonstrate the improvement of regional lung function heterogeneity within 1 week of hospitalization and serve as prior knowledge for further study development. The limitations to EIT technology are noted as well. Electrode placement (Frerichs et al., 2024) or patient positioning (Yang et al., 2023b) has an influence on the EIT results. Therefore, to minimize the potential sources of bias in EIT measurements, EIT results should be compared only with the same measurement plane and body position. In addition, EIT cannot render the absolute volume, so only the distribution and the relative impedance change and not the absolute ones between two time points are comparable.
Conclusion
EIT-derived regional lung function was highly correlated with the patient-reported outcome assessment. It was feasible to use EIT as an objective bedside evaluation tool for COPD treatment efficacy. The sensitivity of regional lung function provided by EIT was higher than the spirometry global parameters in respect to symptom improvement. Future studies may focus on the impact of EIT monitoring on the patients’ clinical outcomes.
Data availability statement
The original contributions presented in the study are included in the article/Supplementary material; further inquiries can be directed to the corresponding authors.
Ethics statement
The studies involving humans were approved by the Ethics Committee of the Fourth Military Medical University (KY20224101-1). The studies were conducted in accordance with the local legislation and institutional requirements. The participants provided their written informed consent to participate in this study. Written informed consent was obtained from the individual(s) for the publication of any potentially identifiable images or data included in this article.
Author contributions
LY: conceptualization, data curation, formal analysis, funding acquisition, and writing–original draft. ZG: data curation, investigation, methodology, and writing–original draft. XC: writing–review and editing. SS: data curation, resources, and writing–review and editing. CW: data curation, investigation, and writing–review and editing. HW: methodology and writing–review and editing. JD: data curation and writing–review and editing. YL: data curation and writing–review and editing. YQ: methodology and writing–review and editing. MD: conceptualization, data curation, investigation, and writing–review and editing. WG: data curation and writing–review and editing. BZ: visualization, writing–original draft, and writing–review and editing. KZ: resources and writing–review and editing. ZZ: Investigation and writing–original draft.
Funding
The author(s) declare that financial support was received for the research, authorship, and/or publication of this article. The study was funded by a grant from the Natural Science Foundation of Shaanxi Province (2023-YBSF-130).
Conflict of interest
The authors declare that the research was conducted in the absence of any commercial or financial relationships that could be construed as a potential conflict of interest.
The author(s) declared that they were an editorial board member of Frontiers, at the time of submission. This had no impact on the peer review process and the final decision.
Publisher’s note
All claims expressed in this article are solely those of the authors and do not necessarily represent those of their affiliated organizations, or those of the publisher, the editors, and the reviewers. Any product that may be evaluated in this article, or claim that may be made by its manufacturer, is not guaranteed or endorsed by the publisher.
References
Adler A., Arnold J. H., Bayford R., Borsic A., Brown B., Dixon P., et al. (2009). GREIT: a unified approach to 2D linear EIT reconstruction of lung images. Physiol. Meas. 30 (6), S35–S55. doi:10.1088/0967-3334/30/6/S03
Afroz N., Gutzwiller F. S., Mackay A. J., Naujoks C., Patalano F., Kostikas K. (2020). Patient-reported outcomes (PROs) in COPD clinical trials: trends and gaps. Int. J. Chron. Obstruct Pulmon Dis. 15, 1789–1800. doi:10.2147/COPD.S235845
Agustí A., Melén E., DeMeo D. L., Breyer-Kohansal R., Faner R. (2022). Pathogenesis of chronic obstructive pulmonary disease: understanding the contributions of gene-environment interactions across the lifespan. Lancet Respir. Med. 10 (5), 512–524. doi:10.1016/S2213-2600(21)00555-5
Cheng S. L., Lin C. H., Wang C. C., Chan M. C., Hsu J. Y., Hang L. W., et al. (2019). Comparison between COPD Assessment Test (CAT) and modified Medical Research Council (mMRC) dyspnea scores for evaluation of clinical symptoms, comorbidities and medical resources utilization in COPD patients. J. Formos. Med. Assoc. Taiwan Yi Zhi 118, 429–435. 1 Pt 3. doi:10.1016/j.jfma.2018.06.018
de Castro Martins T., Sato A. K., de Moura F. S., de Camargo E., Silva O. L., Santos T. B. R., et al. (2019). A review of electrical impedance tomography in lung applications: theory and algorithms for absolute images. Annu. Rev. Control 48, 442–471. doi:10.1016/j.arcontrol.2019.05.002
Ding B., Judge D., Small M., Bent-Ennakhil N., Siddiqui S. (2018). Functional performance in patients with COPD: association with treatment regimen, GOLD group, lung function, and symptom burden in a cross-sectional study. Int. J. Chron. Obstruct Pulmon Dis. 13, 2785–2796. doi:10.2147/COPD.S170391
Frerichs I., Amato M. B. P., van Kaam A. H., Tingay D. G., Zhao Z., Grychtol B., et al. (2017). Chest electrical impedance tomography examination, data analysis, terminology, clinical use and recommendations: consensus statement of the TRanslational EIT developmeNt stuDy group. Thorax 72 (1), 83–93. doi:10.1136/thoraxjnl-2016-208357
Frerichs I., Hinz J., Herrmann P., Weisser G., Hahn G., Dudykevych T., et al. (2002). Detection of local lung air content by electrical impedance tomography compared with electron beam CT. J. Appl. Physiol. 93 (2), 660–666. doi:10.1152/japplphysiol.00081.2002
Frerichs I., Lasarow L., Strodthoff C., Vogt B., Zhao Z., Weiler N. (2021). Spatial ventilation inhomogeneity determined by electrical impedance tomography in patients with chronic obstructive lung disease. Front. Physiol. 12, 762791. doi:10.3389/fphys.2021.762791
Frerichs I., Vogt B., Deuss K., Hennig V., Schädler D., Händel C. (2024). Distribution of regional lung function in upright healthy subjects determined by electrical impedance tomography in two chest examination planes. Physiol. Meas. 45 (1), 015001. doi:10.1088/1361-6579/ad15ac
Frerichs I., Zhao Z., Becher T., Zabel P., Weiler N., Vogt B. (2016). Regional lung function determined by electrical impedance tomography during bronchodilator reversibility testing in patients with asthma. Physiol. Meas. 37 (6), 698–712. doi:10.1088/0967-3334/37/6/698
Girrbach F., Petroff D., Schulz S., Hempel G., Lange M., Klotz C., et al. (2020). Individualised positive end-expiratory pressure guided by electrical impedance tomography for robot-assisted laparoscopic radical prostatectomy: a prospective, randomised controlled clinical trial. Br. J. Anaesth. 125 (3), 373–382. doi:10.1016/j.bja.2020.05.041
Global Initiative for Chronic Obstructive Lung Disease (2023). Global initiative for chronic obstructive lung disease - GOLD GOLD report. Available from: https://goldcopd.org/2023-gold-report-2/(Accessed August 25, 2023).
Graham B. L., Steenbruggen I., Miller M. R., Barjaktarevic I. Z., Cooper B. G., Hall G. L., et al. (2019). Standardization of spirometry 2019 update. An official American thoracic society and European respiratory society technical statement. Am. J. Respir. Crit. Care Med. 200 (8), e70–e88. doi:10.1164/rccm.201908-1590ST
He H., Chi Y., Yang Y., Yuan S., Long Y., Zhao P., et al. (2021). Early individualized positive end-expiratory pressure guided by electrical impedance tomography in acute respiratory distress syndrome: a randomized controlled clinical trial. Crit. Care 25 (1), 230. doi:10.1186/s13054-021-03645-y
Hinz J., Neumann P., Dudykevych T., Andersson L. G., Wrigge H., Burchardi H., et al. (2003). Regional ventilation by electrical impedance tomography: a comparison with ventilation scintigraphy in pigs. Chest 124 (1), 314–322. doi:10.1378/chest.124.1.314
Hsu H. J., Chang H. T., Zhao Z., Wang P. H., Zhang J. H., Chen Y. S., et al. (2021). Positive end-expiratory pressure titration with electrical impedance tomography and pressure-volume curve: a randomized trial in moderate to severe ARDS. Physiol. Meas. 42 (1), 014002. doi:10.1088/1361-6579/abd679
Jiang H. Y., Li Q., Yu X., Zhang C. X., Li Y., Niu G. Y., et al. (2021). Ventilation improvement after pneumonia treatment evaluated with electrical impedance tomography: an observational study. Physiol. Meas. 42 (10), 104001. doi:10.1088/1361-6579/abffbf
Karagiannidis C., Waldmann A. D., Róka P. L., Schreiber T., Strassmann S., Windisch W., et al. (2018). Regional expiratory time constants in severe respiratory failure estimated by electrical impedance tomography: a feasibility study. Crit. Care 22 (1), 221. doi:10.1186/s13054-018-2137-3
Krauss E., van der Beck D., Schmalz I., Wilhelm J., Tello S., Dartsch R. C., et al. (2021). Evaluation of regional pulmonary ventilation in spontaneously breathing patients with idiopathic pulmonary fibrosis (IPF) employing electrical impedance tomography (EIT): a pilot study from the European IPF registry (eurIPFreg). J. Clin. Med. 10 (2), 192. doi:10.3390/jcm10020192
Li Q., Li Y., Niu G., Li M., Deng J., Möller K., et al. (2023). Chest physiotherapy guided by electrical impedance tomography in high-dependency unit patients with pulmonary diseases: an introduction of methodology and feasibility. Crit. Care 27 (1), 24. doi:10.1186/s13054-023-04308-w
Marquis F., Coulombe N., Costa R., Gagnon H., Guardo R., Skrobik Y. (2006). Electrical impedance tomography’s correlation to lung volume is not influenced by anthropometric parameters. J. Clin. Monit. Comput. 20 (3), 201–207. doi:10.1007/s10877-006-9021-4
Milne S., Nguyen C., Slattery A., Duncan J., Thamrin C., King G. (2017). Electrical impedance tomography demonstrates temporal ventilation heterogeneity in COPD. Chest 152 (4), A974. doi:10.1016/j.chest.2017.08.1009
NCBI (2023). Care of the hospitalized patient with acute exacerbation of COPD - NCBI bookshelf. Available from: https://www.ncbi.nlm.nih.gov/books/NBK582288/(Accessed November 29, 2023).
Ngo C., Dippel F., Tenbrock K., Leonhardt S., Lehmann S. (2018). Flow-volume loops measured with electrical impedance tomography in pediatric patients with asthma. Pediatr. Pulmonol. 53 (5), 636–644. doi:10.1002/ppul.23962
Pereira S. M., Tucci M. R., Morais C. C. A., Simões C. M., Tonelotto B. F. F., Pompeo M. S., et al. (2018). Individual positive end-expiratory pressure settings optimize intraoperative mechanical ventilation and reduce postoperative atelectasis. Anesthesiology 129 (6), 1070–1081. doi:10.1097/ALN.0000000000002435
Rhee C. K., Kim J. W., Hwang Y. I., Lee J. H., Jung K. S., Lee M. G., et al. (2015). Discrepancies between modified Medical Research Council dyspnea score and COPD assessment test score in patients with COPD. Int. J. Chron. Obstruct Pulmon Dis. 10, 1623–1631. doi:10.2147/COPD.S87147
Strodthoff C., Kähkönen T., Bayford R. H., Becher T., Frerichs I., Kallio M. (2022). Bronchodilator effect on regional lung function in pediatric viral lower respiratory tract infections. Physiol. Meas. 43 (10), 104001. doi:10.1088/1361-6579/ac9450
Varmaghani M., Dehghani M., Heidari E., Sharifi F., Moghaddam S. S., Farzadfar F. (2019). Global prevalence of chronic obstructive pulmonary disease: systematic review and meta-analysis. East Mediterr. Health J. Rev. Sante Mediterr. Orient Al-Majallah Al-Sihhiyah Li-Sharq Al-Mutawassit 25 (1), 47–57. doi:10.26719/emhj.18.014
Vogt B., Zhao Z., Zabel P., Weiler N., Frerichs I. (2016). Regional lung response to bronchodilator reversibility testing determined by electrical impedance tomography in chronic obstructive pulmonary disease. Am. J. Physiol. Lung Cell Mol. Physiol. 311 (1), L8-L19–L19. doi:10.1152/ajplung.00463.2015
Wang C., Xu J., Yang L., Xu Y., Zhang X., Bai C., et al. (2018). Prevalence and risk factors of chronic obstructive pulmonary disease in China (the China Pulmonary Health [CPH] study): a national cross-sectional study. Lancet Lond Engl. 391 (10131), 1706–1717. doi:10.1016/S0140-6736(18)30841-9
WHO (World Health Organization) (2020). The top 10 causes of death - factsheet. Available from: https://www.who.int/news-room/fact-sheets/detail/the-top-10-causes-of-death (Accessed November 8, 2023).
Yang L., Gao Z., Cao X., Fu F., Möller K., Frerichs I., et al. (2023b). The influence of gravity on electrical impedance tomography measurements during upper body position change. Heliyon 9 (5), e15910. doi:10.1016/j.heliyon.2023.e15910
Yang L., Gao Z., Wang C., Wang H., Dai J., Liu Y., et al. (2024). Evaluation of adjacent and opposite current injection patterns for a wearable chest electrical impedance tomography system. Physiol. Meas. 45 (2), 025004. doi:10.1088/1361-6579/ad2215
Yang L., Zhao K., Gao Z., Fu F., Wang H., Wang C., et al. (2023a). The influence of breathing exercises on regional ventilation in healthy and patients with chronic obstructive pulmonary disease. COPD 20 (1), 248–255. doi:10.1080/15412555.2023.2234992
Zhao Z., Chang M. Y., Frerichs I., Zhang J. H., Chang H. T., Gow C. H., et al. (2020). Regional air trapping in acute exacerbation of obstructive lung diseases measured with electrical impedance tomography: a feasibility study. Minerva Anestesiol. 86 (2), 172–180. doi:10.23736/S0375-9393.19.13732-7
Zhao Z., Möller K., Steinmann D., Frerichs I., Guttmann J. (2009). Evaluation of an electrical impedance tomography-based Global Inhomogeneity Index for pulmonary ventilation distribution. Intensive Care Med. 35 (11), 1900–1906. doi:10.1007/s00134-009-1589-y
Zhao Z., Müller-Lisse U., Frerichs I., Fischer R., Möller K. (2013). Regional airway obstruction in cystic fibrosis determined by electrical impedance tomography in comparison with high resolution CT. Physiol. Meas. 34 (11), N107–N114. doi:10.1088/0967-3334/34/11/N107
Keywords: acute exacerbation of chronic obstructive pulmonary disease, treatment efficacy, bedside assessment, lung function, regional ventilation distribution
Citation: Yang L, Gao Z, Cao X, Sun S, Wang C, Wang H, Dai J, Liu Y, Qin Y, Dai M, Guo W, Zhang B, Zhao K and Zhao Z (2024) Electrical impedance tomography as a bedside assessment tool for COPD treatment during hospitalization. Front. Physiol. 15:1352391. doi: 10.3389/fphys.2024.1352391
Received: 08 December 2023; Accepted: 06 March 2024;
Published: 18 March 2024.
Edited by:
Bo Sun, Xi’an University of Technology, ChinaReviewed by:
Jiafeng Yao, Nanjing University of Aeronautics and Astronautics, ChinaRidwan Wicaksono, Gadjah Mada University, Indonesia
Copyright © 2024 Yang, Gao, Cao, Sun, Wang, Wang, Dai, Liu, Qin, Dai, Guo, Zhang, Zhao and Zhao. This is an open-access article distributed under the terms of the Creative Commons Attribution License (CC BY). The use, distribution or reproduction in other forums is permitted, provided the original author(s) and the copyright owner(s) are credited and that the original publication in this journal is cited, in accordance with accepted academic practice. No use, distribution or reproduction is permitted which does not comply with these terms.
*Correspondence: Wei Guo, 465549513@qq.com; Binghua Zhang, 13572559968@qq.com; Ke Zhao, 110686978@qq.com
†These authors have contributed equally to this work